


Introduction
Theoretical studies on the dynamics of insect host–parasitoid interaction with distinct generations, as usually occurs in temperate regions, were pioneered by the classical Nicholson & Bailey (Reference Nicholson and Bailey1935) model framed in difference equations. The work by Holling (Reference Holling1959) and Watt (Reference Watt1959), who presented different functional responses of predator/parasitoid as an alternative to the simple one proposed by Nicholson & Bailey (Reference Nicholson and Bailey1935) was a turning point for theoretical studies on predation and parasitism (Hassell, Reference Hassell1978, Reference Hassell2000). In host–parasitoid interactions, the functional response is defined as the change in number of hosts parasitized by an individual female parasitoid in relation to a change in host density (Solomon, Reference Solomon1949; Cave & Gaylor, Reference Cave and Gaylor1989).The functional and numerical (the per capita parasitoid population growth rate) responses provide a complete description of parasitoid population dynamics (Abrams & Ginzburg, Reference Abrams and Ginzburg2000).
In a functional response, the attack rate represents the mean searching and attacking efficiency of a parasitoid (Abrams & Ginzburg, Reference Abrams and Ginzburg2000). When hosts outnumber the parasitoid, the functional response can become saturated: while the number of available hosts increases the number of parasitized hosts remains constant, so the proportion of parasitized hosts decreases. The simplest cause of a saturated functional response is an increased handling time which reduces time for searching for new hosts. Therefore, above a given host density, the number of attacks cannot increase with the time available (Hassell, Reference Hassell2000). Another cause of saturation is egg-limitation, where the number of eggs the females carry is lower than the number of available hosts.
Parasitoids searching for hosts can directly affect each other's efficiency in a parasitoid-dependent functional response (Abrams & Ginzburg, Reference Abrams and Ginzburg2000). In this case, the attack rate is reduced by indirect or mutual interference between parasitoids, even at high host density (Hassell, Reference Hassell1971; Beddington, Reference Beddington1975). In models that do not consider spatial heterogeneity or host density dependence, mutual interference between parasitoids has been shown to be a potential stabilizing mechanism (Hassell & Varley Reference Hassell and Varley1969; Beddington Reference Beddington1975; DeAngelis et al., Reference DeAngelis, Goldstein and O'Neill1975).
In a model proposed by Hassell & Varley (Reference Hassell and Varley1969), the ‘mutual interference’ parameter, m, combines indirect and behavioral mutual interference in a simple way as a scaling exponent on the number of parasitoids. A special and controversial case of parasitoid dependence proposed by Arditi & Ginzburg (Reference Arditi and Ginzburg1989) is called ‘ratio dependence’ (the ratio between parasitoid density and host density, and not just the absolute host density) (see Abrams & Ginzburg, Reference Abrams and Ginzburg2000; Ginzburg & Jensen, Reference Ginzburg and Jensen2008; and references therein). DeLong & Vasseur (Reference DeLong and Vasseur2011) analyzed published data and using unbiased estimates of mutual interference showed that it was mostly intermediate in magnitude with a mean m value of −0.8 between the extreme values of m=0 (prey dependence or no interference) to m=−1 (ratio dependence). Arditi & Akçakaya (Reference Arditi and Akçakaya1990) reanalyzed data of functional response experiments found in the literature where host (or prey) and parasitoid (or predator) abundances were varied, and the functional response was measured as a function of both host and parasitoid abundances. Arditi & Akçakaya (Reference Arditi and Akçakaya1990) incorporated the ‘disc equation’ model (Holling, Reference Holling1959) to the Hassell–Varley model (Hassell & Varley, Reference Hassell and Varley1969) and obtained the Holling–Hassell–Varley model, a flexible model that fitted the data well, varying from host dependence and no parasitoid interference to ratio-dependence (Arditi & Akçakaya, Reference Arditi and Akçakaya1990).
Regarding the numerical response, most models of host–parasitoid interaction assume that the parasitoid population rate of increase is a linear function of the number of parasitized hosts and pre-adult parasitoid survivorship (Hassell, Reference Hassell1978, Reference Hassell2000). However, the interaction among female parasitoids can alter progeny sex allocation, which directly affects the numerical response (Hassell et al., Reference Hassell, Waage and May1983; Fox et al., Reference Fox, Letourneau, Eisenbach and Van Nouhuys1990).
Trissolcus basalis (Wollaston) (Hymenoptera: Platygastridae) is a solitary weakly sinovigenyc (Jervis et al., Reference Jervis, Heimpel, Ferns, Harvey and Kidd2001) endoparasitoid of pentatomid stink bugs’ eggs, which has been intensively studied in the laboratory (Wilson, Reference Wilson1961; Powell & Shepard, Reference Powell and Shepard1982; Corrêa-Ferreira, Reference Corrêa-Ferreira1993; Field et al., Reference Field, Keller and Calbert1997, Reference Field, Keller and Austin1998). There is strong evidence for a predicted continuum in ovigeny index among parasitoid wasps, in which species can range from pro-ovigenic (ovigeny index=1) (all eggs are mature at emergence), through weakly synovigenic (most eggs are mature at emergence) to extremely synovigenic (ovigeny index=0) (no eggs are mature at emergence) (Jervis & Copland, Reference Jervis, Copland, Jervis and Kidd1996; Quicke, Reference Quicke1997). Adult T. basalis females are able to mate and lay eggs the same day of emergence (Field, Reference Field1998), and total fecundity varies with different strains, ranging from 88.9 (Powell & Shepard, Reference Powell and Shepard1982) to 184.2 eggs per female (Catalán & Verdú Gallardo, Reference Catalán and Verdú Gallardo2005). Once a host egg mass has been located by a T. basalis female, host examination and host parasitization are time-consuming activities, and vary widely (Meats & Castillo Pando, Reference Meats and Castillo Pando2002). Host examination involves ‘walk-antennate host’ and a more careful inspection of individual host eggs or ‘turn’, and parasitization proceeds following a sequence of behaviors termed ‘head pump’ and ‘rock’ (Field et al., Reference Field, Keller and Calbert1997, Reference Field, Keller and Austin1998). ‘Walk-antennate host’ involves walking over the surface of the egg mass, antennae sweeping generally over the surface of the egg mass and palpating the eggs. ‘Turn’ involves arrestment on the top of a particular egg turning in a circular path on top of the egg, with antennae drumming the sides of it. ‘Head pump’ is a repeated pumping movement of the head back and forth with simultaneous flexing of the forelegs, mesosoma, and wings, alternating with slight forward and upward thrusting of the whole body. Finally, ‘rock’ involves vibrations of the entire body slightly and the metasoma simultaneously rocking forwards and backwards causing the ovipositor to slide partially in and out of the host egg. Agonistic encounters may take place between female parasitoids foraging simultaneously in the same host (Corrêa-Ferreira, Reference Corrêa-Ferreira1993; Meats & Castillo Pando, Reference Meats and Castillo Pando2002) as well as ‘pre-emptive’ behavior by solitary females in order to prevent conspecific superparasitism (Field, Reference Field1998; Field & Calbert, Reference Field and Calbert1998). Meats & Castillo Pando (Reference Meats and Castillo Pando2000) exposed Nezara viridula egg masses of the same size (23 eggs each, that were considered as an ‘individual host’) to T. basalis adult females during 4 h varying the number of egg masses and parasitoids as well as the egg masses to parasitoid ratio in three experimental arena sizes. From direct estimations of the mean attack rate and handling time, they found that the proportion of parasitized egg masses could be well described both by the Holling (Reference Holling1959) model and by the ratio-dependent model (Arditi & Ginzburg, Reference Arditi and Ginzburg1989).
Regarding the progeny sex allocation, mating typically occurs between siblings and the brood sex ratio of T. basalis females, as in most platygastrids, is strongly female-biased (Corrêa-Ferreira, Reference Corrêa-Ferreira1993). However, if a T. basalis female attacks an already parasitized host egg mass, it responds to the presence and traces of conspecific females (Rosi et al., Reference Rosi, Isidoro, Colazza and Bin2001) by increasing the proportion of males of their offspring as predicted by the Local Mate Competition theory (Hamilton, Reference Hamilton1967).
T. basalis has been used as a biological control agent of its main host, the stink bug Nezara viridula (L.) (Hemiptera: Pentatomidae) in many countries (Corrêa-Ferreira, Reference Corrêa-Ferreira1993 and references therein), but estimation of the functional and numerical responses of T. basalis in the field are lacking. In the present work, we present estimations of both responses in the field. The Holling–Hassell–Varley model allowed us to estimate the parameters of the functional response of T. basalis and predict the number of host eggs parasitized per unit area and to compare it with observed data. We also estimated mean field pre-adult survivorship and the parasitoid sex ratio as a function of parasitoid field density. We hypothesized that the mutual interference between T. basalis will be intermediate, and as the field parasitoid density increases, the parasitoid sex ratio will be less favorable to the females.
Materials and methods
Study areas and sampling methods
The study areas were located in Berisso and La Plata counties, Argentina (34°35′S, 57°17′W), and consisted of a weedy plot of 450 m2 (dominated by Ricinus communis L., Brassica sp., and Raphanus sp.) and an adjacent experimental soybean plot (2 ha), planted in mid November.
In the weedy area, during two successive activity periods (an activity period lasts 25 weeks, from mid-October to mid-April and represents the number of weeks the adults of N. viridula feed and oviposit in the field) at approximately weekly intervals, the density of N. viridula eggs (number of eggs per m2), H (t), the proportion of parasitized N. viridula eggs', PH(t), as well as the density of T. basalis adults (expressed as the total number of adults/trap), P (t), in the tth week were estimated simultaneously. In the first activity period, H (t) was estimated by two methods: (i) an indirect method that consisted in multiplying the weekly egg production of an average adult N. viridula female by the number of females alive in the field; and (ii) the direct counting in the field.
For the indirect method, the weekly egg production per female was estimated as follows: 100 adult bug couples were collected preferentially from the soybean plot at the beginning of the generation and the number of eggs, the number of egg masses, and the mean number of living adult females were recorded. In order to have a representative sample of the conditions of the field population, the 100 pairs of adult hosts were substituted by others taken from the field each time a 15–20% increase in N. viridula parasitism by T richopoda giacomellii (Blanchard) (Diptera: Tachinidae) was registered in the field. This parasitoid attacks older nymphs and young adults and its effect is a reduction in host fecundity without affecting host egg fertility (Liljesthröm, Reference Liljesthröm1983; Liljesthröm & Rabinovich, Reference Liljesthröm and Rabinovich2004). Adult N. viridula density in the field was estimated by counting the total number in 30 1 m2-square units distributed at random in the area (for more details see Liljesthröm & Bernstein, Reference Liljesthröm and Bernstein1990).
For the direct counting of eggs in the field, 30 square units (0.3 m2 each) were randomly distributed and the total number of egg masses and the number of eggs/egg mass were recorded. Estimations with both methods were not significantly different: 10.5 eggs per m2 (direct method) and 9.23 eggs per m2 (indirect method) (t (21 df)=0.426, P=0.675, two-tailed test), so in the following activity periods only the indirect method was used being less time consuming.
The density of T. basalis, P (t), was estimated using 6–10 yellow cylindrical water traps 0.5 cm in diameter and 10 cm deep, uniformly spaced (about 10 m) along one main diagonal of the weedy area. The traps were checked every 2–3 days and all insects were removed and collected in individual vials. Sex of adult T. basalis was determined using a stereomicroscope.
The proportion of parasitized N. viridula eggs, PH(t), was estimated as follows: 20–25 host egg masses (24–48 h old) obtained in the laboratory were individually glued on pieces of paper (Meats & Castillo Pando, Reference Meats and Castillo Pando2002), and at approximately weekly intervals were carried to the study area (n=510 egg masses). They were fixed at random on the underside of leaves of Ipomea purpurea (L.) Roth (Convolvulaceae) and Malva sp. (Malvaceae), plant species where N. viridula natural oviposition was observed to occur. Egg masses were left for 5 days (the average hatching time) and taken back to the laboratory where they were kept in test tubes at 25±1 °C and 70±10% RH until host and/or parasitoids emerged. Based on the total number of eggs per egg mass we determined fate of eggs in three categories: (i) hyaline and empty eggs; (ii) eggs parasitized by T. basalis (eggs with pupa or adult T. basalis, or yellowish eggs with a closed and concave operculum without an observable structure under a stereomicroscope, which were assumed to be parasitized host eggs in which the parasitoid immature probably died); and (iii) unparasitized eggs from which N. viridula nymphs emerged. PH(t) was then calculated as the total number of N. viridula eggs parasitized by T. basalis divided by the total number of N. viridula available eggs. The parasitoids were taxonomically identified by Marta Loiácono from the Department of Entomology of the La Plata Museum of Natural Sciences and the egg masses parasitized by a platygastrid other than T. basalis were eliminated from the analysis (n=2; 0.6% of all cases).
Laboratory experiments
The host N. viridula was reared at 25±1 °C, 75% RH and L-D photoperiod of 14–10 h, in wired cages (20×20×30 cm), and fed on Phaseolus vulgaris L. (Fabales: Fabaceae) beans. Cages were daily checked and all the egg masses removed. The parasitoid T. basalis was maintained in test tubes covered with cotton and on a mix of 30% honey–70% water, under the same conditions as N. viridula. Some host egg masses were parasitized in order to maintain the parasitoid's colony.
To estimate average pre-imaginal parasitoid survival, LPS, and the sex ratio of adult parasitoids emerged from a non-superparasitized host egg mass, LSR, one host egg mass with at least 48 h of development, was put in a Petri dish with a copulated T. basalis adult female (6–8 days old) and left for 24 h (n=18); after that period each egg mass was put in a test tube covered with cotton and maintained in the same rearing conditions until adult parasitoid emergence.
Functional response of T. basalis and proportion of host eggs parasitized in the interval between two successive samplings
How to estimate the coefficients that describe the mutual interference among parasitoids, m, has been a subject of debate. DeLong & Vasseur (Reference DeLong and Vasseur2011) reviewed different methods and found that the one proposed by Arditi & Akçakaya (Reference Arditi and Akçakaya1990) was unbiased and that intermediate values of m were likely to be more common. The mutual interference coefficient among parasitoids is the slope of the linear regression equation between ln(a) as a dependent variable and ln(P) as an independent variable (Hassell & Varley, Reference Hassell and Varley1969; Arditi & Akçakaya, Reference Arditi and Akçakaya1990), where a is the weekly attack rate (also known as the ‘area of discovery’) of a parasitoid and P is the female parasitoid density. The relationship is expected to be a decreasing function (i.e., the slope, m, is negative). The probability that the slope differs from m=0 (pure prey dependence) to m=−1 (ratio dependence) was tested by the t test. Following previous work (Hassell & Varley, Reference Hassell and Varley1969; Arditi & Akçacaya, Reference Arditi and Akçakaya1990) in the Holling–Hassell–Varley model, we calculated the proportion of N. viridula egg parasitism, using m with a minus sign (−m), so m represents positive values. Following Arditi & Akçakaya (Reference Arditi and Akçakaya1990), the weekly attack rate in the field a (t) during the tth interval was estimated starting with the random parasitism model (Royama, Reference Royama1971). It is a deterministic, spatially homogeneous, discrete time model that does not consider any density-dependent process and incorporates the Holling (Reference Holling1959) disc equation: DPH(t)=H (t)(1−exp[−a (t)P (t)T + a (t)Th DPH(t)], where T is the weekly time interval, P (t) is the parasitoid density, Th is the mean handling time per host egg attacked, and DPH(t) is the density of parasitized host eggs. If S (t) represents the proportion of host eggs surviving parasitism, and S (t)=[H (t)−DPH(t)]/H (t), it follows that: a (t)=ln(S (t))/(−P (t)T+Th DPH(t)).
The density of hosts, H (t), the density of parasitoids, P (t), and the proportion of parasitized host eggs, PH(t), were estimated directly and independently in the field (see above), and S (t) and DPH(t) were estimated, as S (t)=1−PH(t), and DPH(t)=H (t)PH(t). The time interval (T) between two successive samplings was one week, and its value was further modified by the coefficient 0.7143=5/7, which represents the proportion of the time interval between two successive samplings that a host egg mass is exposed to parasitism (see above).
The handling time value of Th=0.1743 h per egg was estimated by Laumann et al. (Reference Laumann, Moraes, Pareja, Alarcao, Botelho, Maia, Leonardecz and Borges2008) for T. basalis parasitizing individual eggs of Euchistus heros (Fabricius) (Hemiptera: Pentatomidae), although in this work we expressed it in units of weeks instead of in hours as in the original work, resulting in a handling time of Th=0.00104 w per egg). The linear regression equation between ln(a (t)) as the dependent variable on ln(P (t)) as the independent one allows calculating of the weekly attack rate without interference, Q, that corresponds to one parasitoid per unit area: Q=eb, where b represents the intercept of the linear regression equation (Hassell & Varley, Reference Hassell and Varley1969). The Holling–Hassell–Varley model (Arditi & Akçakaya, Reference Arditi and Akçakaya1990) allows the calculation of the proportion of N. viridula egg parasitism in the tth time interval, CPH(t), as: CPH(t)=1−exp[−(a.P (t)(1−m)/(1+a·Th·N (t)P (t)−m)], where N (t) and P (t) represent the number of N. viridula eggs and the number of adult parasitoid's per unit area in the tth interval, respectively.
To compare the estimated parameter values, we also calculated model parameters (a and m), while keeping Th=0.00104 constant and using iterative techniques that minimize the differences between calculated and observed data using: (i) the Solver tool from Microsoft Excel® software and (ii) the online curve fitting web site: http://zunzun.com//. We expected the weekly attack rate, a, to be lower or equal to Q, and the coefficient m not to differ significantly between estimating methods.
Estimation methods
In functional response experiments, the number of parasitoids and hosts are referred to the same area so density can be expressed in the same units. We converted the number of T. basalis adults/trap collected in the tth interval, P (t), to the same units as the N. viridula egg density (number of individuals per m2) as cP (t), with c=[1/n ∑t PC(t)]/[1/n ∑tP (t)], where n represents the number of samples in both activity periods and PC(t) the calculated number of T. basalis adults per m2 that would be present in the tth sampling assuming no emigration or immigration; the parasitoids’ adult weekly survivorship was estimated from laboratory data by Jones & Westcot (Reference Jones and Westcot2002) (fig. 3). We preferred c P (t) over PC(t) because the former provides values of T. basalis density during the first 2–4 weeks of the activity period (mid-spring), while PC(t) owing to the delay of the pre-adult parasitoid development did not provide values of adult parasitoids during those first weeks (additionally, c P (t) could also be considered as the net effect of adult parasitoid mortality and adult emigration and/or emigration). The value PC(t) was calculated weekly as: PC(t)=∑j PC(j, t).S (j), where S (j) represents the survival of adult parasitoids from age j to age j+1 (in weekly units) (data from Jones & Westcot, Reference Jones and Westcot2002) and PC(j, t) represents the total number of T. basalis adults of age j weeks that would be present in the tth sampling. The number of adults that would emerge in the tth interval was calculated as: PC(1, t)=H (t)PH(t)FPS, where FPS represents the mean T. basalis pre-adult survivorship in the field (Liljesthröm & Cameán, Reference Liljesthröm and Cameán1992 and this work). Pre-adult parasitoid development, D (t), was calculated as: D (t)=∑V[Temp(t)−U], where V (slope of the linear relationship between the rate of development for constant temperature, expressed in units of degree−1. days−1) represents the mean weekly pre-adult developmental rate at a given temperature, Temp(t), the mean field temperature in the study area during the tth interval, and U represents the threshold temperature for development (pre-adult development is zero below the threshold temperature) expressed in degree−1. days−1. The values of V were estimated as the inverse of the duration of the parasitoid's pre-adult development, obtained from data by La Porta & Crouzel (Reference La Porta and Crouzel1984), Corrêa-Ferreira & Moscardi (Reference Corrêa-Ferreira and Moscardi1995), and Catalán & Verdú Gallardo (Reference Catalán and Verdú Gallardo2005). The threshold temperature, U, was calculated following the method proposed by Arnold (Reference Arnold1959), and resulted in U=0.0626/0.0057=10.982, where 0.0626 and 0.0057 are the intercept and the slope of the regression equation, respectively (Y=0.0057X−0.0626, (R 2=0.98), obtained when V was plotted against different constant temperatures). Development was accumulated until the pre-adult development time was completed, and the emergence of the new adult parasitoids of age j=1, was assigned t weeks later if D (t)=1, or if 1−D (t)<D (t+1). The calculations were performed with a program developed in FORTRAN language. Laboratory experiments lasted only a few hours while the data in our field study were estimated at weekly intervals; the handling time estimated in the laboratory was the only parameter that could be considered the same as the one from the field because the characteristics of the ‘micro’ habitat would not be so different, independently from the ‘macro’ habitat. The direct count of adult parasitoids (a relative density) was correlated with the calculated number of adult parasitoids per m2 (an absolute density): in the first activity period the number of adults/trap was transformed by the square root to reach normality (Shapiro–Wilk test, W=0.915; P=0.08), while in the second activity period original data reached the normal distribution and transformation was not necessary.
The calculated proportion of the N. viridula eggs’ parasitism in the tth time interval, CPH(t), using the number of T. basalis adult females per m2, c P (t) in the Holling–Hassell–Varley model allowed us to calculate the number of the parasitized N. viridula eggs per m2 as: H (t)CPH(t), which was compared with the observed number of parasitized N. viridula eggs per m2, DPH(t) by means of the G test, G=2 ∑DPH(t)×ln[DPH(t)/(H (t)CPH(t))].
We made a parameter sensitivity analysis where parameters (one at a time) were changed by 20% of their nominal value; these parameters were: the parasitoid density (P), the attack rate (a), the mutual interference (m), and the handling time (Th). The output variable used for sensitivity analysis was the mean proportion host eggs parasitized (CPH) calculated for the observed T. basalis and host egg densities (n=46); the sensitivity index used was S=[(Ra−Tn)/Rn]/[(Pa−Pn)/P], where Ra and Rn represent the altered and nominal responses of the model and Pa and Pn the altered and nominal parameter values (Haefner, Reference Haefner1996).
Pre-imaginal survival and sex ratio of emerged T. basalis adults
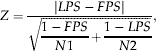
Average field pre-imaginal parasitoid survival, FPS, was estimated from the parasitized host egg masses that were exposed weekly in the field (see above), and was calculated for each egg mass as the number of emerged adult parasitoids divided by the number of parasitized eggs. We compared FPS with the mean pre-imaginal parasitoid survival value estimated in the laboratory, LPS, by the normal deviate, Z
 $$\eqalign{& Z = \displaystyle{{\left| {LPS - \left. {FPS} \right|} \right.} \over {\sqrt {\displaystyle{{1 - FPS} \over {N1}} + \displaystyle{{1 - LPS} \over {N2}}}}}, &} $$
where N1 and N2 represent the number of host eggs from the field and the laboratory, respectively (Snedecor & Cochran, Reference Snedecor and Cochran1980).
The adult sex ratio is one component of the numerical response which may change with population density and it was estimated from the ratio between the field number of trapped females divided by the number of trapped females plus the number of trapped males. During the tth interval the proportion of trapped T. basalis adult females, FPF(t), was plotted against the corresponding total parasitoid density, P (t). If, as expected, superparasitism increases with an increase of the parasitoid population density, FPF(t) and P (t) should be significantly and negatively correlated. We also compared by the Z test, the mean proportion of adult females in the progeny from laboratory data, LPF, with the mean proportion of adult females from field on both activity periods. We expected both estimates not to differ significantly.
Results
Host and parasitoid densities in the field
The number of N. viridula eggs per m2, H (t), the number of T. basalis adults/trap, P (t), and the number of T. basalis adults per m2, c P (t), at weekly intervals are shown in figs 1a–b. In both activity periods, host oviposition by N. viridula was an almost continuous process, with three clear peaks in the second activity period (weeks 2–3, 11–14, and 21–22) (fig. 1b), while in the first activity period only the first two of those peaks were detected, because sampling was stopped at the 17th week (fig. 1a). The direct count of adult parasitoids, expressed as number of T. basalis adults/trap (a relative density), was significantly and positively correlated with the calculated number of adult parasitoids per m2 (an absolute density): R=0.73; t (16 df)=4.33; P<0.001 (for the first activity period), and R=0.77; t (16)=4.83; P<0.001 (for the second activity period) (figs 1a and b). The mean value of T. basalis adults per m2 in both activity periods was: 1/n ∑tPC(t)=13.81, and the corresponding mean value of the number of T. basalis adults/trap was: 1/n ∑tP (t)=4.55, and the ratio was: c=2.9 (i.e., traps captured about 1/3 of the actual absolute density of adult T. basalis). From both activity periods we could identify two low peaks in the number of adult parasitoids/trap in weeks 2–3 in the first period (not evident in the second activity period because sampling began by the third week) and in weeks 6–7 of the second period (not evident in the first activity period because T. basalis was not sampled), while the highest peak occurred later, in weeks 14–18, with a clear delay with respect to the host highest peak.
Field densities of N. viridula eggs (eggs per m2) and T. basalis (adults per m2), and number of adults T. basalis per trap, during the first (a) and the second (b) activity periods ( , N. viridula eggs per m2;
 , T. basalis per m2;
 , T. basalis per trap).

Functional response of T. basalis and the proportion of parasitized host eggs
The relationship between the attack rate (as a dependent variable) and parasitoid density (as an independent variable) from field data and expressed in natural logarithms was described by the regression equation Y=−0.5631X+0.0924 (r=−0.738; t (31)=−6.095; P<0.001). The antilogarithm of the ordinate of the equation provided the attack rate, Q, when the number of T. basalis per m2 was approximately one parasitoid adult per unit area: Q=e0.092=1.097 (SE=0.201, n=32), and the interference coefficient m, estimated by the method proposed by Arditi & Akçakaya (Reference Arditi and Akçakaya1990) with fixed ‘handling time’, Th=0.00104 weeks per attacked host egg, was: m=0.5631(SE=0.0924; n=32). The probability of m differing from 0 by chance was <0.001 (t (31)=−0.095) (one-tailed test), while the probability of m differing from 1 by chance was <0.001 (t (319)=−4.730) (one-tailed test). The values for the coefficients obtained by the two methods used were essentially the same: a=0.7669 (SE=0.093) and m=0.5858 (SE=0.066). The value of the interference coefficient, m, showed a low variability regardless of the method employed; the relative difference between the two methods was 3.9%. The relative difference between the values of the attack rate a and Q=1.097 (SE=0.201), estimated by the regression equation was 43.02%; however, the 95% confidence intervals overlapped widely (fig. 2).
Parameter values of the functional response of T. basalis. The attack rate for one parasitoid per unit area (a or Q) and the coefficient of interference (m) calculated from the regression equation (white column), and using the Solver tool from Microsoft Excel® software (black columns) and the website: http://zunzun.com// (dotted columns). Bars indicate 95% confidence intervals.

When the number of parasitized N. viridula eggs per m2, H (t)CPH(t),was calculated using the parameter values a=0.7669 and m=0.5858, the difference with the observed number of parasitized N. viridula eggs per m2, DPH(t) was not statistically significant (G=−43.040, n=32, P>0.05). Similar results were obtained when we used a=0.7669 and the m value estimated from the regression equation (m=0.5631) (fig. 3).
Observed and calculated number of parasitized N. viridula eggs per m2 plotted as a function of host H (t) and parasitoid, P (t), field population densities during the tth time interval. Attack rate, a, and interference coefficient, m, estimated by method proposed by Arditi & Akçakaya (Reference Arditi and Akçakaya1990) with fixed handling time, Th=0.00104 (•, observed; - - - -, estimated from regression equation; ——, estimated with solver and zunzun).

The mean proportion of parasitized host eggs calculated for the observed T. basalis and host egg densities was CPH=0.630. The model was most sensitive to changes in the attack rate (a) and the mutual interference (m). For changes in the attack rate (a), CPH=0.573 and S=0.455 (the nominal value a=0.767 was reduced by 20%) and CPH=0.673 and S=0.338 (the nominal value was increased by 20%). For changes in the mutual interference (m) CPH=0.667 and S=−0.291 (the nominal value m=0.586 was reduced by 20%) and CPH=0.582 and S=−0.384 (the nominal value was increased by 20%). The sensitivity of the parasitoid density was intermediate: CPH=0.607 and S=0.184 (the parasitoid density in the Th-interval, P (t), was reduced by 20%) and CPH=0.562 and S=0.267 (the parasitoid density in the Th-interval, P (t), was increased by 20%), and much less sensitive to the handling time: CPH=0.631 and S=−0.0010 (the nominal value Th=0.00104 was reduced by 20%) and CPH=0.630 and S=−0.0010 (the nominal value was increased by 20%).
Pre-imaginal survivorship of T. basalis and sex ratio of adults
Mean pre-adult survival in the field (FPS=0.566±0.0394, n=72) was significantly lower than mean pre-imaginal survival under laboratory conditions (LPS=0.868±0.029, n=22) where optimal host eggs (<72 h) were offered to one T. basalis adult female (Z=2.610; P<0.002) (fig. 4).
Mean pre-imaginal survivorship and sex ratio (proportion of T. basalis adult females emerged) in the field (black) and in laboratory (dotted). Field proportion of females considered only the emergence of adult parasitoids occurred during the first eight weeks of an activity period, when parasitoid population was low.

During the two activity periods under study the proportion of adult females among the brood obtained in the laboratory without superparasitism was LPF=0.840 (SE=0.0290, n=22), which did not differ statistically from host egg masses that were exposed in the field and then carried back to the laboratory: FPF=0.891 (SE=0.0227, n=150) (Z=0.036; P>0.5) (fig. 4).
There was a significant negative correlation between the proportion of T. basalis adult females and the parasitoid population density (fig. 5). In the first activity period r=−0.394, t (18)=2.147 (P<0.05) and in the second activity period r=−0.529, t (27)=3.99 (P<0.001).
Estimated proportion of trapped adult T. basalis females during the first and second activity periods (●, 1st activity period;  , 2nd activity period).

Discussion
The functional response (Solomon, Reference Solomon1949; Holling, Reference Holling1959) is a key component of models describing interactions between consumers and their resources; they estimate the rate of resource consumption as a function of resource density (Villemereuil & López-Sepulcre, Reference Villemereuil and López-Sepulcre2011). Empirical studies of host–parasitoid interactions usually measure the functional response using single parasitoids in small cages, disregarding everything else other than host dependence (Abrams & Ginzburg, Reference Abrams and Ginzburg2000). By contrast, in the field, parasitoid attack is usually a complex process that depends on the abundance and spatial distribution of hosts (Heads & Lawton, Reference Heads and Lawton1983; Godfray, Reference Godfray1994) and parasitoids (Hassell & Varley, Reference Hassell and Varley1969; Hassell, Reference Hassell2000). In this sense, it has been stated that models should have a flexible form of the functional response that can incorporate predator dependence (Abrams & Ginzburg, Reference Abrams and Ginzburg2000). The Holling–Hassell–Varley model is one of those models (Arditi & Akçakaya, Reference Arditi and Akçakaya1990).
In this study, the density of N. viridula eggs, estimated at weekly intervals during two activity periods and in the same area, has three clear peaks in agreement with Liljesthröm & Cameán (Reference Liljesthröm and Cameán1992), with the second being higher than the other two. Low parasitoid density, mainly during the first few weeks of the first host generation and the last few weeks of the third host generation, could be the consequence of a reduced survivorship of T. basalis, combined with adult parasitoid dispersal. We assume the latter to be a plausible explanation because the third generation of N. viridula adults (in pre-reproductive stage) leaves the feeding/reproducing area in search for hibernating shelters (in our study area the hibernation period lasts approximately 5 months of the colder period of the year). N. viridula individuals leaving hibernation re-colonize the area in the following spring and reproduce, originating the first new generation of eggs (Liljesthröm & Bernstein, Reference Liljesthröm and Bernstein1990; Liljesthröm & Rabinovich, Reference Liljesthröm and Rabinovich2004). T. basalis also hibernates in the adult stage, and Doetzer & Foerster (Reference Doetzer and Foerster2007) estimated that adult winter survivorship proportion in Brazil was 0.85 and decreased in spring; however, little is known about T. basalis adult dispersal. Canto-Silva et al. (Reference Canto-Silva, Kolberg, Romanowski and Redaelli2006) found that the adult female dispersal capacity of another platygastrid, Gryon gallardoi (Bréthes), to be somewhat greater than for T. basalis which was 7.6 m day−1. Low early spring survivorship, low immigration of adults into the area and/or higher temperature threshold for the onset of T. basalis adult activity as compared to the threshold for N. viridula reproduction (Corrêa-Ferreira & Moscardi, Reference Corrêa-Ferreira and Moscardi1995), may all be sequential or concomitant factors that explain the low estimated T. basalis adult density at the beginning of an activity period.
The values of two parameters of the Holling–Hassell–Varley model, the attack rate and the coefficient of interference, were estimated from the same set of field data but following different methods, while Th, the handling time, was considered equal to a mean experimental value obtained by Laumann et al. (Reference Laumann, Moraes, Pareja, Alarcao, Botelho, Maia, Leonardecz and Borges2008), but expressed in different time units. Our estimates of the attack rate of parasitoids per unit area, Q, and the coefficient of interference, m, were consistent among methods.
The attack rate Q corresponds to a single parasitoid per unit area and in consequence does not reflect the effects of interference between parasitoids. Its value was greater than the value obtained following the methods of simultaneous estimations of the attack rate, a, and the coefficient of interference between parasitoids, m. Values of these parameters from laboratory experiments by Meats & Castillo Pando (Reference Meats and Castillo Pando2002) in which both, N. viridula egg masses and adults of T. basalis were varied in different combinations, are difficult to compare with ours because: (i) the attack rate was estimated as the net increase in the number of T. basalis adults on a given egg mass at intervals of 0.5 h (the experiment lasted 4 h); (ii) every egg mass discovered by the parasitoids was completely parasitized; and (iii) the entire egg mass was considered an individual host.
The coefficient of interference depends on the abundance and spatial aggregation of the parasitoids themselves, and combines in a simple way indirect mutual interference (named ‘pseudo-interference’ by Free et al., Reference Free, Beddington and Lawton1977), and behavioral mutual interference between parasitoids (Hassell & Varley, Reference Hassell and Varley1969; Beddington, Reference Beddington1975; DeAngelis et al., Reference DeAngelis, Goldstein and O'Neill1975). An aggregated distribution of parasitoid attacks may result from the response of the parasitoids to spatial heterogeneity (Hassell & May, Reference Hassell and May1973; Godfray & Pacala, Reference Godfray and Pacala1992). Hosts of T. basalis are spatially and temporally aggregated. They are spatially aggregated at different levels: at the level of an individual host (eggs are laid in masses), further aggregated within the plant (most egg masses are laid on the underside of a few leaves), and within and across plant patches with some plant and patches having a higher host density than others. The spatial distribution of hosts probably affects T. basalis in terms of movement of individuals (Loch, Reference Loch2000) and its survival: T. basalis females are able to learn the characteristics of their habitat and to maintain efficient foraging even when the habitat is not particularly rich in hosts (Dauphin et al., Reference Dauphin, Coquillard, Colazza, Peri and Wajnberg2009). In theoretical models of host–parasitoid interaction (Hassell & May, Reference Hassell and May1973), it was shown that the coefficient of interference is a stabilizing factor within 0<m<1 values (in the original paper, it was stated −1<m<0). DeLong & Vasseur (Reference DeLong and Vasseur2011) found that, in most field host/prey–parasitoid/predator systems, mutual interference is likely to be mostly intermediate, with a mean value of m=0.8 (in the original paper m=−0.8). In our case, and conforming to our hypothesis, the m value (0.5858) was also intermediate and significantly different from a functional response by single parasitoids (m=0) as well as from ratio dependence (m=1). The potentially stabilizing parasitism of N. viridula eggs by T. basalis occurs in a host–parasitoid system that was shown to be stabilized by the aggregative parasitism of adult bugs by another parasitoid, the Diptera T. giacomellii (Liljesthröm & Rabinovich, Reference Liljesthröm and Rabinovich2004). Concerning the biological control of N. viridula by T. basalis, in Brazil massive releases of T. basalis (at a mean density of 0.5–1.5 released adult parasitoids per m2 at R2–R3 phenological stages) are commonly used for the effective control of N. viridula and other bugs on soybean (Corrêa-Ferreira, Reference Corrêa-Ferreira1993). Our model suggests that because of the mutual interference between parasitoids a substantial augmentation in the density of released T. basalis would not be followed by a similar increase in parasitism.
We considered that the handling time estimated in the laboratory may reflect real values in the field, despite the differences between both habitats. In laboratory experiments with the N. viridula–T. basalis system, Meats & Castillo Pando (Reference Meats and Castillo Pando2002) found that the mean handling time (6.31 h per parasitized egg mass of 20 eggs) appears equal or higher than the upper bound (>6 h per host egg mass of 20 eggs). Corrêa-Ferreira (Reference Corrêa-Ferreira1993) mentioned that the mean time of parasitization of an individual egg of N. viridula by T. basalis was 240.9 s. When these values of handling time were expressed in our experimental and field time units (weeks per individual host egg), we found that the mean value from Meats & Castillo Pando (Reference Meats and Castillo Pando2002) was 0.0016 and that corresponding to Corrêa-Ferreira (Reference Corrêa-Ferreira1993) was 0.0004 (54.22% higher and 61.45% lower, respectively, than the value by Laumann et al. (Reference Laumann, Moraes, Pareja, Alarcao, Botelho, Maia, Leonardecz and Borges2008) who worked with the E. heros–T. basalis system). In this work, the sensitivity analysis showed that the Holling–Hassell–Varley model was not sensitive to changes in the handling time when it was varied from Th=0.0008 up to Th=0.0012, suggesting that our lack of confidence in the accuracy of the parameter estimate should not influence our confidence in the model.
As the host embryo develops within the egg, resources diminish; and although egg parasitoids can recycle part of those transformed resources, some of them are lost. Consequently, egg parasitoid larvae that develop in older eggs have fewer resources to use and old host eggs are generally less preferred by most Trichogrammatidae species (Godin & Boivin, Reference Godin and Boivin2000). Powell & Shepard (Reference Powell and Shepard1982) showed that T. basalis pre-adult survivorship depends on the age of the host egg; it was higher than 90% when host eggs were less than 72 h of development. When older host eggs were exposed several hours to an adult T. basalis female, the eggs were attacked, but host mortality was high (60–100%) and adult parasitoid emergence was very low or null. The value we estimated for pre-adult survivorship of T. basalis in ‘optimal’ host condition (LPS=0.868) conformed well to other laboratory studies (Powell & Shepard, Reference Powell and Shepard1982; Corrêa-Ferreira, Reference Corrêa-Ferreira1993; Corrêa-Ferreira & Moscardi, Reference Corrêa-Ferreira and Moscardi1995; Sujii et al., Reference Sujii, Costa, Pires, Colazza and Borges2002). However, the mean pre-adult survivorship of T. basalis we estimated in the field was significantly lower than the one in the laboratory, where host eggs were in the optimal ages (24 up to 72 h of development). We believe that lower field survival is due to use of older host eggs. In this case, like with superparasitization by solitary parasitoids which are able to discriminate between healthy and parasitized hosts, the richness of the environment (i.e., host density) may influence the parasitoid's decision, according to its life expectancy and egg load (Driessen & Hemerik, Reference Driessen and Hemerik1992). As a consequence, some individuals will parasitize a suboptimal host if the egg deposited in it still has a chance to result in an adult parasitoid (Mangel, Reference Mangel1989; van Alphen & Visser, Reference van Alphen and Visser1990; van der Hoeven & Hemerik, Reference van der Hoeven and Hemerik1990; Roitberg et al., Reference Roitberg, Mangel, Lalonde, Roitberg, van Alphen and Vet1992; Weisser & Houston Reference Weisser and Houston1993).
Most models of numerical response assume that each parasitized host tends to contribute with a fixed number of parasitoid progenies to the next generation. This is a reasonable assumption for many host–parasitoid models; however, the numerical response cannot always be expressed in terms of the functional response alone, because other variables, such as the sex ratio of the offspring might affect the numerical response when parasitoids interact (Hassell et al., Reference Hassell, Waage and May1983). In the T. basalis–N. viridula interaction, it was shown that if the time interval between successive parasitoid ovipositions is short (≈3 h), the superparasitizing female is more likely to win the contest, adjusting offspring sex ratio toward males in order to give those offspring a competitive advantage (Field et al., Reference Field, Keller and Calbert1997; Field, Reference Field1998; Field & Calbert, Reference Field and Calbert1999; Wajnberg, Reference Wajnberg2006). In a laboratory experiment, Corrêa-Ferreira (Reference Corrêa-Ferreira1993) offered one unparasitized N. viridula egg mass to up to 4 T. basalis adult females during 4 h, and observed no differences in total egg parasitism, but the proportion of emerged adult females decreased significantly from 0.89 (one T. basalis/host egg mass) to 0.75 (four T. basalis/host egg mass). Confirming our hypothesis and according to this result, our data showed a significant decrease in the proportion of females as the parasitoid population increased, possibly due to increasing superparasitism.
The observed weekly parasitism by T. basalis points out the importance of this parasitoid as a mortality factor of the N. viridula population. The functional response described by the Holling–Hassell–Varley model provided an acceptable estimation of weekly host parasitism. The pre-imaginal parasitoid survival and the change in sex ratio as a function of parasitoid density allowed a description of the numerical response of the parasitoid. A mathematical model exploring the dynamics of the N. viridula–T. basalis interaction will be developed in the near future.
Acknowledgements
The authors thank Cristina Monetti, Cecilia Margaría and Marta Loiácono for identification of parasitoids, Patricia Cameán for providing us some field data, and Marcela Liljesthröm for improving the English version of this manuscript.



