1 Introduction
The pyramid method models and quantifies variation in human content selection (Nenkova, Passonneau and McKeown Reference Nenkova, Passonneau and McKeown2007). It has been used in 3 successive years of the NIST Document Understanding Conference summarization evaluations (DUC 2005–2007). Evaluation methods must prove themselves against the same measuring stick – evaluation – as other research methods. This paper subjects the pyramid method to a formal and functional assessment.
A pyramid represents a weighted set of content units expressed in a set of model summaries. Once a pyramid for a given set of texts has been created (annotated), it can be used for quantitative or qualitative evaluation of the content of human or automated summaries. It depends on a second annotation procedure that identifies which pyramid content units have been expressed in a previously unseen summary. The DUC 2005 and 2006 pyramid evaluations relied on manual annotation. Automated approaches to the second annotation phase have been developed (Fuentes et al. Reference Fuentes, Gonzalez, Ferres and Rodriguez2005, Harnly et al. Reference Harnly, Nenkova, Passonneau and Rambow2005), though not applied on a wide scale.
Our formal assessment addresses whether this form of content representation can be applied consistently by different annotators, and whether different annotations of the same data yield different quantitative results. This assessment makes use of data from DUC 2003. The functional assessment compares the evaluation conditions and results from DUC 2003, and the NIST sponsored pyramid evaluations in DUC 2005 and 2006, to assess how the method functions across different evaluation settings. Section 2 gives a brief overview of the pyramid method. Section 3 describes the three datasets (2003, 2005, 2006) and indicates what factors changed from year to year, such as the nature of the summarization task. Section 4 describes the methods used to evaluate interannotator reliability of the annotations, to measure the impact on scores of using different annotators, and to assess the robustness of the method across the 3 years. Section 5 presents the quantitative results, and Section 6 discusses strengths and limitations of the method. Section 7 reviews related work, and Section 8 summarizes the contributions and concludes with a discussion of importance of research on evaluation methods.
2 Brief overview of pyramid method
The pyramid method consists of an annotation procedure for identifying and ranking shared content across documents to facilitate quantitative and qualitative evaluation. The content units it defines emerge from the annotation procedure, thus have no predefined or formal semantic representation. The aim is to capture the observation that content units appearing in different human summaries have the same Zipfian or power law distribution exhibited by word frequencies (Zipf Reference Zipf1949), family names (Newman Reference Newman2005), and other natural language phenomena. Because it has been presented and discussed in detail elsewhere (Passonneau and Nenkova Reference Passonneau and Nenkova2003; Nenkova and Passonneau Reference Nenkova and Passonneau2004; Nenkova et al. Reference Nenkova, Passonneau and McKeown2007), the overview presented here is oriented toward providing context for subsequent sections.
As in the DUC summarization evaluations, the term peer summary means a system summary to be evaluated. A model summary refers to a summary written by a human that plays a role in defining what a system summary should achieve. A pyramid is constructed from multiple model summaries.
2.1 Summary Content Units
Figure 1 shows an example of Summary Content Unit (SCU) from a DUC 2005 pyramid, used in the DUC 2006 guidelines (http://www1.cs.columbia.edu/~becky/DUC2006/2006-pyramid-guidelines.html#SCUs)Footnote 1. The top row shows an SCU index (SCU49), the SCU weight (W = 4), and a natural language label assigned by the annotator (Plaid Cymru wants full independence). The four remaining rows list the contributors, or phrases extracted from four model summaries that express the same content. Note that contributors can contain gaps, and need not be literal paraphrases of each other; they must constitute evidence that the summary explicitly or implicitly expresses the content the annotator stated in the label.
Example SCU, from DUC 2006 Guidelines.

A few of the guidelines that help annotators identify SCUs are
(1) An SCU contributor cannot be larger than a single tensed clause.
(2) An SCU can contain no more than one contributor per model summary.
(3) All of an SCU's contributors must express more or less the same content, whether explicitly or implicitly.
The weight of an SCU represents the number of models that express the SCU. Thus if a given model summary re-expresses the same SCU, the repetitions get counted as a single SCU.
2.2 Pyramid annotation and pyramid characteristics
Pyramid annotation consists of finding all the SCUs expressed in a set of model summaries. We do not assume that there is a single best pyramid for a given set of model summaries. Instead, we claim that the method is sufficiently robust that distinct pyramids for the same model summaries should produce roughly the same quantitative results. We present results supporting this claim in Section 5.2.
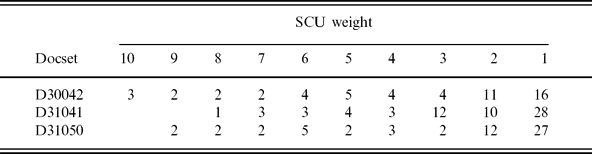
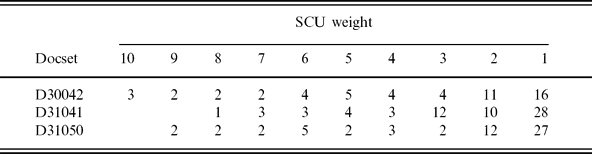
In theory, the fully annotated SCUs constitute a partition over all the words in a set of model summaries; in practice, function words can be omitted. A pyramid is a partition over the SCUs by their weights. Table 1 shows the number of SCUs at each weight for three DUC 2003 pyramids with ten models. It illustrates an apparent Zipfian distribution: the cardinalities of each partition become rapidly smaller as the weight increases. The higher the SCU weight, the more reward a peer receives for expressing the same content. SCUs of weight W = 1 play a relatively insignificant role in peer evaluation. In Nenkova and Passonneau (Reference Nenkova and Passonneau2004), we investigated what number n of models is required for a pyramid to yield consistent rankings of summaries. Our results indicated that with four or five models, the probability of a ranking error falls to roughly p = 0.1.
Increasing frequency for each SCU weight from 10 to 1
2.3 Peer annotation
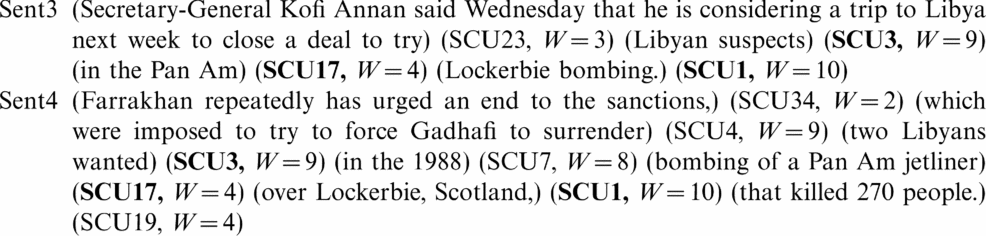
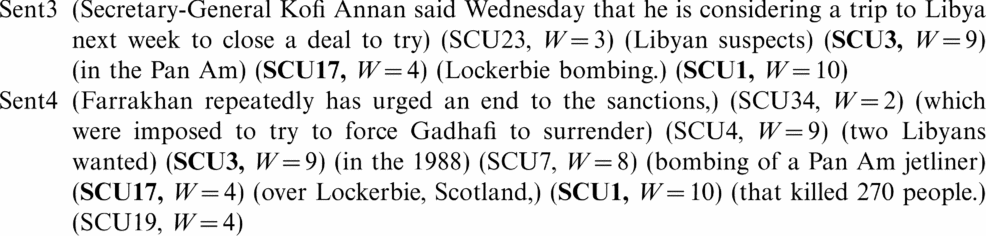
The goal of peer annotation is to identify the SCUs a peer expresses, and to use the SCU weights to create a normalized sum representing the proportion of the pyramid content that the peer conveys. The annotator compares the peer to the pyramid to identify spans of text in the peer that express the same content as an SCU, as illustrated in Section 4. Here the words in a peer that express an SCU are referred to as a Peer SCU Expression (PSE); a PSE is coindexed with the corresponding SCU, followed by the weight. Each tensed clause that does not correspond to an SCU is a PSE of weight zero. Figure 2 shows an annotation of the last two sentences of a peer summary of document set D30042 from the DUC 2003 data described in the next section. As illustrated, three SCUs have been expressed by two PSEs each (boldface indices): 1, 3, and 17. A peer summary can have content that is not represented in the pyramid, and as shown here, a peer can contain multiple PSEs for the same SCU. When summing the SCU weights, duplicate PSEs are counted only once. Duplicate content is more frequent in DUC 2003 peer summaries than in later years, when systems were more mature.
PSEs in two sentences from a DUC 2003 peer summary.
2.4 Pyramid scoring
The raw score of a peer is the sum of the weights of the SCUs that have been expressed in the peer. In previous work, we normalized the raw scores in two ways, referred to as the original and modified pyramid scores. The original score normalized the sum by computing its ratio to the maximum sum generated by a pyramid, given the number of PSEs in the peer. For the example in Figure 2, eleven weighted PSEs cover the two sentences. If there had been no SCU corresponding to the content expressed in a peer clause, e.g. the first clause of Sent4, the clause would be identified as a PSE of zero weight. The D30042 pyramid represented in Table 1 has thirteen SCUs for SCU weights 10 down to 6, so the maximum sum for eleven SCUs drawn from the pyramid (without replacement) would be (3 × 10 + 2 × 9 + 2 × 8 + 2 × 7 + 2 × 6) = 90. The formula for computing the original score denominator is

Here j is the weight of the most highly weighted partition such that the sum of its cardinality and the cardinalities of partitions with higher weights is greater than or equal to X, the number of PSEs in the peer. If X is less than the cardinality of the most highly weighted partition, then j = n and Max is X × n.
An alternative normalization we referred to In Passonneau et al. (Reference Passonneau, Nenkova, McKeown and Sigelman2005) as the modified score uses the maximum sum that would be generated given X a, the average number of contributors per model summary in the pyramid:
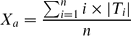
Both scores give a normalized quantity indicating the proportion of SCUs that are expressed in a peer summary. The original score depends on identifying the number of zero weight PSEs in the peer. This number can differ from the average number of contributors per model summary. Since peers and models are constrained to have the same number of words, if the number of PSEs in a peer is greater than the average number of SCUs per model, the peer must have fewer words per SCU.
The original score can be compared to a content precision measure, in that the ratio factors in to what degree a peer expresses zero weight content. The modified score can be compared to a recall measure in that it quantifies whether the peer expresses as much content as a typical model summary, independent of whether it does so in relatively more or fewer words.
3 Materials: three pyramid datasets
The materials consist of model (human) summaries of topical clusters of news articles, pyramids of SCUs constructed from the models, peer summaries of the same document clusters, and PSE annotations of peer summaries. This section describes how we augmented the DUC 2003 data for the formal assessment, and describes the characteristics of the DUC 2005 and 2006 data.
3.1 DUC 2003 dataset
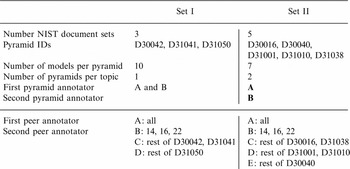
For DUC 2003, NIST assembled thirty sets of ten documents, each approximately 500 words long, from the Topic Detection and Tracking Corpora (fifteen each from TDT2 and TDT3). For each of the thirty document clusters, NIST asked assessors to write four 100-word summaries. For eight of the document clusters, we collected three to six additional human summaries using the same instructions given to the NIST assessors. In Nenkova and Passonneau (Reference Nenkova and Passonneau2004), we analyzed three sets of ten summaries (Set I in Figure 3) to argue that four model summaries are sufficient to produce replicable evaluation results. Here we use an additional five sets of seven summaries (Set II in Figure 3) to argue that results are replicable across different pyramids for the same models.
DUC 2003 annotation sets.

Five annotators were involved in creating the DUC 2003 data (A through E in Figure 3). A is the author and B is Ani Nenkova, who collaborated on developing the pyramid evaluation (Passonneau and Nenkova Reference Passonneau and Nenkova2003; Nenkova and Passonneau Reference Nenkova and Passonneau2004; Nenkova et al. Reference Nenkova, Passonneau and McKeown2007). C through E were computer science graduate students at Columbia University who volunteered, and four students from other departments who were paid. The paid annotators were recruited on the basis of demonstrably high verbal skills (such as high verbal GREs). All annotators were trained using materials similar to those used for DUC 2005 and 2006.
For Set I, A and B created first pass pyramid annotations (SCUs) working independently, then merged their results. Each peer was annotated (PSEs) by two annotators working independently, making it possible to produce two quantitative assessments: interannotator agreement (IA) on PSEs, and the correlation of the pyramid scores assigned to peers two from different annotators. We argue below (cf. Passonneau Reference Passonneau2006) that it is important to compare IA values with an independent assessment based on a significance test of an independent use of the data from different annotators, such as to rank summarization systems. We refer to this as a paradigmatic reliability analysis.
As shown in Figure 3, A annotated all peers (N = 16) for the three document sets; B annotated peers 14, 16, and 22 for the three document sets; C annotated the thirteen remaining peers for D30042 and D31041; D annotated the thirteen remaining peers for D31050, and E annotated the remaining thirteen for D30040.
For Set II, A and B independently created pyramids for five document sets from seven model summaries, yielding five pairs of pyramids. A annotated all Set II peers against B's pyramids. Annotators B through E annotated the Set II peers against A's pyramids, as shown in Figure 3.
The Set I data is used for the following assessments:
(1) to measure interannotator agreement of peer annotation (PSE);
(2) to test whether scores based on the peer annotations by A, versus the peer annotations by B, C, or D are significantly different.
Because pyramid scores are based on sums of the weights of the SCUs corresponding to the PSEs in a peer, and there are many sets of SCUs that could give the same sum, in principle it is possible (although unlikely) to have poor interannotator agreement yet have no significant difference in scores. High interannotator agreement on peers indicates that annotators find essentially the same PSEs.
The Set II data is used for the following assessments:
(1) to measure interannotator agreement of pyramid annotation (SCUs);
(2) to test whether sets of scores based on the B pyramids versus A pyramids are significantly different.
High interannotator agreement on pyramid annotation would mean that at a level well above chance, different individuals find the same SCUs in the seven model summaries. This would likely, but not necessarily, produce the same scores. Thus in addition, this assessment tests for significant differences between the scores generated by each pyramid.
Pyramid annotation is more difficult than peer annotation because annotators must create SCUs from scratch, rather than match peer phrases with existing SCUs. Interannotator agreement on SCUs thus provides a greater test of the reliability of pyramids for representing content. An additional analysis was done to test whether pyramid annotation has high interannotator reliability for pyramids created by pairs of annotators other than the two developers (A and B). At the time of writing this paper, the author created pyramids for five randomly selected document sets from 2006 and computed interannotator reliability on the five 2006 pyramids.
Interannotator agreement is high for PSEs in Set I, for SCUs in Set II, and for SCUs in the five 2006 pyramids. Peer scores from different annotations are significantly correlated on both sets. Sets I and II are combined giving sixteen peer systems from DUC 2003 to compare with the DUC 2005 and 2006 peer evaluations.
3.2 DUC 2005 pyramid data
The summarization task for DUC 2005 involved thirty document sets consisting on average of 30.4 documents each, with an average document length of 720 words. Of these, NIST selected twenty for the pyramid evaluation, recruiting seven assessors to write 250 word summaries for each document set. Columbia University prepared annotation guidelines, implemented an annotation tool, and supervised the pyramid evaluation effort. Five annotators constructed pyramids for the twenty document sets, working in pairs and adjudicating differences. Twenty-seven sites participated, and each site performed peer annotation. The author edited the peer annotations for faithful adherence to the guidelines, with regard to zero weight PSEs. Original and modified scores were computed for all peers.
3.3 DUC 2006 pyramid data
The pyramid evaluation effort for DUC 2006 involved twenty-one sites on twenty document sets. The document clusters were similar to those for DUC 2005. NIST had four assessors write 250-word summaries for each document set, using instructions that were similar to those for DUC 2005. Each pyramid content model was constructed from four human summaries. The twenty document sets were selected to have an even distribution of model summaries across assessors, and high clarity ratings by the participating assessors.
4 Methods
4.1 Formal assessment methods
This section assesses whether different annotators find the same units and weights by computing interannotator agreement on SCUs and PSEs. We also measure the degree to which the annotations give the same quantitative results by means of significance tests of the differences in peer scores derived from different annotations. We perform an acceptance test using analysis of variance to test the null hypothesis that the score means from the two different annotator sets are same. A nonsignificant result means we accept the null hypothesis. We conduct a more typical rejection test using Pearson's correlation to test the null hypothesis that the two sets of peer scores differ. A significant result means we reject the null hypothesis.
4.1.1 Interannotator agreement
An agreement coefficient reports the degree to which the observed agreement among annotators differs from the agreement that would be given by a chance distribution, where the probability of agreement given by chance is estimated differently, depending on the agreement coefficient. Due to extensive discussions elsewhere (including Carletta Reference Carletta1996; Artstein and Poesio Reference Artstein and Poesio2005), it has become common practice to report interannotator agreement instead of, or in addition to, percent agreement. A key motivation is that an agreement metric makes it possible to compare agreement measures across datasets (see Artstein and Poesio Reference Artstein and Poesio2005).
We measure interannotator agreement using Krippendorff's α (Krippendorff Reference Krippendorff1980), which uses a single probability distribution of annotation values for all annotators. The proportion of times a given annotation value occurs serves as an estimate of its probability. This differs from Cohen's κ (Cohen Reference Cohen1960), which uses a distinct probability distribution for each annotator. As discussed in detail In Artstein and Poesio (Reference Artstein and Poesio2005), there has been much debate about which assumption is more sensible. In practice, they often give similar values (cf. Passonneau et al. Reference Passonneau, Nenkova, McKeown and Sigelman2005), with slightly higher values for κ because it corrects for annotator bias. As there is generally little motivation to correct for annotator bias, we prefer α, which simultaneously handles multiple annotators and distance metrics. Until (Artstein and Poesio Reference Artstein and Poesio2005), there was no formulation of κ that did both (see the Alpha Resources page at http://cswww.essex.ac.uk/Research/nle/arrau/alpha.html for further information on the properties and computation of α).
Where p(A O) is the proportion of observed agreement and p(A E) is the proportion of agreement that would be expected by chance, the general formula for computing interannotator agreement (IA) for the various agreement coefficients is
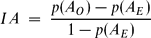
Values for IA range from 1 for perfect agreement to values close to −1 for increasingly nonrandom disagreement, with 0 representing chance behavior. In fact, α measures interannotator disagreement (ID), thus uses a distinct but mathematically equivalent formulation (Passonneau Reference Passonneau1997). If two annotators each assign Label1 50 per cent of the time, and likewise for Label2, then they would be expected to agree on 25 per cent of their choices simply by chance. If there are no cases where they agree (p(A O) = 0), then interannotator agreement is  , or
 .
4.1.2 Distance metrics
Agreement coefficients can incorporate distance metrics that assign partial agreement when the annotation values can be scaled. No distance metric is necessary for categorical data; if A1 and A2 agree, the distance between their choices is 0, and if they disagree, it is 1. (Because α measures disagreement, distance metrics have opposite end points.) For other types of data that can be scaled, distance metrics can be used that assign values between 0 and 1 to indicate partial agreement. Krippendorff (Reference Krippendorff1980) discusses ordinal, interval, and ratio scales. The use of distance metrics has been discussed in detail elsewhere in regard to assessing peer annotation (Passonneau et al. Reference Passonneau, Nenkova, McKeown and Sigelman2005), pyramid annotation (Passonneau Reference Passonneau2006), semantic concept annotation (Passonneau, Habash and Rambow Reference Passonneau, McKeown and Sigelman2006), and coreference annotation (Passonneau Reference Passonneau2004; Artstein and Poesio Reference Artstein and Poesio2005). Here, we discuss the necessity of using set-based distance metrics. We use Dice (Dice Reference Dice1945) as the distance metric for peer annotation, and MASI (Passonneau Reference Passonneau2004, Reference Passonneau2006) as the distance metric for pyramid annotation, as motivated below.
4.1.3 Dice for PSE agreement
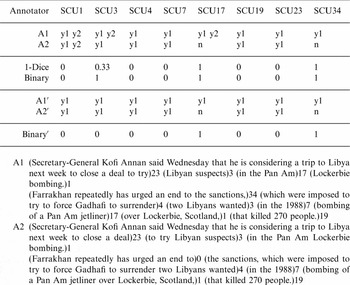
In peer annotation, an annotator decides for each SCU in a pyramid whether it is expressed in a given summary. If so, annotators must also select the words that express the SCU's content. Automated summaries can contain unintentional repetition of the same content, so a given SCU can be expressed more than once in a machine summaryFootnote 2. The sentences at the bottom of Figure 4 illustrate two PSE annotations of the same peer summary by annotators A1 and A2. The parentheses indicate spans of words selected as PSEs; the number following the parentheses indicates which SCU in the pyramid the PSE is coindexed with. A1 finds two instances of SCU17, one in each of the two sentences, while A2 finds none.
Illustration of partial peer annotation and Dice distance.

For computing IA, we represent the two annotations as shown in the top two rows of the table shown in figure. There is a column for each SCU, and each row indicates whether the annotator found a corresponding PSE. The number of sequentially indexed y's in each cell indicates how many PSEs the annotator found; an n indicates the SCU is not expressed in the peer. The disagreement on SCU17 corresponds to a disagreement on the granularity, as well as on the presence or absence of information. Both annotators agree that the peer mentions the Lockerbie bombing (SCU3), but A2 does not find a PSE pertaining to the airline involved (SCU17). The bottom two rows of the table present an alternative binary (categorical) representation that indicates for each SCU whether the annotator found any corresponding PSE.
Dice measures overlap between two sets. It can be expressed as the ratio of twice the cardinality of the set intersection to the sum of the cardinalities of the sets, thus it ranges from 0 for no intersection to 1 for set identity. The distance metric becomes 1 − Dice. For SCU3 in Figure 4, 1 − Dice is  , or
 .
Our representation captures all the differences between A1 and A2. We use Dice because we want sets that overlap to get partial credit. Figure 4 shows the Dice and Binary distances for this representation, and for the reduced representation (Binary′). Two inadequacies of Binary are illustrated: it assigns a value indicating complete disagreement on SCU3 when both annotators find at least one corresponding PSE; it treats the disagreement on SCU3 and SCU17 as equivalent, when they disagree as to whether SCU17 is expressed at all. Binary′ assigns a value indicating complete agreement on SCU3, which ignores the fact that the annotators disagree on how many PSEs they found for SCU3. In summary, the use of Dice with our representation is more conservative than Binary and more fair than Binary′, as reflected in the corresponding α values for the two sentences: αDice = 0.15, αBinary = 0.34, αBinary′ = −0.07.
4.1.4 MASI for SCU annotation
Dice and Jaccard (Jaccard Reference Jaccard1908) measure the amount of overlap between sets. Jaccard is the ratio of the set intersection to the set union. Both range from 0 to 1, but differ in the rate of change. For two sets X and Y where X is equal to Y, as new members are added to Y, Jaccard decreases with a linear slope while Dice decreases with a concave slope. Neither takes into account the semantic relation between the two sets, such as whether it is a proper subset of the other. MASI (Passonneau Reference Passonneau2006) is a set comparison metric for semantic and pragmatic annotations involving sets, including coreference annotation (Passonneau Reference Passonneau2004). It is a weighted Jaccard, where the weighting is based on the observation that a set difference relation represents semantic conflict while a subset relation does not.
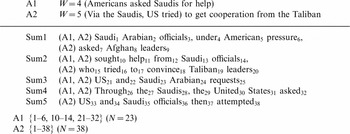
Fig. 5 represents a typical case where one annotator creates an SCU that is a subset of one created by the other annotator. A1 created an SCU of weight 4, using phrases from summaries one through four (Sum1–Sum4). A2 created an SCU of weight 5, using two of the same phrases (from Sum3, Sum4), two subsuming phrases (from Sum1, Sum2), and an additional phrase from summary five. While the SCUs are not identical, there is no semantic conflict: the set of words in A2's SCU subsumes that in A1's SCU. There is correspondingly more semantic content in A2's SCU, as illustrated by the labels the annotators created. A2's SCU maps to a three-place relation among the U.S., the Saudis, and the Taliban. A1's SCU maps to a two-place relation among the U.S. and the Saudis that is essentially a component of A2's three-place relation: a request for help is implicitly a request for help to achieve some end.
SCUs created by different annotators: Subset Relation.

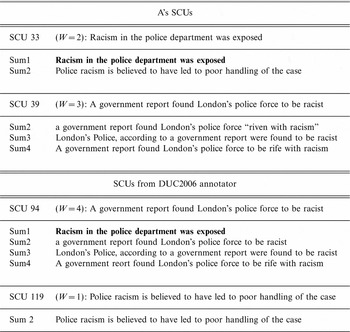
Figure 6 illustrates a contrasting example where SCUs created by different annotators are in a set difference relation, corresponding to a much different interpretation of the text. The figure shows two SCUs created by the author (SCU33 and SCU39) that roughly correspond to two SCUs created by a DUC 2006 annotator (SCU94 and SCU119). SCU33 and SCU94 are in a set difference relation, which is a nonmonotonic relation. The intersection consists of one contributor, shown in boldface. SCU39 and SCU94 are almost identical, apart from this contributor; both use the label ‘A government report found London's police force to be racist.’ The other pair of content units are labeled differently, despite sharing one contributor: A's is about exposure of police department racism, while the DUC annotator's is about police racism leading to poor handling of the case. As discussed In Passonneau (Reference Passonneau2004), a nonmonotonic set relation typically represents genuine semantic conflict for many kinds of semantic and pragmatic relations, including coreference.
SCUs created by different annotators: Set Difference Relation.

To use interannotator agreement coefficients on pyramid annotation, the coding units and values must be selected so that all coding units are relevant across annotations, and the values correspond to annotator decisions. Our approach is for each unit to be a word in the summary, and for its value to be the set of words in the SCU the annotator assigned it to, less than the current word (Passonneau Reference Passonneau2004, Reference Passonneau2006); if the current word is not omitted, SCUs from different annotators will vacuously have at least one word in common. The SCUs in Figure 5 followed the original annotation guidelines in which the SCUs formed equivalence classes of words over the summaries. The bottom of the figure shows the equivalence classes created by A1 and A2. For each word w, its annotation value is the equivalence class it belongs to less {w}; each cell of the reliability matrix would contain the set of words that each annotator grouped together into a single SCU (less w). There are always many more words than SCUs in a pyramid, thus by equating the choices pertaining to finding the content expressed in a sample of summaries with exactly which words express that content, this representation would tend to it underestimate interannotator agreement values. When annotators agree that a given phrase more or less belongs with the same SCU, they are likely to disagree on which contributors some of the words belong to. A full discussion of the method for computing interannotator agreement on pyramids appears In Passonneau (Reference Passonneau2006).
Given our data representation that ultimately compares all words in SCUs, there will be very little categorical identity. However, there is a great deal of semantic overlap. Because the annotation values are sets, there are four distinct relations among A1's set for word w and A2's corresponding set: identity, subsumption, symmetric difference (where two sets have a non-null intersection set and non-null set differences), and disjunction. This becomes the basis of a four-point scale from 0 to 1 to discriminate these four set relations:  , and 1.
The MASI metric (for Measuring Agreement on Set-valued Items) takes into account discrepancies in size of two SCUs, and discrepancies pertaining to the four set relations noted above; where J is the Jaccard set coefficient and M is the four-point scale for discriminating set relations, MASI is ((1 − J) × M). The value of (1 − J) ranges from 0 when the sets are identical, to values that are increasingly close to 1 as the difference in size of the set intersection and the set union increases. Because M takes on values equal to or between 0 and 1 in the same direction, MASI also ranges from 0 for identity to values close to 1 as the two comparison sets become more disparate in size and membership. In the example from Figure 5, the distance between the two SCUs assigned by MASI is  . In the example from Figure 6, SCU94 and SCU39 are in a set difference relation; their MASI value is
 .
4.2 Functional assessment methods
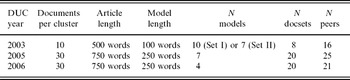
We have 3 years of DUC system rankings based on average pyramid scores across document sets. As illustrated in Table 2, the evaluation sets differ with respect to the size and average article length of document clusters, the length of model and peer summaries, the number of models in the pyramids, the number of document sets, and the number of peer systems. We report rankings for each year using the same statistical tests: analysis of variance to determine whether mean score is predicted by peer system, and Tukey's Honest Significant Difference method (HSD) to determine significant differences among peer systems. We conclude the presentation of results by comparing the minimum number of document sets that would be required to discriminate systems with the observed HSDs, as given by power tests of ANOVA for each year of DUC pyramid data, using a power of 99 per cent (a significance level of 0.01).
Pyramid data for DUC 2003, 2005, 2006

5 Results
5.1 Formal assessment
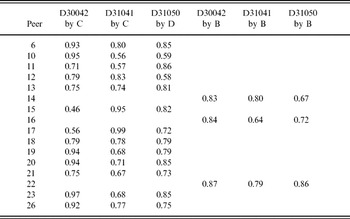
Table 3 presents the interannotator agreement results for peer annotation, using αDice, as discussed in the previous section. Different annotators appear in different columns. Generally, the agreement is quite good, as reflected in the average of 0.78 (0.81 for D30042, 0.76 for D31041, 0.77 for D31050). The disagreement on the peer 15 summary of docset D30042, which has the lowest value (0.46), is due to an unusually high proportion of peer content that is not in the pyramid. On an average, 55 per cent of peer summary words occur in nonzero weighted PSEs, whereas for this summary it is only 32 per cent. The annotators agree that the summary contains three PSEs, but agree on the identity of only one.
Interannotator reliability of peer annotation, Set I, using αDice

Set I peer scores are compared using analysis of variance (ANOVA) in an acceptance test, where a non-significant result indicates that the means are not significantly different for scores produced by different PSE annotations. ANOVAs of score and modified score for Set I with annotator as a factor indicate no significant difference (p = 0.73, 0.71, respectively). The mean difference in original scores is 0.0214, and the mean difference in modified scores is 0.0139, both of which are quite small relative to the overall mean score range of 0.12–0.65, and to the average standard deviation of 0.17. The greatest disparity in original scores is for peer 18; the difference in means is 0.08 and the difference in SD is 0.04; for modified scores peer 16 has the greatest disparity.
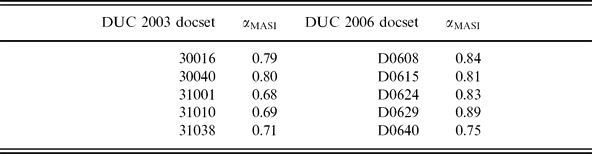
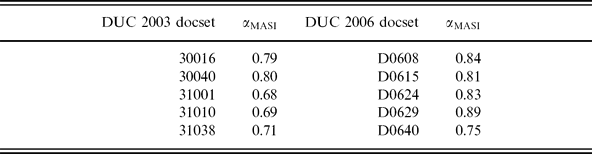
Table 4 presents interannotator agreement on pyramid construction for the five pairs of pyramids in Set II, and for five additional pairs of pyramids from DUC 2006. The test of DUC 2006 pyramids was included because an anonymous reviewer suggested that the high correlations for DUC 2003 would be expected, given that the annotations compared were from the original developers of the annotation method. As can be seen, the interannotator agreement is actually higher for the DUC 2006 pyramids, which is likely due to the fact that the DUC 2006 annotation guidelines and procedure had been tested in DUC 2005, and revised for clarity in 2006. Agreement on DUC 2003 pyramids ranges from 0.69 to 0.80 (mean agreement is 0.79), and on DUC 2006 from 0.75 to 0.89, indicating very good agreement.
Interannotator agreement on DUC 2003, 2006 pyramids, using αMASI
ANOVAs of score and modified score for Set II with annotator as a factor have high probabilities (0.54 and 0.70), which again indicates no significant difference in score means. This can be expected from the low mean of differences in original scores of 0.0103, and in modified scores of 0.0121. Again, these are quite small in comparison with the mean score range (0.19–0.60), and standard deviations (0.18–0.22 on average, for both annotators, both scores).
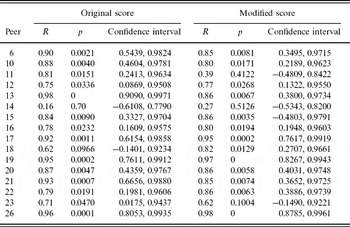
Peer scores are compared using Pearson's correlation in a rejection test, where a significant result corresponds to rejecting the hypothesis that the scores from different PSE annotations, or from different SCU and PSE annotations, are not correlated. Table 5 shows correlation results on peer scores for Set I and Set II data (all eight document sets). Excluding the outlier peer system 14 (discussed earlier), the correlations range from 0.71 (p = 0.05) to 0.96 (p = 0.0001) for original scores, and for modified scores they range from 0.39 (p = 0.4122) to 0.98 (p = 0). The average correlation is 0.85 for original scores, and for modified scores it is 0.86. For the outlier peer 14, there is no significant correlation for either the original or modified scores. For the modified score, the peer 11 scores are not significantly correlated, but the original scores are (0.81, p = 0.004).
Pearson's correlations of original pyramid score means for each peer, Sets I and II combined

5.2 Functional assessment
The functional assessment of the pyramid method addresses whether the ability to rank systems in an evaluation context is sensitive to the factors listed in Table 2. As summarized by the ANOVA results in Table 6, peer system as a factor is a highly significant predictor of pyramid score for all 3 years of DUC data. We examine whether other factors are also predictive, and whether this varies across years.
ANOVAs with the peer system as a factor predicting modified score

To evaluate the sensitivity of the pyramid method to the parameters identified in Table 2, an ideal situation would be to have a controlled comparison, and a known ranking of systems. We cannot meet this ideal for many reasons: the procedures and tools evolved over the 3 years, not to mention the systems. However, by comparing 2003 to 2005, in which a similar number of model summaries were used in pyramid construction, we can speculate about the impact of cluster size and summary length. By comparing 2005 to 2006, in which the document clusters were similar in size and the summary length was the same, we can speculate about the impact of the number of models, which decreased from seven to four.
5.2.1 Comparison of peer evaluation results across years
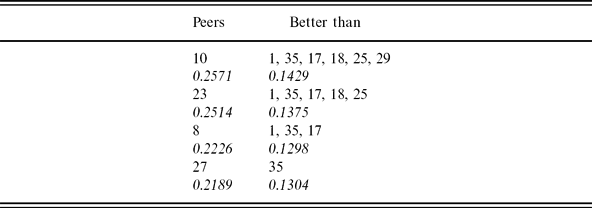
Tables 7–9 present the results of Tukey's Honest Significant Difference method on the analyses of score variance for the modified scores from 2003, 2005, and 2006. Each nonitalicized row of the tables gives a significantly different pair of peer sets, with the high performing set on the left. In order to give the reader a sense of the magnitude of difference between each pair of peer sets, the group score mean for each set is shown in a second italicized row.
DUC 2003: Significantly distinct groups of peers (modified score), using Tukey's HSD (0.2161)

DUC 2005: Significantly distinct groups of peers (modified score), using Tukey's HSD (0.0872)

DUC 2006: Significantly distinct groups of peers (modified score), using Tukey's HSD (0.0836)
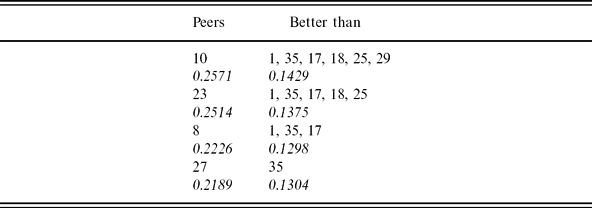
We further pursue the question of the impact of using a different annotator by evaluating how the rankings presented in Table 7 might differ when using a different annotator. Both pairs of pyramid and PSE annotations for 2003 yield roughly the same ANOVAs, slightly different HSDs (δ = 0.02), and nearly the same results regarding system comparison. A's annotations compared with those of B to E produce the same system differences, with the exception that peer 13 is found to be better than 15 but not 17. Using the annotations from B to E, peer 14 is not found to be better than 15. In other words, given the 120 pairs of comparisons (16 choose n), the two annotations differ by only 2 comparisons (peer 13 versus 17, and peer 14 versus 17), or 1.7 per cent. It is unsurprising that peer 14 figures in the differences, given the low correlation reported in Table 5.
The ability of the method to discriminate systems remains robust as the task gets more difficult. Task difficulty is most distinct between 2003 versus 2005 and 2006. The summarization task for 2003 was less difficult, involving fewer documents per cluster (ten versus thirty), shorter documents (500 words on average, compared with 750), and shorter target summaries (100 words compared with 250). Yet the evaluation results of 2003 and 2005 are quite similar, with the same score range and the same number of significantly distinct sets of differences. The score range in 2003 was 0–0.85, and in 2005 it was 0–0.81. For both years, the system differences fall into two groups, but in 2005, with many more systems participating, the sizes of the groups are larger. In 2003, there are three systems out of sixteen that are significantly distinct from the two poorest performing systems (Table 7), while in 2005 there are four out of twenty-five (Table 8). In 2003, there are five peers that outrank the poorest performing system, while in 2005 there are nine.
In 2006 with twenty-one systems participating, the pyramid evaluation yields four significantly different groups of systems instead of two. The score range is much lower, ranging from 0 to 0.59. The difference in score range is likely due to the use of relatively fewer models in 2006 (four compared with seven or ten). With fewer models, there are far fewer combinations of the same number of SCUs that would give the same high score. The greater number of significant differences in combination with the use of fewer models suggests that the ability of the method to discriminate systems is quite robust across conditions.
We speculate that the greater number of significant differences in 2006 is due to the efforts on the part of NIST to select document sets with high clarity ratings, and to have an even distribution across assessors who wrote model summaries. In addition, DUC 2006 was the second use of the method at DUC, with refined guidelines and procedures. For the 2003 dataset, adding a new model summary to an existing pyramid became increasingly easy after the first four summaries had been annotated. This is in contrast with the experience in 2005 and 2006, when the model summaries were two and a half times the length. Feedback from pyramid annotators during the process indicated that the 2006 pyramid annotators found the task relatively less difficult than 2005 annotators. In addition, the annotation software had been significantly improved.
5.2.2 Power tests
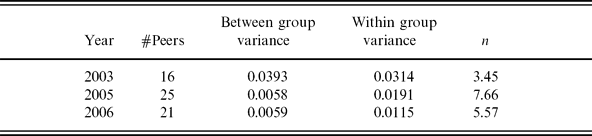
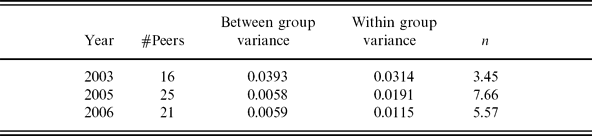
Table 10 gives the results of power tests of the ANOVAs for the modified scores across all 3 years, using a power of 0.99 (α = 0.01). Used in this way, a power test will give the number of observations (meaning number of document sets summarized) required for each peer in order to have a 99 per cent probability of getting a significant result at the 1 per cent level. The table shows the number of peers, and the between group and within group variance of modified scores, for each year. The final column indicates how many observations we need for each peer. Note that given the actual number of observations per peer for each evaluation, the power for all 3 years was 1.0, meaning far more than sufficient to discriminate systems.
As shown, more observations are needed in 2005 than in 2003 to achieve the same power, probably because of increased task difficulty. More are needed in 2005 than 2006, which we speculate, is due to differences between the 2 years discussed in the preceding subsection.
Power tests for ANOVAs of modified scores, power = 0.99, α = 0.01
6 Discussion
The pyramid manual annotation was designed to be conceptually simple, to require as little training as possible, to be reliable, and to lend itself to a range of quantitative and qualitative assessments. It is grounded in the Bloomfieldian assumptions about language use (Bloomfield Reference Bloomfield1933) that no two people use language the same way, but that each community of language users shares large degrees of commonality; without this commonality, communication would be quite difficult. We all read the same news articles, or other material, similarly enough that we can recognize when someone is summarizing the same articles, despite the observation that human summaries will all differ in content to some degree, depending on variations in the knowledge and motivations of the summarizers. Here we discuss the significance of the results, and limitations of the method.
The results presented here suggest that our design goals have been met. The annotation method is conceptually simple in that it requires no knowledge of semantics or of an annotation language. The judgments annotators are asked to make resemble those required in ordinary language use, namely to identify similarities and differences in meaning. Two years of DUC results show that the minimal training provided to DUC annotators yields reliable results. In addition, the fact that the author's interannotator agreement with DUC 2006 annotators was as high or higher than with the co-developer suggests that agreement depends more on the refinement of the guidelines and procedures, than on the degree of training or experience.
On the other hand, expertise and motivation may play a role in the reliability results presented here. For DUC 2005 and 2006, most of the annotators were developers of summarization systems, or were supervised by the author. Developers presumably have a relatively deep understanding of the types of decisions involved in writing summaries, which is likely reflected in the ease with which they learned the annotation task. Pyramid evaluation was a voluntary component of DUC participation, thus motivation was high. PSE annotation on DUC 2003 pyramids was done by paid recruits, none of whom did any pyramid annotation. The interannotator agreement on this task varied quite a bit. The author administered the annotation procedure for both DUC 2005 and 2006, and presumably became more expert in doing so. For DUC 2007, NIST assessors were introduced to the method by volunteers who had participated in previous pyramid evaluations, but who had not administered it before. The NIST assessors, who were not developers of summarization systems, reportedly found it difficult to understand (Dang Reference Dang2007).
A key test of the reliability was performed here, namely, a comparison of the system rankings produced by two distinct groups of annotators on both phases of annotation, SCUs and PSEs, for DUC 2003. The system evaluations were conducted using a conservative method for computing significant differences in mean peer scores, Tukey's Honest Significant Difference method. Tukey's avoids the potential of family-wise or experiment-wise error (the probability of a Type I error), i.e. of inflating the significance threshold (α) thus introducing spurious differences. The least significant difference method (LSD), for example, is mathematically equivalent to performing all pairwise t-tests, and as noted in Cohen (Reference Cohen1995), the probability of assigning significance where there is none increases exponentially in k for k-fold pairwise comparisons. Intuitively, it can be seen that if differences are considered only a pair at a time, rather than all pairs at once, the comparison of fewer means will necessarily be less reliable than comparing multiple means at once. In comparing the overall system ranking results by replicating the analysis of variance on two datasets produced by different annotators, only two out of 120 paired rankings of systems differed, one of which was to be expected, as it involved a peer set whose scores from the different annotators were not significantly correlated.
Finally, a comparison of results across years suggests that the method performs similarly across different evaluation contexts, meaning different document set sizes, summary lengths, numbers of models, and different peer systems. In tests of various combinations of factors, the most significant predictor of score is peer system, meaning that score differences are attributable primarily to system, not to other factors. In addition, a much smaller number of document sets would be sufficient to discriminate systems, as shown by the results of power tests.
The laborious nature of performing a large-scale evaluation based on manual annotation is an obvious limitation of the method. Previous work has shown that scoring a novel peer summary can be automated (Fuentes et al. Reference Fuentes, Gonzalez, Ferres and Rodriguez2005, Harnly et al. Reference Harnly, Nenkova, Passonneau and Rambow2005), but generating a pyramid automatically has not been reported, despite previous work that attempts to move in this direction (Hovy et al. Reference Hovy, Lin, Zhou and Fukumoto2006). While a pyramid represents what aspects of the content in a document cluster are predicted to appear in novel human summaries of the same material, it does not provide an explanatory model. In early work, we observed that SCUs of lower weight tended to be entailed by SCUs of higher weight (Passonneau and Nenkova Reference Passonneau and Nenkova2003). Investigating the semantic relations among SCUs, and between SCUs and the source documents, could lead to a more explanatory model, and thus open up the possibility of a more fully automated approach to content evaluation in summaries.
7 Related work
Large-scale NLP evaluations began with the third Message Understanding Conference in 1990, which involved fifty systems (Chinchor, Hirschman and Lewis Reference Chinchor, Hirschman and Lewis1993). The so-called system bakeoffs that followed instigated a need for evaluation methods and metrics, and tools to facilitate or replace human evaluation. A major step forward in the direction of increased automation took place in the machine translation community, with the proposal of several metrics including BLEU (Papenini et al. 2001) based on various types of ngram matching of target sentences with multiple model sentences (e.g. Doddington Reference Doddington2002; Turian, Shen and Melamed Reference Turian, Shen and Melamed2003). All depend on calibration with human judgments. The major stumbling block to applying similar methods for summarization evaluation has been that collecting reliable human judgments of summaries has been notoriously difficult, due to the nature of summarization (Mani et al. Reference Mani, Klein, House, Hirschman, Firmin and Sundheim2002; Nenkova Reference Nenkova2005; Nenkova et al. Reference Nenkova, Vanderwende and McKeown2006) in contrast to MT (Rath, Resnich and Savage Reference Rath, Resnick and Savage1961; Carlson et al. Reference Carlson, Conroy, Marcu, O'Leary, Okurowski, Taylor and Wong2001; Lin and Hovy Reference Lin and Hovy2002). In Nenkova and Passonneau (Reference Nenkova and Passonneau2004), we observed that an earlier manual evaluation method for summarization used in DUC 2003 yielded random results. Previous work on assessing summarization evaluation methods (Jing et al. Reference Jing, Barzilay, McKeown and Elhadad1998) found that recall and precision were highly sensitive to summary length. In addition, recall and precision have been found to be less robust than measures such as relative utility, and content-based metrics such as word overlap, cosine similarity, and longest common subsequence (Radev et al. Reference Radev, Teufel, Saggion, Lam, Blitzer, Qi, Celebi, Liu and Drabek2003).
The pyramid method factors the process of collecting human judgments of content overlap into two steps: first, identifying and weighting an emergent set of content units that covers a set of model summaries; second, determining which among those units is expressed in a novel peer summary. Besides the positive assessment results presented here, two observations argue for the benefits of the approach embodied in the pyramid method. First, the most widely used approach to automated summarization evaluation that began with ROUGE (Lin and Hovy Reference Lin and Hovy2002) has recently evolved towards an automated approach of identifying and weighting so-called basic elements (Hovy, Lin and Zhou Reference Hovy, Lin and Zhou2005; Hovy et al. Reference Hovy, Lin, Zhou and Fukumoto2006) that seems directly inspired by the pyramid method; the authors suggest that their approach could be applied to automating the manual methods of pyramid analysis and factoid analysis (van Halteren and Teufel Reference van Halteren and Teufel2003; Teufel and van Halteren Reference Teufel and van Halteren2004).
A similar type of manual content annotation of summaries, factoid annotation (van Halteren and Teufel Reference van Halteren and Teufel2003; Teufel and van Halteren Reference Teufel and van Halteren2004), has been found to be highly reliable for highly trained annotators, although in work reported elsewhere (Nenkova et al. Reference Nenkova, Passonneau and McKeown2007) we estimate their method for computing interannotator reliability to inflate the results by approximately 5 per cent. Factoid annotation reliability has not been evaluated for untrained annotators, nor applied to multi-document summarization, nor used for large-scale system evaluations.
8 Conclusion
Evaluation is an arena where engineering disciplines necessarily draw on the scientific method and conduct controlled experiments with careful attention to statistical inference. Evaluation of evaluation methods can be done on theoretical grounds, as in two critiques (Hone and Graham Reference Hone and Graham2001; Hajdinjak and Mihelic Reference Hajdinjak and Mihelic2006) of the PARADISE method for evaluating dialogue systems, or empirical ones, as in Chung and Lee (Reference Chung and Lee2001), which compares half a dozen term association measures on multiple large corpora, or Forman (Reference Forman2003), which compares feature selection metrics for weighting bag-of-words document representation. Here we have used a combination of controlled experiments and analysis of independently collected datasets, hence with partly controlled variables, to conduct a formal and functional assessment of the pyramid method. The formal assessment addressed whether the annotation processes for peer and pyramid annotation seem to capture similarities and differences in content across summaries. Multiple ways of asking this question yielded positive results. Application of the same method to an entirely distinct domain (Passonneau, Goodkind and Levy Reference Passonneau, Goodkind and Levy2007) with similarly high agreement results offers confirmatory evidence of a different sort.
The functional assessment asked whether the method leads to robust system evaluations. Comparison of results of analysis of variance using data from different annotations indicates that the choice of annotator for the pyramids or peers has no impact on the ranking of systems. Power analyses indicate that relatively few document sets are needed to rank systems under a variety of evaluation parameters.
The distinction between formal and functional assessment resembles the contrast between intrinsic versus extrinsic system evaluations introduced by Sparck Jones and Galliers (Reference Sparck Jones and Galliers1993). An intrinsic or black box evaluation assesses the validity of the components of a system; our formal evaluation assesses the reliability of an annotation method and the consistency of scores across annotators. An extrinsic evaluation assesses the impact of a system in performing some task; our functional evaluation asks what impact various conditions of an evaluation have on the ability of the method to identify system differences. Just as both types of assessment are needed to judge the utility of natural language processing systems, I would argue that both types of assessment are needed to weigh the benefits of an evaluation method. While there is no need for a single evaluation method to do well on both dimensions, there are clear benefits when a single evaluation method does so.