As of 2016 private pension funds managed over $38 trillion in assets worldwide, which represents about one-third of the world's investable assets.Footnote 1 Despite their economic importance, there is still much to learn about pension fund investment performance and the impact of the regulatory environment. Ferson (Reference Ferson2010) points out to challenges regarding data quality, such as the return history and portfolio holdings, and different investment regulation across countries and over time. Also, most of the existing evidence comes from developed countries like the USA (Andonov et al., Reference Andonov, Bauer and Cremers2012) and the UK (Blake et al., Reference Blake, Lehmann and Timmermann1999) with regulatory environments which are very different from other markets. For instance, in ‘multi-fund’ systems individuals can choose among a small number of diversified funds whereas pension fund managers have considerable leeway in deciding each fund's asset allocation (within the regulatory constraints). These regulatory differences affect the identification of feasible benchmarks needed to determine the different performance sources.
Previous research on investment performance of institutional investors that invest globally is inconclusive. The evidence for US equity shows that institutions as a whole hold the market portfolio (Lewellen, Reference Lewellen2011) and alphas are indistinguishable from zero (Busse et al., Reference Busse, Goyal and Wahal2010). The results for asset classes outside the USA are more mixed. Gerakos et al. (Reference Gerakos, Linnainmaa and Morse2017) find that actively managed institutional accounts outperformed strategy benchmarks, a result that is mostly driven by global fixed income. Dyck et al. (Reference Dyck, Lins and Pomorski2013) find that asset managers investing in emerging markets and Europe achieved abnormal returns. In global equity markets, Gallagher et al. (Reference Gallagher, Harman, Schmidt and Warren2017) find that asset managers produce abnormal returns but Busse et al. (Reference Busse, Goyal and Wahal2014) do not find evidence of positive alphas. The differences in the results of these studies arise because they consider different data sets, relying mostly on proprietary or survey data.
We study whether Chilean pension funds managers beat benchmarks that replicate their asset allocations based on indices and low-cost investable funds during the multi-fund period (January 2003 through December 2017). Our data allow us to overcome the challenges pointed out by Ferson (Reference Ferson2010) considering a very different regulatory context. We use monthly returns and aggregate portfolio holdings for all pension funds available in Chile during this period. These data are of good quality and is publicly available from the regulator. More broadly, our extension to the traditional style analysis (Sharpe, Reference Sharpe1992) is useful to evaluate the performance of investors in small countries that invest globally, taking into account their use of currency hedging and regulatory constraints.
To study performance we need to consider the regulatory restrictions. During the last two decades, there have been three major changes to the Chilean pension system's investment regulation. First, in 2002 they implemented a ‘multi-fund’ scheme,Footnote 2 whereby individuals can choose only one or two out of the five fund types managed by Chilean pension funds (AFPs from their acronym in Spanish). These funds go from ‘aggressive’ (Type A) to ‘conservative’ (Type E). Second, the aggregate foreign investment limit was increased from 20% to 80% between 2002 and 2011.Footnote 3 AFPs implement their investment abroad essentially using mutual funds and exchange traded funds (ETFs), whereas local investments are implemented mostly ‘in-house’. Third, the regulatory environment imposed minimum currency hedging requirements between 2002 and 2010. To the best of our knowledge, currency hedging has not been explicitly addressed in previous studies of pension fund performance.
Another particular feature of the Chilean pension system which is also likely to affect performance is that the industry is highly concentrated with only five to six players operating over the last 15 years. For each fund type, the returns are highly correlated across AFPs, and prior studies have found evidence of herding (Olivares, Reference Olivares2008; Raddatz and Schmukler, Reference Raddatz and Schmukler2013; Fernandez, Reference Fernandez2014).
Our empirical approach assumes that a local (institutional) investor could replicate the broad asset allocation of existing pension funds based on publicly available information. We use two sets of benchmarks. We label the first one Coarse: it is based on lagged reported aggregate portfolio weights combined with four broad asset class benchmarks: local equity, local fixed income, foreign equity, and foreign fixed income. We also add currency hedging, complying with the minimum required by the regulation. For our second set of benchmarks, we develop an extension of the traditional return-based style analysis (Sharpe, Reference Sharpe1992), considering the fraction of foreign investment that is hedged back to local currency, which is a novel aspect of this study. In addition, the asset-class benchmarks in this second exercise include a broader set of well-known indices and low-cost investable funds for equity (USA, World ex-USA, and emerging markets) and fixed income (USA, Europe, and high yield) that were available to institutional investors during our sample period. For local investments we only consider indices that are representative of investable equity and fixed income securities. Low-cost funds are not available because pension funds are too large relative to the local capital market.Footnote 4
One of our main findings is that the average returns of pension funds are not statistically different from our Coarse and return-based style benchmarks using indices or low cost mutual funds for foreign investments, for all fund types at the aggregate (value-weighted) and also at the AFP level. We measure the contribution of tactical asset allocations by examining the difference between in-sample and rolling return-based style estimates. We find no gains from tactical asset allocation.
Our point estimates for the selection returns coming from the return-based style analysis are negative and insignificant for most funds, but these estimates do not consider the effects of taxes or the inevitably higher transaction costs of non-US investment vehicles that would avoid paying US withholding taxes (Khorana et al., Reference Khorana, Servaes and Tufano2008). Most of the low-cost investable funds that we use as references are domiciled in the USA, and are subject to a 30% withholding tax on distributions. Considering the potential effects of taxes, our results indicate that the point estimates of pension funds' selection returns are close to zero in this more realistic setting.
In our context, we find that currency hedging in general increases the volatility, skewness, and kurtosis of the riskier fund types, producing marginally higher returns. We also note that considering currency hedging in the style analysis has a major impact on estimated portfolio weights and selection returns. Prior studies have not explicitly considered this (Walker and Iglesias, Reference Walker, Iglesias, Hinz, Rudolph, Antolin and Yermo2010; Fernandez, Reference Fernandez2014). We show that our methodology produces portfolios that better replicate the Chilean multi-funds (with higher in- and out-of-sample R 2s), giving more accurate asset allocation and selection return estimates.
Our style analysis also allows us to understand pension fund performance during the 2008 crisis, finding a very large negative relative return for the riskier funds with respect to the Coarse benchmarks. This difference is mainly driven by a large exposure to emerging market equity, to excess currency hedging (above the regulatory requirement), to selection (residual) returns, and to local equity, in that order.
This study complements prior research on the investment performance of Chilean pension funds (Walker, Reference Walker1993a, Reference Walker1993b; Walker and Iglesias, Reference Walker, Iglesias, Hinz, Rudolph, Antolin and Yermo2010), providing new evidence related to the effects of currency hedging and regulatory restrictions, extending the sample period, analyzing individual pension funds by type, and considering more asset class benchmarks. Since we decompose the returns into Coarse benchmark returns, value added by tactical asset allocations (rolling style), and value added by securities or external manager selections (in the spirit of Gerakos et al., Reference Gerakos, Linnainmaa and Morse2017), we generalize the previous findings and are able to give a more comprehensive explanation of pension fund performance and their return sources.
Also, consistent with the literature on herding by pension fund managers in Chile (Raddatz and Schmukler, Reference Raddatz and Schmukler2013; Fernandez, Reference Fernandez2014) and abroad (Lakonishok et al., Reference Lakonishok, Shleifer and Vishny1992; Blake et al., Reference Blake, Sarno and Zinna2017), we find that most pairwise correlations among AFP returns for the five fund types take values of about 0.99. We complement this evidence by showing a similar evolution in estimated portfolio composition by fund type and by showing the similarities (high correlations) of fund style and selection returns among different managers. Our return-based style analysis shows that the estimated degree of overlapping of asset classes is large (about 80% to 90%), although the estimated asset-class weights are always significantly different between AFPs for all possible pairwise comparisons and each fund type. We also find several cases in which pairwise differences in average returns between AFPs are statistically significant, with an average pairwise absolute difference per month of 2.9 basis points and a maximum of 7.8 basis points across all fund types. These differences are explained by selection rather than style returns. Overall, this evidence provides a more nuanced view of herding behavior compared with previous studies.
Our variance ratio tests for different return measures and all fund types show significant mean reversion, implying that traditional risk-adjusted measures of performance can be misleading (Leibowitz, Reference Leibowitz1987; Sharpe and Tint, Reference Sharpe and Tint1990; Campbell and Viceira, Reference Campbell and Viceira2001, Reference Campbell and Viceira2002). For instance, Viceira and Wang (Reference Viceira and Wang2018) find an increase in the cross-country correlations due to discount rate shocks, which means that global shocks are at least partially mean-reverting. Since the traditional mean-variance analysis is inadequate in this case, we take an eclectic stand on the difficult question of determining optimal portfolios in the context of an emerging market-based investor that manages a long-term pension fund portfolio. However, we do control for risk factors (in- and out-of-sample) to the extent that they are reflected in the different asset-class returns and in the (static and rolling) portfolios' sensitivities to these asset classes.
In the line of Goyal and Wahal (Reference Goyal and Wahal2008) and Blake (Reference Blake2013), our results also contribute to the literature on delegated portfolio management. This point may be important since AFPs are allowed to charge the mutual fund fees they invest in (indirectly) to the pension funds, whereas for local direct investment expenses, they are not. From a statistical standpoint, our results indicate that security and manager selection generate sufficient returns to compensate for these fees and also other transaction costs, such as withholding taxes (as in Gerakos et al., Reference Gerakos, Linnainmaa and Morse2017).
Further, since Roll (Reference Roll1992) we have known that minimizing the tracking error volatility (the variance in the difference between portfolio and benchmark returns) may not produce more efficient managed portfolios (Admati and Pfleiderer, Reference Admati and Pfleiderer1997; Jorion, Reference Jorion2003). Local pension funds have no exogenous benchmarks and they herd. Therefore, in this context, the average portfolio is in some sense the benchmark, but this benchmark is adrift. The literature indicates that institutional herding may arise because institutions infer information from each other's trades, follow the same signals, face reputational costs from deviating, follow fads, or are attracted to securities with similar characteristics (e.g., Graham, Reference Graham1999; Nofsinger and Sias, Reference Nofsinger and Sias1999; Sias, Reference Sias2004; Villatoro, Reference Villatoro2009; Blake et al., Reference Blake, Sarno and Zinna2017). In any case, herding combined with a benchmark that is adrift can lead to extremely risky portfolios if not constrained by regulation, as pointed out in Walker (Reference Walker2008a). Finally, our results are consistent with a leader-follower story, herding, care about tracking error, and with AFPs following momentum-based strategies. This combination may lead to risky portfolios, such as those that preceded the liquidity crisis, which we document.
1. Institutional context
In 1980, Chile was one of the early adopters of a fully funded mandatory defined-contribution system.Footnote 5 Workers in the formal sector contribute 10% of their monthly taxable income to their individual retirement accounts. These accounts are managed by single-purpose private pension fund administrators (AFPs from their acronym in Spanish). The main services provided by AFPs are collecting individual contributions, managing individual retirement accounts, granting and managing pension benefits, purchasing disability insurance, and managing the pension fund's investments. Chilean workers are free to choose among the existing AFPs to manage their pension savings. They can also switch between the funds managed by an AFP and also from one AFP to another at no monetary cost.
The pension fund industry has become the largest private investor in Chilean capital markets. As of December 2017, they managed funds worth USD 208 billion, which represented 71% of the country's GDP. The ‘Multi-Fund Law’ of 2002 limits the investment choices available to individuals to five funds that are labeled with the letters A (aggressive) through E (conservative).Footnote 6 The main goal of these funds is to provide diversified portfolios supposedly tailored to investors' risk preferences. Fund A is the riskiest, while Fund E is the safest. Individuals are free to choose any of these funds, otherwise they are assigned to a default option based on their age.Footnote 7
Investment regulation of pension funds adopts a rule-based approach. It includes detailed quantitative limits on the fraction that each fund can invest in broad asset classes (equity and fixed income), exposure to foreign assets, currency hedging of foreign investments, and diversification rules such as the maximum concentration and ownership of assets issued by individual companies and business groups. In order to differentiate the risk level of pension funds, the regulation limits the maximum and minimum fraction of equity that each fund type can invest in. As of December 2017, the fraction of equity for Fund A has to be between 40% and 80%, 25% and 60% for Fund B, 15% and 40% for Fund C, 5% and 20% for Fund D, and up to 5% for Fund E. In addition, the equity exposure of a riskier fund has to be greater than the exposure of less risky funds. In general, pension funds tend to use the maximum allowed investment in equity.
Pension fund managers are also subject to a minimum reserve requirement (MRR) that is equivalent to 1% of the assets they manage in each fund. These reserves have to be invested in the same pension funds their affiliates do. The main purpose of these reserves is to comply with a minimum return requirement with respect to their peers. Specifically, in the case of Funds A and B (C, D, and E), the average difference in annualized returns with respect to an average of their peers over a period of 36 months cannot be lower than 4% (2%). If those limits are exceeded, AFPs must compensate their clients using their MRR.
The allowed share of foreign investments increased sharply after the Multi-Fund Law (Figure 1). In 2002, the maximum exposure for the sum of all pension funds invested abroad was 20% but increased progressively to 80% in 2011, which is the current limit. As of October 2008, the regulatory framework established specific additional limits by fund: 65% of Fund A could be invested abroad, 50% of Fund B, 40% of Fund C, 20% of Fund D, and 10% of Fund E. These fund limits also increased progressively to 100%, 90%, 75%, 45%, and 35% in September 2011, respectively, which are the current investment limits. Almost all of the funds' foreign investment has been delegated to mutual funds, ETFs, and occasionally via mandated institutional accounts. In contrast, most local investment is implemented in-house through direct investments in equity and fixed income securities.
Foreign investment limits by fund and global. This figure presents the evolution of the maximum exposure to foreign investments allowed for AFPs both in aggregate (Global) and for each fund type. Prior to September 2008, AFPs only had to meet the aggregate limit.

In order to address the currency risk of foreign investments, the regulation has imposed hedging requirements. Table 1 presents limits with the maximum unhedged fraction of each portfolio, which is expressed as a proportion of each fund's total assets. For example, this limit was 40% for Fund A in December 2003. Since 50% of this fund was invested in local assets (which are considered to be expressed in local currency), to complete the maximum of 40% unhedged, the minimum hedging requirement was 10% of the fund or 20% of the amount of foreign investment. The maximum limit to unhedged investments is tighter for the safer funds, but increased over time until April 2009. Since November 2010, the government has eliminated the limits to currency hedging, except for investment grade bonds.
Maximum unhedged proportion allowed by the regulation

This table presents the maximum unhedged fraction of each pension fund allowed by the investment regulatory regime. This limit is expressed as a proportion of each fund's total assets (local and foreign).
Source: Authors' elaboration with data from the Central Bank of Chile.
2. Data and methodology
2.1 Pension fund returns
Using data from the Chilean Superintendence of Pensions, we compute the monthly returns of pension funds (r it) as the growth rate of the month-end share values (valores cuota) for each fund type offered by each AFP. Delegated management feesFootnote 8 and taxes paid for foreign investments are charged to the pension funds so their returns are net of these transaction costs.Footnote 9 Thus, these returns represent the monthly percentage change in the value of individual pension savings in each fund type in the absence of additional contributions. However, these returns do not consider the fees directly paid by individuals to pension fund managers. Table 2 presents the statistics for the value-weighted monthly returns that are aggregated for each fund type during our sample period (January 2003–December 2017).Footnote 10 Return averages and standard deviations increase with the fund's risk. Furthermore, all funds have negative skewness, excess kurtosis, and highly non-normal returns. This result is stronger for the riskier funds and is mostly associated with the subprime crisis.
Descriptive statistics of monthly pension fund returns

This table presents the statistics for the monthly returns (January 2003–December 2017) of the aggregate (value-weighted) pension fund returns for each fund type. The returns are in local currency (CLP). The data are from the Chilean Superintendence of Pensions.
2.2 Asset-class benchmarks
We consider a comprehensive set of indices and low-cost investable funds (mutual funds and ETFs) that cover a broad set of global equity and fixed income during our sample period. For global equity we consider the MSCI All Country World Index. We also consider more granular indices that are representative of equity in developed markets (MSCI World), the USA (Russell 3000), developed markets ex-USA (MSCI World ex-USA), and emerging markets (MSCI Emerging Markets). As a global bond index, we consider the Bloomberg Barclays Multiverse Total Return Index. We also consider bond return indices for the USA (Bloomberg Barclays US Bonds), Euro Government (Bloomberg Barclays Euro Government Bonds), and global high yield (Bloomberg Barclays Global High Yield). One shortcoming of using indices is that they do not consider transaction costs. Passive portfolios need to deal with securities that are issued or repurchased, reinvest stock dividends and bond coupons, and other events that entail portfolio rebalancing. Since this trading can be costly for passive investors (Pedersen, Reference Pedersen2018), we also use investable funds (mutual funds and ETFs) that incur these costs. Table 3 presents the statistics for their monthly returns in local currency during our sample period. All indices and tradable funds include the value of reinvested dividends.
Descriptive statistics of asset-class benchmarks

This table presents the descriptive statistics for the monthly returns of the indices and low-cost funds considered as asset-class benchmarks. All indices include the return of reinvested dividends and other distributions. There are no low-cost investable funds for local investments because pension funds are too large relative to the size of the local capital market, so we only use local indices in this case. The return of Vanguard World equity (*) is the simple average return of Vanguard US Equity and Vanguard World Equity ex-USA. The return of Vanguard World Bonds (**) is the simple average return of Vanguard US Bonds and iShares Euro Govt. Bond Index Fund. Since institutional shares were unavailable for World Equity ex-USA, we consider Admiral Shares. Prior to the inception of institutional shares of Vanguard Emerging Equity in June 2006 there were no institutional or Admiral Shares. In this case we consider investor shares. All returns are in local currency (CLP). The data are from Vanguard, Blackrock, and Bloomberg.
Further, most of these tradable funds are Vanguard index funds, except for the European Government Bonds that we consider an ETF from Blackrock. Although this choice is somewhat arbitrary, we consider the fact that Vanguard is one of the least costly alternatives to holding diversified portfolios, and for some indices there were no other low-cost investable funds available during our sample period.Footnote 11
For investments in local assets we only use market indices since pension funds are too large relative to the size of the local capital market.Footnote 12
Next, we estimate the returns to currency hedging (z) as the difference between the returns on local short-term government bonds and borrowing at the US interbank rate, which is measured in local currency. As an alternative, we also use quotes from over the counter (OTC) transactions.
2.3 Empirical model and implementation
Our approach is to evaluate the financial performance of pension fund returns that is based on the idea that a local (institutional) investor can replicate the broad asset allocation of AFPs based on publicly available information. Specifically, the following model attempts to explain a pension fund's observed returns with a replicating portfolio that an emerging market-based investor forms to invest both in local and global assets while implementing a currency hedging strategy:
 $$r_{it} = \alpha _{it} + \mathop \sum \limits_l w_{il\comma t-k}\cdot r_{lt} + \mathop \sum \limits_g w_{ig\comma t-k}\cdot r_{gt} + h_{i\comma t-k}\cdot z_t + \varepsilon _{it}$$
where r it is the monthly return in the local currency of fund ‘i’ in a given month ‘t’, α it is the selection return, w ilt−k (w igt−k) is the weight of the local (foreign) asset-class benchmark ‘l’ (‘g’) in the fund's portfolio estimated with information up to t − k, r lt (r gt) is the monthly return of the local (foreign) asset-class benchmark, h it is the fraction of foreign investments that is currency hedged back to the local currency, z t is the monthly return of this currency hedging strategy, and ɛit is an error term. The return that is associated with asset allocation (or style) is determined by  $\sum\nolimits_l {w_{il\comma t-k}\cdot r_{lt} + } \sum\nolimits_g {w_{ig\comma t-k}\cdot r_{gt} + h_{i\comma t-k}\cdot z_t} $. All returns of foreign benchmarks are expressed in local currency (CLP) using the corresponding exchange rate.
2.3.1 Coarse benchmarks
Our first approach to estimating the weights of equation (1) is based on the actual aggregate portfolio holdings provided in the monthly reports published by the Superintendence of Pensions. Specifically, the portfolio weights of equation (1) (w lt−k and w gt−k) are computed as 4-month lagged holdings (k = 4) of aggregate pension funds on the following broad asset classes: local equity, local fixed income, foreign equity, and foreign fixed income.Footnote 13 We drop the subscript i since we use the same benchmark for all managers within a fund type. The use of currency hedging (h t−k) is calculated as the ‘minimum’ regulatory hedging requirement for international investments described in Section 3. This choice is based on the fact that currency hedging increases the volatility of emerging market-based investors that invest in global equity (Walker, Reference Walker2008b; Campbell et al., Reference Campbell, Serfaty-De Medeiros and Viceira2010). We then map these weights into the broad asset-class indices presented above (IPSA, Local Bonds, MSCI All Country World, Bloomberg Barclays Multiverse) and the return of a currency hedge (USD to CLP).
In addition, we also implement a Coarse Benchmark strategy that is based on low-cost investable funds as asset-class benchmarks for foreign investments: Vanguard World Equity and Vanguard World Bonds. As discussed earlier, we do not consider local investable funds because they do not really exist, given the large size of pension funds relative to the local capital markets.
2.3.2 Style analysis à la Sharpe (Reference Sharpe1992)
The second approach to estimate the weights of equation (1) is based on an extension of Sharpe's (Reference Sharpe1992) return-based style analysis that allows for currency hedging. Specifically, we consider the following empirical model:
 $$r_{it} = \alpha _{it} + \mathop \sum \limits_l w_{il\comma t}\cdot r_{lt} + \mathop \sum \limits_g w_{ig\comma t}\cdot r_{gt} + h_{i\comma t}\cdot z_t + \varepsilon _{it}$$
where
 $$w_{il} = \displaystyle{{\exp \lpar {b_{il}} \rpar } \over {\mathop \sum \nolimits_l \exp \lpar {b_{il}} \rpar + \mathop \sum \nolimits_g {\rm exp}\lpar b_{ig}\rpar }}$$
 $$w_{ig} = \displaystyle{{\exp \lpar {b_{ig}} \rpar } \over {\mathop \sum \nolimits_l \exp \lpar {b_{il}} \rpar + \mathop \sum \nolimits_g {\rm exp}\lpar b_{ig}\rpar }}$$
 $$h_i = \left({\mathop \sum \limits_g \displaystyle{{\exp \lpar {b_{ig}} \rpar } \over {\mathop \sum \nolimits_l \exp \lpar {b_{il}} \rpar + \mathop \sum \nolimits_g {\rm exp}\lpar b_{ig}\rpar }}} \right)\cdot \left({\displaystyle{{{\rm exp}\lpar b_{ih}\rpar } \over {1 + {\rm exp}\lpar b_{ih}\rpar }}} \right)$$
The b il, b ig, and b ih are parameters to be estimated for each fund type ‘i’. In order to have a unique solution to this problem, we must set one of the parameter values to be constant, so we set b i1 = 0.
Further, equations (2b) and (2c) ensure that the portfolio weights associated with asset-class benchmarks (w lt, w gt) are nonnegative and add up to one. Our extension of Sharpe's version is the constraint (2d), which measures the extent of currency hedging h i, which is nonnegative and less than or equal to the fraction of the portfolio invested abroad. The model is estimated by nonlinear least squares.
Using this extended version of Sharpe's return-based style analysis, we estimate two separate benchmark returns. The first benchmark (in-sample) considers a fixed set of portfolio weights that best fit equation (2a) and its parametric constraints (2b)–(2d) in the sample considered. The second benchmark (rolling) portfolio weights estimated with 36-month rolling windows to weight asset-class returns one month ahead. In other words, the portfolio weights used in month t corresponds to the weights estimated with 36 months of data up to t − 1.
3. Results
This section first presents the aggregate results by fund type. We only present these results because the results for the different managers are relatively similar. Second, we present the specific results by manager.
3.1 Asset allocations
Table 4 provides an overview of the average asset allocation of each fund type in four periods: 2003–07, 2008–12, 2013–17, and the full sample as reported by the Superintendence of Pensions. We can highlight four facts. First, the average fraction invested in equity in the full sample decreases monotonically when moving from type A funds to type E. For example, Fund A invests 77% in equity, Fund C invests 39%, and Fund E invests 2%. Second, the ratio of equity to fixed income within each fund type is remarkably stable over our sample period. Third, the average exposure to foreign assets decreases with the fund's risk from 65% in Fund A (57% in equity and 8% in bonds), 32% in Fund C (23% equity and 10% bonds), to 5% in Fund E (1% equity and 4% bonds). Fourth, we observe a strong substitution of local for foreign assets over time, especially for the riskier funds. Comparing the first and last 5 years of the sample, we find that the share of foreign assets increases by 23 percentage points (from 54% to 77%) for Fund A, 17 percentage points (from 24% to 41%) for Fund C, and 3% (from 5% to 8%) for Fund E. The patterns observed in Funds B and D are always in between their neighboring types.
Pension fund reported average portfolios

This table presents the aggregate (value-weighted) portfolio holdings of each pension fund type on local equity, local fixed income, foreign equity, and foreign fixed income over 2003–17. The data are from the monthly reports published by the Superintendence of Pensions.
One limitation of these monthly reports is that they do not provide information on the exposure to more detailed asset classes, currency hedging, or the corresponding returns. To overcome this, we extend Sharpe's (Reference Sharpe1992) return-based style analysis to estimate the exposures to broad asset classes and to the use of currency hedging based on pension fund data and asset-class benchmarks. Table 5 presents the estimations of the average exposure to different asset classes that best explain the returns for each fund type in the three subperiods: 2003–07, 2008–12, and 2013–17. The results are presented only for the fund-based asset-class benchmarks described above, since they are very similar when using indices instead. All specifications have reasonable fits with R 2s that range from 0.71 to 0.98. The weight of local equity has been relatively stable over time for all funds, and their magnitudes are consistent with the administrative data on holdings. We also estimate a steady increase in foreign investments, which is consistent with the regulatory changes that progressively relaxed the limits for investing abroad. In addition, we observe a transition from emerging market equity and high yield bonds to global equity in the latter part of the sample period. Further, the currency hedging disappears in the last 5 years of the full sample period. This is also consistent with the elimination of the currency hedging requirements for foreign investments in equity and high yield debt and with the remaining currency hedging restrictions being nonbinding.
Return-based asset-class weight estimates

This table presents the estimated portfolio weights from regressions where the dependent variable in each panel is the aggregate (value-weighted) pension fund return for Funds A, C, and E. The explanatory variables are the set of low-cost funds considered as asset-class benchmarks described in Table 3. The regressions are estimated by nonlinear least squares as described in Section 2. The asterisks ***, **, and * indicate coefficients that are statistically significant at the 1%, 5%, and 10% levels, respectively.
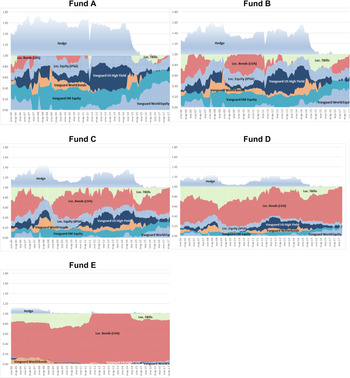
Figure 2 shows the evolution of the estimated rolling portfolio weights for the available sample period. Here our sample begins in January 2006, given the 36-month window needed for the first estimation. We only present the results for low-cost, fund-based regressions because the results for index based regressions are similar. The area above one corresponds to the estimated currency hedging component. As expected, hedging appears larger than the minimum required by law. Further, the results also show that in this regard the regulatory changes are reflected in the estimates with a lag.
Estimated rolling portfolio weights (2006–17). This figure presents the 36-month return-based rolling estimated portfolio weights of aggregate (value-weighted) pension funds over 2006–17. Portfolio weights are estimated by nonlinear least squares as described in Section 2. The low-cost funds considered as asset class benchmarks are described in Table 3.

In addition, Figure 2 shows that until 2013, investment in equity was largely in emerging markets and local. Also, between 2006 and 2013 (and especially between 2012 and 2013), high yield bonds represented a large fraction of the total investment. We observe an increase in the fraction of global equity only starting in 2014. The changing relative importance of local bills and bonds evolves similarly across funds, which probably reflects the evolution of the expected future interest rates and market timing attempts.
3.2 Performance of aggregate value-weighted pension funds
Our approach to evaluating financial performance is based on the idea that any (institutional) investor could have estimated the broad asset allocation of pension funds using lagged holdings data and also with benchmarks based on our extended version of the return-based style analysis (Sharpe, Reference Sharpe1992) that allows for currency hedging. Table 6 presents the summary statistics for the monthly differences between the returns of aggregate value-weighted pension funds and these benchmarks. For brevity, the results are only reported for Funds A, C, and E using the low cost funds as benchmarks. The returns of the Coarse benchmarks are obtained using the 4-month lagged holdings of aggregate pension funds on local equity, local fixed income, foreign equity, and foreign fixed income with currency hedging estimated as the ‘minimum’ regulatory hedging requirement for international investments. We also consider benchmarks constructed using Sharpe's style analysis. In-sample estimates are obtained from the full sample, and rolling estimates are based on the 1-month lagged estimates of the 36-month rolling windows. The Coarse and rolling selection returns as well as their reported R 2s are estimated out-of-sample.
Monthly differences between pension fund and benchmark returns 2006–17

This table presents the summary statistics for the monthly differences between the returns of aggregate value-weighted pension funds and the three benchmarks: Coarse, Sharpe's style in-sample, and Sharpe's style rolling. The Coarse estimates are obtained from the 4-month lagged holdings of the aggregate pension funds on local equity, local fixed income, foreign equity, and foreign fixed income; with currency hedging estimated as the ‘minimum’ regulatory hedging requirement for international investments. The portfolio weights of Sharpe's style benchmarks are obtained from nonlinear least squared estimates of equation (2) as described in Section 2. The asset-class benchmarks considered are the low-cost funds described in Table 3. In-sample estimates are obtained from the full sample, and rolling are based on the 1-month lagged estimates of the 36-month rolling windows. As opposed to in-sample estimates, Coarse and rolling selection returns as well as their R 2s are estimated out-of-sample. In the case of in-sample estimates, the medians, standard deviations, min, max, skewness, and kurtosis refer to the constant plus the regression's in-sample error term.
We find that the weighted average pension funds do not have returns statistically different from their benchmarks for all our specifications and asset-class benchmarks. There are no major differences between specifications based on the low-cost investable funds and indices for our asset-class benchmarks, which is why we present only the former. The point estimates are negative for Funds A–D and positive for Fund E. These differences are larger (in absolute value) for the riskier funds. In addition, the average differences in returns with respect to the Coarse benchmarks (in absolute value) are smaller than the selection return estimates using Sharpe's style analysis. However, the Coarse specifications have lower R 2s (out-of-sample), because they do not include foreign investments in emerging market equity or high yield bonds, which are relevant to explaining pension fund returns, especially between 2008 and 2012, and also because these benchmarks comply exactly with the minimum hedging requirement, whereas AFPs hedged their foreign investments by an amount close to the allowed maximum until 2012.
A comparison of the in-sample and rolling estimates allows us to determine the contribution of selection and tactical asset allocation to pension fund returns. We interpret the difference between in-sample and rolling return estimates as the result of tactical asset allocation.
We find that the average Fund A has selection returns of minus 10 basis points per month, Fund B equals minus 7, Type C equals minus 3, Type D equals minus 1, and Type E equals 2 basis points per month. The rolling estimates show that there were no additional returns from the tactical asset allocation. The estimated effect of tactical asset allocation for Funds B and C are on average of 3 and 2 basis points per month, respectively, but Fund D loses an average of 1 basis point per month.
In unreported results, the decomposition of the total returns between the style and selection returns for each AFP indicates that none of the selection returns are significant. In absolute terms, they tend to be negative, especially for the fund types with more foreign investment. For the less risky funds, although still insignificant, the results are more mixed, since there are managers with positive and negative selection returns. We find that no AFP has selection returns significantly different from zero when considering the coarse or rolling-style benchmarks.
Figure 3 presents the ratio between the cumulative return of each pension fund relative to the three low-cost fund-based benchmarks (Coarse, and Sharpe's style in-sample and rolling). Overall, Sharpe's style replicating portfolios provide good estimates of the cumulative return of the different fund types, especially for risky funds during the subprime crisis. Prior to the financial crisis, the cumulative returns of Funds A and B were higher relative to their return-based style benchmarks. However, the relative return of these pension funds decreased up to 2012. For Funds C, D, and E, we observe more stable patterns that are consistent with more investment in local fixed income, and also cumulative returns similar to the Coarse benchmarks.
Value-weighted fund cumulative returns vs. benchmarks. This figure presents the ratio between the cumulative value of the pension fund shares relative to the three benchmarks considered in this paper: Coarse, in-sample style return, and cumulative rolling-style returns. Coarse estimates are obtained from 4-month lagged holdings of the aggregate pension funds on local equity, local fixed income, foreign equity, and foreign fixed income; with currency hedging estimated as the ‘minimum’ regulatory hedging requirement for international investments. Style benchmarks are obtained from nonlinear least squares estimates of equation (1), as described in Section 2. In-sample weights are obtained from the full sample, and rolling weights are based on the 1-month lagged estimates of the 36-month rolling windows. As opposed to in-sample weights, Coarse and rolling selection returns are estimated out-of-sample.

3.3 Currency hedging
In this subsection, we analyze the relevance of considering currency hedging in our econometric specification. Indeed, one could argue that since the return of our hedging variable depends on local and foreign interest rates, it could be partially captured by the weights of our fixed income benchmarks. In Table 7 we tackle this issue by comparing the average estimated 36-month rolling portfolio weights with a specification that imposes the coefficient associated with currency hedging to be equal to zero (h i,t = 0) for each fund type. There are major differences in the average adjusted R 2s in the rolling regressions for Funds A and B where the average drops from 83% to 70% and 82% to 77%, respectively. Allowing for currency hedging also has a major impact on estimated portfolio weights. For instance, in the case of Fund A we observe sharp decreases in the estimates of the portfolio weights for the US High Yield (from 19% to 0%), World Bonds (from 7% to 0%), World Equity (from 16% to 11%) that is compensated by an increase in local bills (from 3% to 17%), and Emerging Market Equity (from 30% to 38%). These differences are smaller for the safer pension funds because they are mostly invested in local assets and hedge less. In addition, we also observe that currency hedging affects the point estimates of the selection returns. Indeed, not accounting for currency hedging increases the selection returns by 12 basis points (bp) per month in Fund A, 6 bp in Fund B, 4 bp in Fund C, and 3 bp in Fund D. Overall, our results show that specifying currency hedging is not innocuous for style analysis and performance evaluation.
The importance of specifying currency hedging

This table presents the average return-based portfolio weights that are estimated with the 36-month rolling windows from equation (2) for each fund type. The columns labeled as ‘Hedge’ and ‘No hedge’ indicate whether the specification includes a parameter that accounts for currency hedging. The asset-class benchmarks considered are the low-cost funds described in Table 3 and the estimation is described in Section 2. Fund, style, and selection returns are monthly averages for the period January 2006–December 2017. The adj.-R 2 is the simple average of the adjusted R 2s that are estimated in each rolling regression.
Prior studies that evaluate pension fund performance using replicating portfolios for Chilean pension funds do not explicitly consider currency hedging in their specifications. For instance, Fernandez (Reference Fernandez2014) constructs a benchmark based on the idea of our ‘Coarse Benchmark’ strategy without considering currency hedging. Walker and Iglesias (Reference Walker, Iglesias, Hinz, Rudolph, Antolin and Yermo2010) conduct a style analysis similar to ours but in practice they set our hedging coefficient to be equal to zero(h i,t = 0). Thus, not accounting for the differences in our asset class benchmarks, their results would be similar to the columns labeled as ‘No-Hedge’ in Table 7. Compared to these studies, our methodology produces portfolios that better replicate the Chilean multi-funds (with higher R 2s) and produce more accurate estimates of their asset allocation and selection returns.
2.3.1 Financial crisis
As mentioned, using data prior to the liquidity crisis, Walker (Reference Walker2008b) finds that for emerging market-based investors who invest in global equity, currency hedging increases the volatility of their returns, which happens because, in general, emerging market currencies depreciate when equities have negative returns (and vice versa), providing a partial natural hedge.
By law, AFPs had to hedge a fraction of their foreign investment back into local currency. Our results also show that a large fraction of the portfolio is exposed to local and emerging market equity. We wish to decompose the return sources during the year 2008, given the significantly negative pension fund returns during the crisis, not only in absolute terms but also against the Coarse benchmarks. The previous subsection shows that the rolling-style analysis is able to replicate the returns during the crisis, so we can use these estimates.
Table 8 presents the monthly contribution of the different asset classes to the 2008 returns. We concentrate on Fund A's weighted average returns and compare them with the unhedged and hedged Coarse benchmarks described earlier. We use the fund-based rolling-style estimates of the portfolio weights. The sum of the monthly returns in 2008 was minus 38.5%. The unhedged and hedged Coarse benchmarks had equivalent returns of minus 16.7% and minus 17.9%, respectively, less than half Fund A's loss. The largest contribution to Fund A's negative return was emerging market equity (−18%), followed by currency hedging (−11.3%), the residual selection return (−7.5%), and local equity (−4.6%), which was partly compensated with global bonds (+4.2%). Therefore, currency hedging explains a large fraction of that year's loss.
Asset-class return contributions to Fund A during 2008

This table presents the monthly contribution to the total return of Fund A during 2008. The contributions are the fund-based rolling-style estimates of portfolio weights times the monthly return of each fund. The Coarse estimates are obtained from the 4-month lagged holdings of aggregate pension funds on local equity, local fixed income, foreign equity, and foreign fixed income. Currency hedging for the Coarse benchmarks are estimated as the ‘minimum’ regulatory hedging requirement for international investments. The Coarse Unhedged estimates assume there is no currency hedging.
The analyses of Funds B and C are not presented since they show similar patterns, although they are mitigated by the lower proportion that is invested in foreign equity and the lower currency hedging.
To check whether our results are driven by estimation error, especially regarding currency hedging, we check the information that the Superintendence of Pensions publishes periodically and look at the fraction of the total amount that is invested abroad that is hedged. During 2008, this fraction was significantly larger than the minimum required by regulation. In the case of Fund A, the fraction of the total portfolio that was hedged back to local currency during 2008 fluctuated between 30% and 45%, whereas the minimum required hedging went from 3% to 14%. Due to the depreciation of the local currency during the crisis, the excess hedging meant a lower return of nearly 9.3% in 2008, which is in line with our estimates.Footnote 14 This result also partly explains the subsequent evolution of hedging requirements in the local pension fund regulation.
3.4 Performance differences at the AFP level
Here we analyze return differences between AFPs using the return-based style analysis of each AFP based only on fund-based benchmarks for foreign investments. As before, we use the 36-month rolling weights, so the out-of-sample style and selection returns can only be estimated for the period of 2006–17. As noted above, the selection returns obtained by the AFPs are statistically insignificant for all fund types. However, given that for each fund type all pairwise returns are highly correlated (with most values above 0.99) we are able to find significant differences. Table 9 shows that the maximum average differences in pairwise returns between AFPs range from 4.8 (Fund A) to 7.6 (Fund E) basis points per month. The average absolute difference in pairwise returns across all fund types is 2.9 basis points. There is one AFP with significantly larger returns than most of the rest during this sample period. Our results show that most of these significant differences are driven by selection returns. Overall, even though selection returns are not significant in absolute terms, we do observe significant differences between managers in total returns, selection returns, and in some cases, in style returns.
Return differences between AFPs

This table presents the pairwise differences (rows minus columns) in the AFPs' monthly fund returns and the 1-month ahead (out-of-sample) style and selection returns for all fund types over 2006–17. The portfolio weights of style returns are obtained from nonlinear least squared estimates of equation (1) that use the 36-month rolling windows as described in Section 2. The asset-class benchmarks considered are the low-cost funds described in Table 3. Test statistics (in parenthesis) are calculated with HAC robust standard errors. ***, **, and * indicate that portfolio weights are statistically significant at the 1%, 5%, and 10% levels, respectively.
3.5 Herding
To further study herding, for each fund type we check whether estimated portfolio weights differ between AFPs at the asset-class level. We perform pairwise tests for the equality between the portfolios' compositions by running the following regression:
 $$r_{it}-r_{\,jt} = \alpha _{ij} + \sum\limits_l {b_{lij}} \cdot r_{lt} + \sum\limits_g {b_{gij}} \cdot r_{gt} + h_{ij}\cdot z_t + \eta _{ijt}$$
In this case we do not have to restrict the coefficients to being positive, since they represent differences in asset-class weights, but we must impose the constraint  $\sum\nolimits_l {b_{lij}} + \sum\nolimits_g {b_{gij}} = 0$, which is not applicable to the hedging component. The hypothesis is tested with a Wald test
 $H_0{\kern 1pt} \colon b_{lij} = b_{gij} = h_{ij} = 0$, for each pair i ≠ j and for every asset-class, l, g. We use the base specification with low-cost funds (World Equity, EM Equity, High Yield Bonds, and Global High Grade Bonds), local indices (short- and long-term bonds and local equity) plus the hedging component described earlier. We do not present these results because it turns out the we can reject the equality hypothesis for all pairs and all sample periods (2003–07, 2008–12, and 2013–17) with high significance levels. The highest observed p-value is 2.7%, and all the rest are below 1%. Therefore, from a statistical standpoint, we cannot state that asset-class weights have been the same for any pair of AFPs for any fund type.
However, whether these differences are economically significant is still a question. To study this, we compute a modified version of active share measures (ASM) developed by Cremers and Petajisto (Reference Cremers and Petajisto2009) that uses the estimated pairwise differences in portfolio weights. These authors implement their measure more precisely at the individual security level with respect to exogenous benchmarks, but we can do so only at the asset-class level. Results are presented in Table 10. In general, despite being significantly different, the ASMs show high levels of pairwise overlapping portfolios at the asset-class level. For the first sample period, the average overlap (1 − ASM) is 87.5% for type A funds that reduces to 81% during the middle sample period (the period that includes the crisis), to end up at 93% for the latest. For the other fund types we observe similar patterns. The minimum overlap (68%) is observed for the pair Cuprum-Planvital for Fund A in the middle sample period and the maximum overlap is observed between Capital and Habitat for Fund D in the latest sample period (97.3%). Overall, these results constitute new evidence of herding, albeit more nuanced since we do find significant differences in asset allocations and returns.
Pairwise active share estimates

This table presents the pairwise active share estimates of the portfolio weight differences between AFPs. This measure of active share is based on a modified version by Cremers and Petajisto (Reference Cremers and Petajisto2009), which is computed as  $\lpar \;1/2\rpar \left({\sum\nolimits_l {\vert {b_{lij}} \vert + } \sum\nolimits_g {\vert {b_{gij}} \vert } } \right)+ \vert {h_{ij}} \vert $, where b lij, b gij, and h ij measure the differences in portfolio weights and currency hedging between AFPs i and j for a given fund type. These parameters are nonlinear least squares estimates from the following regression:
 $\;r_{it}-r_{jt} = \alpha _{ij} + \sum\nolimits_l {b_{lij}\cdot r_{lt} + } \sum\nolimits_g {b_{gij}\cdot r_{gt} + h_{ij}\cdot z_t + \eta _{ijt}} $, subject to the constraint
 $\sum\nolimits_l {b_{lij}} + \sum\nolimits_g {b_{gij} = 0} $. The asset-class benchmarks considered are the low cost funds described in Table 3.
4. Discussion and robustness checks
In this section, we summarize our findings and discuss what theories are consistent with the evidence.
4.1 Performance
Selection returns are never significantly different from zero in any of our specifications. However, beyond statistical significance, the return-based style analysis finds insignificant negative selection returns of about minus 10 basis points per month for the weighted average of type A funds, which is the most extreme result and quite large in absolute terms. Considering the return differences between AFPs, the range for Fund A goes from minus 6 to minus 12 basis points per month.
With respect to the local asset classes, most of the investment is done directly by the AFPs. Since they are large relative to the local market, we conjecture that in secondary markets they may have to trade at a disadvantage with respect to smaller investors which makes beating the benchmarks harder. However, in primary markets for stocks and bonds (IPOs, SEOs, or bond issues), because of their size they may have advantages. We cannot say a priori which of the two forces dominates.
Turning to the foreign low-cost investment vehicles, our analysis does not consider the tax effects of investing in US mutual funds for a foreign investor. Chilean investors face a 30% withholding tax on most distributions made by US mutual funds. Table 11 reports the annualized return differences for Vanguard funds, assuming a 30% withholding tax on their distributions with respect to the pre-tax returns considered in our analysis. In the case of the Irish-based government bond fund there are no withholding taxes. Using our estimated asset-class weights, we find that the lower returns due to withholding taxes go from 74 to 140 basis points per year (an average of 8.4 basis points per month). The lower return for passive low-cost investments of about 100 basis points per year due to withholding taxes is well within the range of the estimation error.Footnote 15 Naturally, AFPs could reduce these taxes by investing in mutual funds based in tax havens, but these funds charge larger fees, as shown in Khorana et al. (Reference Khorana, Servaes and Tufano2008). In any case, our results show that the point estimate of the difference between average pension fund returns and realistic benchmarks accounting for taxes and inevitable transaction costs is close to zero.
Estimated withholding tax effects on low cost fund returns

This table presents the estimated cumulative cost of withholding taxes. The withholding tax rate is 0% for the Irish-based BARGVBD and 30% for US-based Vanguard funds. Of the distributions, 100% and 70% are reinvested at the ex-distribution NAV, respectively. The cost of withholding taxes is estimated as the annualized difference between the after-tax cumulative return and the observed return. The withholding tax cost of Vanguard World Equity (*) is the simple average return of Vanguard US Equity and Vanguard World Equity ex-USA. The withholding tax cost of Vanguard World Bonds (**) is the simple average return of Vanguard US Bonds and iShares Euro Govt. Bond Index Fund. The tax effect is a weighted average return of withholding taxes using Sharpe's in-sample portfolio weights that are reported in Table 6.
One can also question our proxy for the currency hedging returns, in particular, whether AFPs can borrow at the US interbank rate. Since AFPs are large players in the local market, their transaction costs in forward contracts are likely to be low, which is why we used that proxy. An alternative is to use the actual return of a one-month currency forward contract, using end-of-month bid prices as reported in Bloomberg. Bloomberg has several price providers and registers the last quotes of the day. The Forward price used is the closing (USDCLP) exchange rate plus the reported forward bid spread at the end of each month. We did not use this source initially since this is an OTC market which at times may be illiquid, where different AFPs may face different conditions. Specifically, this return is obtained as  $\;{z}^{\prime}_t = \lpar F_{t-1}-S_t\rpar /S_{t-1}$, where F t−1 is the one month forward bid price of one dollar and S t is the spot price in pesos of one dollar at the end of month t.
 ${z}^{\prime}_t$ is highly correlated with our proxy (around 0.99) and using it reduces the style return of the risky fund (A) by 6 basis points per month (thus increasing the selection return by the same amount) which is within the range of our estimation error.
4.2 Adjustments for risk
Another issue is whether we should use some kind of risk adjustment to assess performance, beyond the replicating portfolio methods used here. We do control for risk factors (in- and out-of-sample) to the extent that they are reflected in the different asset-class returns and in the (static and rolling) portfolio sensitivities to these asset classes. However, our analysis takes an eclectic stand on the difficult question of what determines optimal portfolios in the context of an emerging market-based investor who manages a long-term pension fund portfolio, which is why we do not consider any further risk adjustments. In light of the long-term asset allocation literature, short-term volatility and the different related statistics are not necessarily useful, especially in the presence of mean-reverting shocks (Viceira and Wang, Reference Viceira and Wang2018). The most extreme results are observed during the crisis. The extent to which negative returns are caused by discount rate shocks (therefore being mean-reverting) is debatable, but we can look at variance ratio tests of random walks (Lo and MacKinlay, Reference Lo and MacKinlay1988) for pension fund returns. Table 12 reports the variance ratio test statistics and their corresponding p-values applied to monthly fund returns and one month ahead (out-of-sample) style and selection returns for all aggregate (value-weighted) fund types over 2006–17. The results show the presence of significant mean reversion in total, style, and selection returns for all pension fund types. The 24-month annualized variance is between 5% and 7% of the short-term variance. This is true for the three return measures and for all fund types. Consistent with the long-term asset allocation literature, this result means that short-term risk measures are inappropriate for judging performance.
Variance ratio tests

This table presents the variance ratio tests and their corresponding p-values that are applied to the monthly fund returns and 1-month ahead (out-of-sample) style and selection returns for all aggregate (value-weighted) fund types over 2006–17. The portfolio weights of Sharpe's style benchmarks are obtained from nonlinear least squared estimates of equation (1) that use the 36-month rolling windows according to the method described in subsection 2.3.2. The asset-class benchmarks considered are the low-cost funds that are described in Table 3. The approximate p-values are obtained using the studentized maximum modulus with infinite degrees of freedom. Fund types B and D are excluded since they show patterns which are similar to the average of the adjacent fund types'.
4.3 Asset allocation during the financial crisis
A third issue is what caused the portfolio composition up to the liquidity crisis. We have argued that short-term, volatility-related risk measures are not useful in this context, but we can still ask why the pre-crisis portfolio had such an asset allocation, with almost no investment in global equity, a large investment in emerging market equity, and currency hedging well beyond the minimum required by law. Investment in local equity is presumably explained by historical reasons: after the creation of the multi-fund system, local equity had to be assigned to the different fund types, and pension fund holdings are large relative to trading volumes making it difficult (and risky, from a tracking error perspective) to alter that portfolio significantly.
A possible hypothesis is that the AFPs made progressive small bets in order to control tracking error, since these bets would be enough to gain places in return rankings. However, Roll (Reference Roll1992) shows that this behavior may not produce more efficiently managed portfolios. Further, Walker (Reference Walker2008a) shows that local pension funds have no exogenous benchmarks and tend to herd, which means that the average portfolio in some sense is the benchmark, but this benchmark is adrift. The benchmark is presumably influenced by the leaders' decisions, by random asset-class shocks, and by possible momentum or trend-following strategies. These factors imply that pension fund portfolios can become extremely risky and subject to momentum crashes if not constrained by the regulation (Daniel and Moskowitz, Reference Daniel and Moskowitz2016). Establishing causality to determine whether this behavior holds true is difficult. The over-weights at least are consistent with a trend-chasing behavior. For example, the cumulative relative return of investing in local bills relative to investing at the US Interbank rate unhedged was an additional 80% between December 2002 and March 2008. For the same period, investing in emerging market equity relative to global equity added an extra 113%. We also estimate an increase in developed market equity toward the end of the sample period. Between December 2009 and December 2017, developed markets added 60% more than emerging markets. Therefore, we cannot prove causality, but the evidence is compelling.
Another issue is whether the return-based style analysis provides meaningful results compared to a holding-based analysis. Each choice has advantages and disadvantages. Given the issue of declared versus estimated benchmarks, misreporting the true benchmarks by the fund managers chosen by the AFPs may lead to wrong selection return estimates, which does not necessarily happen when using a return-based style analysis if we use a large enough number of benchmarks (Sharpe, Reference Sharpe1992; Gerakos et al., Reference Gerakos, Linnainmaa and Morse2017). The evident disadvantage is estimation error. Despite obtaining relatively high in-sample and out-of-sample R 2s, we may be omitting relevant asset classes and priced risk factors. Therefore, the two approaches may be complementary. In this study, we choose the first approach.
4.4 Herding
Finally, we do find significant return differences between AFPs for different funds, especially for selection returns. We also find that statistically, all asset allocations are not equal. These findings give credit to Villatoro's story of leaders and followers (Villatoro, Reference Villatoro2009), where leaders cause the changes in the average portfolios.
It is reasonable to expect some degree of herding behavior for systems with similar regulation and characteristics (small number of players and quantitative limits). Thus, requiring explicit investment policies by regulators (as in Chile, Colombia, Mexico and Peru, among others) will be redundant, since the actual benchmarks for performance are the competitors' portfolios. In this context, a prudent person approach of complying with the own investment policy is unlikely to be effective in terms of limiting risk. By the same token, imposing exogenous benchmarks to judge performance will be useless, unless there are explicit penalties in the case of underperformance, in which case the incentives to search for better performing asset classes or managers are curtailed.
5. Conclusion
To study the investment performance of Chilean pension funds, we extend the return-based style analysis developed by Sharpe (Reference Sharpe1992) by explicitly considering regulatory restrictions and the use of currency hedging.
Our analysis considers low-cost mutual funds and ETFs among the asset-class benchmarks, allowing us to internalize the effects of unavoidable transaction costs, including taxes. We find that during the multi-fund period (2003–17), the average returns of pension funds were statistically similar to our return-based style benchmarks, also finding no gains from tactical asset allocation. This finding is important because it means that, at least statistically, fund manager and security selection produced sufficient returns to cover transaction costs, delegated management fees, and taxes.
We use two types of benchmarks. First, the Coarse benchmarks, which are based on lagged aggregate portfolio holdings and four asset classes (local and global equity, local and global bonds). These weights are combined with low-cost, fund-based returns. The second type of benchmarks comes from a return-based rolling-style analysis (Sharpe, Reference Sharpe1992) where we use a wider array of low-cost fund returns. In each case, our econometric specification considers currency hedging, which is a novel aspect of this study that significantly affects performance results. Indeed, accounting for currency hedging produces portfolios that better replicate the Chilean multi-funds (with higher R 2s) and more accurate estimates of their asset allocation and selection returns. We also confirm that in the context of an emerging market based investor currency hedging increases volatility and the probability of large negative returns.
We further examine pension fund performance during the crisis of 2008 and find a very large negative return for the riskier funds relative to the Coarse benchmarks (twice for Fund A). Our style analysis allows us to conclude that this return is caused principally by an asset allocation with a large exposure to emerging market equity, to excess currency hedging, to selection (residual) returns, and to local equity, in that order.
For individual pension funds, we find that none of them have selection returns significantly different from zero when considering the coarse benchmarks and the fixed-sample or rolling-style benchmarks. However, when we look at return differences between managers, we often do find statistically significant differences that are explained by selection rather than style returns. Also, while the return correlations between AFPs are above 0.99, supporting the idea of herding, we do find statistically significant differences in the relative importance of asset-class weights for all possible pairwise comparisons. However, the estimated degree of overlapping among asset classes is still large (about 80% to 90%). The above constitutes new evidence of herding, albeit more nuanced, since there are significant differences among managers' asset allocations and returns.
Overall, our results show that active investment by Chilean AFPs (through mutual funds for foreign investments and ‘in house’ for local investments) has resulted in returns which are not significantly different from those of investing in low cost investment vehicles using similar broad asset allocations, but the significant return differences between AFPs indicate that selecting managers with active strategies may be a source of value, in line with the performance evidence for institutional investors that invest outside the USA (Dyck et al., Reference Dyck, Lins and Pomorski2013; Gallagher et al., Reference Gallagher, Harman, Schmidt and Warren2017; Gerakos et al., Reference Gerakos, Linnainmaa and Morse2017). These results suggest that if new regulation happened to require all investment abroad to take place via passive low-cost investment vehicles, it would imply foregoing the potential gains from active investment by a few managers. This lesson may be important for countries with similar pension systems to the one studied here which are likely to gradually ease the limits to investing abroad.
Furthermore, given our results regarding performance and herding, another possible policy lesson for a system such as the Chilean one is that only a modest number of players may be necessary in order to achieve competition in returns and to reduce fees due to greater economies of scale. Low-cost managers may be able to successfully compete against the rest in terms of performance by following simple replication strategies with low-cost vehicles, such as the one implemented here.Footnote 16
Broadly speaking, our results are consistent with a leader-follower story, herding, care about tracking error, and with momentum-based strategies. This combination may lead to risky portfolios, such as those that preceded the liquidity crisis. Although these results can be explained by competition and herding, they are also driven by the investment regulation that is based on quantitative investment limits (which is the case of countries with multi-fund systems). One problem with this approach is that within each category we may find very different asset classes. For example, within foreign fixed income we can find high yield and high grade bonds, and in the case of equity, frontier markets, emerging markets, developed markets and all of the corresponding risk factors identified in the literature (Fama and French, Reference Fama and French2017). Therefore, this regulatory approach is not enough to mitigate risk. One policy lesson arising from this analysis is that risk should be limited in terms of exposure to risk factors which are ‘relevant’ in the context of long-term asset allocation. Short-term volatility is not among them, given evidence of significant mean reversion in total, style, and selection returns for all pension fund types, implying that short-term risk measures such as the VaR and CVaR (which are used in Mexico, for example) are inappropriate tools for limiting risk in this context.
Acknowledgement
We thank Felipe Aldunate, Arturo Cifuentes, Carlos Hinojosa, Borja Larrain, Francisco Marcet, Javier Marshall, Gonzalo Maturana, Julio Riutort, Herve Roche, Jorge Sabat, seminar participants at Fordham University (Gabelli School of Business), Universidad Catolica del Uruguay and Universidad Adolfo Ibanez for helpful comments and discussion. We thank Carlos Hinojosa for excellent research assistance. We also appreciate the comments and suggestions of two anonymous referees and the Editor. All remaining errors are ours.