1 Introduction
What is a flow maximising heat transfer? We have explored an answer to this naive question. For buoyancy-driven convection, i.e. Rayleigh–Bénard convection, the maximal heat transfer has been discussed for more than half a century (Malkus Reference Malkus1954; Howard Reference Howard1963; Busse Reference Busse1969). Kraichnan (Reference Kraichnan1962) has predicted the asymptotic scaling of the Nusselt number
 $Nu$
with the Rayleigh number
 $Ra$
as
 $Nu\sim Ra^{1/2}$
with a logarithmic correction for very high
 $Ra$
. In 1990s, a new variational approach called ‘the background method’ was invented by Doering & Constantin (Reference Doering and Constantin1992), and the method has triggered remarkable advancements in rigorous upper bounds on the Nusselt number
 $Nu$
(Doering & Constantin Reference Doering and Constantin1996; Kerswell Reference Kerswell2001; Otero et al.
Reference Otero, Wittenberg, Worthing and Doering2002; Plasting & Kerswell Reference Plasting and Kerswell2003; Doering, Otto & Reznikoff Reference Doering, Otto and Reznikoff2006; Whitehead & Doering Reference Whitehead and Doering2011, Reference Whitehead and Doering2012). In these theoretical works, rigorous upper bounds, e.g.
 $Nu-1\leqslant 0.02634Ra^{1/2}$
(Plasting & Kerswell Reference Plasting and Kerswell2003), have been derived at
 $Ra\gg 1$
. The ‘ultimate’ scaling
 $Nu\sim Ra^{1/2}$
corresponds to the Taylor law of energy dissipation in high-Reynolds-number turbulence. It has not been demonstrated as yet what flow structure achieves the ultimate scaling
 $Nu\sim Ra^{1/2}$
. Recently, meanwhile, Hassanzadeh, Chini & Doering (Reference Hassanzadeh, Chini and Doering2014) have numerically maximised a wall heat flux within a two-dimensional velocity field bounded by two parallel plates with a constant temperature difference. They formulated a variational problem to find a velocity field maximising heat transfer under the constraint of fixed total enstrophy, and found optimal states consisting of an array of large-scale convection rolls for free-slip boundary conditions. The maximal scaling is represented by
 $Nu\sim Ra^{5/12}$
, corresponding to the rigid upper bound derived by the background method for free-slip conditions (Whitehead & Doering Reference Whitehead and Doering2011, Reference Whitehead and Doering2012). For no-slip conditions, on the other hand, the velocity fields numerically optimised within a two-dimensional field also exhibit large-scale circulation rolls, and the found scaling is
 $Nu\sim Ra^{0.37}$
(Souza Reference Souza2016). Such scalings observed in the two-dimensional optimal states are quite distinct from the ultimate scaling
 $Nu\sim Ra^{1/2}$
. The scalings observed by both Hassanzadeh et al. (Reference Hassanzadeh, Chini and Doering2014) and Souza (Reference Souza2016) cannot also persist asymptotically at high Péclet number
 $Pe$
(corresponding to high
 $Ra$
) because, as Tobasco & Doering (Reference Tobasco and Doering2017) rigorously proved, the scaling of two-dimensional flow should be given by
 $Ra^{1/2}$
with logarithmic corrections, and hence their found states cannot be optimal asymptotically.
In this paper, we consider the variational problem first examined by Hassanzadeh et al. (Reference Hassanzadeh, Chini and Doering2014) for free-slip conditions and then by Souza (Reference Souza2016) for no-slip conditions; however, we extend the search range for optimal states to a three-dimensional velocity field. We report three-dimensional optimal states capable of achieving the ultimate scaling, and discuss the optimised flow structures. In order to satisfy the Navier–Stokes equation the optimised divergence-free vector field needs an external body force which is distinct from buoyancy, but hereafter we refer to it as a ‘velocity’ field.
2 Formulation
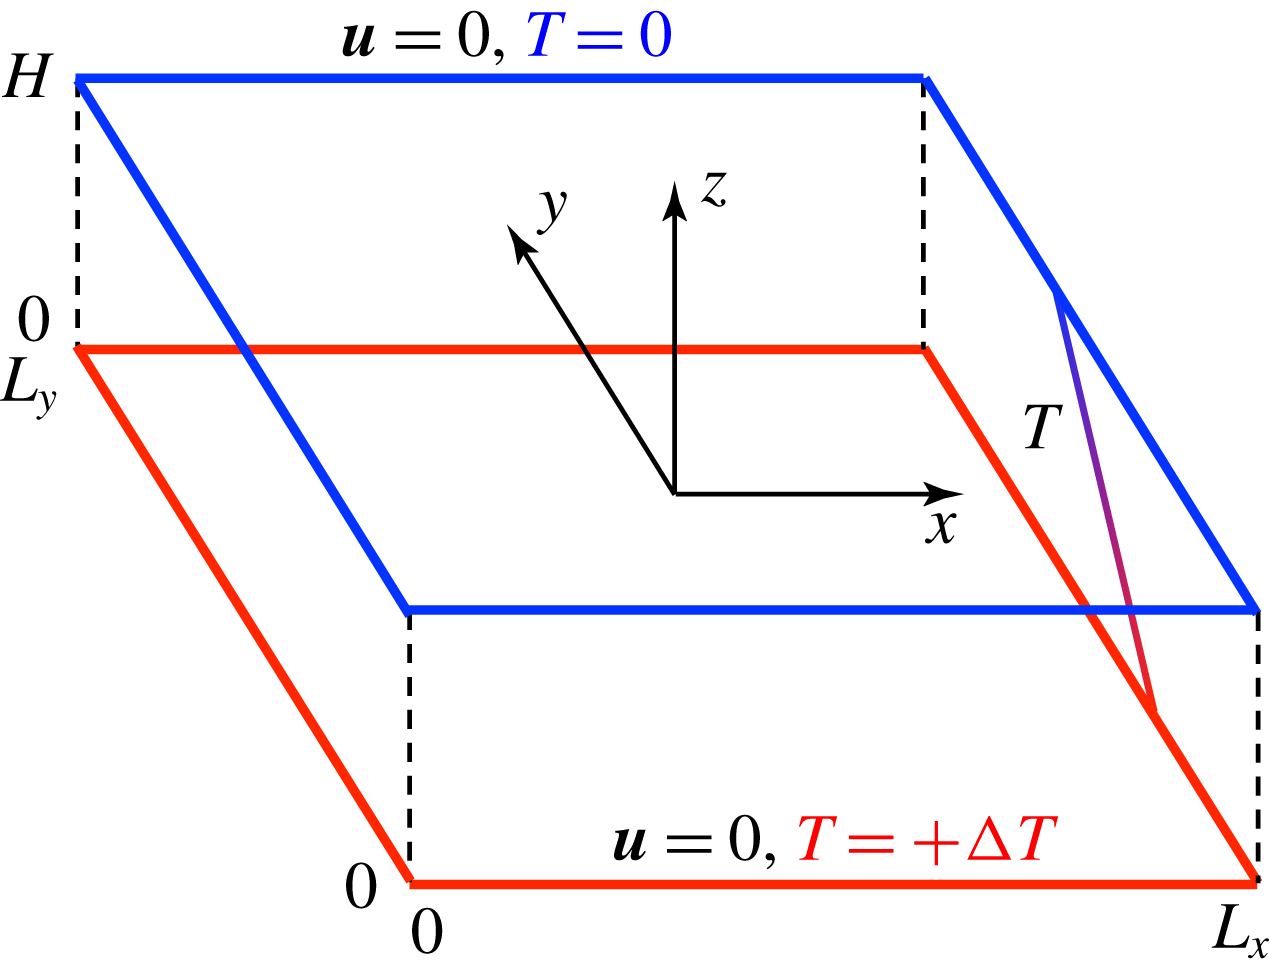
Let us consider heat transfer in a three-dimensional, time-independent and incompressible velocity field between two parallel plates,
 $\boldsymbol{u}^{\prime }(x^{\prime },y^{\prime },z^{\prime })=u^{\prime }\boldsymbol{e}_{x}+v^{\prime }\boldsymbol{e}_{y}+w^{\prime }\boldsymbol{e}_{z}$
, satisfying the continuity equation
 $$\begin{eqnarray}\unicode[STIX]{x1D735}^{\prime }\boldsymbol{\cdot }\boldsymbol{u}^{\prime }=0,\end{eqnarray}$$
where a prime
 $(\cdot )^{\prime }$
represents a dimensional variable, and
 $\boldsymbol{e}_{x}$
and
 $\boldsymbol{e}_{y}$
are mutually orthogonal unit vectors in the wall-parallel directions while
 $\boldsymbol{e}_{z}$
is a unit vector in the wall-normal direction. The configuration of the velocity and temperature fields is shown in figure 1. The two parallel plates are positioned at
 $z^{\prime }=0$
and
 $z^{\prime }=H$
, and the domain of the flow is periodic in the
 $x^{\prime }$
- and
 $y^{\prime }$
-directions with periods
 $L_{x}^{\prime }$
and
 $L_{y}^{\prime }$
. The upper (or lower) wall surface is held at lower (or higher) constant temperature
 $T^{\prime }=0$
(or
 $T^{\prime }=\unicode[STIX]{x0394}T>0$
). We suppose that the temperature field
 $T^{\prime }(x^{\prime },y^{\prime },z^{\prime })$
is determined as a solution to an advection–diffusion equation
 $$\begin{eqnarray}(\boldsymbol{u}^{\prime }\boldsymbol{\cdot }\unicode[STIX]{x1D735}^{\prime })T^{\prime }=\unicode[STIX]{x1D705}\unicode[STIX]{x1D6FB}^{\prime 2}T^{\prime },\end{eqnarray}$$
supplemented by the boundary conditions
 $$\begin{eqnarray}\displaystyle \boldsymbol{u}^{\prime }(z^{\prime }=0)=\boldsymbol{u}^{\prime }(z^{\prime }=H)=\mathbf{0};\quad T^{\prime }(z^{\prime }=0)=\unicode[STIX]{x0394}T,\quad T^{\prime }(z^{\prime }=H)=0, & & \displaystyle\end{eqnarray}$$
where
 $\unicode[STIX]{x1D705}$
denotes a thermal diffusivity. The strength of the velocity field is measured by the Péclet number
 $Pe$
, defined, in terms of the total enstrophy (or the averaged square of velocity gradient tensor), as
 $$\begin{eqnarray}Pe=\frac{\langle |\unicode[STIX]{x1D74E}^{\prime }|^{2}\rangle ^{1/2}H^{2}}{\unicode[STIX]{x1D705}}=\frac{\langle |\unicode[STIX]{x1D735}^{\prime }\boldsymbol{u}^{\prime }|^{2}\rangle ^{1/2}H^{2}}{\unicode[STIX]{x1D705}},\end{eqnarray}$$
where
 $\unicode[STIX]{x1D74E}^{\prime }=\unicode[STIX]{x1D735}^{\prime }\times \boldsymbol{u}^{\prime }$
,
 $|\unicode[STIX]{x1D735}^{\prime }\boldsymbol{u}^{\prime }|^{2}=\unicode[STIX]{x1D735}^{\prime }\boldsymbol{u}^{\prime }\boldsymbol{ : }\unicode[STIX]{x1D735}^{\prime }\boldsymbol{u}^{\prime }$
and
 $\langle \cdot \rangle$
is a volume average. The wall-normal convective heat transfer is characterised by the Nusselt number, defined as the ratio of the convective heat flux to the conductive heat flux,
 $$\begin{eqnarray}Nu=1+\frac{\langle w^{\prime }T^{\prime }\rangle }{\unicode[STIX]{x1D705}\unicode[STIX]{x0394}T/H}.\end{eqnarray}$$
Configuration of the velocity and temperature fields.

In this study, we explore a three-dimensional velocity field maximising
 $Nu$
for fixed
 $Pe$
. The constrained optimisation is relevant to the maximisation of the objective functional
 $$\begin{eqnarray}\displaystyle \displaystyle {\mathcal{F}}=\left\langle w\unicode[STIX]{x1D703}-\unicode[STIX]{x1D703}^{\ast }(\boldsymbol{x})\left[(\boldsymbol{u}\boldsymbol{\cdot }\unicode[STIX]{x1D735})\unicode[STIX]{x1D703}-\unicode[STIX]{x1D6FB}^{2}\unicode[STIX]{x1D703}-w\right]+p^{\ast }(\boldsymbol{x})\left(\unicode[STIX]{x1D735}\boldsymbol{\cdot }\boldsymbol{u}\right)+\frac{\unicode[STIX]{x1D707}}{2}\left(Pe^{2}-|\unicode[STIX]{x1D735}\boldsymbol{u}|^{2}\right)\right\rangle & & \displaystyle\end{eqnarray}$$
(see Hassanzadeh et al.
Reference Hassanzadeh, Chini and Doering2014), where
 $p^{\ast }(\boldsymbol{x})$
,
 $\unicode[STIX]{x1D703}^{\ast }(\boldsymbol{x})$
and
 $\unicode[STIX]{x1D707}$
are Lagrange multipliers. The variables in (2.6) have been non-dimensionalised as
 $$\begin{eqnarray}\displaystyle \boldsymbol{x}=\frac{\boldsymbol{x}^{\prime }}{H},\quad \unicode[STIX]{x1D703}=\frac{\unicode[STIX]{x1D703}^{\prime }}{\unicode[STIX]{x0394}T},\quad \boldsymbol{u}=\frac{\boldsymbol{u}^{\prime }}{\unicode[STIX]{x1D705}/H},\quad p^{\ast }=\frac{{p^{\ast }}^{\prime }}{\unicode[STIX]{x1D70C}\unicode[STIX]{x1D705}^{2}/H^{2}},\quad \unicode[STIX]{x1D703}^{\ast }=\frac{{\unicode[STIX]{x1D703}^{\ast }}^{\prime }}{\unicode[STIX]{x0394}T}, & & \displaystyle\end{eqnarray}$$
where
 $\unicode[STIX]{x1D70C}$
is the constant mass density of the fluid and
 $\unicode[STIX]{x1D703}=T-(1-z)$
is a temperature fluctuation about a conductive state. Stationary points of
 ${\mathcal{F}}$
are determined by the Euler–Lagrange equations
 $$\begin{eqnarray}\displaystyle & \displaystyle \frac{\unicode[STIX]{x1D6FF}{\mathcal{F}}}{\unicode[STIX]{x1D6FF}\boldsymbol{u}}\equiv -\unicode[STIX]{x1D735}p^{\ast }+\unicode[STIX]{x1D703}\unicode[STIX]{x1D735}\unicode[STIX]{x1D703}^{\ast }+\unicode[STIX]{x1D707}\unicode[STIX]{x1D6FB}^{2}\boldsymbol{u}+(\unicode[STIX]{x1D703}+\unicode[STIX]{x1D703}^{\ast })\boldsymbol{e}_{z}=\mathbf{0}, & \displaystyle\end{eqnarray}$$
 $$\begin{eqnarray}\displaystyle & \displaystyle \frac{\unicode[STIX]{x1D6FF}{\mathcal{F}}}{\unicode[STIX]{x1D6FF}\unicode[STIX]{x1D703}}\equiv (\boldsymbol{u}\boldsymbol{\cdot }\unicode[STIX]{x1D735})\unicode[STIX]{x1D703}^{\ast }+\unicode[STIX]{x1D6FB}^{2}\unicode[STIX]{x1D703}^{\ast }+w=0, & \displaystyle\end{eqnarray}$$
 $$\begin{eqnarray}\displaystyle & \displaystyle \frac{\unicode[STIX]{x1D6FF}{\mathcal{F}}}{\unicode[STIX]{x1D6FF}\unicode[STIX]{x1D703}^{\ast }}\equiv -(\boldsymbol{u}\boldsymbol{\cdot }\unicode[STIX]{x1D735})\unicode[STIX]{x1D703}+\unicode[STIX]{x1D6FB}^{2}\unicode[STIX]{x1D703}+w=0, & \displaystyle\end{eqnarray}$$
 $$\begin{eqnarray}\displaystyle & \displaystyle \frac{\unicode[STIX]{x1D6FF}{\mathcal{F}}}{\unicode[STIX]{x1D6FF}p^{\ast }}\equiv \unicode[STIX]{x1D735}\boldsymbol{\cdot }\boldsymbol{u}=0, & \displaystyle\end{eqnarray}$$
 $$\begin{eqnarray}\displaystyle & \displaystyle \frac{\unicode[STIX]{x2202}{\mathcal{F}}}{\unicode[STIX]{x2202}\unicode[STIX]{x1D707}}\equiv \frac{1}{2}\langle Pe^{2}-|\unicode[STIX]{x1D735}\boldsymbol{u}|^{2}\rangle =0. & \displaystyle\end{eqnarray}$$
3 Numerical optimisation
Solutions to equations (2.8)–(2.11) depend only on
 $\unicode[STIX]{x1D707}$
for fixed periods
 $(L_{x},L_{y})$
. For given
 $\unicode[STIX]{x1D707}$
, the solutions correspond to stationary points of the alternative functional
 $$\begin{eqnarray}\displaystyle {\mathcal{G}}=\left\langle w\unicode[STIX]{x1D703}-\frac{\unicode[STIX]{x1D707}}{2}|\unicode[STIX]{x1D735}\boldsymbol{u}|^{2}-\unicode[STIX]{x1D703}^{\ast }(\boldsymbol{x})\left[(\boldsymbol{u}\boldsymbol{\cdot }\unicode[STIX]{x1D735})\unicode[STIX]{x1D703}-\unicode[STIX]{x1D6FB}^{2}\unicode[STIX]{x1D703}-w\right]+p^{\ast }(\boldsymbol{x})\left(\unicode[STIX]{x1D735}\boldsymbol{\cdot }\boldsymbol{u}\right)\right\rangle . & & \displaystyle\end{eqnarray}$$
This is because
 ${\mathcal{G}}={\mathcal{F}}-(\unicode[STIX]{x1D707}/2)Pe^{2}$
and thus the Euler–Lagrange equations for
 ${\mathcal{G}}$
are also given by (2.8)–(2.11). In our previous work on a different functional in a different configuration (Motoki, Kawahara & Shimizu Reference Motoki, Kawahara and Shimizu2018), we have developed a numerical approach to find local maxima of a functional kindred to
 ${\mathcal{G}}$
by a combination of the steepest ascent method and the Newton–Krylov method. Using the same procedures, we obtain an optimal state (
 $\boldsymbol{u}_{opt},\unicode[STIX]{x1D703}_{opt},\unicode[STIX]{x1D703}_{opt}^{\ast },p_{opt}^{\ast }$
) maximising
 ${\mathcal{G}}$
for given
 $\unicode[STIX]{x1D707}$
. Since
 ${\mathcal{F}}$
has the gradients common to
 ${\mathcal{G}}$
, the optimal state gives the maximum of
 ${\mathcal{F}}$
at
 $Pe=\langle |\unicode[STIX]{x1D735}\boldsymbol{u}_{opt}|^{2}\rangle ^{1/2}$
. Thus the optimal states of
 ${\mathcal{F}}$
can be obtained without fixing
 $Pe$
in the process of the optimisation.
Only when we fix
 $Pe$
, maximal points for a specific value of
 $Pe$
(say,
 $Pe_{0}$
) are calculated by updating
 $\unicode[STIX]{x1D707}$
as
 $$\begin{eqnarray}\displaystyle \unicode[STIX]{x1D707}_{new}=\unicode[STIX]{x1D707}+\unicode[STIX]{x1D716}(\langle |\unicode[STIX]{x1D735}\boldsymbol{u}_{opt}|^{2}\rangle -Pe_{0}^{2}), & & \displaystyle\end{eqnarray}$$
taking account of the fact that the decrease (or increase) in
 $\unicode[STIX]{x1D707}$
corresponds to the increase (or decrease) in
 $Pe$
, where
 $\unicode[STIX]{x1D716}$
is a small positive constant to be taken as
 $\unicode[STIX]{x1D716}\sim 10^{-5}$
. Equations (2.8)–(2.11) are discretised by employing the spectral Galerkin method based on Fourier–Chebyshev expansions (for more details, see § 3 and appendix A in Motoki et al.
Reference Motoki, Kawahara and Shimizu2018).
In this paper, we present the optimal states in the square wall-parallel domain of
 $(L_{x},L_{y},L_{z})=(\unicode[STIX]{x03C0}/2,\unicode[STIX]{x03C0}/2,1)$
. By increasing or decreasing the wall-parallel domain size to
 $(L_{x},L_{y},L_{z})=(2,2,1)$
or
 $(\unicode[STIX]{x03C0}/(2\sqrt{2}),\unicode[STIX]{x03C0}/(2\sqrt{2}),1)$
, we have confirmed that the effects of the domain size are insignificant on the scaling of
 $Nu$
with
 $Pe$
at
 $Pe\gtrsim 10^{3}$
as well as the spatial structures in the optimal states, which will be described in the following sections. The numerical computations are carried out on
 $64^{3}$
grid points for
 $Pe\leqslant 500$
and
 $128^{3}$
grid points for
 $Pe>500$
. It has been validated in comparison with
 $256^{3}$
grid points that the results presented in this paper are independent of the spatial resolution. The dependence on domain size and spatial resolution is shown in appendix A.
4 Ultimate scaling
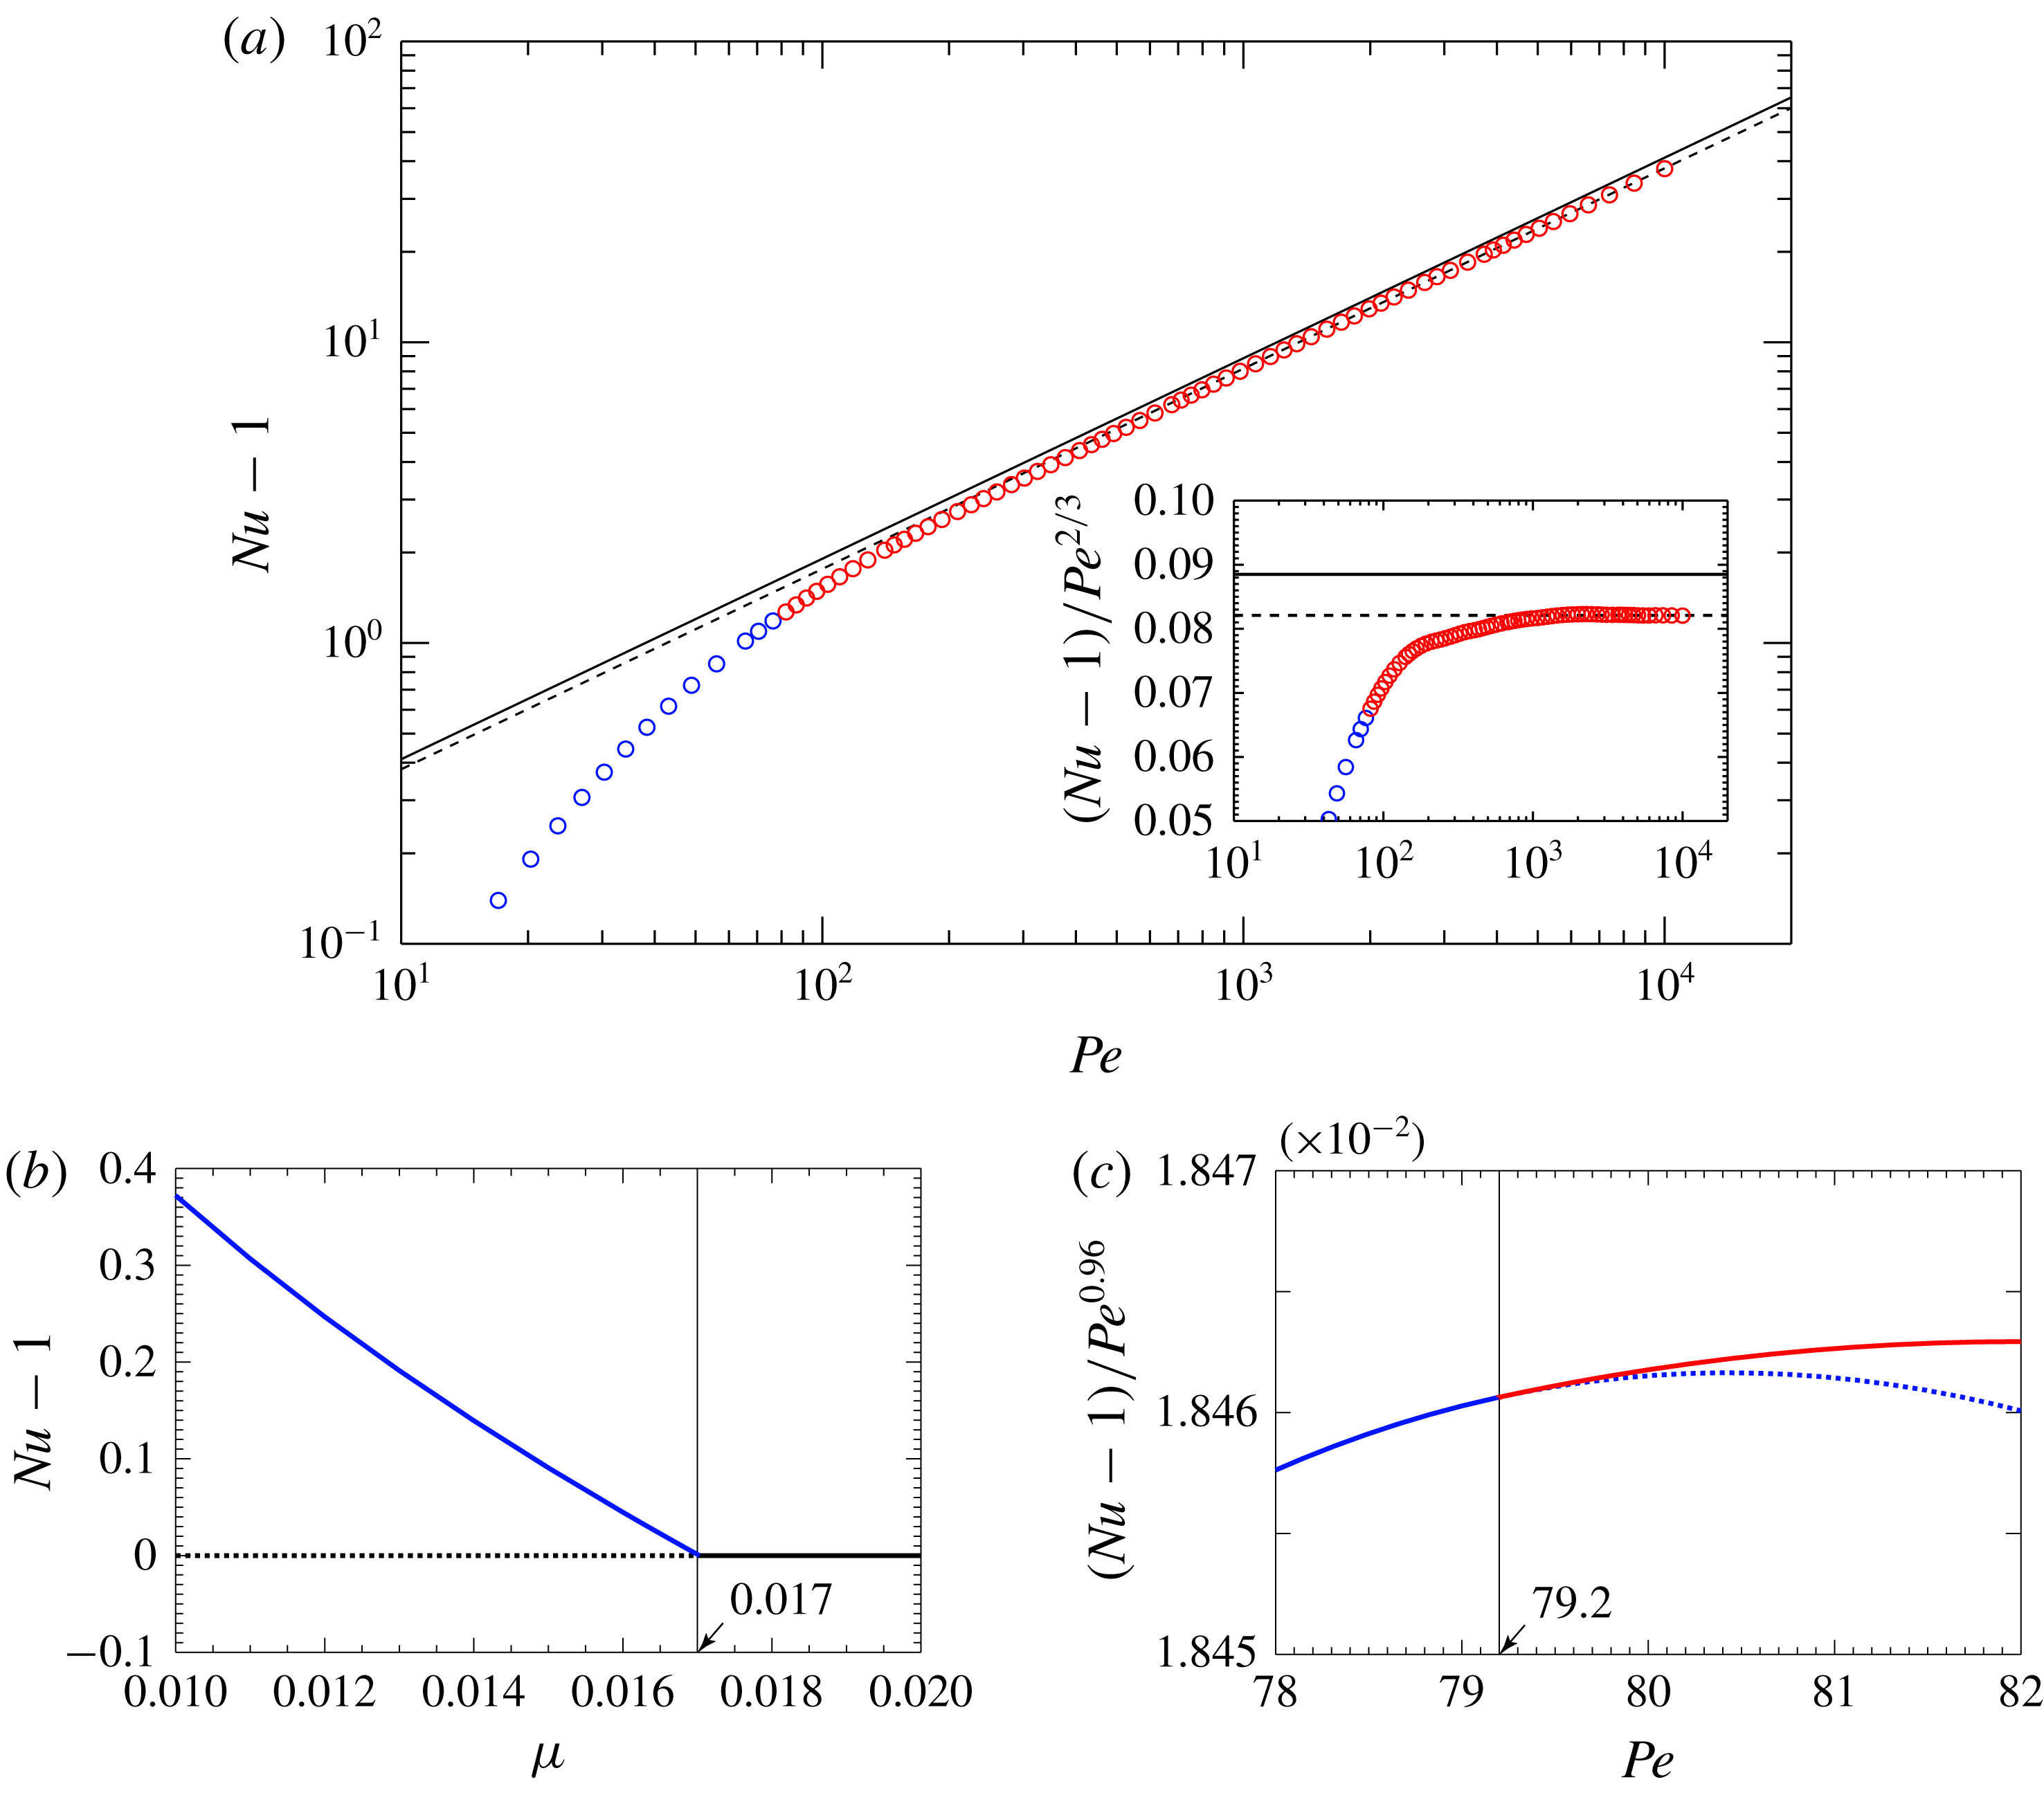
Figure 2(a) shows the maximal
 $Nu$
as a function of
 $Pe$
. At large
 $Pe$
(
 ${\gtrsim}10^{3}$
), we observe the scaling of
 $Nu$
with
 $Pe$
,
 $Nu-1\approx 0.082Pe^{2/3}$
. The scaling
 $Nu\sim Pe^{2/3}$
corresponds to the ultimate scaling
 $Nu\sim Ra^{1/2}$
in the Rayleigh–Bénard problem, provided that the total energy budget is given by the Boussinesq equation, that is
 $Pe^{2}=Ra(Nu-1)$
(Hassanzadeh et al.
Reference Hassanzadeh, Chini and Doering2014), where
 $Ra=g\unicode[STIX]{x1D6FD}\unicode[STIX]{x0394}TH^{3}/(\unicode[STIX]{x1D708}\unicode[STIX]{x1D705})$
is the Rayleigh number,
 $g$
,
 $\unicode[STIX]{x1D6FD}$
and
 $\unicode[STIX]{x1D708}$
being the acceleration due to gravity, the thermal expansion coefficient of the fluid and the kinematic viscosity, respectively. The thick solid line indicates the rigorous upper bound derived by using the background method (Plasting & Kerswell Reference Plasting and Kerswell2003). The obtained maximal scaling is close to the upper bound, but the prefactor is approximately 7.2 % less than that of the bound. We have confirmed that the optimal states in the different domains,
 $(L_{x},L_{y},L_{z})=(2,2,1)$
and
 $(\unicode[STIX]{x03C0}/(2\sqrt{2}),\unicode[STIX]{x03C0}/(2\sqrt{2}),1)$
, exhibit consistent scaling
 $Nu-1\approx 0.082Pe^{2/3}$
at
 $Pe\gtrsim 10^{3}$
(as can be seen in figure 8 in appendix A).
(a) Nusselt number
 $Nu$
as a function of Péclet number
 $Pe$
in the optimal states. The blue and red circles denote two-dimensional and three-dimensional optimal states, respectively. The dashed line indicates the power fit
 $Nu-1=0.0821Pe^{2/3}$
determined in the range
 $5\times 10^{3}<Pe<10^{4}$
. The solid line represents the scaling
 $Nu-1=0.0885Pe^{2/3}$
evaluated from the rigorous upper bound
 $Nu-1=0.02634Ra^{1/2}$
(Plasting & Kerswell Reference Plasting and Kerswell2003) assuming the identity
 $Pe^{2}=Ra(Nu-1)$
(Hassanzadeh et al.
Reference Hassanzadeh, Chini and Doering2014). The inset shows the compensated
 $Nu$
. (b,c)
 $Nu$
as a function of (b) much larger
 $\unicode[STIX]{x1D707}$
(much smaller
 $Pe$
) and (c) larger
 $\unicode[STIX]{x1D707}$
(smaller
 $Pe$
). The blue and red curves respectively show the two-dimensional and three-dimensional solutions, and the black line is a conductive solution. The solid (or dashed) line denotes an optimal (or saddle) solution.

Supposing that
 $Nu\sim Pe^{2/3}$
and choosing the reference velocity as
 $U=(g\unicode[STIX]{x1D6FD}\unicode[STIX]{x0394}TH)^{1/2}$
, we have the scaling with respect to the energy dissipation as
 $$\begin{eqnarray}\displaystyle \frac{\unicode[STIX]{x1D708}\langle |\unicode[STIX]{x1D735}^{\prime }\boldsymbol{u}^{\prime }|^{2}\rangle }{U^{3}/H}\sim Pr^{-1/2}, & & \displaystyle\end{eqnarray}$$
where
 $Pr$
is the Prandtl number. Thus the scaling
 $Nu\sim Pe^{2/3}$
means that the energy dissipation normalised by
 $U^{3}/H$
is independent of the Reynolds number, in accord with the Taylor’s scaling view for turbulent energy dissipation. Although the Taylor dissipation law does not hold in turbulent shear flows over a smooth-wall surface, the Reynolds-number-independent skin-friction coefficient can be observed in high-Reynolds-number rough-wall turbulence, implying the emergence of the Taylor law. The ultimate scaling
 $Nu\sim Ra^{1/2}$
has not also been observed in turbulent Rayleigh–Bénard convection between smooth horizontal plates, i.e. the same boundary conditions as in the present study. For homogeneous turbulent convection without thermal and velocity boundary layers, e.g. in three-dimensional periodic boundary box with the vertical mean temperature gradient (Lohse & Toschi Reference Lohse and Toschi2003), the ultimate scaling
 $Nu\sim Ra^{1/2}$
has been observed. However, it is still an open question whether or not the ultimate scaling can be found in high-
 $Ra$
convective turbulence between two parallel plates with surface roughness (Roche et al.
Reference Roche, Castaing, Chabaud and Hébral2001; Zhu et al.
Reference Zhu, Stevens, Verzicco and Lohse2017).
5 Appearance of three-dimensional solution
At large
 $\unicode[STIX]{x1D707}$
(small
 $Pe$
), a two-dimensional array of convection rolls gives maximal heat transfer. The solution arises from supercritical pitchfork bifurcation on a conductive solution at
 $\unicode[STIX]{x1D707}\approx 1.703\times 10^{-2}$
(
 $Pe\equiv 0$
) (figure 2
b), and it satisfies the reflection symmetry
 $$\begin{eqnarray}\displaystyle [u,v,w,\unicode[STIX]{x1D703}](x,y,z)=[-u,v,w,\unicode[STIX]{x1D703}](-x,y,z) & & \displaystyle\end{eqnarray}$$
and the shift-and-reflection symmetry
 $$\begin{eqnarray}\displaystyle [u,v,w,\unicode[STIX]{x1D703}](x,y,z)=[u,v,-w,-\unicode[STIX]{x1D703}](x+L_{x}/2,y,1-z) & & \displaystyle\end{eqnarray}$$
(see figure 3
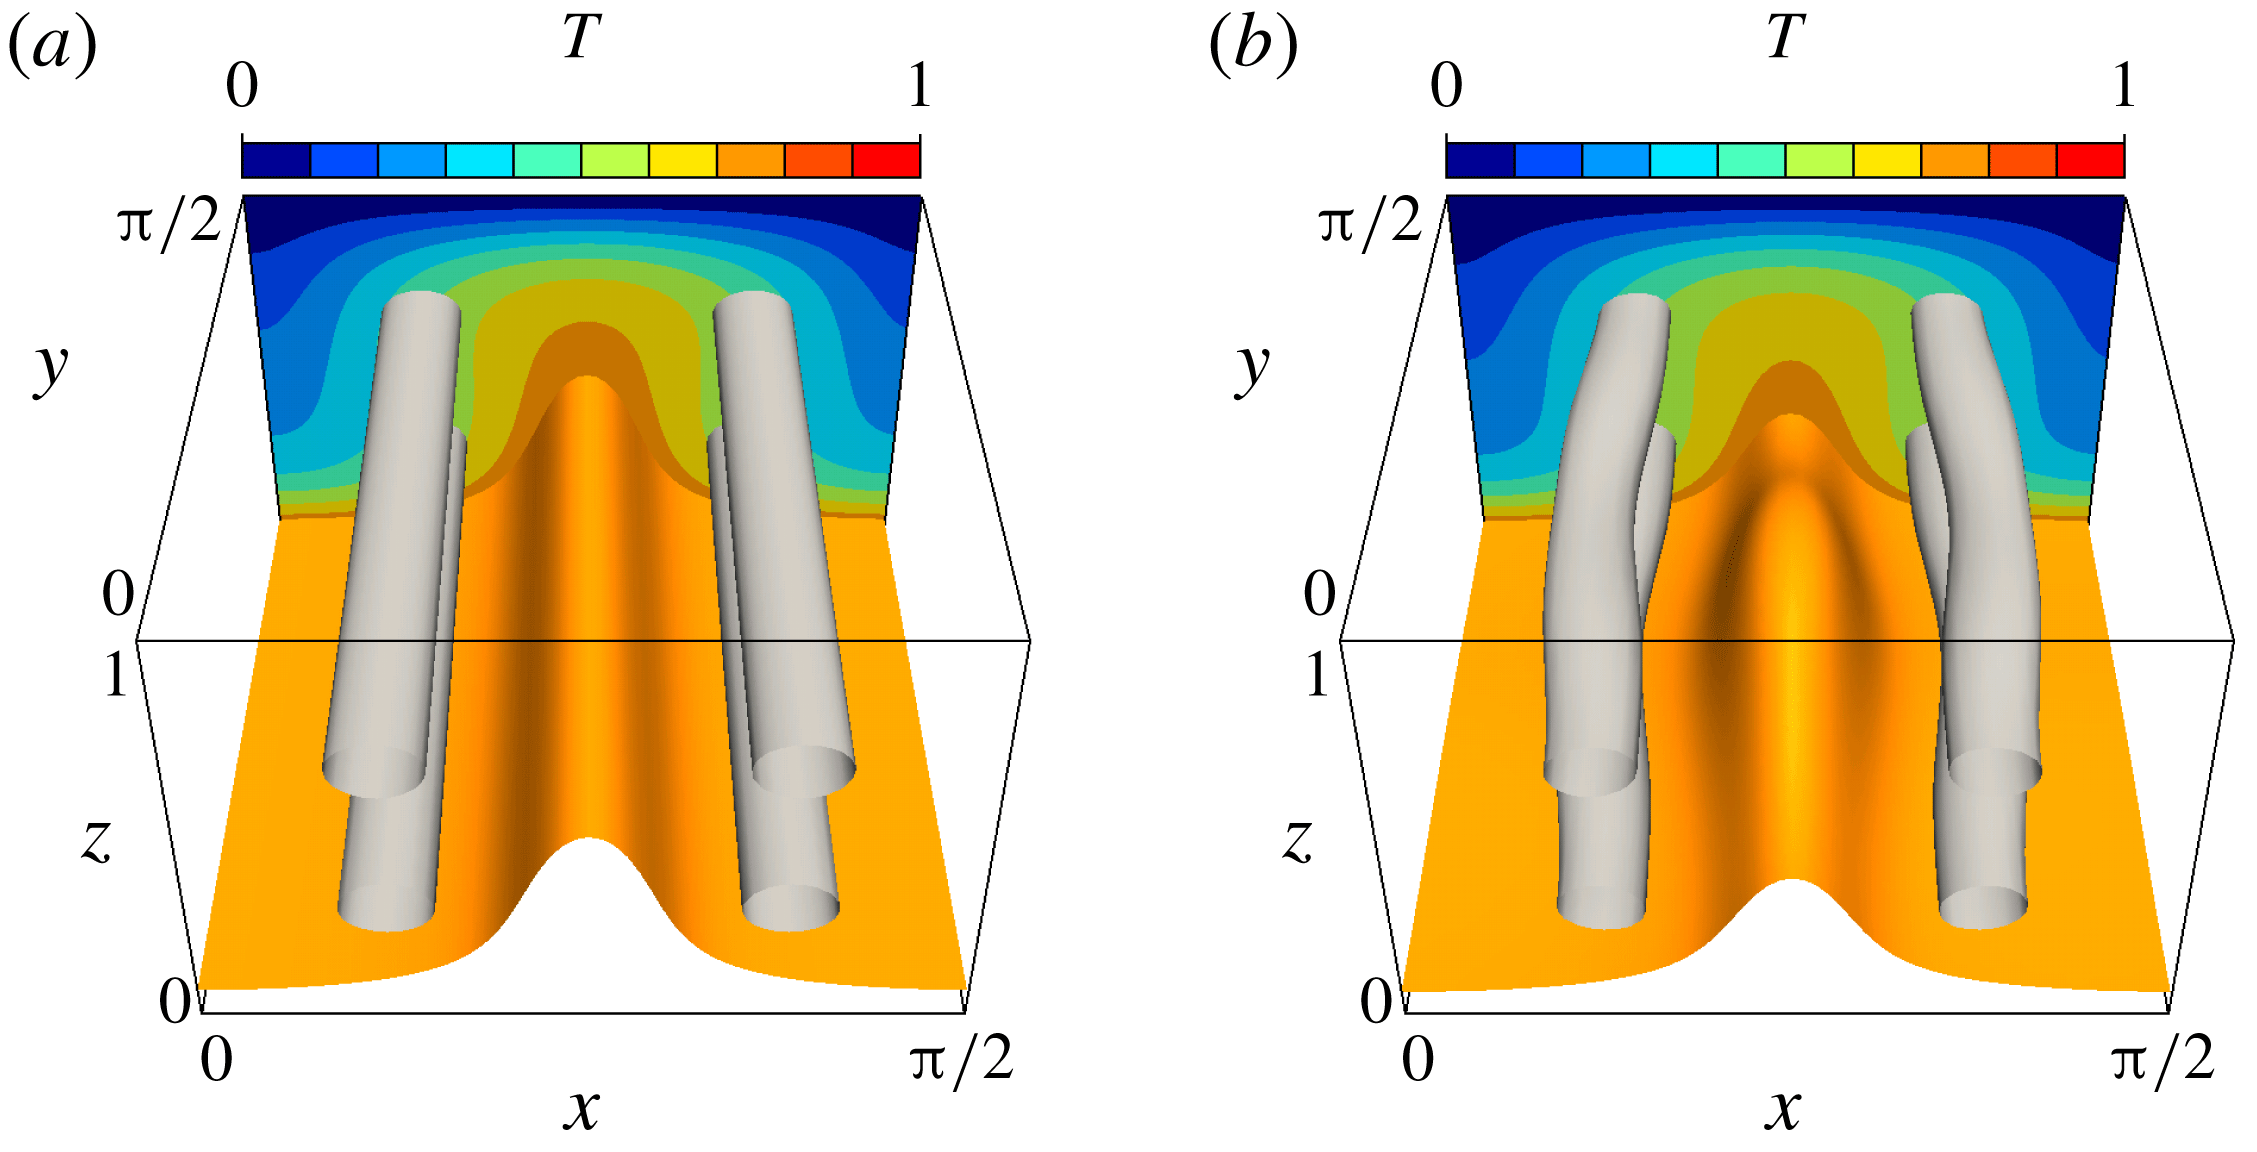
a). Figure 3(a,b) visualise isosurfaces of the temperature field
 $T$
and of the second invariant of the velocity gradient tensor
 $$\begin{eqnarray}\displaystyle Q=-\frac{1}{2}\frac{\unicode[STIX]{x2202}u_{i}}{\unicode[STIX]{x2202}x_{j}}\frac{\unicode[STIX]{x2202}u_{j}}{\unicode[STIX]{x2202}x_{i}}. & & \displaystyle\end{eqnarray}$$
(a) Two-dimensional saddle and (b) three-dimensional optimal solutions at
 $Pe=80.0$
. The orange objects show the isosurfaces of the temperature,
 $T=0.75$
, and the light grey tube-like objects are the vortex structures visualised by the positive second invariant of the velocity gradient tensor,
 $Q=2560$
. The contours represent the temperature field in the plane
 $y=\unicode[STIX]{x03C0}/2$
.

As
 $\unicode[STIX]{x1D707}$
decreases further, the second pitchfork bifurcation occurs on the two-dimensional solution branch at
 $\unicode[STIX]{x1D707}\approx 3.028\times 10^{-3}$
(
 $Pe\approx 79.2$
, corresponding to
 $Ra\approx 5.11\times 10^{3}$
via
 $Pe^{2}=Ra(Nu-1)$
) (figure 2
c). Subsequently, the two-dimensional solution becomes a saddle solution, and a three-dimensional optimal solution with the shift-and-reflection symmetry
 $$\begin{eqnarray}\displaystyle [u,v,w,\unicode[STIX]{x1D703}](x,y,z)=[u,v,-w,-\unicode[STIX]{x1D703}](x+L_{x}/2,y+L_{y}/2,1-z) & & \displaystyle\end{eqnarray}$$
appears (see figure 3
b). In order to identify a qualitative change in the velocity field through the second bifurcation, we introduce the one-dimensional energy spectra
 $E_{w}$
of the wall-normal velocity
 $w$
defined as
 $$\begin{eqnarray}\displaystyle E_{w}(k_{x},z)=\mathop{\sum }_{k_{y}=-K}^{K}|\widetilde{w}(k_{x},k_{y},z)|^{2},\quad E_{w}(k_{y},z)=\mathop{\sum }_{k_{x}=-K}^{K}|\widetilde{w}(k_{x},k_{y},z)|^{2}, & & \displaystyle\end{eqnarray}$$
where
 $K$
is a positive integer representing the truncation, and
 $\widetilde{w}$
is the Fourier coefficient such that
 $$\begin{eqnarray}\displaystyle w(x,y,z)\approx \mathop{\sum }_{k_{x}=-K}^{K}\mathop{\sum }_{k_{y}=-K}^{K}\widetilde{w}(k_{x},k_{y},z)\exp \left[\text{i}\left\{\frac{2\unicode[STIX]{x03C0}k_{x}}{L_{x}}x+\frac{2\unicode[STIX]{x03C0}k_{x}}{L_{y}}y\right\}\right]. & & \displaystyle\end{eqnarray}$$
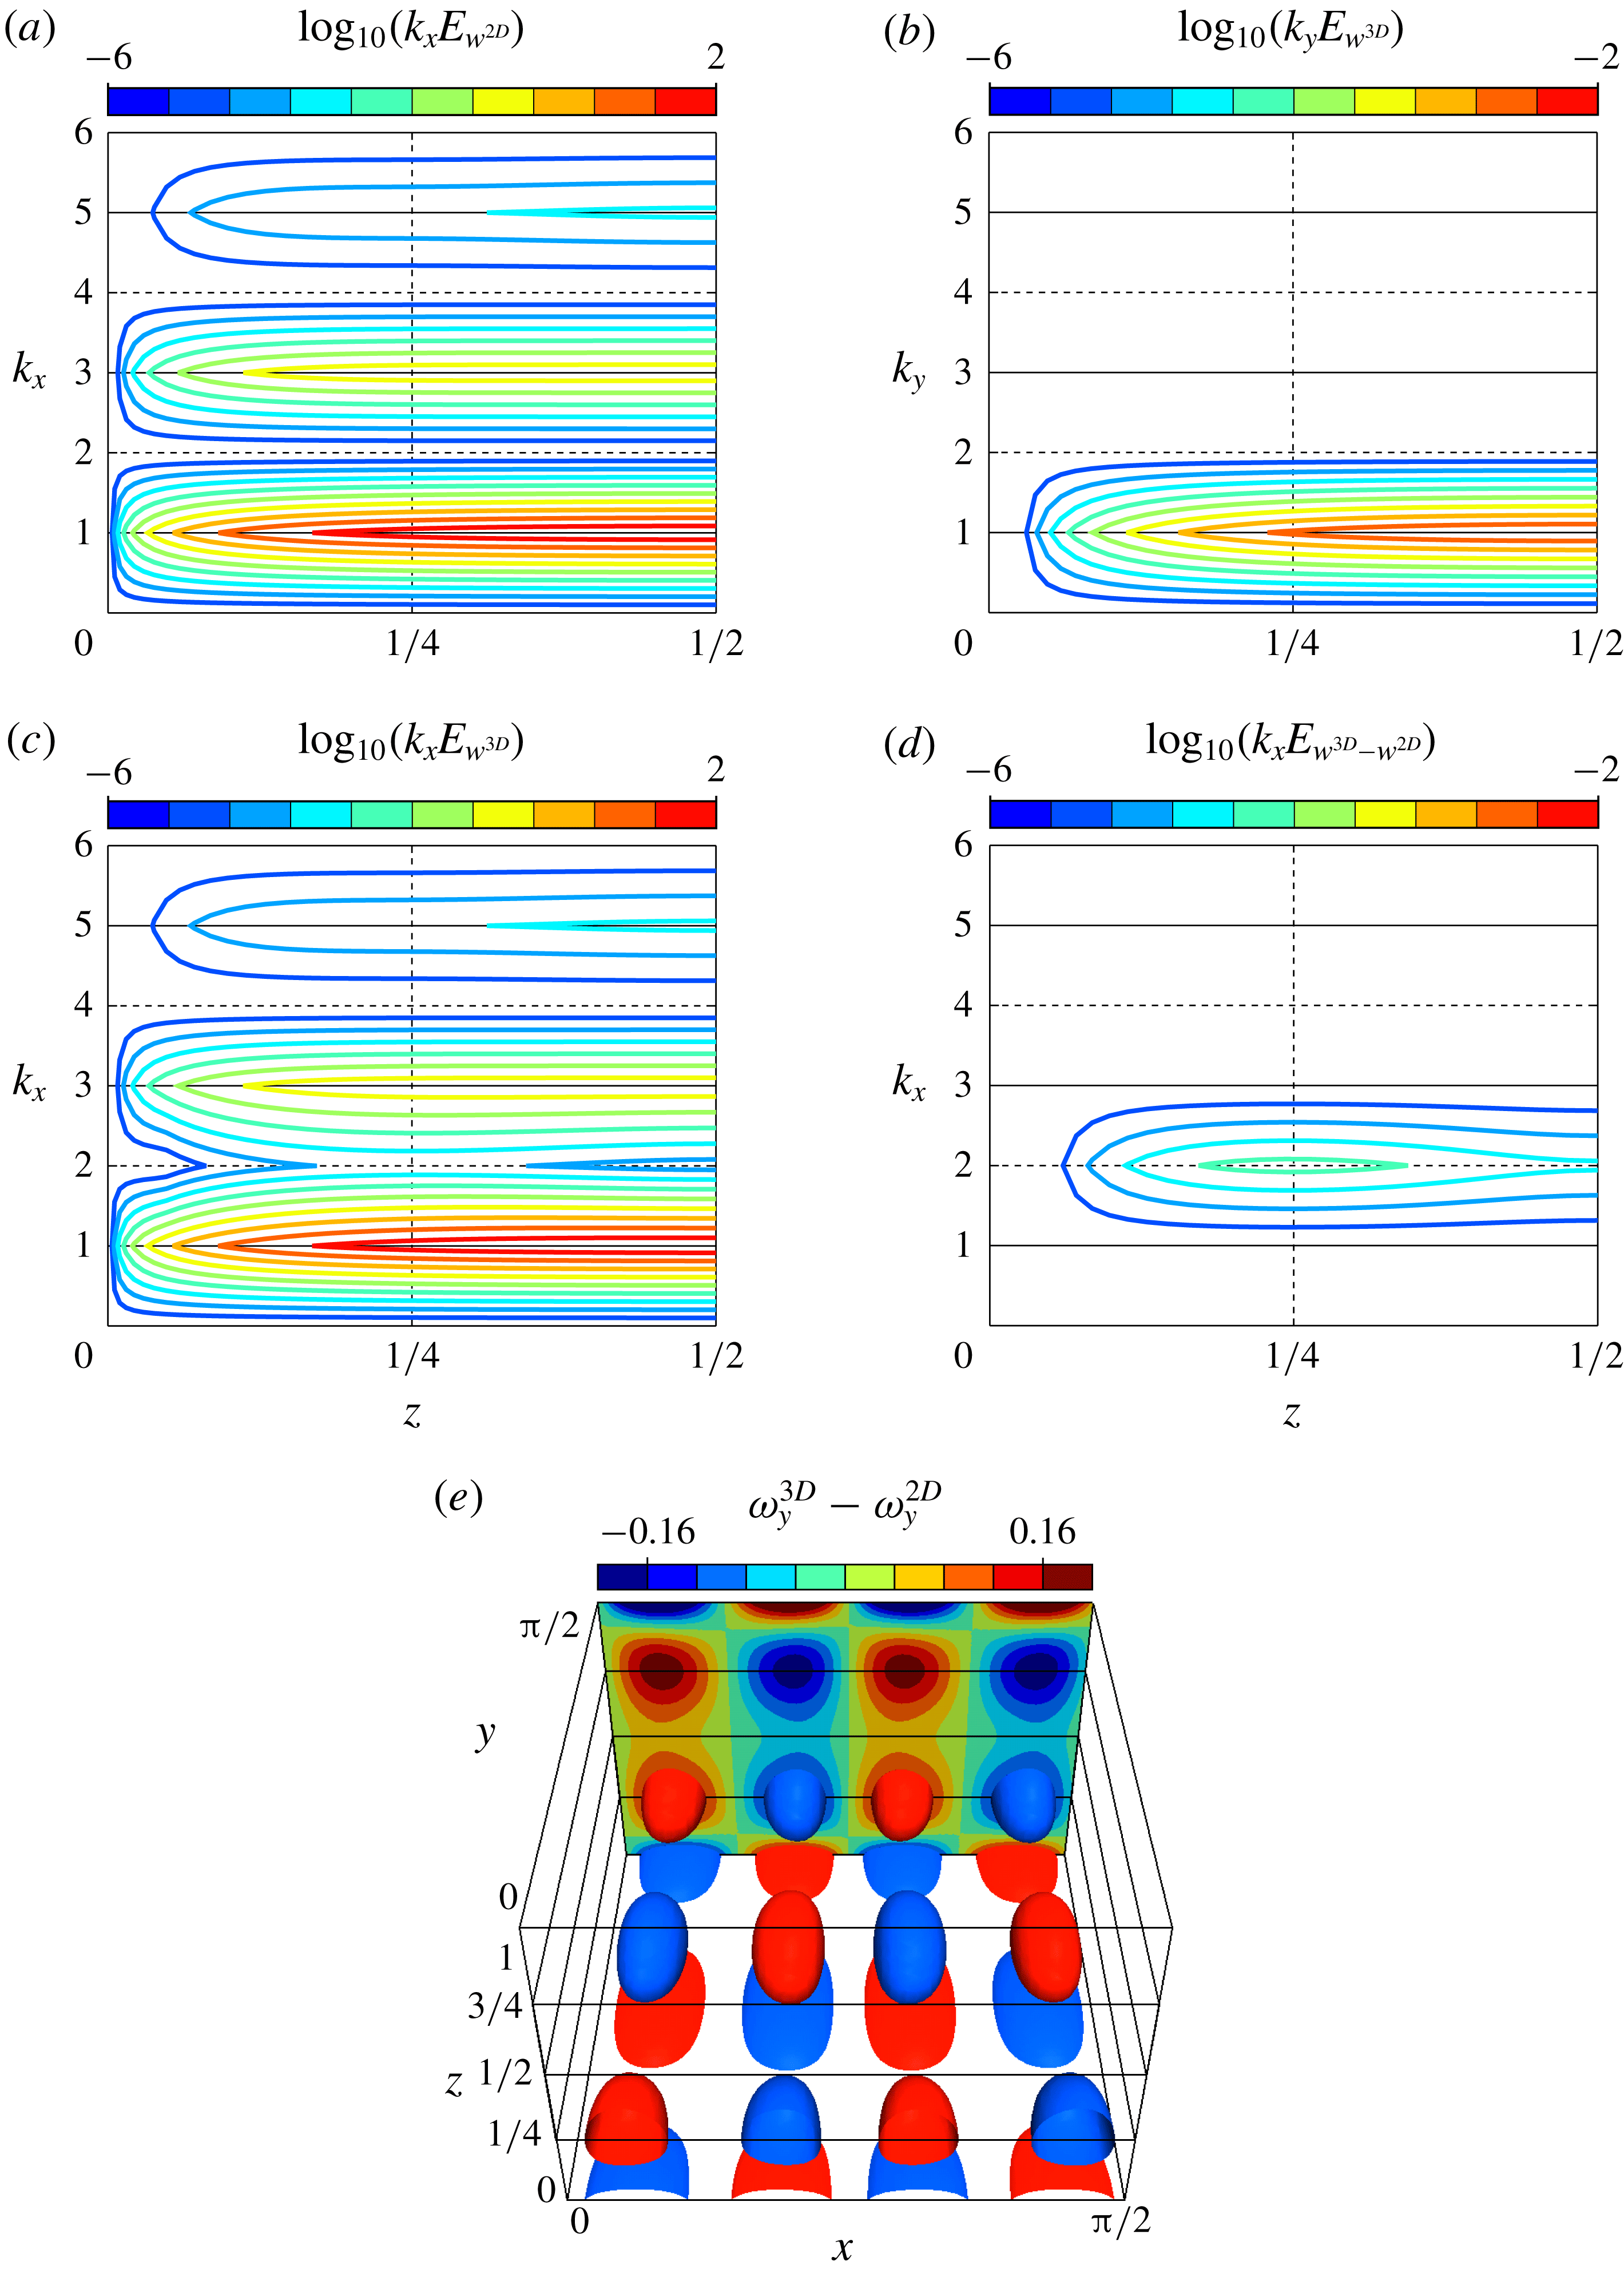
Figure 4(a–d) show the premultiplied energy spectra
 $k_{x}E_{w}(k_{x},z)$
(or
 $k_{y}E_{w}(k_{y},z)$
) at the Péclet number
 $Pe=79.2$
, just after the onset of the three-dimensional solution, as a function of the distance to the wall,
 $z$
and the
 $x$
- (or
 $y$
-) component of the ‘wavenumber’ vector,
 $k_{x}$
(or
 $k_{y}$
). In the optimised velocity field (figure 4
a) within a two-dimensional field, there exist only the modes for odd
 $k_{x}$
representing a pair of counterrotating large-scale rolls around
 $z=1/2$
fully extending to the periodic box in the
 $x$
-direction (see figure 3
a for the rolls at higher
 $Pe$
). It is also the case even at higher Péclet number
 $Pe\sim 10^{3}$
. Figure 4(b) shows the spectrum as a function of the other component
 $k_{y}$
for the three-dimensional velocity field at
 $Pe=79.2$
. In the spectra
 $k_{y}E_{w}$
, the only fundamental mode for
 $k_{y}=1$
is dominant, since the solution has been obtained just after the bifurcation point (the onset of the three-dimensional solution). In
 $k_{x}E_{w}$
, the modes for even
 $k_{x}$
also appear as a result of the emergence of smaller-scale three-dimensional structures in addition to the large-scale rolls (figure 4
c). In order to extract the deviation from the original two-dimensional velocity field, the spectrum of the velocity difference between the two solutions at
 $Pe=79.2$
is shown in figure 4(d). The leading mode is at
 $k_{x}=2$
, and the spectral component has a peak at
 $z=1/4$
(half the distance between one of the two walls and the midplane). That is to say, the smaller-scale vortical structures for
 $k_{x}=2$
, half the size of the large-scale rolls, emerge at
 $z=1/4$
, closer to the wall. In figure 4(e), the relevant structures are visualised by the difference in the
 $y$
-component of vorticity,
 $\unicode[STIX]{x1D714}_{y}^{3D}-\unicode[STIX]{x1D714}_{y}^{2D}$
. The extracted structure is characterised in terms of a three-dimensional mode
 $(k_{x},k_{y})=(2,1)$
, and exhibits an array of vortices arranged in a wall-parallel plane around
 $z=1/4$
(and
 $3/4$
). The onset of the smaller three-dimensional vortical structures near the walls brings about the bending of the original larger two-dimensional rolls and associated vortex tubes (figure 3
b), enhancing heat transfer.
(a–d) One-dimensional premultiplied energy spectra of the wall-normal velocity
 $w$
,
 $k_{x}E_{w}~(k_{x},z)$
and
 $k_{y}E_{w}~(k_{y},z)$
, at
 $Pe=79.2$
. The spectrum of (a) the two-dimensional solution
 $w^{2D}$
, (b,c) the three-dimensional solution
 $w^{3D}$
, and (d) their difference
 $w^{3D}-w^{2D}$
. The lateral axis denotes the distance to the wall
 $z$
, and the longitudinal axis is the wavenumber component (a,c,d)
 $k_{x}$
in the
 $x$
-direction and (b)
 $k_{y}$
in the
 $y$
-direction. (e) Spatial distribution of the difference in the
 $y$
-component of vorticity
 $\unicode[STIX]{x1D714}_{y}$
between the three- and two-dimensional solutions,
 $\unicode[STIX]{x1D714}_{y}^{3D}-\unicode[STIX]{x1D714}_{y}^{2D}$
at
 $Pe=79.2$
. The red/blue objects respectively show the isosurfaces of
 $\unicode[STIX]{x1D714}_{y}^{\text{3D}}-\unicode[STIX]{x1D714}_{y}^{2D}=\pm 0.12$
. The contours represent
 $\unicode[STIX]{x1D714}_{y}^{3D}-\unicode[STIX]{x1D714}_{y}^{2D}$
in the plane
 $y=\unicode[STIX]{x03C0}/2$
.

In the velocity field optimised within a two-dimensional field, such smaller-scale structures closer to the walls have not been found even at higher
 $Pe$
. In the three-dimensional optimal velocity field, on the other hand, the three-dimensional smaller-scale structures with the higher wavenumber emerge closer to the walls, as mentioned above. This is a crucial difference between the two- and three-dimensional optimal fields.
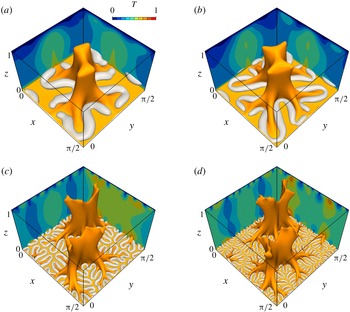
Optimal states at Péclet number (a)
 $Pe=508$
, (b)
 $Pe=1006$
, (c)
 $Pe=5041$
and (d)
 $Pe=10\,009$
. The orange objects show the isosurfaces of
 $T=0.75$
. The light grey tube-like structures are the isosurfaces of (a)
 $Q=8.0\times 10^{4}$
, (b)
 $Q=4.8\times 10^{5}$
, (c)
 $Q=1.6\times 10^{7}$
and (d)
 $Q=1.6\times 10^{8}$
(note that only those in the lower half of the domain are shown for visualisation of the near-wall structures). The contours represent temperature field in the planes
 $x=0$
and
 $y=\unicode[STIX]{x03C0}/2$
.

Energy spectra of the wall-normal velocity
 $w$
,
 $k_{x}E_{w}(k_{x},z)$
, as a function of the distance to the wall,
 $z$
and the wavelength in the
 $x$
-direction,
 $\unicode[STIX]{x1D706}_{x}$
. The dashed diagonal indicates
 $\unicode[STIX]{x1D706}_{x}=L_{x}z$
.

6 Hierarchical self-similar structures
Tree-like structures of isotherms are observed in the optimal states at small
 $\unicode[STIX]{x1D707}$
(large
 $Pe$
), shown in figure 5. The orange objects show isosurfaces of
 $T=0.75$
, and a ‘trunk’ of the ‘tree’ represents a hot ‘plume’ where the positive wall-normal velocity has been found to be dominant. As
 $Pe$
increases, the tree ‘roots’ grow deeper while maintaining the large-scale trunk. The light grey objects show smallest-scale vortex structures visualised by the positive isosurfaces of
 $Q$
in the near-wall region of the lower half of the domain (similar vortical structures exist on the upper wall). The smaller and stronger vortices appear closer to the walls with increasing enstrophy, i.e.
 $Pe$
. The roots are seen to be generated as a consequence of upward fluid motion induced between the roughly antiparallel nearest segments of the winding tube-like vortices. As seen in the bifurcation of the three-dimensional solution from the two-dimensional solution, the local folding of the larger vortices stems from the onset of the smaller vortical structures closer to the wall.
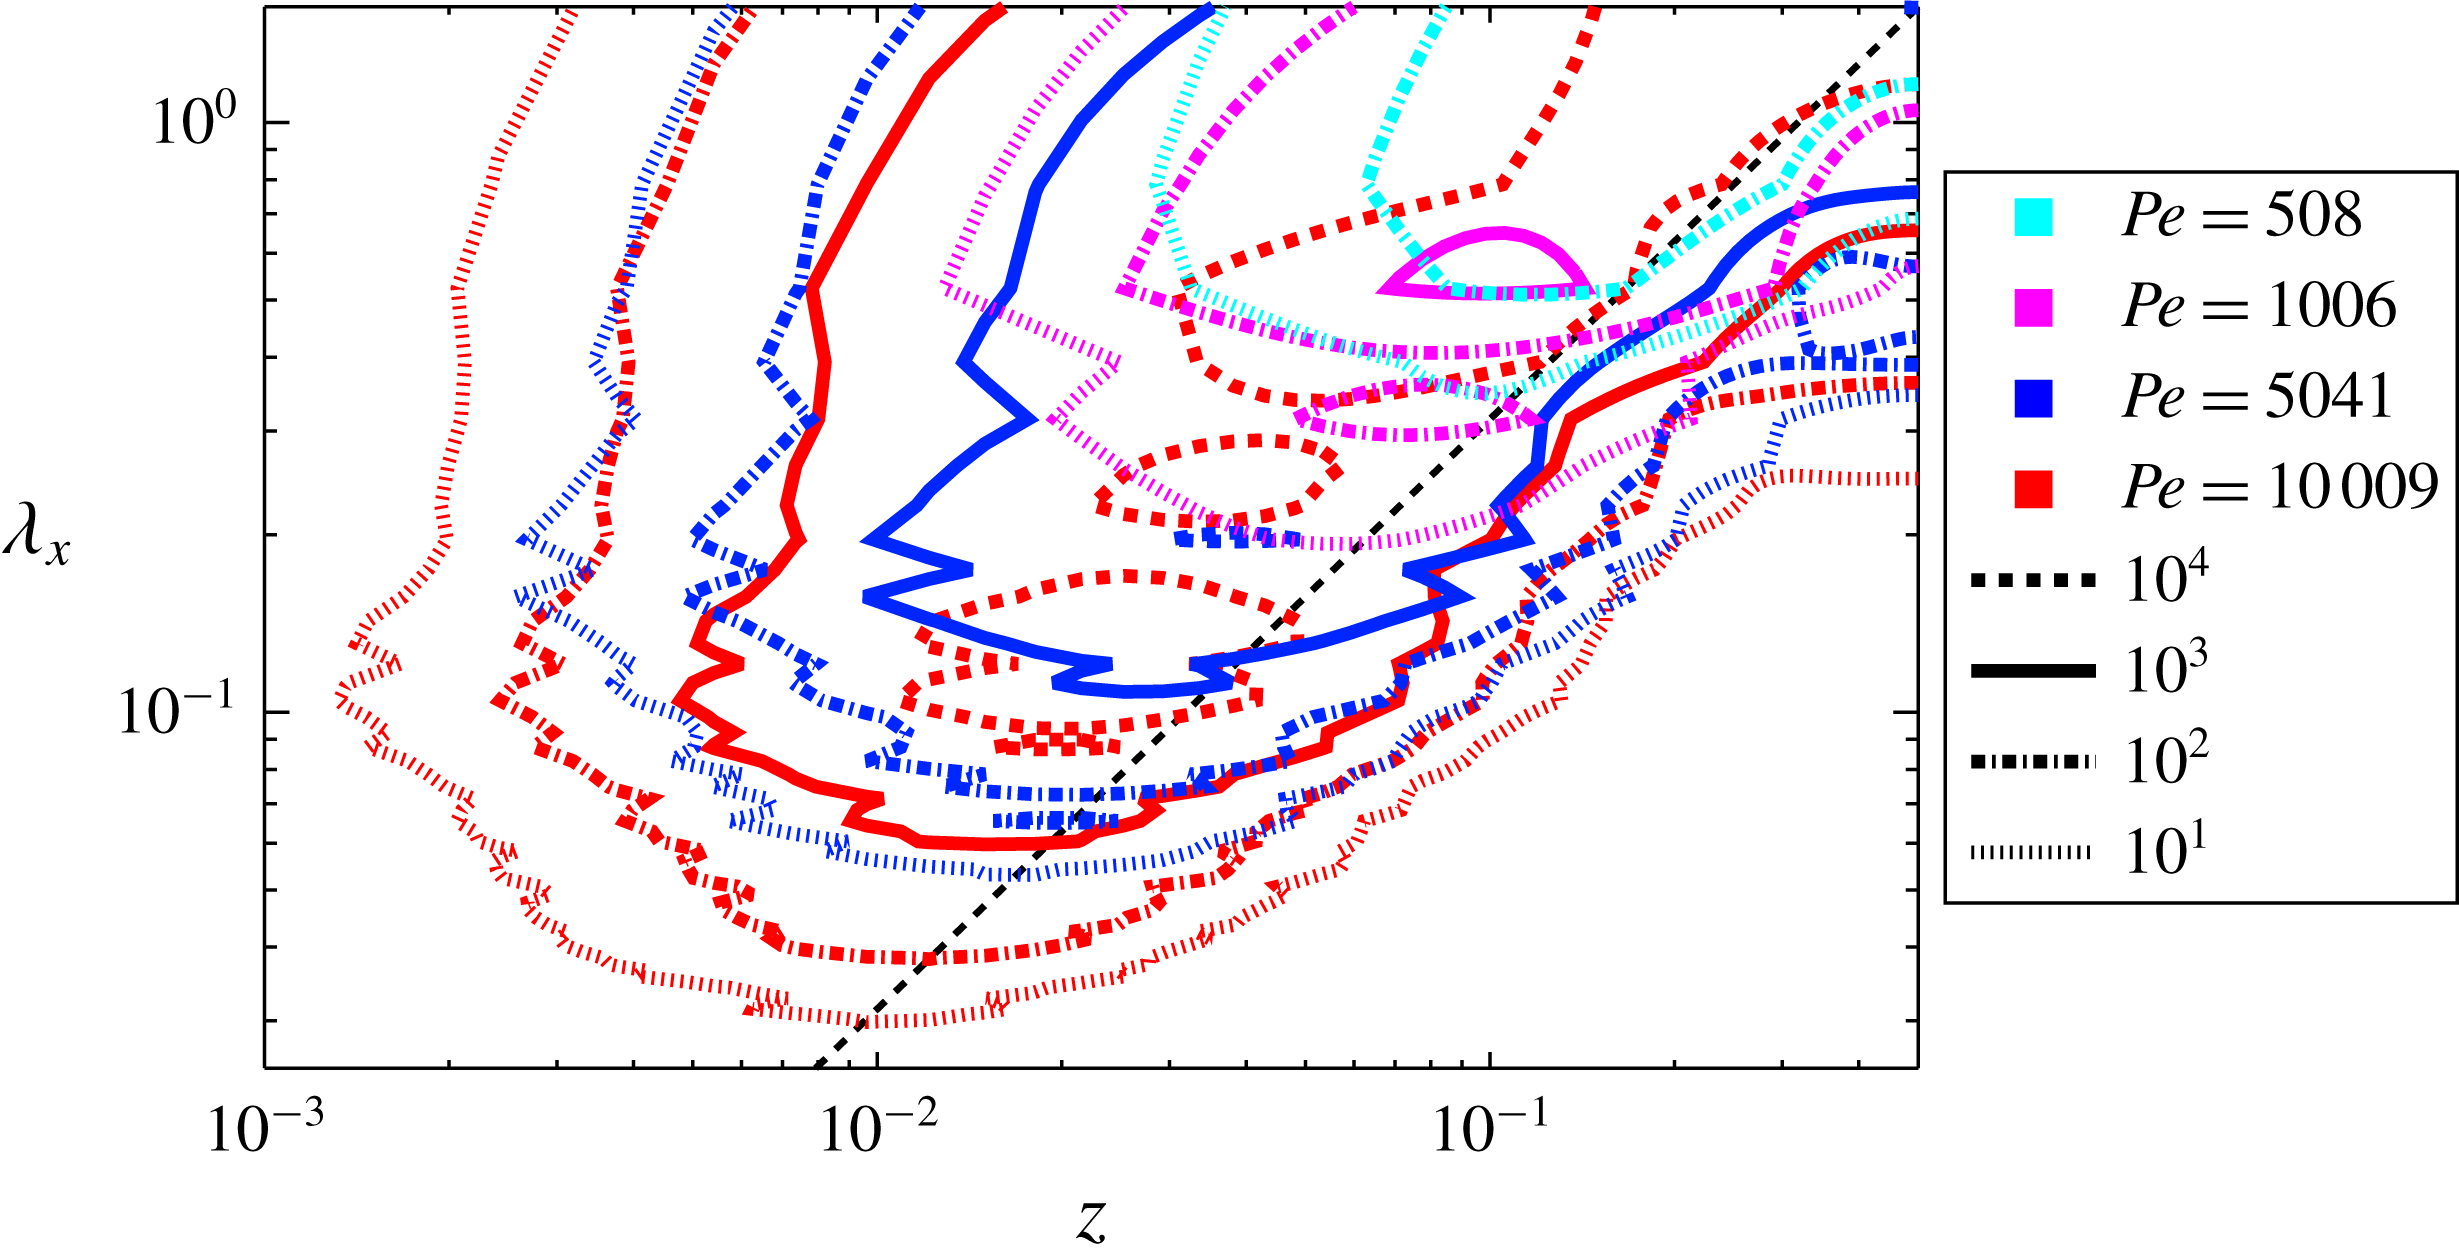
Figure 6 shows the energy spectra of the wall-normal velocity
 $w$
as a function of the distance to the wall,
 $z$
, and the wavelength in the
 $x$
-direction,
 $\unicode[STIX]{x1D706}_{x}=L_{x}/k_{x}$
, relevant to the size of the vortical structures. It can be seen that smaller-scale structures are generated closer to the wall as
 $Pe$
is increased. At
 $Pe=10\,009$
several spectral peaks are observed along the ‘ridge’ represented by the dashed diagonal
 $\unicode[STIX]{x1D706}_{x}=L_{x}z$
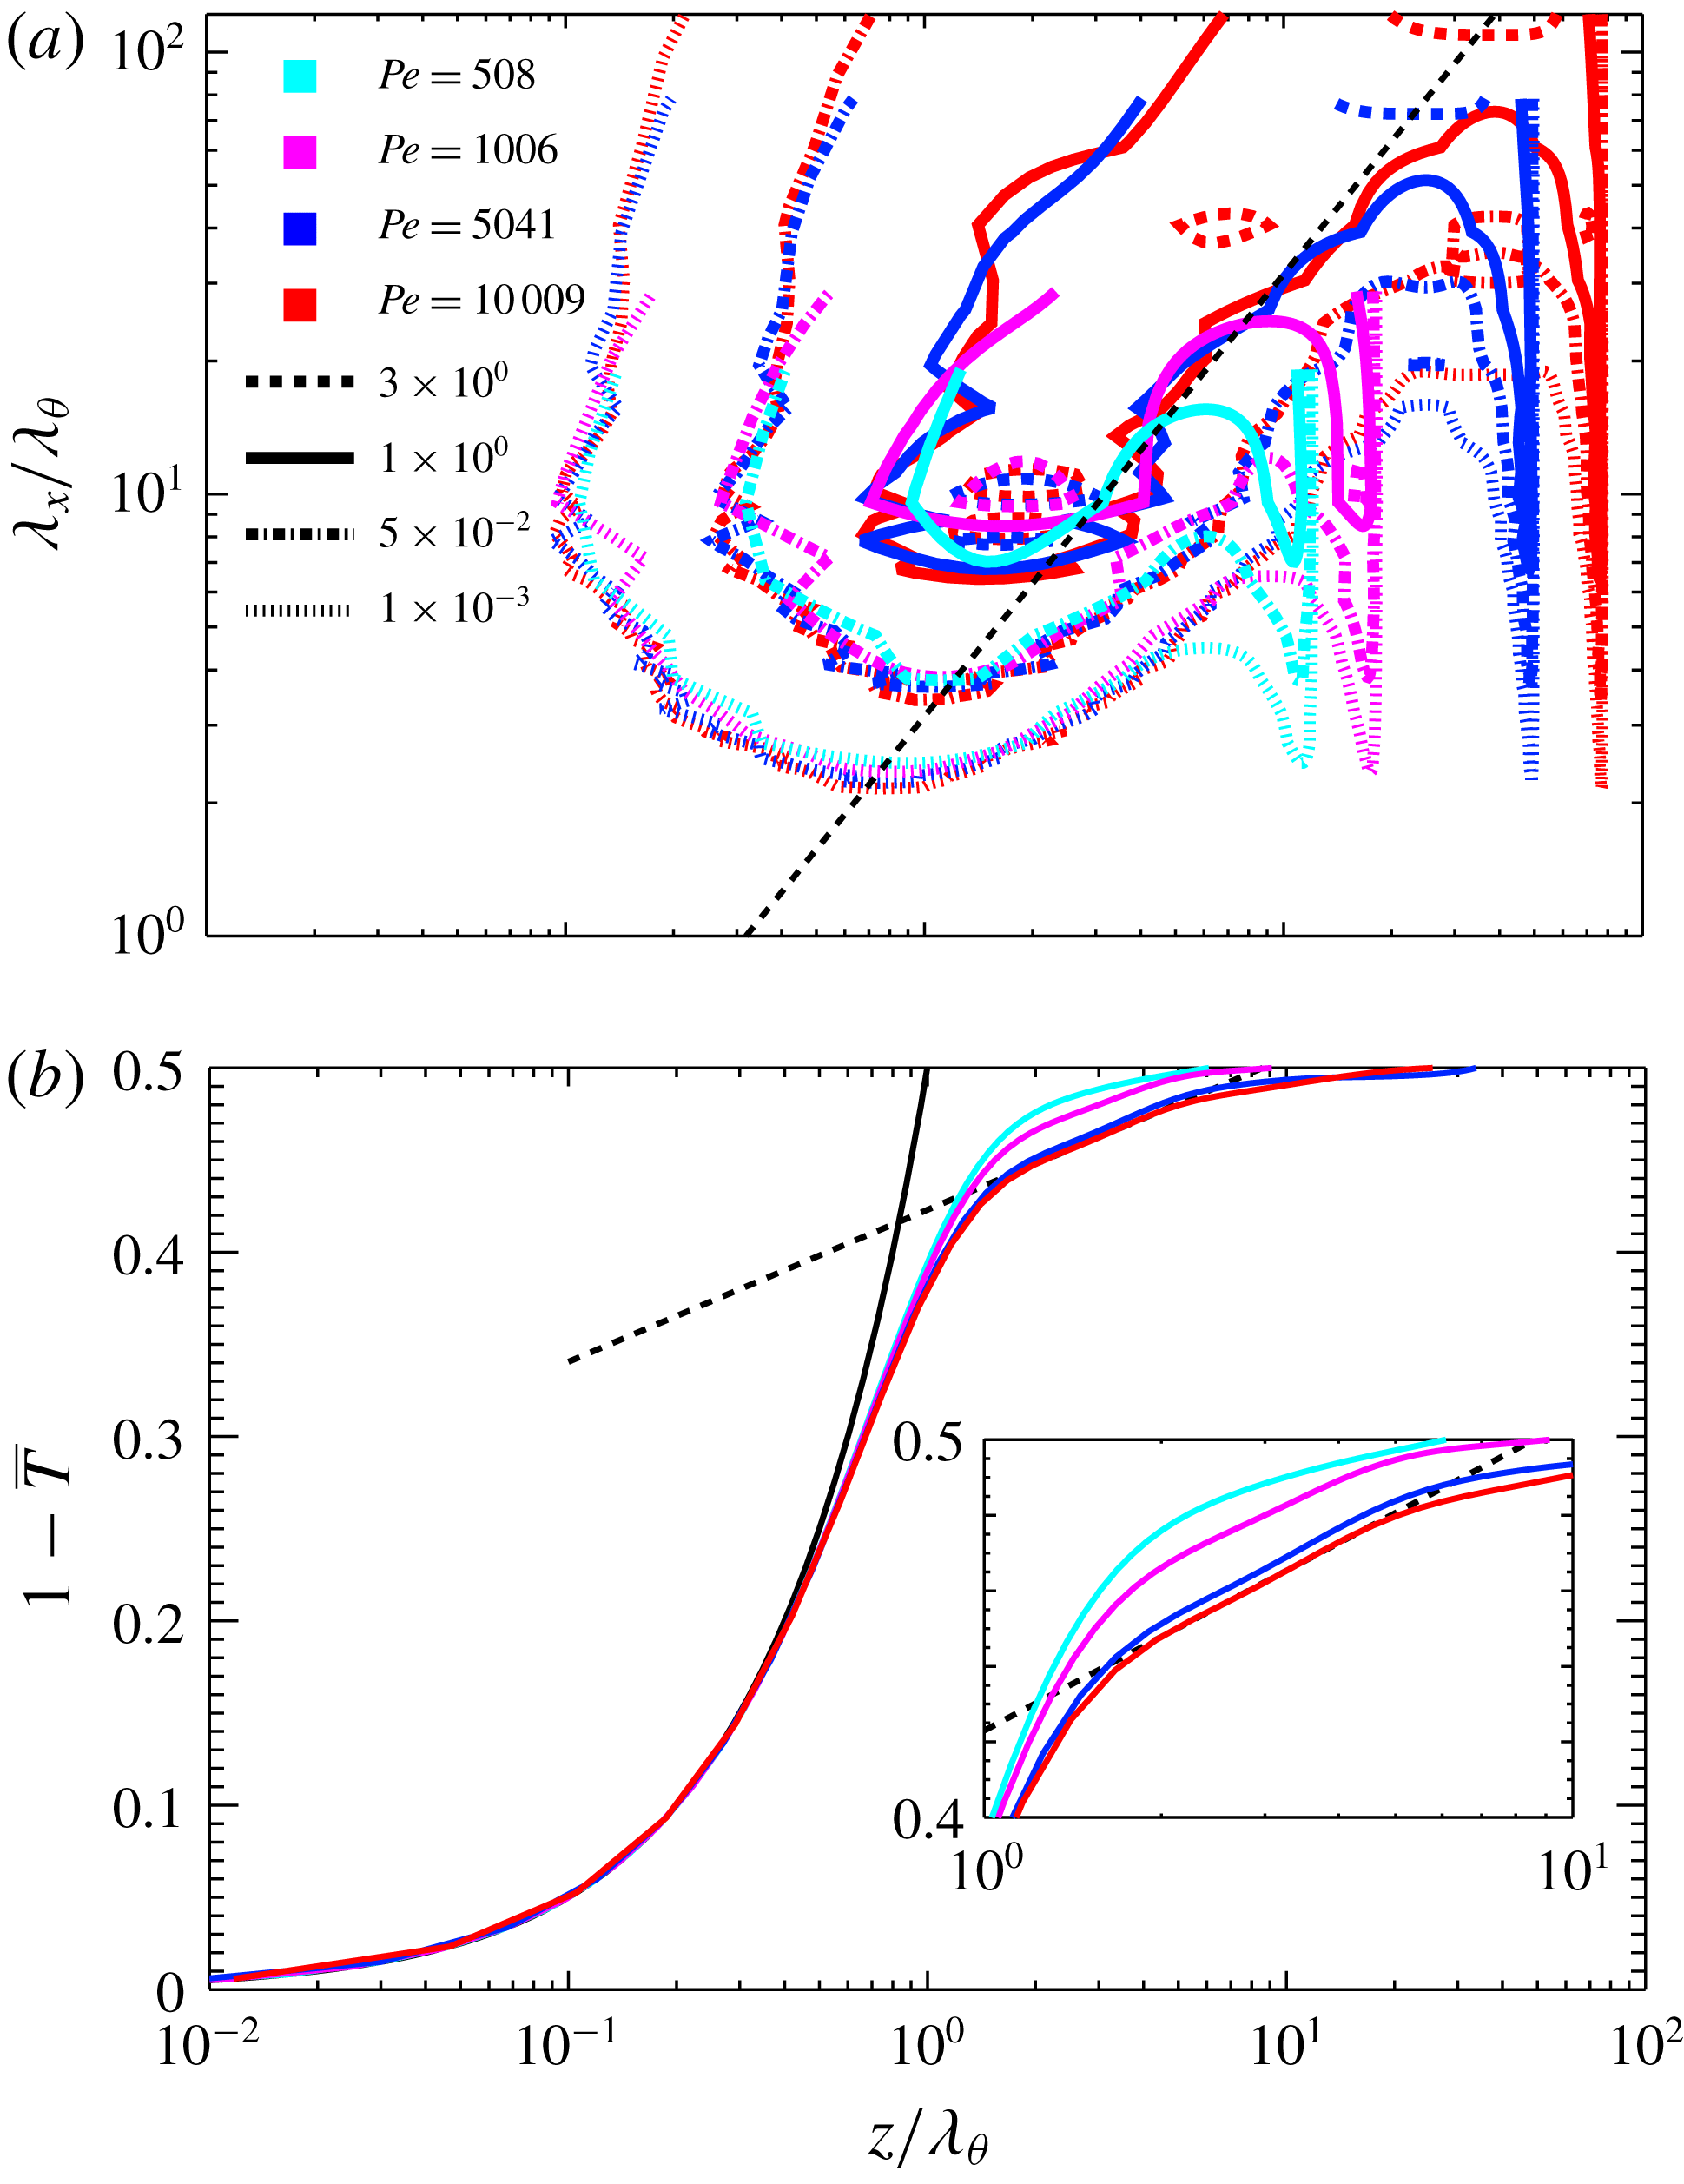
, implying that the optimal velocity fields possess hierarchical self-similarity. As shown in figure 7(a), the energy spectra scale with the conduction length
 $\unicode[STIX]{x1D706}_{\unicode[STIX]{x1D703}}=(2Nu)^{-1}$
in the close vicinity of the wall. The hierarchical structures exist down to
 $z/\unicode[STIX]{x1D706}_{\unicode[STIX]{x1D703}}\approx 1$
, where the size of the structures is
 $\unicode[STIX]{x1D706}_{x}\approx 5Nu^{-1}$
. Since
 $Nu$
scales with
 $Pe^{2/3}$
at large
 $Pe$
, the smallest scale is estimated as
 $\unicode[STIX]{x1D706}_{x}\sim Pe^{-2/3}$
, much smaller than the optimal aspect ratio,
 $L/H\sim Pe^{-0.371}$
, in the two-dimensional field (Souza Reference Souza2016). Figure 7(b) shows the mean temperature profile
 $\overline{T}$
as a function of
 $z/\unicode[STIX]{x1D706}_{\unicode[STIX]{x1D703}}$
.
 $1-\overline{T}=z/\unicode[STIX]{x1D706}_{\unicode[STIX]{x1D703}}$
holds at
 $z/\unicode[STIX]{x1D706}_{\unicode[STIX]{x1D703}}\ll 1$
, where the thermal conduction dominates over the convection. As the distance to the wall,
 $z$
increases, the hierarchical vortex structures promote the convective heat transfer. In the region
 $1\lesssim z/\unicode[STIX]{x1D706}_{\unicode[STIX]{x1D703}}\lesssim 10$
where the self-similarity appears, the logarithmic-like temperature profiles are observed at
 $Pe=1008,5041$
and
 $10\,009$
. The dashed line indicates the logarithmic fit
 $1-\overline{T}=0.0358\ln (z/\unicode[STIX]{x1D706}_{\unicode[STIX]{x1D703}})+0.423$
determined in the range
 $2<z/\unicode[STIX]{x1D706}_{\unicode[STIX]{x1D703}}<4$
at
 $Pe=10\,009$
. Recently, the logarithmic temperature profiles have also been observed numerically and experimentally in turbulent Rayleigh–Bénard convection (Ahlers et al.
Reference Ahlers, Bodenschatz, Funfschilling, Grossmann, He, Lohse, Stevens and Verzicco2012; Ahlers, Bodenschatz & He Reference Ahlers, Bodenschatz and He2014). In the region far from the wall,
 $10\unicode[STIX]{x1D706}_{\unicode[STIX]{x1D703}}\lesssim z\leqslant 1/2$
, mixing by the large-scale convection cells is dominant, and thus the temperature profile is flattened.
(a) Energy spectra
 $k_{x}E_{w}(k_{x},z)$
as a function of
 $z$
and
 $\unicode[STIX]{x1D706}_{x}$
. The energy spectra
 $k_{x}E_{w}$
, the distance to the wall,
 $z$
and the wavelength in the
 $x$
-direction,
 $\unicode[STIX]{x1D706}_{x}$
are normalised by
 $\unicode[STIX]{x1D706}_{\unicode[STIX]{x1D703}}=(2Nu)^{-1}$
. The dashed diagonal indicates
 $\unicode[STIX]{x1D706}_{x}=L_{x}z$
. (b) Mean temperature profile
 $\overline{T}$
as a function of
 $z/\unicode[STIX]{x1D706}_{\unicode[STIX]{x1D703}}$
. The black solid curve indicates
 $1-\overline{T}=z/\unicode[STIX]{x1D706}_{\unicode[STIX]{x1D703}}$
, and the dashed line represents the logarithmic fit
 $1-\overline{T}=0.0358\ln (z/\unicode[STIX]{x1D706}_{\unicode[STIX]{x1D703}})+0.423$
determined in the range
 $2<z/\unicode[STIX]{x1D706}_{\unicode[STIX]{x1D703}}<4$
at
 $Pe=10\,009$
.

7 Summary and conclusions
We have found the three-dimensional optimal states which lead to the scaling
 $Nu\sim Pe^{2/3}$
consistent with the ultimate scaling
 $Nu\sim Ra^{1/2}$
in Rayleigh–Bénard convection. The optimal heat transfer is achieved by three-dimensional convection cells with smaller-scale vortices attached on the walls. At large
 $Pe$
, the optimal velocity field exhibits hierarchical self-similarity. The large-scale cells mix up the temperature almost completely around the midplane between the two walls. Near the walls, meanwhile, self-similar vortical structures locally enhance heat transfer, and yield a logarithmic-like mean temperature distribution. Our earlier optimisation for heat transfer in plane Couette flow (Motoki et al.
Reference Motoki, Kawahara and Shimizu2018) provided the optimal velocity fields in which we observed hierarchical structure consisting of a number of streamwise vortex tubes. The logarithmic-like mean temperature profiles as well as the ultimate scaling
 $Nu\sim Ra^{1/2}$
were also found in the optimal fields. It has recently been rigorously proved that the ultimate scaling
 $Nu\sim Ra^{1/2}$
with logarithmic corrections can be achieved by some velocity field which is two-dimensional but exhibits hierarchical self-similarity (Tobasco & Doering Reference Tobasco and Doering2017). These results suggest that self-similar hierarchy of a velocity field would be a necessary condition for the emergence of the ultimate scaling and logarithmic-like mean temperature profile between two parallel no-slip plates.
In order for the optimal state achieving maximal heat transfer to fulfil the Navier–Stokes equation we need external body force
 $$\begin{eqnarray}\displaystyle \boldsymbol{f}\equiv -(\boldsymbol{u}\boldsymbol{\cdot }\unicode[STIX]{x1D735})\boldsymbol{u}-\unicode[STIX]{x1D735}p+Pr\unicode[STIX]{x1D6FB}^{2}\boldsymbol{u}+PrRa(1-z+\unicode[STIX]{x1D703})\boldsymbol{e}_{z}, & & \displaystyle\end{eqnarray}$$
which is different from the buoyant force in the Boussinesq equation, where
 $(\boldsymbol{u},\unicode[STIX]{x1D703})$
is an optimal solution to the Euler–Lagrange equations (2.8)–(2.12) and
 $p$
is pressure determined by the Poisson equation stemming from the Boussinesq equations. Our preliminary study, however, demonstrates that by using homotopy from the body force to the buoyancy the optimal state can be continuously connected to a steady solution to the Boussinesq equation. Although the connected solution is not stable, it reproduces the mean and root-mean-squared velocities and temperature as well as thermal plumes in turbulent Rayleigh–Bénard convection. This steady solution to the Boussinesq equation exhibits the usually observed scaling
 $Nu\sim Ra^{1/3}$
rather than the ultimate scaling
 $Nu\sim Ra^{1/2}$
. It can be stated that the optimal state identified for maximal heat transfer in this work is relevant to convective turbulence in the sense that its connected solution to the Boussinesq equation represents well the structure and statistics in a turbulent state. The authors are currently working on investigating the steady solutions in the Rayleigh–Bénard convection case and establishing a relation between solutions of the Euler–Lagrange equations and the Boussinesq equations. The results will be presented in a separate paper.
Acknowledgements
We are grateful to Professor C. R. Doering at University of Michigan for useful discussions and suggestions. This work was partially supported by a Grant-in-Aid Scientific Research (grant nos 25249014, 26630055) from the Japanese Society for Promotion of Science 665 (JSPS). S.M. is supported by JSPS Grant-in-Aid for JSPS Fellows grant no. 666 16J00685.
Appendix A. Dependence of optimal states on domain size and spatial resolution
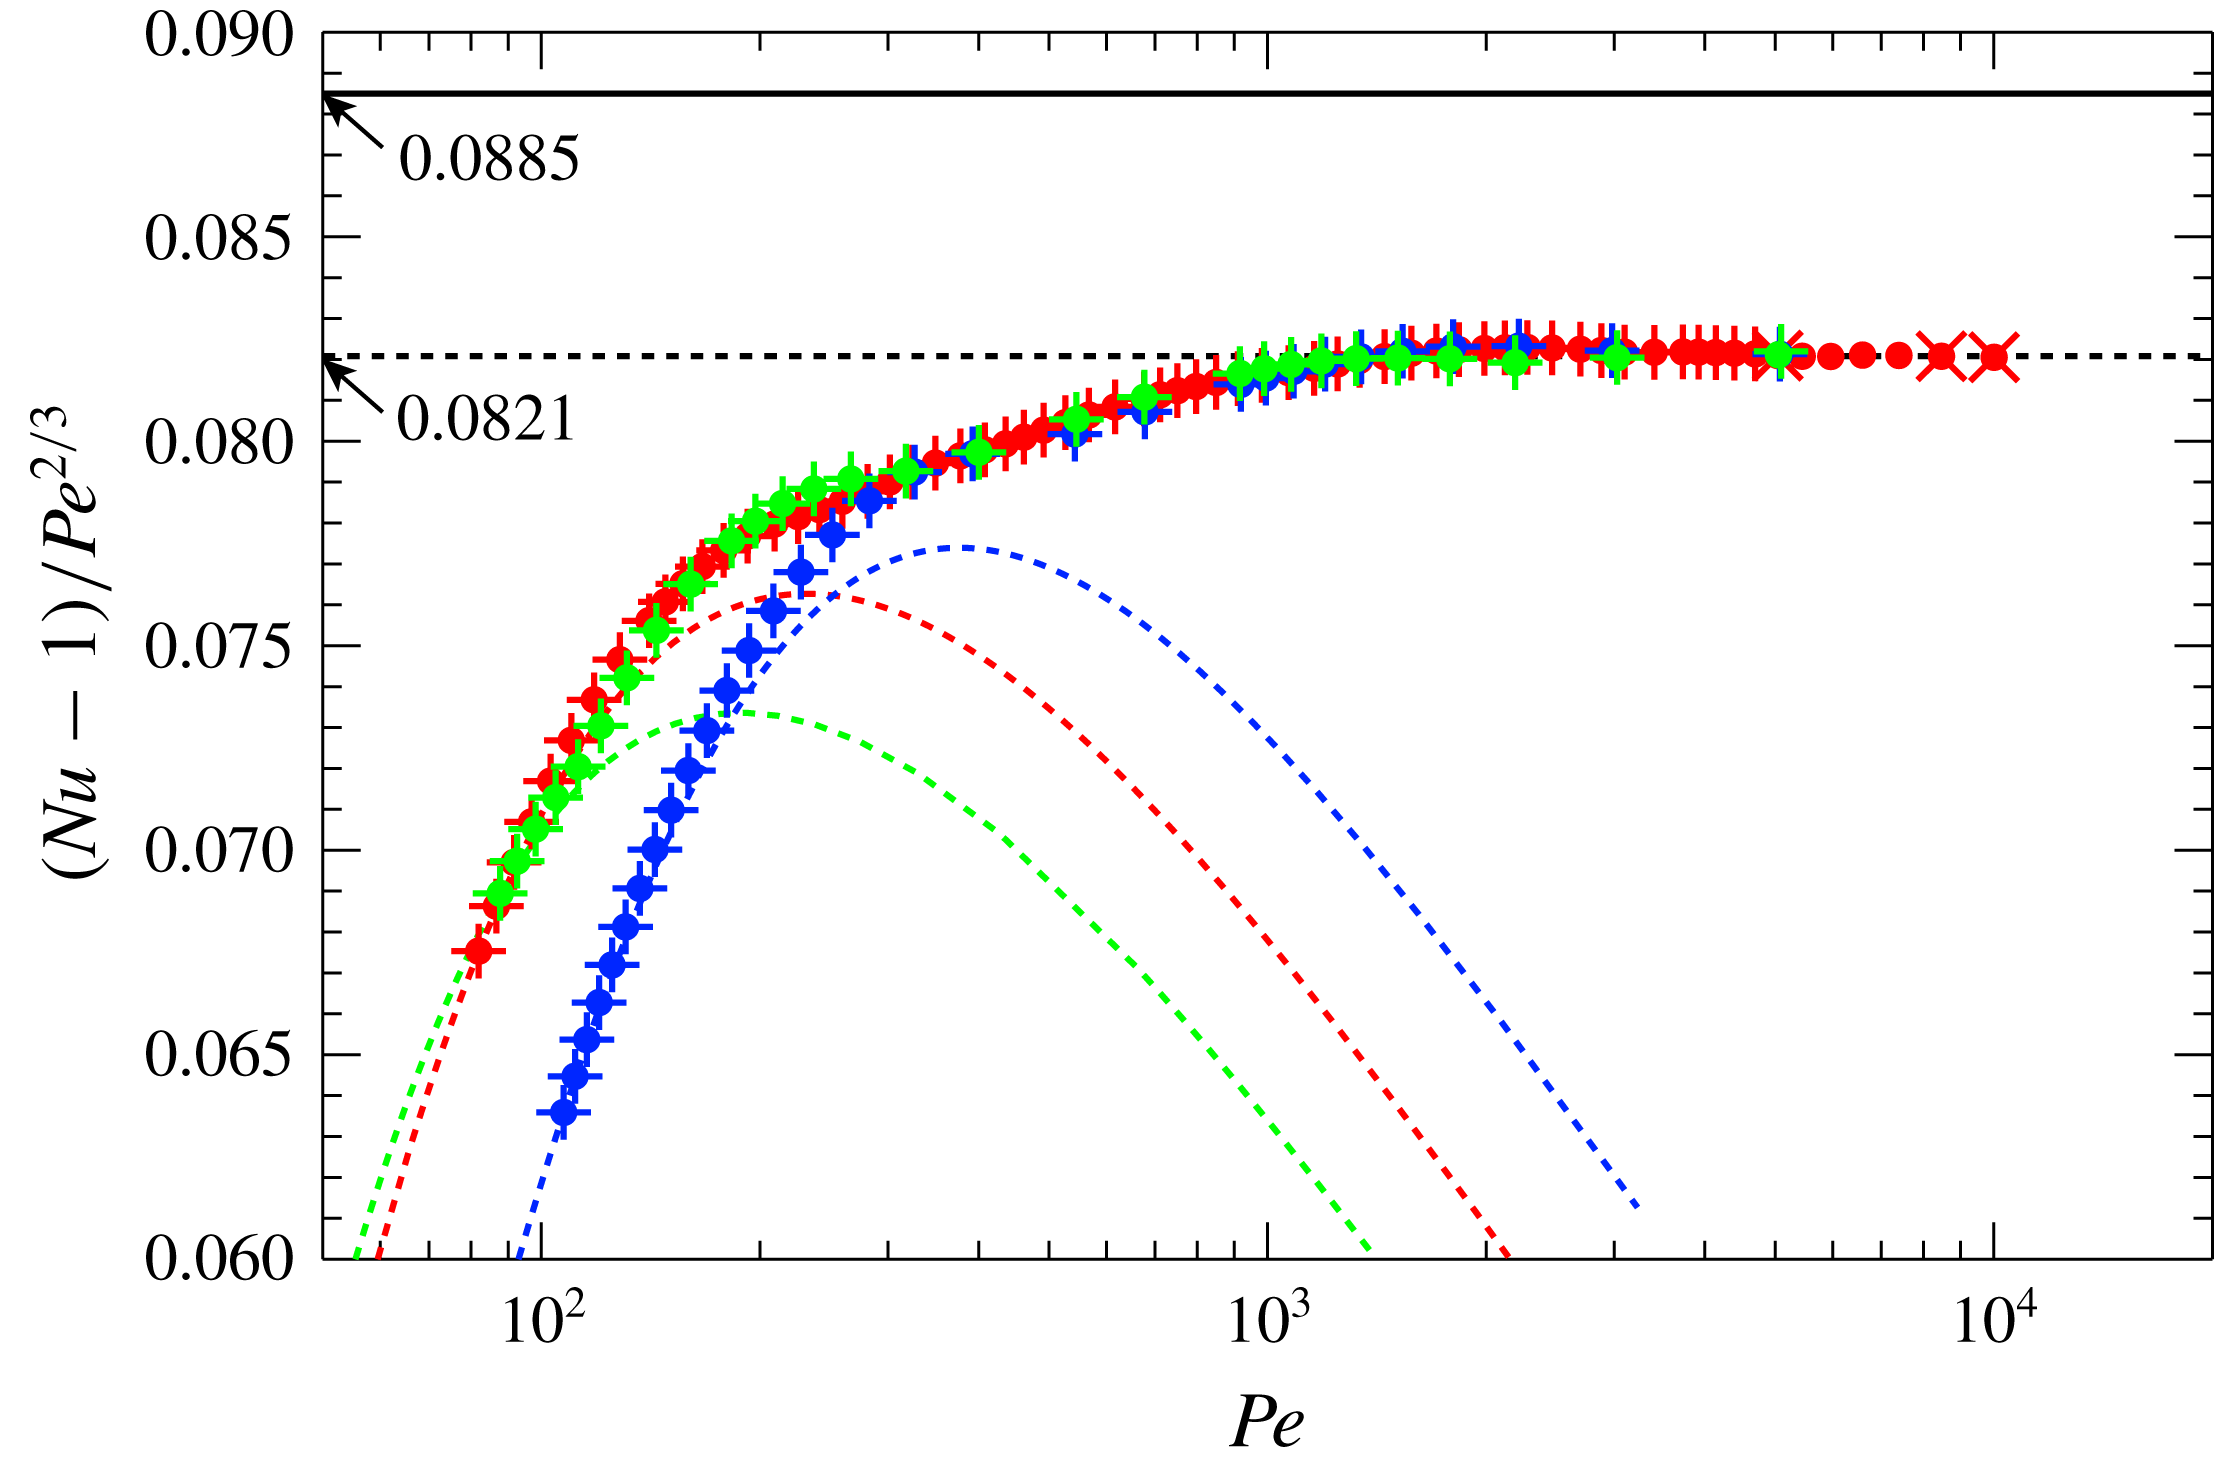
Figure 8 shows the Nusselt number compensated by
 $Pe^{2/3}$
as a function of
 $Pe$
in the optimal states for different domain sizes. The green, red and blue symbols represent the domains
 $(L_{x},L_{y},L_{z})=(2,2,1),(\unicode[STIX]{x03C0}/2,\unicode[STIX]{x03C0}/2,1)\approx (1.57,1.57,1)$
and
 $(\unicode[STIX]{x03C0}/(2\sqrt{2}),\unicode[STIX]{x03C0}/(2\sqrt{2}),1)\approx (1.11,1.11,1)$
, respectively. In any domains, the appearance of three-dimensional optimal states and the scaling
 $Nu-1\approx 0.082Pe^{2/3}$
at
 $Pe\gtrsim 10^{3}$
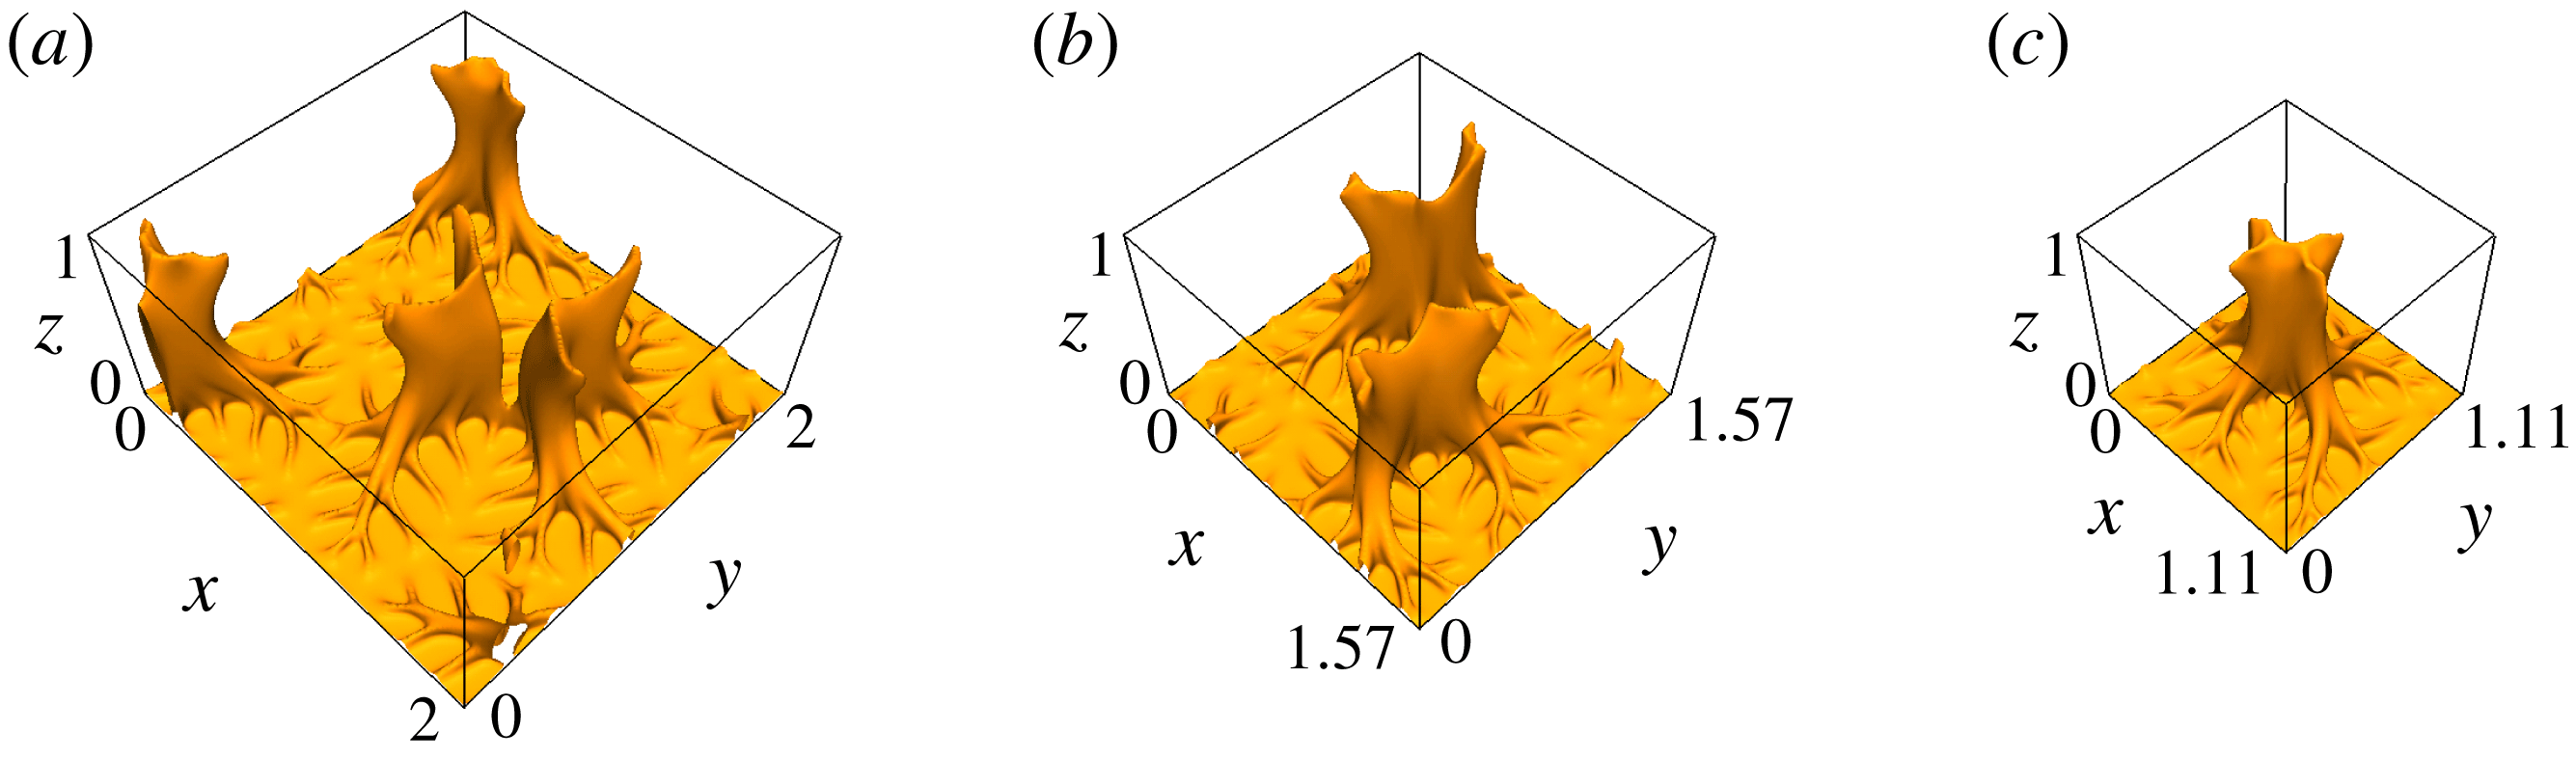
can be observed. For the present optimisation problem, it is expected that there exists a velocity field with the domain size which leads to the global optimal. However, we predict that the improvement in prefactor by optimising the domain size would not be significant, since it is considered that the emergence of the hierarchical small-scale structures near the walls, which are robustly observed in different domain sizes (figure 9), plays a key role in the heat transfer enhancement.
In figure 8, the symbols
 $+$
, ● and
 $\times$
respectively show the results obtained on different grid points of
 $64^{3}$
,
 $128^{3}$
and
 $256^{3}$
, and the effects of the spatial resolutions on the Nusselt number and the Péclet number (i.e., the enstrophy) are minor. For the domain
 $(L_{x},L_{y},L_{z})=(\unicode[STIX]{x03C0}/2,\unicode[STIX]{x03C0}/2,1)$
, a spatial resolution of
 $128^{3}$
grid points is enough to evaluate the characteristics of the optimal states at
 $Pe\lesssim 10^{4}$
;
 $64^{3}$
grid points are sufficient at
 $Pe\lesssim 10^{3}$
.
Nusselt number
 $Nu$
compensated by
 $Pe^{2/3}$
as a function of the Péclet number
 $Pe$
in the optimal states for different domains. The green, red and blue symbols (or dashed curves) respectively show the domains
 $(L_{x},L_{y},L_{z})=(2,2,1),(\unicode[STIX]{x03C0}/2,\unicode[STIX]{x03C0}/2,1)$
and
 $(\unicode[STIX]{x03C0}/(2\sqrt{2}),\unicode[STIX]{x03C0}/(2\sqrt{2}),1)$
(or the two-dimensional domains
 $(L_{x},L_{z})=(2,1),(\unicode[STIX]{x03C0}/2,1)$
and
 $(\unicode[STIX]{x03C0}/(2\sqrt{2}),1)$
). The three-dimensional (or two-dimensional) solutions are obtained on grid points of
 $+$
,
 $64^{3}$
; ●,
 $128^{3}$
;
 $\times$
,
 $256^{3}$
(or
 $256^{2}$
). The solid and dashed lines represent the scaling
 $Nu-1=0.0885Pe^{2/3}$
(evaluated from the rigorous upper bound by Plasting & Kerswell Reference Plasting and Kerswell2003) and
 $Nu-1=0.0821Pe^{2/3}$
(determined from the power fit at
 $Pe>5\times 10^{3}$
), respectively.

Optimal states in the domain of (a)
 $(L_{x},L_{y},L_{z})=(2,2,1)$
, (b)
 $(L_{x},L_{y},L_{z})=(\unicode[STIX]{x03C0}/2,\unicode[STIX]{x03C0}/2,1)$
and (c)
 $(L_{x},L_{y},L_{z})=(\unicode[STIX]{x03C0}/(2\sqrt{2}),\unicode[STIX]{x03C0}/(2\sqrt{2}),1)$
. The orange objects show the isosurfaces of the temperature
 $T=0.75$
. The Péclet number is (a)
 $Pe=5051$
, (b)
 $Pe=5041$
, (c)
 $Pe=5074$
.