1. Introduction
Mega cities in developing countries are witnessing a rapid decline in green spaces and wetlands, even as demand for environmental quality increases with the growth in the middle class. Hussain Sagar is a manmade lake located in Hyderabad, a metropolis in southern India with a population of over 7.17 million. The lake, which was constructed in AD 1562 to meet irrigation needs, now serves as a source of recreation for the citizens of the thriving twin cities of Hyderabad and Secunderabad. In this paper, we examine the demand for recreation in and around the Hussain Sagar, and improvements that could make the lake even more useful. Quantitative estimates of the benefits of improved water quality are critical to facilitate urban planning in mega cities, particularly in India. With such estimates, we hope to provide decision makers with information needed to address land grab and pollution challenges that steadily erode the environmental amenities of urban areas.
Hussain Sagar, which was used for drinking water between 1884 and 1930, is now managed solely for recreational purposes (EPTRI, 1996). With its many parks and picnic areas, a large monolithic Buddha statue and boating facilities, Hussain Sagar attracts a multitude of tourists as well as residents. For instance, just one of the surrounding parks, Lumbini Park, receives some one million visitors every year. Yet, over the years, the area of lake has shrunk from more than 1,000 ha to about 550 ha due to encroachment by homeowners and industries. The lake is also severely polluted because of the discharge of untreated domestic sewage and toxic industrial chemicals through four natural drains (Hussain, Reference Hussain1976; Ramachandraiah and Prasad, Reference Ramachandraiah and Prasad2004; Rao, Reference Rao2008a). Over the years, these inflows have deposited nutrient-rich sediments in the lake. These sediments dissolve into the polluted lake, contributing to eutrophication, algal bloom, growth of water hyacinth and bad odor. Regular immersing of clay idols during the annual Ganesh festival has only exacerbated this problem.
While visitors to Hussain Sagar use the lake only for boating purposes, several surrounding parks offer many forms of recreation. Increasingly, however, visitors to these parks complain of the foul smell arising from the lake (Rao, Reference Rao2008b). Thus it is quite likely that visits to the area would increase and the recreational experience would improve if the lake was cleaned up. Improvements in water quality would also open the door to other recreational activities such as fishing, swimming and pisciculture. Thus it is useful to ask whether the benefits of cleaning up the lake would outweigh the costs associated with reducing pollution.
The demand for recreation in the Hussain Sagar area crucially depends on water quality (Rao, Reference Rao2008b). While local administrators are aware of this, they lack information as to how visitors' demand and activities at a recreational site may change with different levels of environmental quality. Also missing is evidence as to how visitors may assign value to recreational quality under various management options. Our study aims to address these issues to provide urban development authorities with information that will allow them to make better decisions related to park management.
Worldwide, a number of studies have used environmental valuation methods, such as the travel cost method (TCM) and the contingent valuation method (CVM), to examine the effects of a change in water quality on demand for recreation (Bockstael et al., Reference Bockstael, Hanemann and Kling1987, Reference Bockstael, McConnell and Strand1989; Parsons and Kealy, Reference Parsons and Kealy1992; Kaoru, Reference Kaoru1995; Needelman and Kealy, Reference Needelman and Kealy1995; Pendleton and Mendelsohn, Reference Pendleton and Mendelsohn2000). Many of the TCM studies, however, estimate benefits from recreation considering only the current level of water quality. This is mainly because the single-site TCM does not allow for shifts in the demand curve from an improvement in water quality. There are, however, newer studies that combine stated preference (SP) and revealed preference (RP) approaches (Cameron, Reference Cameron1992; Adamowicz et al., Reference Adamowicz, Louviere and Williams1994; Kling, Reference Kling1997; Whitehead et al., Reference Whitehead, Timothy and Huang2000; Hanley et al., Reference Hanley, Bell and Alvarez-Farizo2003) to get to an understanding of how welfare changes with quality changes. The main benefit from these studies is that, while they are RP based, they are also able to present less biased and more precise welfare measures of quality changes (Kling, Reference Kling1997).
Our study attempts to estimate the recreational benefits from controlling water pollution in Hussain Sagar by applying both RP and SP approaches to valuation. For the SP application, we use a contingent behavior approach, while the RP application is the TCM. The analysis is based on a primary data set exclusively collected for the purposes of this study in 2011. This approach allows us to widen and evaluate management policies that are yet to be implemented (Layman et al., Reference Layman, Boyce and Criddle1996). Another unique aspect of our study is that we have included on-site and off-site respondents in our survey. Most studies confine themselves to on-site sampling. Thus our study offers a methodological improvement by estimating off-site demand in addition to demand for recreation by on-site users.
While a number of studies in India estimate the recreational value of national parks and tiger reserves (Manoharan, Reference Manoharan1996; Gupta and Mythili, Reference Gupta and Mythili2010; De and Devi, Reference De and Devi2011; Verma and Negandhi, Reference Verma and Negandhi2011; Bharali and Mazumdar, Reference Bharali and Mazumder2012), only a small subset focuses on well-used urban parks (see, for example, Chaudhry and Tewari (Reference Chaudhry and Tewari2008) on Rock Gardens in Chandigarh). These studies use various RP and SP techniques to estimate annual recreational benefits, but generally ignore benefits to off-site residents. Our research adds to this growing literature on environmental valuation in India. We are particularly interested in strengthening the policy and management contributions of this literature by identifying a clear set of policy options for park managers.
Several scientific papers point to the growing pollution levels in Hussain Sagar (Hussain, Reference Hussain1976; Ramachandraiah and Prasad, Reference Ramachandraiah and Prasad2004; Rao, Reference Rao2008a). However, ours is the first study to estimate the recreational benefits to visitors from reducing water pollution. In a related effort, Rao (Reference Rao2008b) analyzed visitor feedback on a certain set of gardens; however, he did not emphasize the pollution aspects of the lake. Thus, our study is a first attempt to estimate what citizens are willing to pay for the recreational facilities offered by the lake, address how this demand may change if the water and site quality improves, and identify what fees the park authorities may be able to charge to obtain revenues to clean up the lake and its surroundings.
2. Study area and data
2.1. Study area and visitors
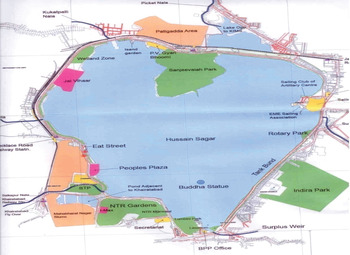
Hussain Sagar is a lake that is surrounded by many parks and visitation areas. A map of the lake with all the parks surrounding it is shown in figure A1 in the appendix. Around the lake are Lumbini Park, NTR Gardens, Necklace Road, People's Plaza, NTR Memorial, Sanjeevaiah Park, Lakeview Park, Lumbini Laserium and P.V. Gyan Bhoomi. Of these, Lumbini Park has numerous attractions such as boating, guided cars for children, interactive waterfalls and pop-up fountains. NTR Gardens has a toy train, a Japanese garden and a fruit restaurant. Necklace Road has landscaping on lake banks, food courts, walkways and boating. People's Plaza can be rented for private events. Sanjeevaiah Park has a peripheral walkway, lawns, a floral clock, a cafeteria, palm, rock and bamboo gardens and a children's science park.
The Government of Andhra PradeshFootnote 1 has made many institutional and infrastructural changes to improve the lake.Footnote 2 In 2000 the Buddha Purnima Project Authority (BPPA) was constituted to develop Hussain Sagar and its surrounding areas under the provisions of the Andhra Pradesh Urban Areas (Development) Act 1975.Footnote 3 The Government of Andhra Pradesh also constructed a 20 million liter per day sewage treatment plant (STP) to treat the sewage before discharging effluents into the lake, but this has proved insufficient.Footnote 4 From 2006 to 2012, the Government of India and the Japan Bank for International CooperationFootnote 5 implemented the ‘Hussain Sagar Lake and Catchment Area Improvement Project’, focusing on preventing pollutants from entering the lake, catchment area improvement, upgrading and construction of an additional STP, dredging of the lake bed, and more. Thus the lake and its surroundings are an important asset for visitors and the government and there is interest in improving it.
Our study is based on secondary as well as primary data on visitors and their demand for recreation. First, we collected secondary data on the number of visitors coming to different parks near the Hussain Sagar Lake from the BPP office. This office maintains data on three parks, i.e., Lumbini Park, NTR Park and Sanjeevaiah Park. According to the available data, of the three parks Lumbini Park has the highest number of visitors.
Monthly data for visitors show that the number of visitors to Lumbini Park is highest in May and June followed by December and January. According to the BPPA, school holidays are an important factor during these four months. Numbers have remained unchanged over the years in Sanjeevaiah Park, a favorite destination for young couples. Recently, the BPP constructed an adjacent children's park, which has become a major attraction for children throughout the year.
2.2. Sampling strategy
The sample for our study is drawn from the city of Hyderabad (including its twin city Secunderabad).Footnote 6 According to the 2011 Census, the Greater Hyderabad Municipal Corporation (GHMC) has a population of 7.17 million. The first step in our data collection strategy was to decide whether we needed to undertake only an on-site survey around Hussain Sagar or an off-site survey as well. To make this decision and in order to identify how large the visitation to Hussain Sagar was from areas further away from it, we first undertook a pilot survey.
For our off-site pilot survey, we focused on residents who go to bill payment centers in the city. We ruled out the telephone survey method as this would miss out on a section of residents who do not have a landline telephone connection and cellular phone users, who are not listed. Almost all residents have an electricity connection and most pay electricity bills at utility centers called ‘eSeva’. These centers function as a bill payment gateway for multiple utilities (water, electricity and telephones).Footnote 7 Out of the 56 eSeva centers in the twin city, we randomly identified 37 centers for our pilot survey. In May 2010 we undertook a survey of 512 randomly selected bill payers at these eSeva centers.
The off-site pilot survey (a one-page questionnaire) asked about visits to Hussain Sagar. The results showed that 76 per cent of the respondents had visited the lake during the past 12 months, which in turn indicated that almost three-quarters of Hyderabad's residents had visited the lake at least once during the past 12 months. Hence, surveying only on-site respondents would provide a biased estimate of the benefits from recreation in Hussain Sagar. Thus it was important to include off-site respondents as well.
For the on-site survey, we selected Lumbini Park because it had the highest number of visitors (1,608,965 in 2009–2010) in comparison to other recreational pockets. On average, 4,000 visitors come to Lumbini Park every day. For the detailed on-site survey, we decided on a sample size of 10 per cent of the previous year's (2009–2010) per day visits, i.e., 400. We used systematic random sampling to select our survey on-site respondents, selecting every 10th visitor as a respondent. We collected data on all seven days of the week.
We drew the off-site sample from among the residents of the GHMC area, which is divided into five zones (North, South, Central, East and West). These five zones are subdivided into 18 circles which are further divided into 150 election wards. There are 56 eSeva centers in these 150 election wards.Footnote 8 We undertook the final off-site survey in all 56 eSeva centers using a multi-stage random sampling method. For the final off-site survey, we selected the same number of off-site respondents as on-site respondents (i.e., 400 respondents).
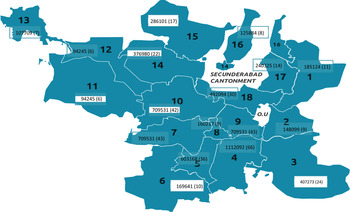
In the off-site sample, we selected the number of respondents in each area in proportion to the zone and circle populations of that area. In the first stage, we divided the respondents according to the percentage of the zonal population. As the East zone of the GHMC had 11 per cent of the city's population, we took 11 per cent of respondents, i.e., 44 out of 400, from this zone. In the second stage, we divided the respondents per the circle population. For instance, East zone has three circles: Kapra (25 per cent of zonal population), Uppal (20 per cent) and LB Nagar (55 per cent). Accordingly, we took 25 per cent of the East zone respondents, i.e., 11 out of 44, from Kapra circle. We followed a similar strategy with the other circles. As all the circles have more than one eSeva center, we divided the number of respondents equally among all the eSevas, taking care to cover all 56 eSeva centers in the city. Figure 1 shows the map of GHMC with its 18 circles, population and sample drawn.
Greater Hyderabad Municipal Corporation circle map with population and sample

2.3. Surveys and environmental quality scenarios
We administered the same survey questionnaire to both off-site and on-site respondents during 2011. The questionnaire gathered information on socio-economic details, recreational activities, including travel cost, and planned trips in the next 12 months with various choices of entry fees and water quality.
The survey questionnaire asked how many trips visitors planned to make per year if the water quality of the lake and other recreational facilities was improved, with the entry fee remaining the same (INR10) or with a gradual increase in the entry fee. The entry fee was varied randomly for different respondents with five possible bid values (INR15, 20, 30, 40 and 50). We gave each respondent one bid at random and asked him/her to respond to this bid.
The reference to water quality in the survey, however, does not include a scientific assessment of the water quality. Instead, ‘quality’ is identified in terms that a layperson can understand. Also, respondents were asked to consider improvements in water and site quality. The park's site facilities can be improved by introducing water sports, adding drinking water taps, fountains, improving food quality, increasing seating arrangements (i.e., extra benches under shelters or in the shade to protect users from sunlight and rain), increasing the number of restrooms and trashcans, extra security with cameras, banning of illegal activities, and making the lake a plastic-free zone.
We asked the respondents an open question regarding what kinds of improvements they would like to see around the Hussain Sagar Lake area. In response, the major improvements suggested were improvements in water quality of the lake, banning of plastic carrier bags, installation of close circuit cameras, more trash cans and restrooms, increase in seating arrangements, prevention of religious statue immersion, increase in greenery, concessions for family groups, and increase in public awareness about pollution. We then asked visitors about the number of visits they would make if all the suggestions for improvement were implemented. The final question combined improvements with an increase in the entry fee.
The survey showed respondents three hypothetical environmental quality scenarios (current conditions plus two hypothetical situations). Scenario 1 was presented to all 800 on-site and off-site respondents, while scenarios 2 and 3 were presented to all on-site respondents and only to those 309 off-site respondents who had visited the lake in the last 12 months.
-
• Scenario 1 (T1) asked the RP ‘visitation’ question, i.e., how many times have respondents visited the lake during the last 12 months.
-
• Scenario 2 (T2) asked respondents how many times they would like to visit the lake if the water quality of the lake and other facilities in the park improved with the entry fee remaining the same.
-
• Scenario 3 (T3) asked respondents how many times they would like to visit the lake if the water quality of the lake and other facilities in the park were improved along with a hike in the entry fee.
In general, the purpose of creating these hypothetical scenarios was: (i) to collect information about the demand for trips at the current level of water quality; and (ii) to estimate shifts in the demand curve for trips with improvements in water quality and site facilities, which would also allow for other recreational activities, such as fishing, swimming, pisciculture and water games. These other recreational options are not possible with current levels of water pollution.
The nature of our data set with two different ‘environmental quality’ scenarios raises two important questions for estimation. First, although the survey included off-site visitors, for the T1 scenario, we asked travel cost questions only from those respondents who had visited the lake during the past 12 months. Therefore, our sample is truncated at zero because it does not include non-visitors.
The second issue is that our on-site sampling for scenarios T1, T2 and T3 is also endogenously stratified, with over-sampling of those who visited the lake frequently. In this context, the zero-truncated endogenously stratified model is a solution (Cullinan et al., Reference Cullinan, Hynes and O'Donoghue2007), as it takes care of all three problems of count data and over-dispersion, truncation at zero and endogenous stratification.
3. Descriptive statistics
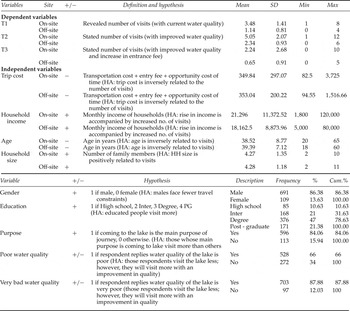
Of the 400 off-site respondents, 77 per cent reported that they had been to the Hussain Sagar during the past 12 months. The shared attribute between the on-site and off-site respondents is that all of them are residents of Hyderabad-Secunderabad. As the on-site respondents are from the park, their minimum number of visits to the lake is one. Since the off-site respondents are taken from eSeva offices, there is a probability that they may not have visited the lake during the past 12 months. The descriptive statistics of the sample are reported in table 1.
Summary statistics of variables and associated hypotheses

The average trip cost of an on-site respondent is INR395 and that of an off-site respondent is INR353. The average respondent is about 38 years of age and married. The household size is about 4. Most of the respondents are graduates with a monthly household income varying between INR18,000 and 21,000 (US$300–350).Footnote 9 We note that the median annual income of India in 2013 (covering urban and much poorer rural populations) was US$616. The major professions among the respondents are employment with the government, followed by private sector jobs and self-employment (business). A majority of the respondents, both on-site and off-site, said that the main purpose of their journey to the park was to visit the lake. The average journey time to get to the lake is 45 minutes. On average, respondents spent 1.5–2 hours at the lakeside park.
In the on-site survey, the highest number of respondents (48 per cent) travelled by public bus, followed by motorcycle (22 per cent). In the off-site survey, the highest number of respondents (49 per cent) travelled by motorcycle, followed by public bus (27 per cent). The results of both surveys show that most visitors' spending goes towards entertainment such as boating, laser show and car riding. In the on-site survey, 39 per cent of the total amount spent by visitors was for entertainment, followed by food and drinks (27 per cent). In the off-site survey, 36 per cent of the total spending was for entertainment, followed by private transportation costs (26 per cent). While at the park, the respondents said that they participated in several activities such as walking, boating and playing with their children.
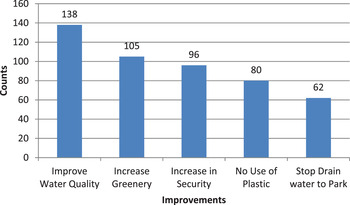
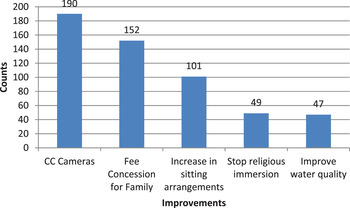
The improvements suggested by the on-site and off-site respondents are presented in figures 2 and 3, respectively. The main improvements that visitors would like to see are improvement in water quality, increase in greenery and security, no use of plastic, stoppage of drain water into the lake, installation of CC cameras, concession in fees for families, increase in sitting arrangements and stopping of religious immersion. However, there is a difference between the preferences of on-site and off-site respondents: while the on-site respondents give more importance to water quality and existing recreational facilities, off-site respondents give more importance to security.
Improvements suggested by on-site respondents

Improvements suggested by off-site respondents

4. Methods
As previously identified, our study uses both SP and RP methods to assess demand for water quality. Englin and Cameron (Reference Englin and Cameron1996) used SP and RP data to assess the change in trip frequency as the price changed. Similarly, Layman et al. (Reference Layman, Boyce and Criddle1996) used a hypothetical TCM to understand how the number of trips would change if alternative fishery management practices were imposed. Our study builds on this literature to identify changes in visitors' demand because of changes in the facilities in and around the lake. We start with a simple model of demand for recreation and examine the different factors that may shift demand. Our study is partly modeled after Whitehead et al. (Reference Whitehead, Timothy and Huang2000), as we examine demand for Hussain Sagar by on-site and off-site citizens.
4.1. The model
Theory and a large body of empirical literature suggest that basic factors such as price, water and site quality and income influence recreational demand (Whitehead et al., Reference Whitehead, Timothy and Huang2000). Thus the j th individual's recreational demand function is written as follows:
 $$X_j = x\lpar p_j\comma \; q_j\comma \; y_j\rpar \comma \; $$
where X j = the number of trips to the recreation site, which can take any value between 0 to k, p j = the travel and time costs to access the site, q j = quality of the site, and y j = income.
The trip cost includes the travel cost (transportation cost and entry fee to the park) and the opportunity cost of time. Measuring the opportunity cost of time, however, is difficult. We use a simple procedure by multiplying the duration of the trip with per hour wages/salary of the respondents.Footnote 10
Individuals derive benefits from recreation, represented by the consumer surplus associated with any single trip. The consumer surplus of trips to the site is equal to the area beneath the demand function and above the implicit price. With any improvement in quality from q to q', the demand function for recreation shifts to the right (Whitehead et al., Reference Whitehead, Timothy and Huang2000). Thus the change in consumer surplus because of a change in environmental quality is given by:
 $$\Delta CS = \vint\limits_{p^0}^{p^{c'}} x'\lpar ..\comma \; q'\rpar dp - \vint\limits_{p^0}^{p^c} x\lpar ..\comma \; q\rpar dp\comma \; $$
where p 0= the price to visit the site and p c′ and p c = the choke prices of the demands under quality q ′ and q, respectively. ΔCS = change in consumer surplus.
In empirically estimating the above TCM (1), we note that the dependent variable, the number of trips made to the site, is not a continuous variable, as visitors can only make a limited number of trips. Rather, the dependent variable is in the form of count data. Thus, to obtain unbiased estimators of demand, we use a Poisson regression model, the simplest form of standard count data estimators (Cullinan et al., Reference Cullinan, Hynes and O'Donoghue2007).
When a sample is drawn from an on-site survey, we face the problem of endogenous stratification. It causes bias and inconsistency in the estimate of β (Shaw, Reference Shaw1988). To correct this procedure we run the standard Poisson regression, taking x – 1 instead of x as the dependent variable. We have followed Englin and Shonkwiler (Reference Englin and Shonkwiler1995) who provide a simple re-parameterization of the dependent variable which allows a regular Poisson procedure to be applied to get endogenously stratified and truncated parameter and standard error estimates. The same model is applied to all three scenarios.
Because of the count data nature of our dependent variable, estimating consumer surplus is not straightforward. However, following Hellerstein and Mendelsohn (Reference Hellerstein and Mendelsohn1993), the conventional formula to calculate the consumer surplus for a semi-log model is the same as that for the integer constrained quantity demand variable. The Poisson and negative binomial regressions are equivalent to a semi-log functional form when there is a linear relationship between the dependent variable and the own price variable. The expected value of consumer surplus derived from count data models can, accordingly, be calculated as:
 $$E\lpar CS\rpar = -\hat{\lambda}_i / \hat{\beta}_{TC}\comma \; $$
where
 $\hat{\lambda}_{i}$
is the expected number of trips and
 $\hat{\beta}_{TC}$
is the estimated travel cost coefficient. The estimated per trip consumer surplus is thus equal to
 $-1/\hat{\beta}_{TC}$
and this holds for all the models estimated. The per year consumer surplus estimate is E(r)/(−β), where β is the estimated travel cost coefficient
 $\hat{\beta}_{TC}$
and E(r) is average annual visits (Adamowicz et al., Reference Adamowicz, Fletcher and Graham-Tomasi1989).
5. Results and discussions
5.1. Econometric analyses of demand functions
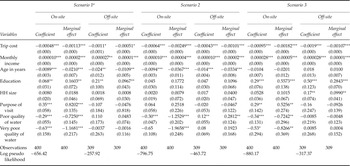
Table 2 gives the results of the Poisson regression estimates. Scenario 1 presents trips made by on-site and off-site respondents given current water and site quality (RP). Scenario 2 reflects visits if water and site quality is improved. Scenario 3 estimates trip preferences when water and site quality is improved and entry fees are increased.
Poisson parameter estimates of six models

Notes: Robust standard errors in parentheses. ***p < 0.01, **p< 0.05, *p< 0.1. a Scenario 1 is revealed preference with current quality; scenario 2 is stated preference with improved quality; scenario 3 is stated preference with improved quality and a hike in entry fee.
In scenario 1 in table 2, the trip costs have the expected negative sign, implying a negatively sloped demand curve for visits to Hussain Sagar Lake and its surroundings. The coefficient on the income variable is positive and significant, suggesting that people visit more when there is an increase in income. Older people visit less because of physical constraints. ‘Education’ is a categorical explanatory variable which, as expected, suggests that the more educated have a higher rate of visits. ‘Purpose’ is a dummy variable which has the value 1 if coming to the lake is the main purpose of the respondent's visit. This variable has a significant and positive relationship with the number of visits for on-site. Among on-site visitors, respondents who said that either the water quality is bad or very bad make fewer visits to the lake.
All the variables in scenario 2 have the same signs as in the case of scenario 1. The only difference is in the case of off-site respondents who said that water quality is very bad, but indicated that they might visit more if its quality were improved.
Scenario 3 identifies results when site quality is improved along with a price hike. We note first that only 129 out of 309 off-site respondents indicated that they would visit if improved quality is accompanied by an increase in the entry fee. For on-site visitors, the relationship between the independent variables and the number of trips is the same as scenarios 1 and 2 (on-site). Thus, for example, the variable income is positively associated with trip frequency when both water quality and entry fees are simultaneously raised. For off-site visitors, the direction of the effect of a few of the explanatory variables (age and very poor quality of water) changes relative to scenarios 1 and 2 (off-site). The fact that age has a positive relationship with visits suggests that higher age group visitors are more likely to visit more with improved water quality, even with a higher entry fee. Also, respondents who say water quality is very bad wish to visit more with improved quality of water. They are willing to pay a higher entry fee for this benefit.
Of note is the price elasticity of demand for recreational visits. Price elasticity varies from -0.04 (scenario 1) and -1.03 (scenario 3). The first five models suggest that a 10 per cent increase in travel cost would result in a 0.4–3.4 per cent reduction in the visiting rate. However, in the last model, visitation decreases to 10.3 per cent. This model, which represents off-site respondents, suggests that off-site visitors are likely to have a stronger negative reaction to a high entry fee.
5.2. Welfare changes from variations in price and quality
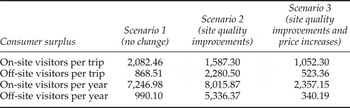
Table 3 shows the estimates of consumer surplus or recreational benefits from visiting the park. With the current level of site quality, the average consumer surplus per trip is INR2,082 (US$35) for on-site respondents and INR868 (US$14) for the off-site respondents. With an improvement in quality (T2), on-site visitors hope to make significantly more trips to the park, but there is a drop in the per trip consumer surplus to INR1587 (US$26). The rate of visits of off-site respondents increases, along with their per tripconsumer surplus, which rises to INR2,280 (US$38). A hike in the entry fee (in scenario T3), as expected, brings the per trip consumer surplus down to INR1,052 (US$17) for on-site respondents and to INR523 (US$9) for off-site respondents. We also estimated the amenity value of the lake by multiplying the consumer surplus by the visitor with the number of annual average visitors to that site. Using different consumer surplus and different scenarios, the amenity value ranges from INR1.76bn to INR3.48bn.
Consumer surplus (recreational benefits) estimates (per household, INR)

Notes: US$1 = INR60 in 2011.
5.3. Simulating changes in revenue
In this section, we predict changes in total revenue to the Park Authority if different entrance fees were charged to visitors. For this analysis, we use data from the on-site visitor survey.Footnote 11 We simulate changes in revenues by examining on-site visitation with current environmental quality (T1) and with improved environmental quality (T2).
We first predict changes in visitation if the entry fee is increased from INR10 to five different higher levels, i.e., INR15, 20, 30, 40 and 50, and there is no change in site quality (T1). Our first step is to identify new trip cost variables by increasing the trip cost value by the amount of each new entry fee. We then obtained the predicted trips by taking the parameter estimates from the original regression and the changed trip costs (Alberini and Longo, Reference Alberini and Longo2006; Morgan and Huth, Reference Morgan and Huth2011). We repeated this for five new entrance fees (INR15–50), i.e., for each new entry fee, and we calculate the average predicted number of trips.Footnote 12 We then predicted the total revenue generated for each entry fee, by multiplying the number of predicted trips by a household with the number of household members who would pay the entry fee times the entry fee (adapted from Kido and Seidl, Reference Kido and Seidl2008).Footnote 13 This is summed across all households to obtain aggregate predicted revenue for the sample. To obtain the predicted revenue for the entire population of visitors, we multiply our sample-based estimates by 1,250 (1/0.0008), as our sample represents 0.08 per cent of the total number of visitors in a year.
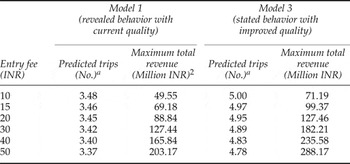
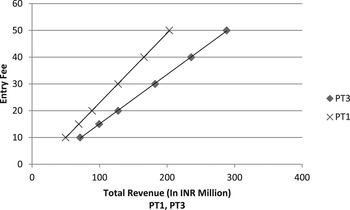
Table 4 presents the revenue obtained because of changes in the entry fee. A hike in the entry fee, as expected, results in a decline in on-site visits. However, the decline is not huge because the entry fee is a small portion of total cost. As table 4 shows, our sample suggests that most households come to the park three to four times per year. Thus, we estimate revenues making different assumptions about the percentage of households who will make three to four trips per year. If 100 per cent of visitors make the predicted trips in a year, the Park Authority can earn revenues from INR49m to INR203m with different entry fees. Assuming that 50 per cent of the visitors make the predicted trips, the Park Authority can earn revenues from INR25m to INR101m, based on the fee charged. Assuming 25 per cent of visitors take the predicted number of trips, the authorities can earn INR12–51m by varying entry fees.
Simulated total revenue from different entry fees

Notes: a In estimating predicted trips, we added 1 to the predictions obtained from STATA, because it automatically deducts 1 from predicted trips in cases of endogenous stratification.
For an entry fee of INR10, given the predicted number of trips, this will generate revenues of INR12–49m, depending on the percentage of assumed visitors. If the entry fee is increased to INR20, the average predicted trip rate declines to 3.45. This will generate revenues of INR22–89m, depending on the percentage of visitors. With a hike in entry fee to INR50, the predicted trips decline to 3.37, but this can generate revenues of INR50–203m.
Applying the same procedure, we use SP to simulate revenues in a scenario with improvements in quality (scenario 2). As in the previous case, changes in entry fee result in only small changes in the average predicted number of trips. Assuming that 100 per cent of visitors make the predicted trips in a year, the Park Authority can earn maximum revenues of INR71–288m with different entry fees (table 4). Assuming that 50 per cent of the visitors take the predicted trips, the authorities can earn from INR36m to INR144m based on the fee charged. Assuming 25 per cent of visitors make the predicted number of trips, the authorities can earn INR18–72m.
For an entry fee of INR10, if the predicted numbers of trips are made by the visitors, this will generate revenues of INR18–81m, depending on the percentage of visitors. If the entry fee is increased to INR20, the average predicted trip rate declines to 4.95. However, this will generate revenues of INR31–127m, depending on the percentage of visitors. With a hike in entry fee to INR50, the predicted trips decline to 4.78, but this will generate revenues of INR72–288m.
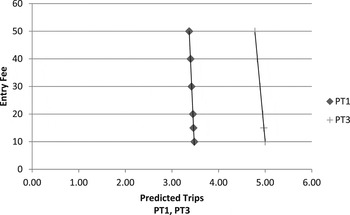
This picture is clearly depicted in figure 4, which shows that the predicted trips do not change very much as entry fees change in either scenario 1 or 2. Figure 5 presents associated revenue curves, which are considerably higher in both estimations. As figure 5 shows, with site quality improvements, the Park Authority can hope to increase its revenues at all entry fees. Thus, from a revenue generation point of view, it makes sense for the park managers to make investments such as providing water sports and drinking water facilities, improved food quality, good seating arrangements, increase in the number of restrooms and trashcans and extra security, as long as they cost less than the additional revenue generated.
Annual predicted trips per household with different entry fees

Maximum total revenue with different entry fee

The BBPA currently charges INR10 as the entry fee for adults and INR5 for children to Lumbini Park. The fees were INR5 for all visitors until December 2009, when the authorities hiked fees for adults, collecting INR9.65m (US$160,883) in revenue during the 2009–2010 period. We can assume that this fee is sub-optimal, given visitor willingness to pay much more. The percentage change in revenue for both models in table 4 shows that the visitors do not mind paying entry fees up to INR30, after which revenue increases at a declining rate. However, we recommend doubling the entry fee from INR10 to INR20 for adults. For children, it appears that the Park Authority would like to keep the price constant at INR5. Thus we keep the price for children unchanged. At an entry fee of INR20 per adult visitor and current levels of environmental quality, authorities can earn additional revenues from INR22m to INR89m, depending on the percentage of visitors. This increase in revenues could be used for investments that would improve the quality of the lake.
6. Conclusions and policy implications
In this study, we estimate citizens' demand for improvements in site quality in and around the Hussain Sagar Lake. Using RP and SP methods, we measure the gains in welfare to citizens from such improvements. An important methodological aspect of this study is that we sample from both on-site and off-site visitors in investigating welfare gains. The results of our study suggest that visitors are aware of the need for improvements in and around the lake and are willing to pay for the necessary improvements.
Under current conditions at the study site, on-site respondents reported an average of 3.5 trips to the Hussain Sagar Lake during the 12 months of the years preceding the study, while off-site respondents reported one trip. Under scenario 2, which improves site quality without a corresponding increase in entry fees, people generally stated that they would make more trips, increasing the average number of visits from 3.5 to five for on-site visitors and from one to nearly two for off-site visitors. Under scenario 3, which posits both improved site quality and higher prices, the average number of announced trips came down from 3.5 (current trips) to 2.2 for on-site visitors and from one to 0.63 for off-site visitors. These figures suggest that the responses to the hypothetical trip questions are reasonable and consistent with well-behaved demand functions. They also suggest that improvements in site quality will result in more visitors to the park, while a price hike will reduce visitation.
One conclusion to be derived from this study is that off-site respondents respond differently relative to on-site respondents. With improvements in site quality, the increase in visitation is smaller among off-site respondents relative to their on-site counterparts. Further, price hikes contribute to a steep reduction in trips among off-site respondents. Also, the trip reduction rate is lower for on-site respondents relative to off-site respondents, even when improvements are coupled with an increase in the entry fee. It is also useful to note that the most important improvement in the parks and lake requested by on-site visitors was in water quality, while off-site visitors were more concerned with security issues. These results are not surprising given that on-site respondents are more frequent users and know the lake better. In general, this analysis highlights the presence of avidity bias, since visitors who most frequently visit are disproportionately represented if only on-site visitors are surveyed. By including off-site respondents, we generate better estimates of consumer surplus as well as revenue possibilities.
Based on the findings of the study, we recommend that the Park Authority increase the entry fee to the lake area from INR10 to at least INR20. This hike in fees will result in only a small decline in visitation, but the government could potentially earn revenues in the range of INR22–89m (US$0.36–1.48m). This represents an approximately 80 per cent increase in revenues from what is currently earned with the INR10 entry fee. Using different consumer surplus and different scenarios, the amenity value of the lake ranges from INR1.76bn to INR3.48bn. Given the large consumer surplus and recreational facilities in and around the lake, these revenues could be used by the park authorities to make investments in lake conservation and recreation.
In a recent discussion, the Chief Engineer of the Hyderabad Metropolitan Development Authority indicated that they have now diverted the raw sewage in the drains to nearby city sewers and have constructed an STP to discharge clean treated water into the lake to maintain lake hydrology. Therefore, the present problem is not of raw sewage getting discharged into the lake but rather of sedimentation in the lake. The Chief Minister has proposed to drain out lake water, desilt it and refill with fresh water. Apart from the cost, this proposal was highly criticized by environmentalists regarding how and where to dump the toxic silt.
According to the Chief Engineer, bioremediation is another option. This treatment process uses naturally occurring microorganisms (yeast, fungi or bacteria) to break down or degrade hazardous substances into less toxic or non-toxic substances (Kamath, Reference Kamath2008). This process has been applied to small lakes in India and has succeeded. Applying this to Hussain Sagar will be a herculean task but is not impossible. It may cost INR800m. According to our study, given that over one million people visit the lake and its parks every year, the annual estimated amenity value of the lake ranges from INR1.76bn (US$29m) to INR3.48bn (US$58m). Therefore, the present cost of INR800m is worth taking.
Our last visit revealed that the Park Authority had increased the entry fee to Lumbini Park from INR10 to INR20 for adults and INR5 to INR10 for children. We thank the Park Authority for this policy decision. We hope that this will boost their revenue and that they can make investments in lake conservation and recreation.
Appendix
Hussain Sagar Lake and surrounding parks area