

Introduction
Scholarly discussions on the relationship between media use and political participation have shifted their focus away from the effects of traditional media, such as television, radio, and newspapers, toward digital media, especially the Internet. The rapid development of information technology since the late 1990s, providing online information and network connections facilitated by the Internet, has largely changed the pattern and the relationship between media use and political participation. These changes have drawn the attention of scholars to analyze the effects of digital media use on several important issues. Previous studies show that media use has strong effects on civic culture and political engagements (Kittilson and Dalton, Reference Kittilson and Dalton2011; Gil de Zúñiga et al., Reference Gil de Zúñiga, Jung and Valenzuela2012). It is in fact argued that media use enhances information acquisition, community formation, and the promotion of civic-oriented behaviors, as well as providing low-cost opportunities for people to become involved in public affairs and to express their personal opinions. The change in the range of available media may significantly alter people's perceptions about democratic values and their attitudes toward politics, and therefore change the pattern of people's political participation.
Recent research has aimed at new forms of political participation, such as online political discussions, political blogging, and online petitions, that are made available through the Internet. The results from this area of research have indicated that these forms of online participation are mostly self-directed and often elite-challenging actions, and have largely changed the relationship between political elites and ordinary citizens (Boulianne, Reference Boulianne2009; Kittilson and Dalton, Reference Kittilson and Dalton2011; Xenos and Moy, Reference Xenos and Moy2007). Moreover, these new forms of participation that have mostly taken place through digital media were responsible for many cases of political protests fueled by the activism of demanding democratic reforms (e.g. the Arab Spring), because organizational requirements for collective action have become less costly and more convenient (Bimber et al., Reference Bimber, Cunill, Copeland and Gibson2014; Sajuria, Reference Sajuria2013; Tufekci and Wilson, Reference Tufekci and Wilson2012). Political scientists have increasingly recognized the importance of information technology within the process of democratization (Best and Wade, Reference Best and Wade2009; Mattes and Bratton, Reference Mattes and Bratton2007; Nisbet et al., Reference Nisbet, Stoycheff and Pearce2012; Sajuria, Reference Sajuria2013; Swigger, Reference Swigger2013). Whether for the importance of the transition from an authoritarian to democratic system in non-democratic regimes or the democratic consolidation in new democratic countries, most citizens in such countries are required to have faith and strong commitments toward democratic values in order to make the democratic system in their country a well-functioning and stable political institution (Groshek, Reference Groshek2009).
Since political participation is considered as an essential element of a well-functioning democracy, the underlying mechanisms facilitating people's engagement in politics have also been a focus of researchers’ interests. Some theoretical and empirical developments have pointed at the influence of the media for obtaining news and information about politics. A large body of research has shown that media use to obtain news and information about politics has a significant effect on political participation, but the mediating processes of media use are still largely unclear. Recently, communication studies have suggested that the effects of media use are significant but mostly indirect due to their impact on other personal–psychological outcomes (Cho et al., Reference Cho, Shah, McLeod, McLeod, Scholl and Gotlieb2009; Lee et al., Reference Lee, Shah and McLeod2013; McLeod et al., Reference McLeod, Daily, Guo, Eveland, Bayer and Yang1996; Sotirovic and McLeod, Reference Sotirovic and McLeod2001). The conceptual framework of these studies has been specified as the communication mediation model (Shah et al., Reference Shah, Cho, Eveland and Kwak2005). Under this framework, it is argued that the effects of media use are mediated by political knowledge, political discussion, and political efficacy as cognitive orientations to enhance political participation (Cho et al., Reference Cho, Shah, McLeod, McLeod, Scholl and Gotlieb2009; Eveland, Reference Eveland2004; Jung et al., Reference Jung, Kim and Gil de Zúñiga2011).
Even though previous mediation studies have identified important pathways to political participation, the broader range of cognitive variables that contribute to political behaviors are far from well established. It is unclear whether attitude toward democratic values is an important cognitive variable, that is whether ‘personal-psychological’ views mediate the indirect effects of media use in a similar way as those of political attitudes, such as political interests and efficacy. As a result, investigating the importance of democratic values in the mediating process can help our understanding of the relationship between media use and political participation. However, little research has explored the role of the media in shaping democratic values. This study tests the mediating impact of democratic values (mediator, M) on the relationship between media use (independent variable, IV) and political participation (dependent variable, DV) in the context of Taiwan, a young democracy in Asia.
Research motive
From the perspective of political culture, the patterns of political participation in a country usually reflect its social norms, people's ideological orientation, and subjective attitudes about political institutions, and the relationship between citizens and their country and society (De Koster and Van Der Waal, Reference De Koster and Van Der Waal2007; Inglehart, Reference Inglehart2008). Compared with Western countries, the literature has argued that the value systems of East Asian societies place more emphasis on social stability, social cohesion, conformity, tolerance, and obedience to government authorities. Thus, the meaning of people's rights and attitudes toward democratic values in the political discourse of East Asian societies may differ significantly from the Western Anglo-American tradition that focuses on individual rights (Dalton and Ong, Reference Dalton and Ong2006; Dalton and Shin, Reference Dalton and Shin2014).
Taiwan is an East Asian country (along with Japan, China, and South Korea) that has experienced rapid growth in the number of Internet users, while several cable TV channels broadcast news programs daily for 24 hours. Based on the 2014 report of the Internet World Stats, Taiwan had 6,260,000 Internet users in 2000, which grew to 18,687,942 in 2014, accounting for about 80% of the population. According to Taiwan Network Information Center (TWNIC), 83.74% of Internet users in Taiwan spend more than an hour online each day. People in Taiwan are increasingly using the Internet, either via fixed broadband or mobile broadband subscriptions, for various purposes, while traditional forms of media, such as TV, newspapers, and radio, continue to provide a variety of sources of information.
Aside from the growing importance of Internet use, Taiwan has transformed from an authoritarian regime to a democratic country after martial law was lifted in 1987. With the rapid social and political developments over the past three decades, Taiwan continues to progress economically and politically on the path of democratic consolidation. The political competition between the two major political alliances (the Pan-Green alliance consists of the Democratic Progressive Party and Taiwan Solidarity Union; the Pan-Blue alliance consists of the Nationalist Party (KMT), People First Party, and New Party) has been very intense. Analyzing the case of Taiwan, Wang (Reference Wang2007) indicates that political use of the Internet promotes political interest, political trust, and political efficacy, and therefore it makes an individual more likely to participate in campaigns and politics in Taiwan. Chang (Reference Chang2007) shows that the positive relationship between mobilizing media (TV news, newspapers, magazines, and Internet for work) and political participation is mediated by political interest, while the negative relationship between demobilizing media (TV non-news, radio, and Internet for pleasure) and political participation is mediated by political cynicism.
Based on contextual considerations, Taiwan has experienced drastic social and political movements since the 1980s as its economy continues to develop steadily. With the wide availability of information technology, Taiwanese people now have more opportunities, with a variety of traditional and new forms of media, to obtain information about public affairs and thus potentially to change their views and to engage more in politics. This study contributes to the related literature by emphasizing the effect of digital media use on shaping democratic values and its relationship with political participation for citizens in Taiwan.
Literature review
Media use and political participation
Earlier studies on the relationship between media use and citizens’ political attitudes show that media use is significantly associated with political participation. For example, Zhao and Chaffee (Reference Zhao and Chaffee1995) find that campaign news helps voters to gain information about important issues, and therefore information media use is an important driving force for political participation. Eveland and Scheufele (Reference Eveland and Scheufele2000) also note that information provided by the news media can help citizens gain political knowledge as well as encourage citizens to participate in political activities. Moreover, Corrigall-Brown and Wilkes (Reference Corrigall-Brown and Wilkes2014) argue that media exposure has direct and indirect effects on voting and protesting by increasing political trust, efficacy, and knowledge.
Asides from traditional media, the effects of Internet use on citizens’ attitudes toward politics and democracy also have attracted much interest from researchers. Most importantly, there is a significant distinction between traditional media and digital media, especially the Internet, because traditional media, such as television, radio, and newspapers, is usually a form of one-way communication that provides information to audiences and readers without any feedback and participation from the citizens themselves. As a result, opinions drawn from traditional media are more likely to be controlled or dominated by the government or political elite. In contrast, the Internet allows citizens to provide information, create discussions, and offer their opinions, and therefore it serves as a pluralistic media platform at a lower cost and is a more efficient way to expand citizens’ understanding and awareness of public affairs.
Kaye and Johnson (Reference Kaye and Johnson2002) note that political attitudes – including the likelihood of voting – political trust, interest in politics, partisanship, and political efficacy are positively associated with using the Internet for purposes of information searching and guidance, but not for entertainment purposes. Tolbert and McNeal (Reference Tolbert and McNeal2003) show that accessing the Internet for online election news was positively related to the probability of voting in US presidential elections in 1996 and 2000. Kittilson and Dalton (Reference Kittilson and Dalton2011) find that online interactions foster citizen norms and political involvement.
By expanding the provision and exchange of information and opinions, Internet use also plays a significant role in forming citizens’ attitudes toward democracy. For example, Groshek (Reference Groshek2009) find that Internet diffusion and democracy demonstrate a positive, statistically significant relationship in developing countries where the average level of sociopolitical instability is much higher. Sajuria (Reference Sajuria2013) indicates that Internet use is related to people's conception of democracy. Studies by Best and Wade (Reference Best and Wade2009) and Howard (Reference Howard2009) also argue that a higher rate of Internet penetration can facilitate a strong online civil society by promoting democratic values, which is particularly important for the democratic transition among authoritarian regimes. In contrast, Boyd and Marwick (Reference Boyd and Marwick2011) argue that social constructs of the Internet have changed the distinction between the private and public realms. Consequently, this phenomenon has led to the increasing importance of people's right to the freedom of expression and has an effect on beliefs about civil liberties. Swigger (Reference Swigger2013) shows that there is a strong correlation between the use of social media sites and support for civil liberties such as freedom of expression. His findings suggest that information technology may lead to changes in American attitudes on basic democratic values.
Media use, political attitude, and democratic values
In defining democratic values, there are at least three perspectives that have been widely employed in scholarly discussions. The first perspective emphasizes the institutions and procedures of democratic governance. As discussed by Dahl (Reference Dahl1989) and Huntington (Reference Huntington1991), democracy is largely defined as the institutions and processes of representative government to ensure citizens can participate equally in free and fair elections, and elections direct the actions of government. According to this perspective, it is assumed that citizens’ attitudes toward democratic values are mainly measured in institutional and procedural terms as ‘fair and free elections’, ‘multiparty competitions’, and ‘majority rile’.
The second commonly used perspective of defining democratic values focuses on the outcomes of a democratic society; that is, democracy emphasizes freedom and liberty as its fundamental goals, and democratic institutions are the mechanisms that can achieve these goals. As discussed by Diamond (Reference Diamond1996), basic democratic values include political liberties, participation right of citizens, equal justice before the law, and equal rights for women and minorities. The third perspective of defining democratic values focuses on providing social services for those in need and ensuring the general welfare of others (McIntosh and Abele, Reference McIntosh and Abele1993). From this perspective, the basic democratic values often include economic improvement, social welfare, and economic security as the key elements of democracy.
Dalton et al. (Reference Dalton, Shin and Jou2007) demonstrate that democracy is broadly perceived in terms of freedom, civil liberties, and citizen rights, and these basic democratic values are what most citizens consider when they are asked to define democracy in most nations. They further argue that the popular appeal of democracy lies not in its procedures for elections and governance, but rather in the freedom and liberty that democracy provides. Moreover, in a study of comparing similarities and differences in understanding democracy across countries, Cho (Reference Cho2015) indicates that free elections and civil liberties are essential in defining democracy across different regions and countries. According to his findings, 92% and 93% of the people in Taiwan comprehend that free elections and civil liberties, respectively, are essential in defining democracy. Therefore, we aim at the concept of freedom and liberty in defining democratic values in this study.
Despite the fact that a large body of research has demonstrated that media use has a strong effect on political participation, recent studies suggest that the effects are mostly indirect and mediated via other psychological and social structural factors. It is argued that information media shapes and channels the impact of social, cultural and other factors on political participation. This perspective is similar to political learning theories that emphasize the importance of the democratic political system, political interest, and media use in exposing citizens to democracy in principle as well as in practice (Almond and Verba, Reference Almond and Verba1963; Mattes and Branton, Reference Mattes and Bratton2007). This analytical framework has been further specified as the communication mediation model, which is used to examine the direct and indirect effects of media use on political participation (Shah et al., Reference Shah, Cho, Eveland and Kwak2005). For example, the studies of Eveland (Reference Eveland2004) and Shah et al. (Reference Shah, Cho, Eveland and Kwak2005) show that information media use enhances political discussion and political efficacy, as well as the competence of people to understand politics, and therefore it enhances political participation. Later, Shah et al. (Reference Shah, Cho, Nah, Gotlieb, Hwang, Lee, Scholl and McLeod2007) proposed an Orientation-Stimulus-Reasoning-Orientation-Response (O-S-R-O-R) model, an extension of the O-S-O-R model, arguing that the effects of the news media use (S) on political participation (second R) are mediated by reasoning behaviors (first R) and individuals’ psychological variables (second O). In other words, the effects of news media use on political participation are achieved by the way of a reasoning process. Testing the O-S-R-O-R model, Cho et al. (Reference Cho, Shah, McLeod, McLeod, Scholl and Gotlieb2009) demonstrate that political conversation, political messaging, and cognitive reflection mediate the effects of campaign advertising exposure and news consumption on political participation and knowledge. Based on the O-S-R-O-R model, Jung et al. (Reference Jung, Kim and Gil de Zúñiga2011) indicate that political knowledge and political efficacy are significant mediators for the news media use in enhancing political participation. Moreover, testing a communication mediation model of political socialization, Lee et al. (Reference Lee, Shah and McLeod2013) find that news consumption and political expression via digital media technologies are strong pathways to political participation.
According to the communication mediation and O-S-R-O-R models from previous research, political socialization impacts the fundamental values that individuals hold, creating citizens who have different ideas about norms and democratic values. In addition, the expansion of social media access on the Internet implies that more and more people have shared and exchanged increasing amounts of information, and the opportunity for online socialization is expanding. The cultivation of democratic citizenship via online socialization has shifted the distinction between the private and public realms and altered the interactions among the government, political parties, political elites, and ordinary citizens. Accordingly, based on the framework of the communication mediation model, media use for obtaining news and information stimulates political socialization by shaping attitudes toward democratic values. As an important cognitive variable reflecting a ‘personal-psychological’ outcome that provides the reasoning process of mental elaboration and collective thinking (Cho et al., Reference Cho, Shah, McLeod, McLeod, Scholl and Gotlieb2009; Shah et al., Reference Shah, Cho, Nah, Gotlieb, Hwang, Lee, Scholl and McLeod2007), attitudes toward democratic values can be important in mediating the relationship between media use and political participation.
Despite the achievements of the previous literature, studies on the influence of media use in enhancing citizens’ attitudes toward democratic values and the consequential associations with political participation for an East Asian democracy remain very limited. By examining the case of Taiwan, this study attempts to fill this gap. Therefore, three hypotheses are proposed in this study as follows.
-
Hypothesis 1: Non-Internet media use for obtaining news and information, but not for entertainment purposes, is positively associated with attitudes toward democratic values.
-
Hypothesis 2: Using the Internet for reading news or searching for information is positively associated with democratic values.
-
Hypothesis 3: Democratic values mediate the relationship between political participation and media use for obtaining news and information.
Data
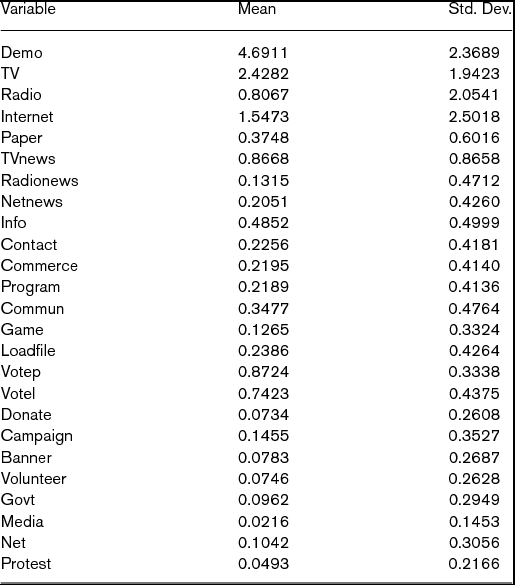
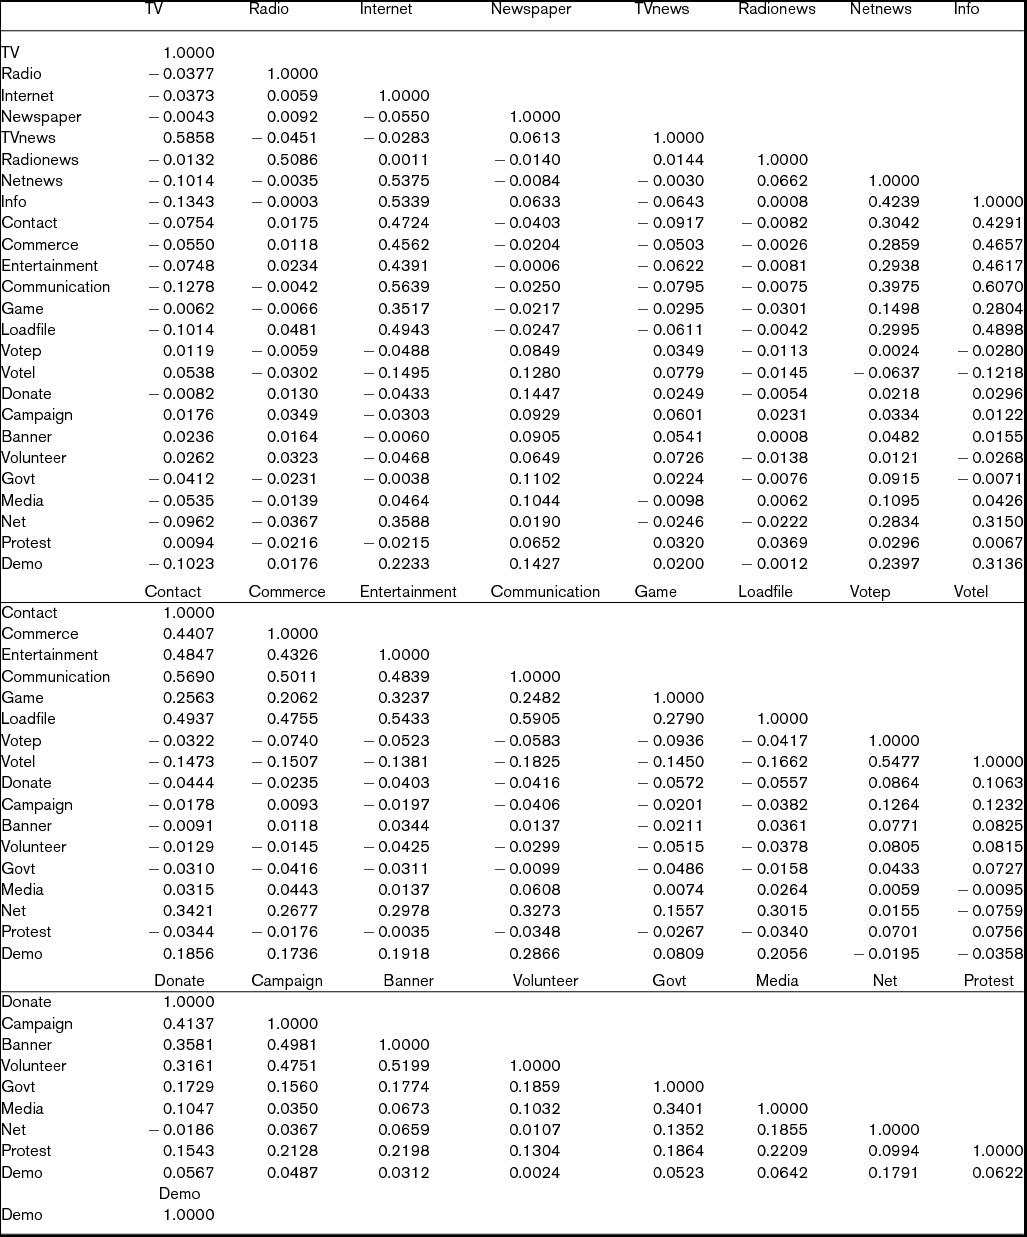
This study uses data from Taiwan Social Change Survey (TSCS) 2010 to examine the role of media use in explaining the formation of an individual's values toward democracy as well as the relationship between democratic values and various types of political participation. The data were collected through face-to-face interviews conducted from 12 July to 20 September 2010. The population encompassed individuals over 18 years old in Taiwan. The Census of Taiwan was used as the sampling frame, and the method of Stratified Three-Stage Probability Proportional to Size (PPS) is used to determine who would be contacted for the interviews. Using this method, a probability proportional to size sampling first determined the towns and districts to be included in the sample, and then systematic sampling was used to determine who would be contacted for the interviews within the sampled towns and districts. The response rate was 56% with a total of 1,895 respondents who completed the interview. After excluding from the samples those who were ineligible to vote or those for whom we had insufficient information about their engagement in political behaviors, this study ended up with 1,622 observations. The descriptive statistics of key variables used in this study and their correlation coefficients are provided in Appendices 1 and 2.
Empirical method and measures
Based on the arguments discussed above, we first investigate the importance of traditional media use and Internet use for shaping democratic values and then examine the relationship between democratic values and political participation. That is, we first examine the relationship between various forms of media use and democratic values. After estimating the importance of media use for predicting democratic values, we use predicted democratic values as the key explanatory variable in the second step of the estimation to examine whether it is strongly associated with various forms of political participation. In the first step of estimation, the dependent variable is Demoi , which measures an individual's values toward democracy, and the key explanatory variables are traditional and digital media (Internet) use along with levels of educational attainment as the control variables. After estimating the determinants of democratic values, we use the predicted value of democratic values Demoi as the key explanatory variable in the second step of estimation. At this stage, the dependent variable Politicali measures political participation for an individual i, with a set of socioeconomic variables, including gender, age, age,2 marital status, education, religious attachment, religious attendance, employment status, income level, partisanship, and political efficacy as the control variables.
This study considers ten types of political participation: voting in a presidential election (Votep), voting in a legislator election (Votel), presenting petitions to government or public officials (Govt), making complaints through the mass media (Media), making complaints via the Internet (Net), joining protests (Protest), making political donations (Donation), attending election campaigns (Campaign), wearing or pasting political banners (Banner), and volunteering for a certain candidate or political party (Volunt). The variable for each type of political participation was coded 1, the respondent participated, and 0 otherwise. Cronbach's alpha for these indexes of political participation is calculated as 0.6509. With ten items of political participation and the narrow range of value for each item used in this study, this estimate of reliability is acceptable according to Loewenthal (Reference Loewenthal1996). More discussions about reliability can be found in Cortina (Reference Cortina1993), Goforth (Reference Goforth2015), Hair et al. (Reference Hair, Black, Babin, Anderson and Tatham2006), Moss et al. (Reference Moss, Prosser and Costello1998), Schmitt (Reference Schmitt1996), and Streiner and Norman (Reference Streiner and Norman2008).
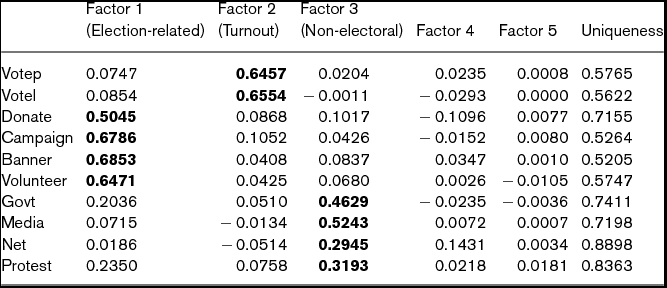
With these measures of political participation, we conduct factor analysis to obtain constructs of specific types of participation. From the factor loading result as reported in Table 1, we create three measures of political participation with factor scores as election-related participation (Election-related, which is mostly defined by Donate, Campaign, Banner, and Volunteer), voter turnout (Turnout, which is mostly defined by Votep and Votel), and non-electoral participation (Non-electoral, which is mostly defined by Govt, Media, Net, and Protest). The result from the factor analysis appears to be consistent with the classification in Western literature, which emphasizes that duty-based citizenship often can nurture voting- and campaign-related activities, and engaged citizenship stimulates protest and other elite-challenging forms of action.
Factor loading of political behaviors

To measure democratic values, we utilize respondents’ answers to the various questions asked in the TSCS, which are mostly related the concept of democracy from the perspective of ‘freedom and civil liberties’ as discussed above: (1) Political decisions should be left to those who are older (Demo1); (2) We should follow all the government's decisions on national affairs (Demo2); (3) Brutal criminals should be punished immediately without waiting for the court's sentence (Demo3); (4) If people have different opinions, then society will become chaotic (Demo4); (5) The government has the right to decide if certain speeches or opinions can be circulated in society (Demo5); (6) Stability will be affected if there are many opposing groups in a region (Demo6); (7) If there are several political parties in a country, then it will lead to political chaos (Demo7); (8) If the council or assembly is always interfering with the government, then it becomes impossible for it to achieve very much (Demo8); (9) When a judge imposes a sentence in important cases that affect safety in society, he/she should accept the executive body's opinion (Demo9). Following the responses (from strongly agree to strongly disagree; coded as 1 if the answer is disagree or strongly disagree for each question) to these questions, we conduct a composite index of democratic values (Demo) by adding up these nine items to reflect the attitudes toward the fundamental values of democracy based on the concepts of freedom and civil liberties. These democratic values can be characterized by such beliefs and principles as individualism, popular sovereignty, equality of rights, tolerance, freedom, independence of the legal system, justice, rule of law, checks and balances, pluralism. Therefore, the composite index of democratic values (Demo) is constructed by adding up the three factors. A higher value of the index indicates a more positive attitude toward democratic values.
As for the variables of media use, we first construct the variables of the hours of time spent every day watching TV (TV), listening to the radio (Radio), and using the Internet (Internet). In addition, the hours of time spent every day by an individual in reading, watching, or listening to news programs through newspapers (Newspaper), TV (TVnews), radio (Radionews), and the Internet (Netnews) reflect the frequency of exposure for each individual to various types of media to obtain news. We also set up seven dummy variables regarding the functions used on the Internet to reflect the importance of the differences in Internet functions for mediating the fundamental democratic values: (1) Browsing or searching for information (Info); (2) Making social contacts (e.g. visiting blogs or websites that provide services for making friends) (Contact); (3) Using e-commerce services (e.g. auctions, shopping, group shopping, banking services) (Commerce); (4) Watching a video or listening to an audio file (e.g. watching TV programs/movies, listening to music or the radio) (Entertainment); (5) Using web communications (e.g. e-mails, instant messenger services, Internet phone calls, or Skype) (Communication); (6) Playing online games (Game); and (7) Downloading or uploading files (Loadfile). Other socioeconomic variables used in this study include gender (Gender), age (Age), square of age (Age2 ), marital status (Married), education level (High, College, and Grad), religious affiliation (Buddha, Tao, Folk, and Christianity), frequency of religious attendance (Attend3, Attend2, and Attend1), employment status (Unemployed), family income level (Income2, Income3, Income4, and Income5), partisanship (Blue, the Pan-Blue political camp and Green, the Pan-Green political camp), and political efficacy (Efficacy), which are often considered as important factors for explaining political participation in the set of explanatory variables.
Before presenting our empirical results, it is useful to describe briefly the correlations among the key variables used in this study. As Appendix 2 reports, democratic values (Demo) are positively correlated with all types of media use except watching television (TV). Among all types of media use, using the Internet for browsing or searching for information (Info) has the highest correlation coefficient value with democratic values at 0.3136 followed by using web communications (Communication) at 0.2866. Moreover, democratic values are also positively correlated with all types of election-related and non-electoral participation, but it is negatively correlated with voter turnouts in presidential and legislator elections. Among different types of political participation, making complaints via the Internet (Net) has the highest correlation coefficient value at 0.1791, with democratic values.
Empirical results
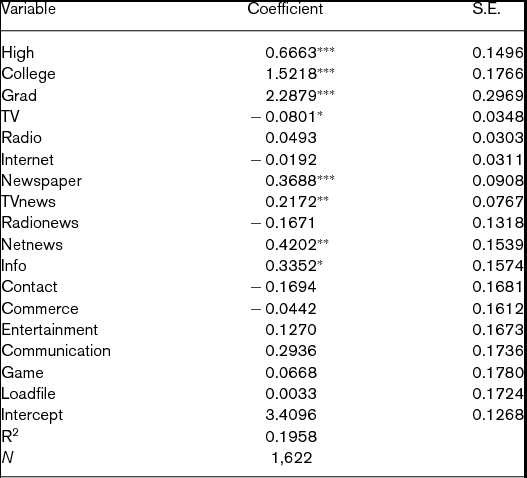
As with the empirical method described in the previous section, we first examine the relationship between different types of media use and democratic values. As noted in Table 2, watching TV is negatively associated with democratic values, while people who spend more time reading newspapers, watching news programs on TV, and reading news on the Internet have more positive attitudes toward democratic values. As for the functions utilized on the Internet, people who frequently use it for browsing or searching for information tend to have more positive attitudes toward democratic values. In contrast, using the Internet for making social contacts, e-commerce services, watching a video program, playing online games, or loading files is not significantly associated with attitudes toward democratic values.
Regression results of media use for explaining the attitude toward democratic value

Note: ***, **, and * denote significance at 0.1%, 1%, and 5% levels, respectively.
The above findings indicate that obtaining information through traditional media use by reading newspapers and watching news programs on TV still has a strong positive effect on people's attitudes toward democratic values as does obtaining information via digital media by reading news on the Internet. Moreover, simply spending more time watching TV, but not necessarily for news information, could lead to a more negative attitude toward democratic values. Likewise, among various functions used on the Internet, only browsing or searching for information can potentially lead to a more positive attitude toward democratic values. Apparently, the Internet has a positive impact on the formation of democratic values by facilitating information gathering and exchange for people, but not by providing a platform for other commercial and entertainment purposes. Therefore, Hypotheses 1 and 2 are supported by the result of Table 2.
After estimating the relationship between media use and attitudes toward democratic values, we employ the predicted value of democratic values (Demo) obtained from this estimation as the key explanatory variable to examine whether people's attitudes toward democratic values strongly correlate with voter turnout, election-related and non-electoral types of political participation.
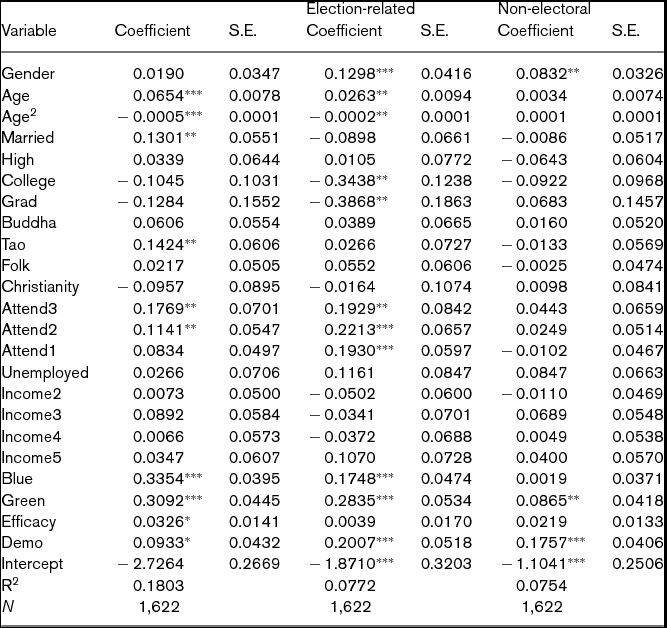
As shown in Table 3, controlling for the effects of other socioeconomic variables, attitudes toward democratic values are positively associated with voter turnout (Turnout), election-related participation (Election-related), and non-electoral participation (Non-electoral). This suggests that people with a more positive attitudes toward democratic values are more likely to turnout to vote in elections and have a higher tendency to participate in election-related and non-electoral types of political participation.
OLS estimations of political behaviors with factor analysis

Note: ***, **, and * denote significance at 0.1%, 1%, and 5% levels, respectively.
Mediation analysis
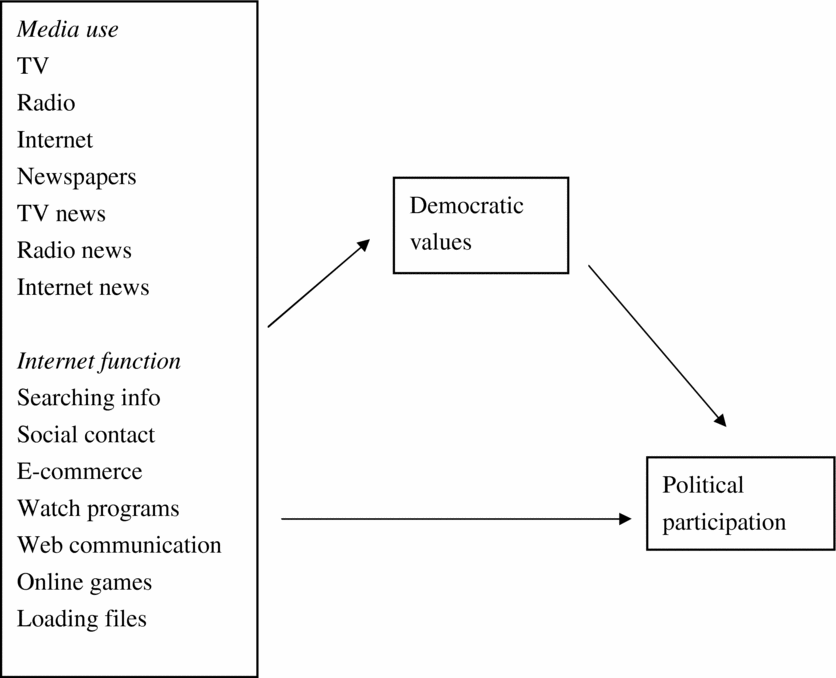
To analyze the importance of democratic values in the mediating process of the association between media use and political participation as described as Figure 1, this study employs the approach of the structural equation model (SEM). The SEM methods have several advantages, including the simultaneous testing of path, the comparison of direct and indirect effects, and the magnitude of such effects. Moreover, we also use the bootstrap mediation test developed by Preacher and Hayes (Reference Preacher and Hayes2004, Reference Preacher and Hayes2008), i.e. bootstrapping with case resampling and a percentile estimate of the confidence interval to examine whether the indirect effects of media use on political participation mediated by democratic values are significantly different from zero. These estimations and tests are conducted with Stata 14 statistical software. To conduct the testing process, we use the measures of voter turnout (Turnout), election-relation participation (Election-related), and non-electoral participation (Non-electoral) obtained from factor analysis as dependent variables for SEM estimations.
The path of mediation

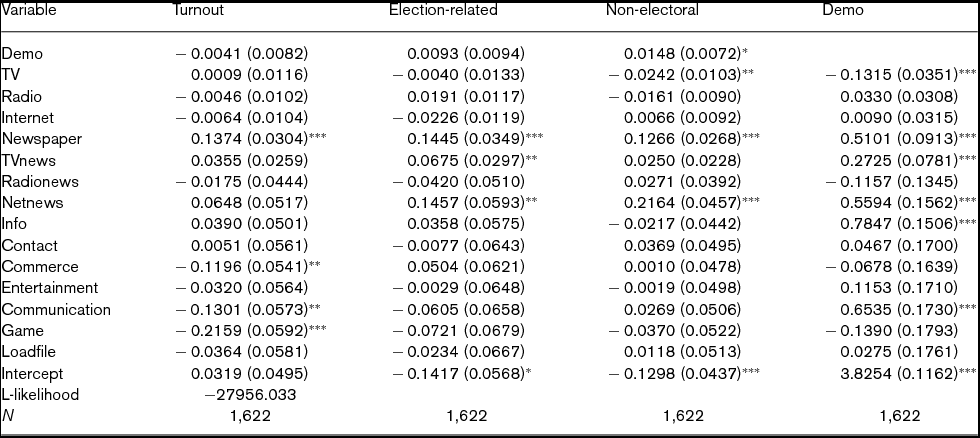
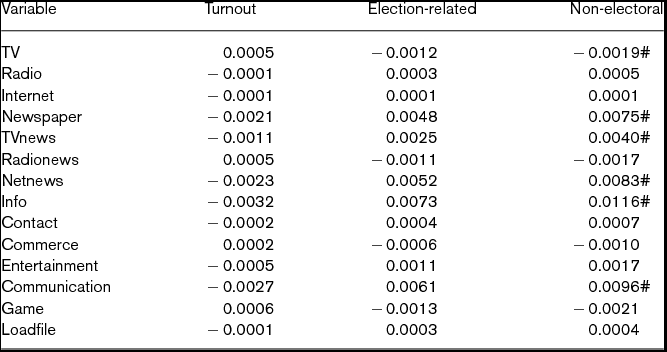
As reported in Table 4, the results of the SEM estimation show that attitudes toward democratic values (Demo) are significantly positive for predicting non-electoral participation, but insignificant for predicting voter turnout in elections and election-related participation. Moreover, reading newspapers (Newspaper), watching TV news programs (TVnews), reading news on the Internet (Netnews), searching information on the Internet (Info), and using web communication (Communication) are positively associated with attitudes toward democratic values, while the time spent on watching television (TV) is negatively related to democratic values. Based on the results of the SEM estimation, the indirect effects of various types of media use on political participation via democratic values are also calculated and reported in Table 5A. Regarding non-electoral participation, Info has the largest indirect effect of 0.0116, followed by Communication, Netnews, Newspaper, and TVnews with 0.0096, 0.0083, 0.0075, and 0.0040, respectively, while TV has a negative indirect effect of –0.0019.
Results of structural equation model (SEM)

Notes: Numbers in parentheses are standard errors. ***, **, and * denote significance at 0.1%, 1%, and 5% levels, respectively. Model fit statistics: comparative fit index (CFI) = 0.927, root mean squared error of approximation (RMSEA) = 0.085, standardized root mean squared residual (SRMR) = 0.011, and these statistics indicate that the goodness of fit for the model is generally acceptable (Hatcher, Reference Hatcher1994; Steiger, Reference Steiger1999).
Indirect effects of media use on political participation mediated via democratic value (SEM)

Note: # denotes significance at 10% level.
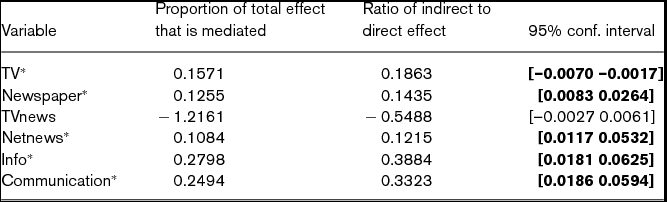
To further confirm that these indirect effects on non-electoral participation are significant and non-zero, bootstrap mediation tests are conducted for the types of media use with significant association with attitudes toward democratic values. As presented in Table 5B, the proportion of the total effect that is mediated by democratic values ranged from about 0.2798 for Info to 0.1048 for Netnews. More importantly, according to the 95% confidence intervals obtained from bootstrap mediation tests, excepting TVnews, these indirect effects are all significantly different from zero. These results suggest that the positive associations between non-electoral participation and several types of media use are partially mediated by attitudes toward democratic values. In particular, the indirect effects of using the functions of searching for information (Info) and web communication (Communication) on the Internet account for more than 20% of the total effects.
Bootstrap mediation test: non-electoral participation

Note: * indicates that indirect effect is not zero with 95% confidence.
The results from SEM estimations confirm that the associations between media use and non-electoral political participation are partially mediated by attitudes toward democratic values. Summarizing the results of the mediation analysis as reported in Tables 4, 5A, and 5B, we conclude that Hypothesis 3 is partially supported. That is, democratic values mediate the relationship between non-electoral political participation and media use for obtaining news and information.
Discussion
In this paper, we have extended the understanding about the relationship between media use and political participation by focusing on the role of media use in shaping people's attitudes toward democratic values. The results support the argument that media use plays a significant role in cultivating citizens’ democratic citizenship. As a result, media use enhances democratic socialization and leads to greater involvement in political behaviors.
Some distinct results from this study can be summarized as follows. First, people's attitudes toward democratic values are positively associated with the time spent on reading newspapers, watching news programs on television, and reading news on the Internet. Second, aiming at the various functions utilized on the Internet, people who frequently use it for browsing for information or for web communication have a more positive attitude toward democratic values, but there is no strong relationship between other functions used on the Internet such as making social contacts, using e-commerce services, or for other online entertainments. In other words, democratic socialization most likely occurs on the Internet through providing sufficient and diverse information, connecting people for information exchanges, and expanding opportunities for reaching different opinions and viewpoints through web communication.
Third, based on the results of two-step estimations, attitudes toward democratic values are positively associated with voter turnout in elections, election-related as well as non-electoral political participation. Not surprisingly, these results show that people with a more positive attitude toward democratic values are more likely to actively participate in traditional forms of political behaviors. This also suggests that democratic values that emphasize the beliefs and principles of individualism, freedom, and equality of rights can potentially have a strong influence in enhancing people's engagement outside of the traditional political platforms.
Moreover, the mediation analyses of SEM suggest that attitudes toward democratic values are more significant in mediating the association between media use for obtaining news and information and non-electoral political participation. This indicates that media use for obtaining news and information is more likely to be mediated by attitudes toward democratic values in mobilizing non-electoral political participation.
Contributing to understanding of indirect media effects, beyond the existing mediators identified in previous literature (e.g. political discussion, political knowledge, and political efficacy), this study shows that attitudes toward democratic values are also an important cognitive variable that mediates the relationship between media use and political participation. The communication mediation model shows that attitudes toward democratic values play a significant role in shaping a personal-psychological outcome that motivates political participation. In particular, the mediating effects of democratic values are substantial for enhancing non-electoral types of participation that are characterized by more personally expressive and cause-oriented behaviors based on concerns over specific social or political issues.
From the socio-cultural context, Taiwan has experienced drastic social and political movements since the 1980s. After transforming from an authoritarian system to a liberal democracy with multi-party competition, the process of democratic consolidation has followed a smooth path in Taiwan. In this study, we have demonstrated empirically that media use plays a significant role in shaping people's attitudes toward democratic values. In particular, the increasing popularity of Internet use for obtaining news and information in Taiwan has contributed to the formation of democratic citizenship that emphasizes fundamental liberal values.
In spite of many socio-cultural similarities among Taiwan, Japan, South Korea, and other East Asian countries, this study on the case of Taiwan still provides valuable results as references or comparisons for other countries in the region. As for traditional culture, Taiwan, Japan, and South Korea are strongly influenced by the East Asian tradition of Confucianism. While the cultural values emphasizing social order and collective interest, influenced by the tradition of Confucianism, often provide a stabilizing effect for political and economic development of East Asian countries, media use can potentially change people's attitude toward political institutions and democratic citizenship.
While some interesting results have been reported, there are at least two limitations in this study. First, using data from TSCS 2010, the measure of democratic values is restricted to a few items, mostly regarding ‘freedom and civil liberties’. This prevents us from examining the relationship between media use and ‘institutional and procedural’ democratic values. Second, it is very difficult to conclude the causal relationship between media use and democratic values as well as democratic values and political participation with cross-sectional data. We cannot rule out the possibility that engagements in politic behaviors lead to a more positive attitude toward democratic values.
For future research, it will be interesting to investigate the role of media use in the formation of democratic citizenship by comparing the differences across East Asian countries that have either similar or different levels of democratic consolidation. In the social contexts of East Asian countries, traditional values may still be important components for defining people's attitudes toward democratic values as socioeconomic modernization continues to take place, leading to different consequences in different countries in the region. However, the interactions among citizens, governments, political parties, and political elites are expected to change drastically as the advancement of information technology expands the range of political information available on, thus aiding people's understanding of public affairs.
Author profile
Wen-Chun Chang is a professor at the Department of Public Finance, National Taipei University, Taiwan. Professor Chang received his PhD in Economics from the University of Maryland, College Park. His research interests include charitable giving, religious economics, happiness studies in economics, social capital, and political economy in Taiwan. His research has been published in Journal of East Asian Studies, Social Indicators Research, Journal of Happiness Studies, International Journal of Social Economics, Review of Social Economy, and B.E. Journal of Economic Analysis & Policy.
Descriptive statistics of key variables (N = 1,622)

Correlation coefficients among key variables