



1. Introduction
The geodynamo, which explains the generation of Earth’s magnetic field (Lathrop & Forest Reference Lathrop and Forest2011; Herrmann & Vorbach Reference Herrmann and Vorbach2020), has significant implications for science and practical applications. The geodynamo is believed to be driven by the interplay of compositional and thermal convection, precession, rotational effects and magnetohydrodynamic phenomena (Roberts & Glatzmaier Reference Roberts and Glatzmaier2000; Adams et al. Reference Adams, Stone, Zimmerman and Lathrop2015). Understanding them helps untangle the physics of our planet’s behaviour, which shields us from harmful radiation, shapes geological history and climate, and provides insights into fundamental processes. Over the years, several experiments have been developed to better understand the complex phenomena that lead to geodynamo formation, encompassing a wide range of variables and increasing complexity. The first attempt to explore Earth’s geometry was the spherical Couette (SC) flow. In this configuration, the fluid contained within two concentric spheres is driven by differential rotation (Marcus & Tuckerman Reference Marcus and Tuckerman1987a ,Reference Marcus and Tuckerman b ). Different configurations have been systematically investigated, including varying radii ratios and boundary conditions (rotating inner sphere, rotating outer sphere, differential rotation and rotating in opposite directions). Despite being investigated for decades, this remains a topic of great scientific interest (Le Bars et al. Reference Bars, Michael, Ankit, Fabian, Daniel, Noir, Schaeffer and Triana2021; Alotaibi & El-Sapa Reference Alotaibi and El-Sapa2024). However, the SC flow is far from considering all the relevant phenomena in the geodynamo. It is essential to emphasise that the primary objective of the various SC experiments is to gain insight into the fundamental questions arising from rotating flow phenomena rather than replicating astrophysical systems with precision.
A configuration that goes one step further in mimicking the Earth’s core involves considering the SC flow with an electrically conducting fluid immersed in a magnetic field. This flow is referred to as the magnetised spherical Couette flow (MSC) despite the non-magnetic nature of the working fluids. The interaction between fluid flow and a magnetic field involves a bidirectional coupling between velocity and magnetic fields (Garcia Reference Garcia2023), in which electrically induced effects modify the flow (through the Lorentz force) and vice versa. The interaction of viscous, inertial and electromagnetic forces can produce a wider variety of phenomena (Travnikov, Eckert & Odenbach Reference Travnikov, Eckert and Odenbach2011; Garcia & Stefani Reference Garcia and Stefani2018; Garcia et al. Reference Garcia, Seilmayer, Giesecke and Stefani2019, Reference Garcia, Seilmayer, Giesecke and Stefani2020; Garcia et al. Reference Garcia, Seilmayer, Giesecke and Stefani2020; Ogbonna et al. Reference Ogbonna, Garcia, Gundrum, Seilmayer and Stefani2020; Piedra et al. Reference Piedra, Rojas, Rivera and Figueroa2022; Proal et al. Reference Proal, Domínguez-Lozoya, Figueroa, Rivero, Piedra and Núñez2023). The MSC flow has been the subject of theoretical and experimental studies conducted in laboratories around the world (Lathrop, Shew & Sisan Reference Lathrop, Shew and Sisan2001; Colgate Reference Colgate2006; Lathrop & Forest Reference Lathrop and Forest2011; Stefani Reference Stefani2024). The magnetic fields used in laboratories are either axisymmetric axial (produced by coils) or axisymmetric dipolar (produced by permanent magnets located within the inner sphere). Dynamo experiments in spherical configurations include the Wisconsin–Madison dynamo experiment (MDE) driven by an impeller (Nornberg et al. Reference Nornberg, Spence, Kendrick, Jacobson and Forest2006a ,Reference Nornberg, Spence, Kendrick, Jacobson and Forest b ; Reuter, Jenko & Forest Reference Reuter, Jenko and Forest2011), the Derviche Tourneur sodium (DTS) (Nataf et al. Reference Nataf, Alboussière, Brito, Cardin, Gagnière, Jault, Masson and Schmitt2006; Schmitt Reference Schmitt2010; Brito et al. Reference Brito, Alboussière, Cardin, Gagnière, Jault, La Rizza, Masson, Nataf and Schmitt2011; Figueroa et al. Reference Figueroa, Schaeffer, Nataf and Schmitt2013; Nataf Reference Nataf2013; Cabanes, Schaeffer & Nataf Reference Cabanes, Schaeffer and Nataf2014) in Grenoble and systems at the University of Maryland (Shew, Sisan & Lathrop Reference Shew, Sisan and Lathrop2001; Sisan et al. Reference Sisan, Mujica, Tillotson, Huang, Dorland, Hassam, Antonsen and Lathrop2004; Shew & Lathrop Reference Shew and Lathrop2005; Kelley et al. Reference Kelley, Triana, Zimmerman, Tilgner and Lathrop2007; Rojas et al. Reference Rojas, Perevalov, Zürner and Lathrop2021). At HZDR, Germany, the Hydromagnetic Experiment with Differentially Gyrating sphEres HOlding GaInSn (HEDGEHOG) has been developed (Kasprzyk et al. Reference Kasprzyk, Kaplan, Seilmayer and Stefani2017; Garcia & Stefani Reference Garcia and Stefani2018). The HEDGEHOG system has smaller dimensions than sodium experiments (it has an outer sphere with a radius of 9 cm), both spheres can rotate independently of each other and Helmholtz coils produce the magnetic field.
The wide range of possibilities in the MSC flow has allowed for the development of different combinations of magnetic field orientations, boundary conditions for the velocity (magnitude and direction of one or two rotating spheres, slip condition) and electric potential (varying electrical conductivity of the spheres (Dormy, Cardin & Jault Reference Dormy, Cardin and Jault1998; Mizerski & Bajer Reference Mizerski and Bajer2007; Soward & Dormy Reference Soward and Dormy2010), partially (ring-shaped electrode) (Hollerbach et al. Reference Hollerbach, Wei, Noir and Jackson2013) or through all (Dormy et al. Reference Dormy, Cardin and Jault1998; Soward & Dormy Reference Soward and Dormy2010) surfaces), aspect ratio (Marcotte & Gissinger Reference Marcotte and Gissinger2016), among others (Guervilly & Cardin Reference Guervilly and Cardin2010)). Most research on MSC flow examines the instabilities created by the interaction between an external magnetic field and the fluid’s motion (Garcia, Giesecke & Stefani Reference Garcia, Giesecke and Stefani2021). Various factors, such as shear or buoyancy (Zhang & Busse Reference Zhang and Busse1989; Zhang Reference Zhang1995; Grote & Busse Reference Grote and Busse2001), can drive these instabilities, which have been investigated in the presence (Grote & Busse Reference Grote and Busse2001; Kaplan Reference Kaplan2014; Meduri, Lignières & Jouve Reference Meduri, Lignières and Jouve2019; Garcia et al. Reference Garcia, Ogbonna, Giesecke and Stefani2023) or absence (Aubert et al. Reference Aubert, Brito, Nataf, Cardin and Masson2001; Guervilly & Cardin Reference Guervilly and Cardin2016) of magnetic fields. MSC flows can be classified according to the forcing mechanism: (i) mechanical forces; (ii) thermal convection; (iii) compositional convection; and (iv) electromagnetic forces, or a combination of them (Hollerbach & Skinner Reference Hollerbach and Skinner2001). Mechanical forces can be generated by differential rotation (where one or both spheres rotate) (Nataf et al. Reference Nataf, Alboussière, Brito, Cardin, Gagnière, Jault, Masson and Schmitt2006) or impellers within a spherical chamber (Nornberg et al. Reference Nornberg, Spence, Kendrick, Jacobson and Forest2006a ; Reuter et al. Reference Reuter, Jenko and Forest2011). In turn, thermal-driven flow results from inhomogeneous heating of the system, producing the buoyancy force (Kaplan et al. Reference Kaplan, Schaeffer, Vidal and Cardin2017). Special mention must be made of the use of an electric field injected into a sphere shell to allow the study of thermal convection in a microgravity environment (Hart, Glatzmaier & Toomre Reference Hart, Glatzmaier and Toomre1986; Futterer et al. Reference Futterer, Krebs, Plesa, Zaussinger, Hollerbach, Breuer and Egbers2013). However, although compositional convection is possible, where the flow is driven by the spatial variation in the chemical composition of the system (Glatzmaier & Roberts Reference Glatzmaier and Roberts1996; Glatzmaier et al. Reference Glatzmaier, Coe, Hongre and Roberts1999; Roberts & Glatzmaier Reference Roberts and Glatzmaier2000), there are physical constraints to implement it on a laboratory scale. Note that the experiments in this set-up differ significantly from the real conditions. In the lab, gravity always acts vertically, while in reality, it does so radially (Futterer et al. Reference Futterer, Krebs, Plesa, Zaussinger, Hollerbach, Breuer and Egbers2013). However, thermal convection-driven flows are typically less intense compared with shear flows.
Recently, an alternative configuration has been proposed: electromagnetically driven spherical Couette (EMSC) flows, which have been successfully implemented and investigated with an electrolyte as a working fluid (Figueroa et al. Reference Figueroa, Rojas, Rosales and Vázquez2016; Figueroa et al. Reference Figueroa, Rivero, Núñez, Rojas and Rivera2021; Piedra et al. Reference Piedra, Rojas, Rivera and Figueroa2022; Proal et al. Reference Proal, Segura, Domínguez, Rivero and Figueroa2022; Proal et al. Reference Proal, Domínguez-Lozoya, Figueroa, Rivero, Piedra and Núñez2023). An analogue configuration has been studied in a cylindrical annulus in which a liquid metal is driven by an azimuthal Lorentz force resulting from an injected electric current interacting with an externally imposed axial magnetic field (Stelzer et al. Reference Stelzer, Cébron, Miralles, Vantieghem, Noir, Scarfe and Jackson2015a
,Reference Stelzer, Miralles, Cébron, Noir, Vantieghem and Jackson
b
). In the explored EMSC flows, an applied electric current imposed on the conducting fluid interacts with the imposed dipolar magnetic field to set the fluid in motion by the Lorentz force. The latter set-up is very flexible in terms of the spatial structure of the forcing and preserves some fundamental aspects of the flow in the interiors of the planet. In EMSC flows in a low-conductivity fluid, the characteristic Hartmann number is very small (generally below
 $10^{-1}$
), and thus induced electric currents can be ignored. Moreover, this configuration provides another alternative to precisely control the forcing, which can help study different atmospheric phenomena in the laboratory. This study addresses a research gap in the literature on electromagnetically driven flows that use highly conductive fluids, an area that has not been previously explored experimentally in spherical configurations until now. With both spheres stationary, we employ a simple experimental set-up based on the EMSC flow using a gallium-based liquid metal as a working fluid within the laminar regime. To the best knowledge of the authors, currently there is no experimental evidence for this type of flow.
(a) Sketch of the experimental set-up. Both spheres are at rest. The annular gap is half-filled (
 $\pi /2 \leqslant \phi \leqslant \pi$
) with Galinstan. The inner sphere encloses a rectangular permanent magnet. The flow is visualised at the LM surface with PIV. Additionally, UDV measurements are recorded at different polar angles
 $\phi$
. (b) Physical model of the concentric spheres system with radii
 $r_o$
and
 $r_i$
, respectively. A dc electric current
 $\boldsymbol{j}^{0}$
is applied through two ring electrodes located at the equator. The interaction of the dipolar magnetic field
 $\boldsymbol{B}^{0}$
and the LM motion induces an electric current,
 $\boldsymbol{j}^{i}$
. The main direction of the applied and induced Lorentz forces are
 $\boldsymbol{F}^0$
and
 $\boldsymbol{F}^i$
, respectively.

2. Experimental procedure
The experimental set-up used in this research has been employed in previous studies with low-conducting fluids (Figueroa et al. Reference Figueroa, Rojas, Rosales and Vázquez2016, Reference Figueroa, Rojas, Rosales and Vázquez2021; Piedra et al. Reference Piedra, Rojas, Rivera and Figueroa2022; Proal et al. Reference Proal, Segura, Domínguez, Rivero and Figueroa2022, Reference Proal, Domínguez-Lozoya, Figueroa, Rivero, Piedra and Núñez2023). The experimental set-up consists of two concentric spheres, as shown in figure 1(a). The outer sphere is made of plexiglass, while the inner sphere is made of glass. The radii of the outer and inner spheres are
 $r_o=10.5$
and
 $r_i=3.9$
cm, respectively. Thus, the gap
 $\beta =(r_o - r_i) / r_i=1.69$
of this experiment is close to the ratio of the Earth’s core (
 $\beta =1.8$
). The inner sphere is held by a glass shaft of 11 mm in diameter. The influence of this mechanical coupling on the main flow can be neglected. The inner sphere is made up of two watertight glued hemispherical shells. The sphere system is half-filled
 $ ( \pi / 2 \leqslant \phi \leqslant \pi )$
with the gallium-based eutectic alloy Galinstan, which is liquid at room temperature (20
 $^{\circ }$
C). The mass density, kinematic viscosity and electrical conductivity of the working fluid are
 $\rho =6360\,\rm Kg\, m^-{^3}$
,
 $\nu =3.4 \times 10^{-7}\,\rm m{^2}\,s^-{^1}$
and
 $\sigma =3.46 \times 10^{6}\,\rm S\,m^-{^1}$
, respectively. A layer of a hydrochloric acid solution (3
 $\%$
vol.) with a thickness of 5 mm is poured over the liquid metal (LM) to reduce its oxidation. The electrochemical reactions at the acid–liquid metal interface give rise to bubbles (below 1 mm in size) that can be used to visualise the flow at the LM–acid interface. The dipolar magnetic field is generated by a
 $50.8 \textrm { mm} \times 50.8 \textrm { mm} \times 25.4 \textrm { mm}$
neodymium magnet with a maximum magnetic flux density of 0.38 T on its surface. The magnet is placed in the geometrical centre of the inner sphere and is vertically magnetised (aligned to the glass rod). The magnetic field strength inside the fluid varies along the radial direction, from 90 mT at the equator of the inner sphere to 3 mT at the equator of the outer sphere. A dc electric current is injected through two electrode rings (
 $h=0.5$
cm in width) located externally and internally on the equators of the smaller and bigger spheres, respectively. The inner electrode is made of copper and the outer one of graphite. In the present contribution, both spheres are at rest. The applied electric current is generated from a dc-regulated power supply, using an amplitude in the range of
 $I=$
0.2–1.6 A, which corresponds to an electric potential difference of
 $\Delta V=$
0.12–0.96 V. The applied electric current interacts with the dipolar magnetic field, generating a rotational Lorentz force that sets the fluid in motion. The flow develops a transient regime, after which a steady rotational motion in the laminar regime is established, and the free surface of the LM remains flat. The velocity field on the LM surface was obtained with particle image velocimetry (PIV), taking bubbles as tracers (Samsami, Kolesnikov & Thess Reference Samsami, Kolesnikov and Thess2014; Lara, Figueroa & Cuevas Reference Lara, Figueroa and Cuevas2017). All PIV measurements were performed in steady state. The images (1920
 $\times$
1080 pixels) were extracted from video captured with a Nikon D80 camera with an AF micro-nikkor 60 mm f/2.8 D lens at a frame rate of 24 fps. The camera is placed 30 cm above the experimental set-up and focuses on the equatorial plane, which allows for analysing a 14 cm
 $\times$
8 cm area. PIVlab software was used to perform the analysis (Thielicke & Stamhuis Reference Thielicke and Stamhuis2014). Images were digitally masked to perform the PIV analysis only on the flow zone. Time-averaged velocity fields were obtained with 240 frames, that is, 10 s of recording data. In addition, ultrasound Doppler velocimetry (UDV) was used to characterise the radial velocity with a UDV-Signal Processing DOP3010 device and a 4 MHz 5 mm transducer (TR0405LS). The ultrasound transducer was placed outside the outer sphere perpendicular to its wall at the following polar angles:
 $\phi =102^{\circ }$
,
 $115^{\circ }$
and
 $130^{\circ }$
.
3. Theoretical model
The theoretical model considers the main features of the experimental set-up, namely a conducting incompressible viscous fluid contained in a spherical annulus under a non-uniform magnetic field, see figure 1(b). An applied dc electric current density interacts with the imposed magnetic dipolar field, giving rise to a rotational Lorentz force that drives the fluid. The total current density is given by the applied and induced electric currents. In turn, the total magnetic field comprises the imposed one and the field generated by induced currents. The ratio of these magnetic fields corresponds to the magnetic Reynolds number
 $R_m=\mu \sigma u_0 d$
. Here,
 $\mu$
is the magnetic permeability,
 $\sigma$
is the electrical conductivity, and
 $u_0$
and
 $d$
are the characteristic velocity and length, respectively, to be defined later. For the conditions explored in this work,
 $R_m=1.5 \times 10^{-6}$
, and thus the induced magnetic field can be disregarded. By neglecting the
 $O(R_m)$
terms, the governing equations in dimensionless form are
 \begin{equation} \boldsymbol{\nabla}\boldsymbol{\cdot}\textbf {u}=0, \end{equation}
 \begin{equation} \frac {\partial \textbf {u}}{\partial t} + (\textbf {u}\boldsymbol{\cdot}\boldsymbol{\nabla}) \textbf {u} = -\boldsymbol{\nabla}p + \boldsymbol{\nabla} ^{2}\textbf {u} + Q \big(\textbf {j} \times \textbf {B}^{0}\big), \end{equation}
 \begin{equation} \textbf {j} = - \boldsymbol{\nabla} \varphi + \frac {Ha^2}{Q}\big(\textbf {u} \times \textbf {B}^{0}\big), \end{equation}
 \begin{equation} \boldsymbol{\nabla}^{2} \varphi = \frac {Ha^2}{Q} \boldsymbol{\nabla}\boldsymbol{\cdot}\big(\textbf {u} \times \textbf {B}^{0}\big), \end{equation}
where
 $\textbf {u}$
stands for the velocity vector, normalised by
 $u_0=\nu /d$
; while
 $\nu$
and
 $d$
are the kinematic viscosity of the fluid and the characteristic length, namely the gap between the spheres
 $d=r_o-r_i$
. The pressure field is denoted by
 $p$
, normalised by
 $\rho u_0^2$
, where
 $\rho$
is the density of the fluid. The coordinates are normalised by
 $d$
. In turn, time
 $t$
is normalised by
 $d/u_0$
. The third term on the right-hand side of (3.2) represents the Lorentz force due to the applied and induced current densities (
 $\,\textbf{j}=\textbf {j}^0 + \textbf {j}^i$
), which are normalised by the amplitude of the current density
 $j_0=I/A_i$
, with
 $A_i$
the transverse area of the inner electrode (
 $A_i=2 \pi r_i h$
). The magnetic field distribution
 $\textbf {B}^{0}$
is normalised by the amplitude of the magnetic flux density at the equator of the inner sphere,
 $B^0_e=$
0.090 T. Finally, the electric potential is normalised with
 $\varphi _0=j_0 d / \sigma$
. The parameter
 $Q= U_0 / u_0$
stands for the Lorentz force parameter that compares two velocity scales: the characteristic bulk velocity
 $U_0= j_0 B^0_e d^2/\rho \nu$
, which is obtained from a balance between the viscous and Lorentz forces (Figueroa et al. Reference Figueroa, Demiaux, Cuevas and Ramos2009), and the viscous velocity scale
 $u_0$
. In addition, the square of the Hartmann number is the ratio of the electromagnetic force to the viscous force, and therefore is defined as
 $Ha =B^0_e d \sqrt {\sigma / \rho \nu }$
. For the experimental conditions in this work, the Hartmann number is
 $Ha=240$
. The previous system of equations complies with the so-called
 $\varphi$
formulation, where the electric currents are obtained from Ohm’s law, (3.3), and satisfy the conservation of the charge density (
 $\boldsymbol{\nabla}\boldsymbol{\cdot}\textbf {j}=0$
), obtaining the Poisson equation for the electric potential, (3.4). Calculating the Lorentz force terms in (3.2) requires the full three-dimensional applied magnetic field distribution. In dimensionless terms, the imposed dipolar magnetic field is denoted as
 \begin{align} \\[-17pt]\nonumber\textbf {B}^{0} = -\frac {r_i^{3}}{r^{3}} (2 \cos \phi \; \hat {r}+ \sin \phi \; \hat {\phi }),\\[-18pt]\nonumber \end{align}
where
 $\hat {r}$
and
 $\hat {\phi }$
are the unit vectors in the radial and polar directions. Equation (3.5) has been validated with experimental measurement in a similar configuration (Figueroa et al. Reference Figueroa, Schaeffer, Nataf and Schmitt2013, Reference Figueroa, Rojas, Rosales and Vázquez2016; Piedra et al. Reference Piedra, Rojas, Rivera and Figueroa2022; Proal et al. Reference Proal, Segura, Domínguez, Rivero and Figueroa2022; Proal et al. Reference Proal, Domínguez-Lozoya, Figueroa, Rivero, Piedra and Núñez2023). The system of (3.1)–(3.4), along with the expression for the magnetic field, (3.5), conform a closed system for solving the electromagnetically driven flow in the gap between the spheres.
3.1. One-dimensional analytical solution
In this subsection, we simplify the problem using various assumptions that allowed us to obtain an analytical solution to the flow. First, there is no imposed pressure gradient in the azimuthal direction. The only driving force is the azimuthal component of the Lorentz force resulting from the interaction between the external magnetic field
 $\textbf {B}^{0}$
and the radially applied electric current density
 $j_{r}^{0}$
. As the system is considered to be axisymmetric, all quantities are independent of the
 $\theta$
-direction. Additionally, we address only the equatorial plane
 $\phi =\pi /2$
and, thus, only the azimuthal velocity component exists, which depends on the radial coordinate
 $u_{\theta }(r)$
. In this plane, the applied magnetic field is normal, that is,
 $B^0_{\phi }=-r_i^3 / r^3$
. Under these assumptions, the continuity equation is satisfied identically. In turn, the radial component of the momentum equation establishes an equilibrium between the centrifugal force and the counteracting pressure gradient in this direction. For the azimuthal direction, the resulting equation reads
 \begin{equation} \frac {{\rm d}^{2}u_{\theta }}{{\rm d}r^{2}}+\frac {2}{r}\frac {{\rm d}u_{\theta }}{{\rm d}r}-\frac {u_{\theta }}{r^{2}}=Q\;\frac {r_{i}^{5}}{r^{5}}+Ha^{2}\;u_{\theta }\frac {r_{i}^{6}}{r^{6}}, \end{equation}
where the first and second terms on the right-hand side of (3.6) are the applied and induced Lorentz forces, respectively. As in previous works (Figueroa et al. Reference Figueroa, Rojas, Rosales and Vázquez2016, Reference Figueroa, Rivero, Núñez, Rojas and Rivera2021; Proal et al. Reference Proal, Segura, Domínguez, Rivero and Figueroa2022, Reference Proal, Domínguez-Lozoya, Figueroa, Rivero, Piedra and Núñez2023), the applied electric current density was obtained from Ohm’s law (3.3)
 \begin{equation} j_{r}^{0}(r)=r_{i}^{2}/r^{2}, \end{equation}
as well as the induced electric current density
 \begin{equation} j_{r}^{i} \left ( r \right ) = -\frac {Ha^2}{Q} \;\big(u_{\theta }B_{\phi }^{0}\big). \end{equation}
The applied magnetic field from (3.5) reduces to
 $B_{\phi }^{0}(r)= -r_{i}^{3}/r^{3}$
. To solve (3.6), it is required to make a variable change:
 $x={1}/{2}Ha\;r_{i}^{3}r^{-2}$
, which leads to
 \begin{equation} 4x^{2}\frac {{\rm d}^{2}u_{\theta }}{{\rm d}x^{2}}+2x\frac {{\rm d}u_{\theta }}{{\rm d}x}-\big(4x^{2}+1\big)u_{\theta }=\frac {Q\,r_{i}^{1/2}}{\left (Ha/2\right )^{3/2}}x^{3/2}. \end{equation}
For this expression, we look for a solution in the form of
 $u_{\theta }(x)=x^{1/4}u(x)$
. Replacing this solution into (3.9), results in
 \begin{equation} \frac {{\rm d}^{2}u}{{\rm d}x^{2}} + \frac {1}{x}\frac {{\rm d}u}{{\rm d}x} - \left (\frac {\gamma ^{2}}{x^{2}} + 1\right ) u = \alpha \, x^{\lambda -1}, \end{equation}
where
 $\gamma =\sqrt {5}/4$
,
 $\lambda =1/4$
and
 $\alpha = Q\, (r_{i}/2 )^{1/2} \, Ha^{-3/2}$
. Equation (3.10) is a modified non-homogeneous Bessel differential equation whose general solution is obtained as the sum of the general solution of the homogeneous equation plus the particular solution of the non-homogeneous equation. The solution of the homogeneous equation (see Watson Reference Watson1995; Olver et al. Reference Olver, Lozier, Boisvert and Clark2010) is given as a linear combination of the modified Bessel functions of the first and second kind,
 $I_{\nu } ( x )$
and
 $K_{\nu } ( x )$
, respectively. To obtain a particular solution of (3.10), first, we rewrite it in the form of the Lommel’s differential equation (Watson Reference Watson1995; Olver et al. Reference Olver, Lozier, Boisvert and Clark2010) by replacing
 $x=-\imath z$
, where
 $\imath$
is the imaginary unit. The resulting equation is
 \begin{equation} \frac {{\rm d}^{2}u}{{\rm d}z^{2}}+\frac {1}{z}\frac {{\rm d}u}{{\rm d}z}+\left (1-\frac {\gamma ^{2}}{z^{2}}\right )u=\tilde {\alpha }z^{\lambda -1}, \end{equation}
where
 $\tilde {\alpha }=-\alpha (-\imath )^{\lambda -1}$
. A particular solution,
 $f_{p}(z)$
, of (3.11) can be given in terms of the Lommel function (Watson Reference Watson1995; Olver et al. Reference Olver, Lozier, Boisvert and Clark2010),
 $s_{{\lambda },{\gamma }}$
, that is,
 \begin{equation} f_{p}(z)=\tilde {\alpha }\,s_{{\lambda },{\gamma }}\left (z\right ), \end{equation}
with the Lommel function defined from Olver et al. (Reference Olver, Lozier, Boisvert and Clark2010) as
 \begin{equation} s_{{\lambda },{\gamma }}\left (z\right )=z^{\lambda +1}\sum _{k=0}^{\infty }(-1)^{k}\frac {z^{2k}}{a_{k+1}(\lambda ,\gamma )} \end{equation}
and
 \begin{equation} a_{k}(\lambda ,\gamma )=\prod _{m=1}^{k}\big((\lambda +2m-1)^{2}-\gamma ^{2}\big),\quad k=0,1,2,\ldots , \end{equation}
only if
 $\lambda \pm \gamma \neq -1,\,-3,\,-5, \ldots $
. Furthermore, since our goal is to find a particular solution,
 $f_{p}(x)$
, of (3.10), we replace
 $z=\imath x$
in (3.12). This leads to the particular solution in terms of
 $x$
, which is read as
 \begin{equation} f_{p}(x)=\alpha \tilde {s}_{{\lambda },{\gamma }}(x), \end{equation}
where
 \begin{equation} \tilde {s}_{{\lambda },{\gamma }} \left ( x \right ) = x^{\lambda +1} \sum _{k=0}^{\infty }\frac {x^{2k}}{a_{k+1} (\lambda ,\gamma )} \end{equation}
and
 $a_{k+1}(\lambda ,\gamma )$
is given in (3.14). We refer to
 $\tilde {s}_{{\lambda },{\gamma }}$
as the modified Lommel function. Then, the general solution of (3.10) reads as
 \begin{equation} u(x) = A I_{\gamma } \left ( x \right ) + B K_{\gamma }\left ( x \right ) + \alpha \tilde {s}_{{\lambda },{\gamma }} \left ( x \right ) , \end{equation}
where
 $A$
and
 $B$
are constants to be determined from the no-slip boundary conditions,
 $u ( {1}/{2} Ha \, r_{i} ) = u ({1}/{2}Ha \, r_{i}^{3}r_{o}^{-2} ) = 0$
, and
 $\tilde {s}_{{\lambda },{\gamma }} ( x )$
is given by (3.16). After some mathematical manipulation, we obtain the unique solution for the velocity
 $u(x)$
,
 \begin{equation} u(x)=\frac {Q(r_{i}/2)^{1/2}}{Ha^{3/2}}\left (\frac {S_{K}}{P_{\gamma }}I_{\frac {\sqrt {5}}{4}}(x)-\frac {S_{I}}{P_{\gamma }}K_{\frac {\sqrt {5}}{4}}(x)+\tilde {s}_{{\frac {1}{4}},{\frac {\sqrt {5}}{4}}}\left (x\right )\right ), \end{equation}
where
 \begin{equation} \begin{array}{c} S_{K}=K_{\frac {\sqrt {5}}{4}} \left (\dfrac {Ha\,r_{i}^{3}}{2r_{o}^{2}} \right ) \tilde {s}_{{\frac {1}{4}},{\frac {\sqrt {5}}{4}}}\left (\dfrac {Ha\,r_{i}}{2}\right )-K_{\frac {\sqrt {5}}{4}} \left ( \dfrac {Ha\,r_{i}}{2} \right ) \tilde {s}_{{\frac {1}{4}},{\frac {\sqrt {5}}{4}}}\left (\dfrac {Ha\,r_{i}^{3}}{2r_{o}^{2}}\right ),\\[15pt] S_{I}=I_{\frac {\sqrt {5}}{4}} \left ( \dfrac {Ha\,r_{i}^{3}}{2r_{o}^{2}} \right ) \tilde {s}_{{\frac {1}{4}},{\frac {\sqrt {5}}{4}}}\left (\dfrac {Ha\,r_{i}}{2}\right )-I_{\frac {\sqrt {5}}{4}} \left ( \dfrac {Ha\,r_{i}}{2} \right )\tilde {s}_{{\frac {1}{4}},{\frac {\sqrt {5}}{4}}}\left (\dfrac {Ha\,r_{i}^{3}}{2r_{o}^{2}}\right ),\quad \\[15pt] P_{\gamma}=I_{\frac {\sqrt {5}}{4}} \left ( \dfrac {Ha\,r_{i}^{3}}{2r_{o}^{2}} \right ) K_{\frac {\sqrt {5}}{4}} \left ( \dfrac {Ha\,r_{i}}{2} \right ) -I_{\frac {\sqrt {5}}{4}} \left ( \dfrac {Ha\,r_{i}}{2} \right ) K_{\frac {\sqrt {5}}{4}} \left ( \dfrac {Ha\,r_{i}^{3}}{2r_{o}^{2}} \right ) . \qquad \end{array} \end{equation}
Finally, the complete solution to (3.6) is obtained by substituting
 $x = {1}/{2}Ha \, r_{i}^{3} r^{-2}$
in
 $u_{\theta } ( x ) = x^{1/4} u ( x )$
, which after rearrangement reads as
 \begin{align} u_{\theta}(r) = Q\left (\dfrac {r_{i}}{2Ha}\right )^{5/4}\left (\dfrac {S_{K}}{P_{\gamma }}\dfrac {I_{\frac{\sqrt {5}}{4}}\left(\dfrac {Ha\,r_{i}^{3}}{2r^{2}}\right )}{\sqrt {r/2}}-\dfrac {S_{I}}{P_{\gamma }}\dfrac {K_{\frac {\sqrt {5}}{4}}\left (\dfrac {Ha\,r_{i}^{3}}{2r^{2}}\right )}{\sqrt {r/2}}+\dfrac {\tilde {s}_{{\frac {1}{4}},{\frac {\sqrt {5}}{4}}}\left (\dfrac {Ha\,r_{i}^{3}}{2r^{2}}\right )}{\sqrt {r/2}}\right )\kern-2.5pt,\nonumber\\[-2pt] \end{align}
where
 $S_{K}$
,
 $S_{I}$
and
 $P_{\gamma }$
are given in (3.19). The one-dimensional (1-D) analytic solution (3.20) provides the azimuthal component of the velocity as a function of the radius in the equatorial plane. It should be noted that
 $u_{\theta } ( r )$
is also a function of the Hartmann number and therefore is valid for electrolyte flows, as well as for LM flows in the
 $R_m \ll 1$
regime. As convective terms are neglected, it is only valid for the creeping flow regime, namely
 $Q \leqslant 1$
.
3.2. Three-dimensional numerical solution
The analytic solution obtained in the last subsection does not take into account convective effects. In general, convective effects promote the three-dimensionality of the flow and, therefore, accurate modelling requires a three-dimensional (3-D) numerical approach. To get the complete picture of the flow, the system of (3.1)
 $-$
(3.4) was solved numerically in a domain corresponding to the experimental set-up. An in-house built code was adapted to the spherical coordinate system using the finite difference method based on the procedure described by Griebel, Dornseifer & Neunhoeffer (Reference Griebel, Dornseifer and Neunhoeffer1998) and Cuevas, Smolentsev & Abdou (Reference Cuevas, Smolentsev and Abdou2006), including electromagnetic forces in high-conductivity fluids. In the experiment, the inner sphere is held by a glass shaft, which was not included in the numerical model. The calculation of the Lorentz force terms in (3.2) requires the full 3-D magnetic field distribution of the permanent magnet (see (3.5)), which accurately reproduces the experimental field (Proal et al. Reference Proal, Segura, Domínguez, Rivero and Figueroa2022). The number of elements in the polar direction has been adjusted to better fit the electrode height. That is, ring electrodes are modelled as surfaces and not as a line source at the equator. The numerical model uses a uniform staggered mesh. Although there is a small difference between the inner and outer electrode heights, no significant changes were observed in the results. In the domain corresponding to the electrodes, the potential was set to
 $\left . -\partial \varphi / \partial r \right \vert _{r=r_i} = 1$
at the inner one, that is,
 $j_r(r_i)=1$
, and
 $\varphi (r_o)=0$
at the outer one. The Neumann condition
 $\partial \varphi / \partial r = 0$
, which corresponds to
 $j_r=0$
, was used for the insulating domain of the spheres. The numerical solution considers no-slip condition on the spheres. The initial boundary conditions refer to a quiescent fluid (
 $\textbf {u}=0$
) without an electric potential gradient (
 $\varphi =0$
). The numerical code has previously been compared with analytical solutions and experimental results for electromagnetically driven low-conductivity fluids (Figueroa et al. Reference Figueroa, Rojas, Rosales and Vázquez2016, Reference Figueroa, Rivero, Núñez, Rojas and Rivera2021; Piedra et al. Reference Piedra, Rojas, Rivera and Figueroa2022; Proal et al. Reference Proal, Segura, Domínguez, Rivero and Figueroa2022, Reference Proal, Domínguez-Lozoya, Figueroa, Rivero, Piedra and Núñez2023). To compare the numerical solutions with the analytical expression (3.20), we opted for using
 $Q=1$
since the numerical methodology does not allow
 $Q$
to be smaller than unity. The numerical algorithm we implemented accounts for convective and diffusive effects; however, the terms related to these effects in the Navier–Stokes equations cannot be eliminated in the
 $Q \leqslant 1$
limit. Additionally, we used the electrical conductivity of the liquid metal as a fitting parameter in our numerical model. This choice stems from specific physical features that are not explicitly modelled, particularly the electrical contact between the graphite electrode (which has an electrical conductivity that is an order of magnitude lower than that of the liquid metal) and the Galinstan. Unlike copper electrodes, where common practices can be employed to enhance wettability, these methods do not apply to graphite. This constraint reduces the equivalent resistance of the electrode–Galinstan system. Consequently, we adjusted the electrical conductivity of the liquid metal in the simulations to ensure that the results aligned with the experimental findings. Once the conductivity value was determined, it remained constant throughout all simulations. Therefore, the Hartmann number in our simulations was set to
 $Ha = 170$
. The applied current conditions and corresponding dimensionless numbers are presented in table 1. To verify the validity of the assumption regarding the symmetry in the equatorial plane, under the explored experimental conditions, simulations were carried out considering the entire domain
 $ ( 0 \leqslant \phi \leqslant \pi )$
and only half of the spheres
 $ ( \pi / 2 \leqslant \phi \leqslant \pi )$
. For simulating half-filled spheres, on the LM free surface, we used the free-slip condition for the velocity field
 $\left . \partial \boldsymbol{\rm u} / \partial \phi \right \vert _{\phi\,{=}\,\pi / 2} = 0$
and the insulating condition for the electric potential
 $\left . \partial \varphi / \partial \phi \right \vert _{\phi\,{=}\,\pi / 2} = 0$
. No significant differences were found; therefore, considering the equator as a plane of symmetry is a plausible assumption. Considering the convention in geography, the elevation (latitude) range
 $-\pi /2 \leqslant \phi ' \leqslant \pi /2$
, the flows display a mirror symmetry with respect to the equator (
 $\phi '=0$
), namely
 \begin{align} u_r(r, \theta , \phi ') &= u_r(r, \theta , -\phi '),\notag \\[4pt] u_{\theta }(r, \theta , \phi ') &= u_{\theta }(r, \theta , -\phi '),\notag \\[4pt] u_{\phi }(r, \theta , \phi ') &= -u_{\phi }(r, \theta , -\phi '). \end{align}
In § 4, the numerical model is validated against the analytical solution and experimental observations for flows of high-conductivity liquids.
Experimental parameters and dimensionless numbers.
 $Ha=240$
,
 $R_m=1.5 \times 10^{-6}$
.

4. Results
In the present section, we initially give a description of the flow in the creeping flow regime and provide a comparison with analytical and numerical results. Afterwards, the flow under laboratory conditions is discussed with experimental PIV observations at the equatorial plane and UDV recordings at several polar angles, and later, the numerical simulations are compared with the experimental data.
4.1. Creeping flow regime
The flow is set into motion when a radially injected electric current interacts with the imposed dipolar magnetic field. In the creeping flow regime (
 $Q \leqslant 1$
), the dynamics is governed by one dimensionless number, that is, the Hartmann number
 $Ha$
. When the Hartmann number is low, the electromagnetic interaction generates a Lorentz force, which points in the negative
 $\theta$
-direction and drives a rotational flow in the equatorial region between the spheres, see figure 2(a). We must note that the absolute value of the maximum velocity in the dimensionless profile is
 $u_{max}=0.0107$
; for the sake of presentation, the velocity profiles of the results were renormalised with
 $u_{max}$
. When the Hartmann number is increased, the induced electric current also increases as established in (3.8); thus, the induced Lorentz force arises and reduces the velocity of the flow (referred to as Hartmann braking), see figure 2(b). Furthermore, we can observe that the numerical results from the full sphere code (dashed lines) agree qualitatively and quantitatively with the analytical solutions (continuous lines) for small and high
 $Ha$
. The latter validates the numerical code and the assumptions considered in the development of the analytical approach.
Radial profiles of azimuthal velocity
 $u_{\theta }$
at the equatorial plane with
 $Q=1$
for (a)
 $Ha=0.1$
and (b)
 $Ha=60$
. Continuous lines, analytical solution (3.20); dashed lines, numerical simulations. (c) Absolute value of
 $u_{\theta \; max}$
as a function of the Hartmann number from the analytical solution. (d) Analytical radial profiles of the electric current densities for
 $Ha=60$
in dimensionless form. The dash-dotted, dashed and continuous lines denote the applied (3.7), induced (3.8) and total electric current (
 $j_r = j_r^0 + j_r^i$
), respectively.

For low-Hartmann flows (as shown in figure 2a
), such as electrolytes, the induced electric currents can be neglected. Therefore, the flow can be considered hydrodynamic even if the driving force is electromagnetic. In these conditions, the velocity profile in the core behaves as
 $u_{\theta } \sim r^{-3}$
, which can be derived from a balance between the diffusive and the applied Lorentz force terms. This is consistent with the analytic solution presented by Figueroa et al. (Reference Figueroa, Rojas, Rosales and Vázquez2016). In addition, two viscous layers are observed in the inner and outer spheres. However, the profile in the core is linear (
 $u_{\theta } \sim r$
) for the high Hartmann flow (figure 2b
), since now, the balance is between the diffusive and both Lorentz forces (induced and applied) terms. In this scenario, the Shercliff layers are present near the spheres because the imposed magnetic field is parallel to the walls. Considering that the thickness of the Shercliff layer scales as
 $Ha^{-1/2}$
(Roberts Reference Roberts1967), because the magnetic field is dipolar and varies with
 $r$
, the Hartmann number varies locally from
 $Ha=60$
close to the inner sphere to
 $Ha=3$
at the outer sphere; thus, the thicknesses of the boundary layer are
 $\delta =0.13$
and
 $\delta = 0.57$
at
 $r_i$
and
 $r_o$
, respectively. This is consistent with the results shown in figure 2(b). As observed in figures 2(a) and 2(b), the absolute value of the maximum azimuthal velocity
 $u_{\theta , \, max}$
decreases with
 $Ha$
due to Hartmann braking. The latter can be easily perceived in figure 2(c), where the maximum velocity is plotted as a function of the Hartmann number. Additionally, the shape of the velocity profile changes with
 $Ha$
, the maximum velocity location moves from the inner sphere to the outer sphere, which is not a centrifugal effect, since the magnitude of the velocity is reduced with
 $Ha$
. For the low-Hartmann flow, the induced electric current is negligible and the flow is dominated by the force promoted by the applied current
 $j_r^0$
; therefore, the maximum magnitude of the velocity is close to the inner sphere where the forcing is stronger, as observed by Figueroa et al. (Reference Figueroa, Rojas, Rosales and Vázquez2016) and Piedra et al. (Reference Piedra, Rojas, Rivera and Figueroa2022). In turn, for the high-Hartmann flow, the induced electric current
 $j_r^i$
cannot be neglected and has its maximum close to the inner sphere, see figure 2(d). Thus, the Lorentz force due to the induced electric current is stronger in this region, which promotes the maximum magnitude of the velocity shift towards the outer sphere. In figure 2(d), we can observe that the induced electric current is intense inside the Shercliff layer, reaching a maximum value, and it is weak close to the outer sphere. Furthermore, in figure 2(d), we observe that the total electric current is close to zero in the core (
 $0.7 \lt r \lt 1.1$
), which is consistent with the study reported by Stelzer et al. (Reference Stelzer, Cébron, Miralles, Vantieghem, Noir, Scarfe and Jackson2015a
).
In the creeping flow regime, the rotational flow is axisymmetric since convective effects are negligible. A more complete picture of the flow can be seen in figure 3, where a meridional map of the azimuthal velocity is displayed. For the sake of presentation, the velocity maps were renormalised with
 $u_{max}=0.0107$
. For the low-Hartmann flow, see figure 3(a), the velocity is intense in the equatorial zone close to the inner sphere and extends towards the polar zone. When the Hartmann number increases, as seen in figure 3(b), the overall velocity is reduced by one order of magnitude and the flow does not reach the polar zone of the inner sphere. The numerical results in figures 2 and 3 correspond to single snapshots.
Contour map of azimuthal velocity
 $u_{\theta }$
at the meridional plane for
 $Q=1$
: (a)
 $Ha=0.1$
; (b)
 $Ha=60$
. Numerical simulations.

4.2. Experimental comparison
In this subsection, we initially come up with a description of the flow under experimental conditions based on PIV observations on the free surface (the equatorial plane) and UDV measurements at different polar angles, and subsequently, the experimental data are compared with 3-D numerical simulations. As will be shown shortly, under the explored conditions, the flow dynamics is governed by two dimensionless numbers, namely the Reynolds number
 $Re$
and the Hartmann number
 $Ha$
.


(a) Azimuthal velocity profiles at the equator for different applied electrical currents. Marker lines, PIV observations; continuous lines, numerical simulations. (b) Absolute value of the maximum azimuthal velocity as a function of the applied electric current. Markers, PIV observations; continuous line, numerical simulations. (c) Radial velocity profiles at
 $\phi =102^{\circ }$
for different applied electric currents. Dashed lines, UDV measurements; continuous lines, numerical simulations. (d) Radial velocity profiles at different polar angles for
 $I=1$
A. Dashed lines, UDV measurements; continuous lines, numerical simulations.

When the mainly radial applied electric current interacts with the dipolar magnetic field, a mainly azimuthal Lorentz force is generated, which promotes an electromagnetically driven rotational flow in the gap between the spheres, as seen in figure 4. Since the experimental setting does not allow optical access to the flow, we make use of the equatorial symmetry for low current flows to fill half the spherical gap to carry out PIV observations. We must note that numerical simulations did not show differences between the flows with the sphere full
 $ ( 0 \leqslant \phi \leqslant \pi )$
and half-full
 $ ( \pi / 2 \leqslant \phi \leqslant \pi )$
, so the second option was chosen since it has the advantage of allowing PIV in the experimental observations. All PIV results presented are in the steady state. The PIV data come from time-averaged PIV fields at the equatorial plane. As the applied electric current is increased, the velocity of rotation also increases. The rotation of the fluid can be inverted by changing either the magnetic field or the injected current direction, the latter being easier. The radial profile of the azimuthal component
 $u_{\theta }$
is presented in figure 5(a) for different intensities of the applied electric current
 $I$
. Due to the no-slip condition on the spheres, we observe the maximum velocity close to the inner sphere and Shercliff layers close to the walls. For low currents, the velocity profile in the core becomes more linear as the radius
 $ r$
increases. This behaviour arises from the balance between the convective force and both the induced and applied Lorentz force terms, leading to
 $ u_{\theta } \sim r^{-5} + r$
. Additionally, the location of the maximum velocity moves closer to the outer sphere, which is consistent with figure 2(b). The maximum velocity location depends on the boundary layer width, as convective effects are larger, the maximum velocity approaches the inner sphere’s equator. For high currents, the location of the maximum velocity approaches the inner sphere equator, which agrees with figure 2(a). This can be explained if we consider that the Lorentz force is confined to the region near the inner sphere, where both the magnetic field and injected current are more intense, and decays as
 $r^{-5}$
(Piedra et al. Reference Piedra, Rojas, Rivera and Figueroa2022). Furthermore, the velocity profile in the core behaves as
 $u_{\theta } \sim r^{-2}$
, which can be inferred from a balance between the convective and the applied Lorentz force terms. This result aligns with previously reported experimental profiles (Figueroa et al. Reference Figueroa, Rojas, Rosales and Vázquez2016; Piedra et al. Reference Piedra, Rojas, Rivera and Figueroa2022; Proal et al. Reference Proal, Segura, Domínguez, Rivero and Figueroa2022). As the applied current increases, the absolute value of the maximum azimuthal velocity also increases, reaching up to
 $ \vert u_{\theta \; max} \vert \approx 11$
mm s
 $^{-1}$
for
 $I=1.6$
A, see figure 5(b). The Reynolds number based on the maximum velocity
 $Re= \vert u_{\theta \; max} \vert d / \nu$
for the applied electric currents
 $I=0.2$
A and
 $I=1.6$
A is
 $Re = 450$
and
 $Re = 2230$
, respectively. Thus, even though the flows remain in the laminar regime, in the experimental conditions, convective effects are noticeable. The interaction parameter (or Stuart number)
 $N = Ha^2 /Re$
, which denotes the ratio of electromagnetic to inertial forces, is
 $N=128$
and
 $N=26$
for
 $I=0.2$
A and
 $I=1.6$
A, respectively. Table 1 summarises the applied electric currents and the corresponding dimensionless numbers. Therefore, the coupling between the velocity field and the electric current is not negligible for the experimental conditions, and it reduces as the applied electric current increases. Figure 5(c) presents the experimental
 $u_r$
profiles for the UDV probe located at
 $\phi =102^{\circ }$
. As the applied electric current is increased, the amplitude of the radial velocity also increases. Note that these UDV measurements correspond to time averages of 900 s once the steady state is reached, dashed lines in the spatial-temporal UDV measurements shown in figure 6. Figure 5(d) shows the radial velocity component at different polar angles for a given applied electrical current, namely,
 $I=1$
A. For visualisation purposes, the dashed lines added in figures 7(a) and 7(b) denote the polar angles where UDV measurements were taken. Under the explored experimental conditions, the flow is predominantly in the azimuthal direction, as the radial motion is smaller in order of magnitude. It is worth mentioning that the maximum velocities of the
 $u_r$
component obtained from PIV at
 $\phi =90^{\circ }$
, that is, 0.1, 0.3 and 0.4 mm s
 $^{-1}$
for the corresponding applied currents 0.2, 0.6 and 1 A, are of the same order as the UDV measurements at
 $\phi =102^{\circ }$
, see figure 5(c).
The three-dimensional numerical simulations are in steady state and do not reflect the dependence on the azimuthal angle. As observed in figures 5(a)–5(d), the results from the half-sphere simulations (
 $\pi / 2 \leqslant \phi \leqslant \pi$
) agree qualitatively with the experimental observations, since velocities are of the same order as measurements, but their correspondence is not perfect. The discrepancies follow a series of unavoidable experimental errors. Concerning the PIV observations, the intrinsic error was obtained by adjusting a normal distribution to the data at the sample points; thus, the maximum error in the experimental observations was 15
 $\%$
, as shown by the error bars in figure 5(a) for
 $I=0.2$
A. Additionally, we must note that the PIV was performed considering the motion of the bubbles at the interface between the liquid metal and the acid. For applied electric currents
 $I \gt 0.6$
A, the number of bubbles decreases and the PIV technique struggles to obtain smooth velocity profiles, introducing an additional error of up to 10
 $\%$
, see the error bars in figure 5(a) for
 $I=1.4$
A. In addition, it is assumed that the bubbles adhere perfectly to the LM surface. This could not be entirely true as the LM velocity increases, since inertial effects and drag over the bubbles could increase the uncertainty, especially near the outer sphere. Finally, the optical aberration caused by the spherical geometry increases the error of the PIV observations. A simple model of this effect has been added in Appendix A. Since the optical aberration increases considerably near the outer sphere, in addition to other uncertainty sources, the PIV observations are reliable for
 $ r_i \leqslant r \leqslant 0.07$
m. Taking into account the latter, the line types for the profiles for
 $ r \gt 0.07$
m in figure 5(a) were modified (dashed). The numerical results in figure 5 were obtained from time-averaged data (100 s). Finally, it should be noted that the azimuthal velocity profiles in the symmetry plane resemble those observed in a cylindrical configuration (Stelzer et al. Reference Stelzer, Cébron, Miralles, Vantieghem, Noir, Scarfe and Jackson2015a
), with velocity magnitudes and boundary layer thicknesses of the same order of magnitude for the same Hartmann numbers.
Regarding the UDV technique, the measurements reported with the TR0405LS transducer correspond to the average velocity within an approximately cylindrical volume
 ${\sim} 1.7$
mm thick with a diameter of 5 mm in the outer sphere and
 ${\sim} 9$
mm in the inner sphere due to the divergence of the ultrasound beam. Measurements along the transducer axis are reported and are radially directed in explored configurations. Figure 6 shows the spatiotemporal distributions of the UDV measurements of the radial velocity component
 $u_r$
as a function of the radial coordinate
 $r$
at
 $\phi = 102^{\circ }$
for
 $I=0.2$
A and
 $I=1$
A. We can observe a transient state of approximately 320 s and 360 s for
 $I=0.2$
A and
 $I\,{=}\,1$
A, respectively, indicated by vertical dashed black lines in the plots. In the steady state, well-defined stripes are observed. The reported profiles correspond to the average value within the steady state. The error bars are considered as
 $\pm$
one standard deviation. The corresponding error bars were added to the UDV profiles in figures 5(c) and 5(d). We must note that error bars were added only to the profiles for the smallest and largest applied electric current as a reference. These results indicate that, in general, the numerical model can reproduce the experimental conditions explored of the EMSC flows, which remain symmetric with respect to the equatorial plane. A comparison between the experimental measurements and the analytical model is not possible, since the model is only valid for the creeping flow regime. In contrast, experimental observations confirm the existence of convective effects.
Spatio-temporal distributions of
 $u_r$
at
 $\phi = 102^{\circ }$
: (a)
 $I=0.2$
A; (b)
 $I=1$
A. UDV observations.
 $Ha=240$
.

The general features of the flows are more clearly observed in figure 7, where the velocity maps and streamlines in the meridional plane are plotted. For low applied electric currents (
 $I=0.2$
A), see figure 7(a, c, e), the flow is located mainly in the equatorial region. However, as the applied electric current increases, the magnitude of the velocity also increases and the flow extends towards the polar region because of convective effects. In general, the radial and polar velocity components are one order of magnitude smaller than the azimuthal component. The velocity map is axisymmetric and preserves symmetry with respect to the equator. However, the flow exhibits a three-dimensional structure, since radial and polar flows show regions with counter-flows. Due to the centrifugal force, a radial flow from the inner to the outer sphere is established, see figures 7(a) and 7(b). The main circular motion establishes a strong secondary flow that goes from the equator towards the poles, see the meridional streamlines in figures 7(e) and 7(f). The latter coincides with the low-conductivity study of Piedra et al. (Reference Piedra, Rojas, Rivera and Figueroa2022) and the MSC study of Figueroa et al. (Reference Figueroa, Schaeffer, Nataf and Schmitt2013). Figure 7(a)– 7(f) were obtained from from a time- (100 s) and azimuth-average.
(a–d) Contour maps of the velocity components at the meridional plane. (e,f) Meridional streamlines,
 $U$
denotes the magnitude of the meridional velocity. First column
 $I=0.2$
A. Second column
 $I=1$
A. Dashed lines in panels (a) and (b) denote the UDV measurements shown in figures 5(c) and 5(d). Numerical simulations.
 $Ha=170$
.

Figure 8 shows the contour map of
 $j^i_{\theta }$
along with the meridional induced current lines. This figure corresponds to a time- (100 s) and azimuth-average. The azimuthal component
 $j^i_{\theta }$
shows a sign change according to the radial component of the velocity. As the applied electric current increases, the induced currents spread to higher latitudes; however, in the polar regions, they are close to zero. In addition, the meridional induced current lines show a quadrupolar-like distribution, that is, the current lines are perpendicular to the electrodes and tangent to the insulating regions of the inner and outer spheres. The latter quadrupolar-like distribution ensures the conservation of the charge density (
 $\boldsymbol{\nabla}\boldsymbol{\cdot}\textbf {j}^{i}=0$
). Since the induced current density vector (
 $\textbf {j}^{i}$
) is three-dimensional (see figures 9c
and 9d
), the meridional current lines seem to penetrate the insulating regions of the spheres. However, in these regions, the current either bends into or out of the plane. Thus, the insulating condition (
 $j_r=0$
) is still satisfied. It is important to recall that the numerical model employs a uniform staggered mesh, which leads to a slight discrepancy between the heights of the inner and outer electrodes compared with the experimental values.
Contour map of the azimuthal induced current
 $j^i_{\theta }$
with the meridional induced electrical current lines: (a)
 $I=0.2$
A; (b)
 $I=1$
A. Numerical simulations.
 $Ha=170$
.

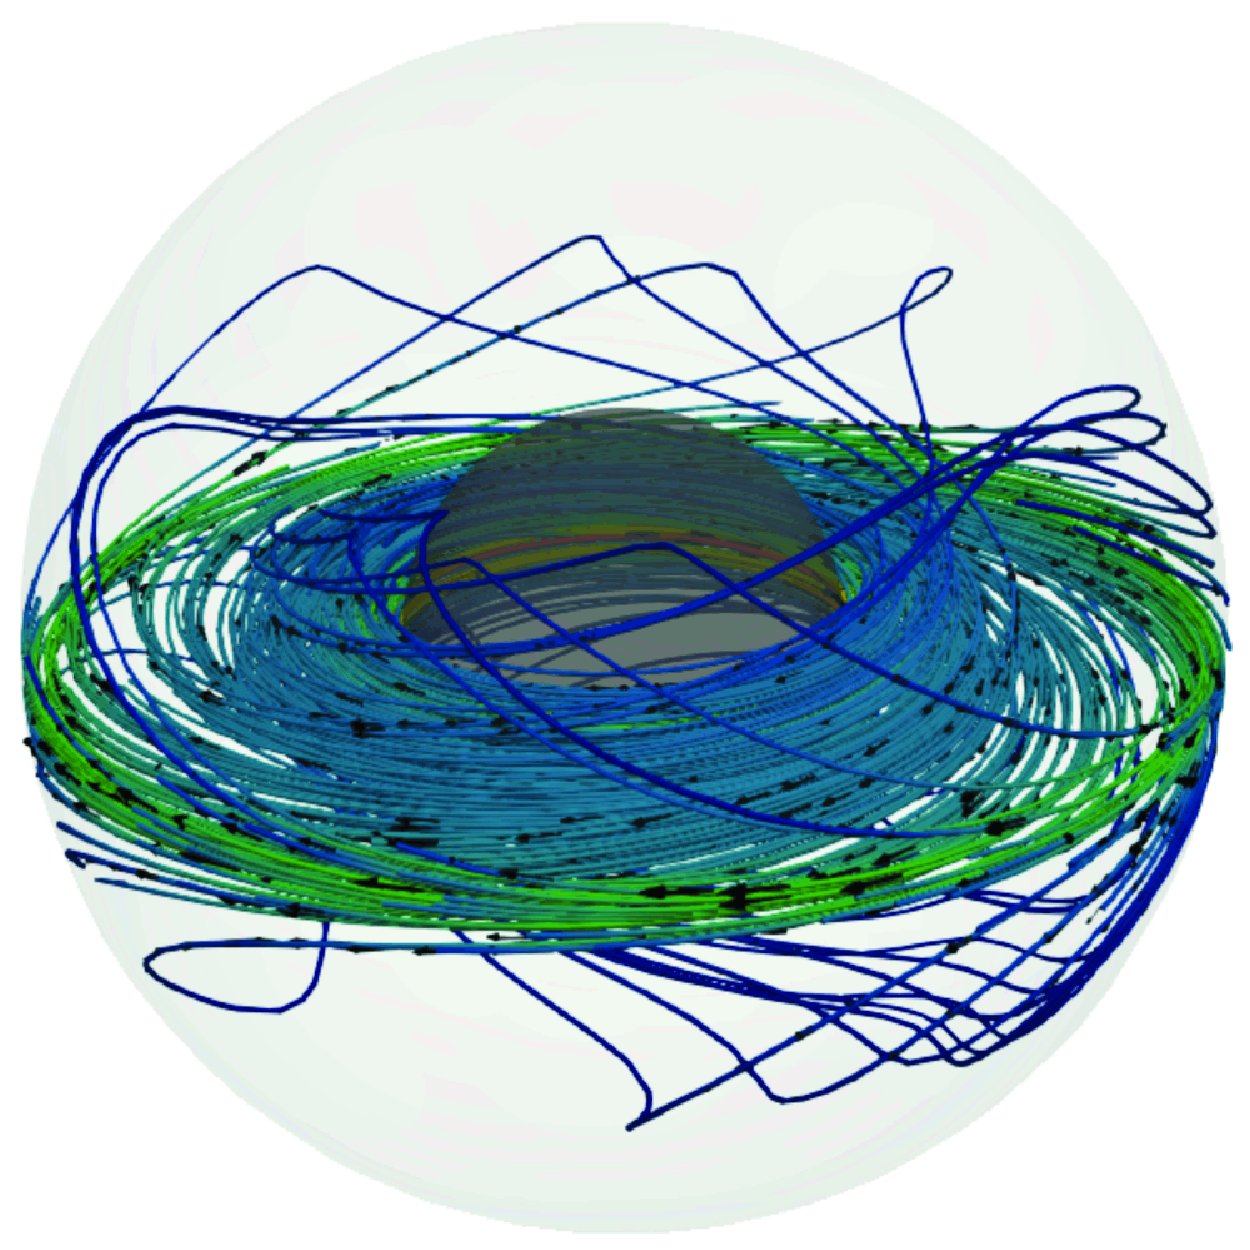
A complete picture of the flows with
 $I=0.2$
A and
 $I=1$
A can be visualised in the snapshots of numerical results shown in figure 9. For small electric currents (
 $I=0.2$
A), two doughnut-shaped recirculations are observed around the equator; see figure 9(a). The flow is predominantly governed by diffusion, so the flow pattern is symmetric with respect to the equatorial plane and does not depend on the azimuthal coordinate. In the case of high electric current, see figure 9(b), convective effects dominate and the recirculation is elongated in the radial and polar directions, filling the whole gap between the spheres and displaying a full three-dimensional motion. The colour bar denotes the magnitude of the velocity
 $U$
in mm s
 $^{-1}$
for figure 9(a, b). The flow interaction with the applied magnetic field generates loops of induced electric current inside the annular gap. Figure 9(c,d) shows the paths of the induced electric current. The colour bar for figure 9(c,d) denotes the magnitude of the induced electric density current
 $J$
in dimensionless units. As already mentioned, the magnitude of the induced current is intense close to the inner sphere. As the applied current increases, the induced electric currents are twisted by the flow. Furthermore, the paths of the induced currents in the polar regions follow closed loops with spiral trajectories.
Three-dimensional structure of the flow and the induced electrical current. (a,b) Streamlines of the velocity field for
 $I = 0.2$
A and
 $I = 1$
A. (c,d) Paths of the induced electrical current for
 $I = 0.2$
A and
 $I = 1$
A.
 $U$
and
 $J$
denote the magnitude of the velocity and the induced electrical current vectors, respectively. Numerical calculations.
 $Ha=170$
.

Once the numerical code was validated with both analytical and experimental results, we can explore the flow dynamics for higher applied electric currents. It is important to highlight that contrary to low-conductivity flows in concentric spheres where electromagnetically induced forces are neglected (Figueroa et al. Reference Figueroa, Rojas, Rosales and Vázquez2016; Piedra et al. Reference Piedra, Rojas, Rivera and Figueroa2022; Proal et al. Reference Proal, Segura, Domínguez, Rivero and Figueroa2022, Reference Proal, Domínguez-Lozoya, Figueroa, Rivero, Piedra and Núñez2023) and instabilities arise around
 $Re \approx 1500$
, here, induced effects brake the flow and instabilities are triggered at larger Reynolds numbers. It was found numerically with the full sphere code (
 $0 \leqslant \phi \leqslant \pi$
) that for a critical electric current
 $I \approx 9$
A (
 $Re = 7880$
,
 $N=3.7$
), an instability occurs and the flow becomes time dependent. Hence, the flow is no longer symmetric with respect to the equatorial plane. However, the latter is an independent study of the present work and the present study restricts the analysis of flows below this threshold.
In contrast to the mechanically forced magnetised spherical Couette flow, where the flow is induced by the drag of the rotating spheres, in this work, the flow is produced by the electromagnetic interaction of the applied electric current and the dipolar magnetic field. That is, the MSC flow is driven by a surface force, while the EMSC flow in this work is driven by a localised volumetric force that leads to different dynamics. In this context, the EMSC flow provides rich dynamics when considering other configurations. This includes factors such as the rotation of the inner and outer spheres, changing the array of the injection of the applied electric current, or even modifying both insulating or conducting boundaries.
5. Concluding remarks
In this work, we investigate the electromagnetically driven magnetised spherical Couette flow of a liquid metal as a working fluid. The mainly azimuthal electromagnetic force is primarily generated by the interaction of a dc current injected at the equatorial region and a dipolar magnetic field. This flow configuration is a modified version of the magnetised Couette flow, which has not been previously reported to the best knowledge of the authors. However, the forcing is electromagnetic and the flow now depends on a larger number of parameters, giving rise to new flow features. Since the experimental setting does not allow optical access to the flow, we make use of the equatorial symmetry for low current flow to fill half the spherical gap to carry out PIV observations. Under the experimental conditions explored, the Reynolds number ranged from 450 to 2230, confirming the laminar flow regime. The large value of the Hartmann number
 $Ha=240$
in the present experiment leads to non-negligible induction effects. The Stuart number
 $N$
ranged from 26 to 128. Furthermore, UDV measurements of the radial velocity component for different polar angles were experimentally obtained. Due to the symmetry of the problem, an analytic solution of the MHD equations in the creeping regime is presented. A three-dimensional numerical modelling was also performed with an in-house developed code. The analytical and numerical velocity profiles are successfully compared qualitatively and quantitatively. The numerical simulations were effectively validated against the experimental observations. Although the investigation addressed in this study is of fundamental nature, we want to highlight the potential use of electromagnetic forcing as an alternative method to induce flows that might be considered relevant in geophysical and astrophysical phenomena.
Acknowledgements
F.G. and R.D. thank Secihti (previously Conahcyt) for the financial support provided through a doctoral and postdoctoral scholarship, respectively. A.F. and S.P. acknowledge the Secihti Investigadoras e Investigadores por México program. The authors thank the material support (UDV apparatus and Galinstan) from S. Cuevas (Instituto de Energías Renovables-Universidad Nacional Autónoma de México). Finally, Dr. J. Olvera-Orozco from olveraeds.com is acknowledged for providing the grammar and style revision of the manuscript.
Funding
This research was supported by Fundación Marcos Moshinsky, México.
Declaration of Interests
The authors report no conflict of interest.
Appendix A Optical aberration due to the spherical geometry
We conducted an analysis using Snell’s law of refraction to estimate the effect of optical aberration on PIV measurements. We focus on the physical model of two concentric spheres, according to the system explored in this work, see figure 1(a). For this analysis, we only consider the
 $x{-}z$
plane and disregard the wall thickness of the outer sphere. When a light source is located above the system, all incident rays striking the outer sphere are refracted by its curved surface, as shown in figure 10(a). Snell’s law connects the incidence and refraction angles, denoted as
 $\varepsilon _1$
and
 $\varepsilon _2$
, respectively, through the following equation:
 \begin{equation} \eta _a \sin (\varepsilon _1)=\eta _p \sin (\varepsilon _2) . \end{equation}
An arbitrary light ray is emitted from a source. In the absence of an external plexiglass sphere, this ray would reach the point
 $x_0$
. However, it reaches
 $x_i$
due to the refraction phenomenon. The distance between these two points can be considered as an optical aberration, which can be calculated as
 \begin{equation} \Delta x = x - x_i = \sqrt {l^2 + x^2 - r_o^2}, \end{equation}
with
 \begin{equation} l(x)=\frac {\sqrt {r_o^2-x^2}}{\cos (\varepsilon _1-\varepsilon _2)}, \quad \; \; \varepsilon _1=\arctan \left (\frac {x}{\sqrt {r_o^2-x^2}}\right ), \end{equation}
and
 $\varepsilon _2$
can be retrieved from (A1). Figure 10(b) shows the theoretical optical aberration as a function of the coordinate
 $x$
. We can observe a maximum aberration (
 ${\sim} 2.3$
cm) near the outer sphere.
(a) Sketch of a light beam (in red) refracting through a plexiglass sphere (in blue). (b) Aberration as a function of the
 $x$
coordinate.



