Introduction
Alzheimer's disease (AD) is characterized by a decline in memory, but also in other cognitive domains, including executive function. Executive dysfunction in AD patients has often been ascribed to brain damage of vascular origin, including white matter changes (Burns et al., Reference Burns2005; Huang et al., Reference Huang, Friedland and Auchus2007). Recently, however, Nagata et al. (Reference Nagata2011) suggested that hippocampal atrophy is associated with executive function in AD. In that study, a reduction in hippocampal volume was associated with reduced inhibition control, regardless of overall atrophy. This finding is in agreement with other reports that reveal specific involvement of the hippocampus in executive function performance in healthy volunteers (Takahashi et al., Reference Takahashi2007; 2008). Similarly, atrophy of the medial temporal lobes has been associated with lower performance on executive tasks in both aging (Oosterman et al., Reference Oosterman2008a; Reference Oosterman2010) and vascular dementia (Bastos-Leite et al., Reference Bastos-Leite, van der Flier, van Straaten, Staekenborg, Scheltens and Barkhof2007). Overall, however, limited attention has been paid to the relationship between hippocampal atrophy and executive function in AD. Since substantial hippocampal atrophy is common in both dementia due to AD and the early stage of mild cognitive impairment (MCI) (Tondelli et al., Reference Tondelli, Wilcock, Nichelli, Jager, Jenkinson and Zamboni2012), this atrophy may be an important correlate of the reduced executive function performance that has been reported in both patient groups (Gainotti et al., Reference Gainotti, Ferraccioli, Vita and Marra2008; Duara et al., Reference Duara2011). In addition, it has been suggested that a specific amount of brain damage must be present before a decline in cognitive test performance can be detected. Such a threshold effect has been previously suggested by Skoog et al. (Reference Skoog, Berg, Johansson, Palmertz and Andreasson1996) who found that cognitive performance in non-demented elderly persons was worse in cases of moderate to severe, but not mild white matter hyperintensities (WMH). Also, Wright et al. (Reference Wright2008) found that performance on tasks of cognitive flexibility and sensorimotor ability was only impaired in individuals with the highest quartile of WMH volume. It has furthermore been suggested that the combination of severe WMH and medial temporal lobe atrophy (MTA) is associated with a substantial decline in cognitive function (van der Flier et al., Reference van der Flier2005).
The goal of the present study was therefore to determine the effect of hippocampal atrophy on executive function performance, to examine whether a threshold effect is present for hippocampal atrophy and WMH and if these neuroimaging variables interact in relation to cognitive performance. We focused on patients with AD (amnestic MCI and dementia) because hippocampal atrophy is one of the core symptoms of this clinical population.
Methods
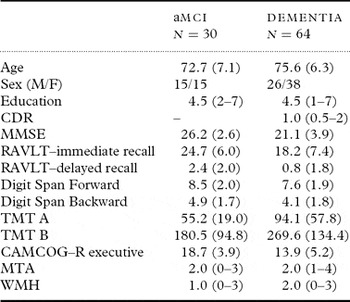
We extracted all patient data from the database of the Outpatient Memory Clinic Department of Geriatric Medicine of the Radboud University Nijmegen Medical Centre, the Netherlands. A total of 94 participants were included (see Table 1) who underwent a thorough clinical interview and extensive neuropsychological and psychiatric screening as well as magnetic resonance imaging (MRI) scanning. Diagnoses were made in accordance with international guidelines for single-domain amnestic MCI (n = 30) and probable dementia (n = 51) due to AD (McKahnn et al., 1984; Petersen, Reference Petersen2004). Patients with incidental vascular changes (Vernooij et al., Reference Vernooij2007) received a diagnosis of possible dementia due to AD (n = 13). Patients who showed signs of vascular or mixed dementia (Erkinjuntti, Reference Erkinjuntti2002) were not included in the present study. Education level was measured with an ordinal rating scale ranging from 1 (less than primary school) to 7 (academic degree). All neuropsychological tests were administered as part of routine clinical assessment and the confidentiality of participants’ identities was maintained throughout the study process. This retrospective study was performed in accordance with the Declaration of Helsinki and the guidelines for Good Clinical Practice established by the International Conference on Harmonization (CPMP/ICH/135/95).
Characteristics of the patients

Means (standard deviations) are reported for age and the neuropsychological test scores of the aMCI and dementia groups. Educational attainment, CDR, MTA, and WMH scores reflect median scores (range) and were rated with ordinal rating scales. Sex represents the frequencies of males and females. aMCI = amnestic mild cognitive impairment; CAMCOG–R = Cambridge Cognitive Examination – revised; CDR = Clinical Dementia Rating; MMSE = Mini-Mental State Examination; MTA = Medial Temporal Lobe Atrophy; RAVLT = Rey Auditory Verbal Learning Test; TMT = Trail Making Test; WMH = White Matter Hyperintensities.
Neuropsychological tests
Executive function
Executive function was assessed with the Trail Making Test, the Digit Span Backward Test, and the executive function subscore of the Cambridge Cognitive Examination – Revised (CAMCOG-R). The Trail Making Test (TMT) is a visual search task, which was employed to assess mental flexibility. The TMT part A consists of 25 encircled numbers that are randomly distributed on a sheet of paper. The participant is required to connect these numbers in ascending order. On the TMT part B, both numbers and letters are spatially distributed. This time, the participant is instructed to alternate between the numbers and letters (e.g. 1, A, 2, B, 3, etc.), requiring participants to switch between different stimuli and to keep track of previously encountered items. Completion time of part B was used.
In the Digit Span Backward task of the Wechsler Adult Intelligence Scale-III, series of digits of increasing length (2–9) are orally presented. Following each presentation, participants are requested to repeat the digits, reversing the order in which they were presented. This test measures the ability to retain information in working memory for a brief period of time and to actively manipulate this information. The total number of correct repetitions was used.
Finally, the executive function subscore of the CAMCOG-R consists of four subtests, namely verbal fluency (produce as many animal names in 1 minute as possible), abstract reasoning (identifying similarity between two words of a pair), ideational fluency (the number of uses of a bottle), and visual reasoning.
Other cognitive functions
General cognitive functioning was estimated with the Mini-Mental State Examination (MMSE). Episodic memory was measured with the Rey Auditory Verbal Learning Test (RAVLT) (Dutch version). This test consists of a list of 15 unrelated words that are presented five times. After each presentation, the participant is requested to repeat as many words as possible. Following a 20-minute delay, the participant is again requested to recall as many words as possible. These immediate and delayed recall scores were taken as measures of episodic memory performance. Short-term memory and attention were assessed with the Digit Span Forward, in which participants have to repeat series of digits in the same order as they were presented. We used the total number of correct repetitions. Finally, processing speed was assessed using the completion time of the TMT part A.
Magnetic resonance imaging
Brain MRIs were obtained with a Siemens (Avento) 1.5T MR scanner. A standardized imaging protocol was used, consisting of whole brain axial and coronal fluid-attenuated inversion recovery (FLAIR) (TR = 9.0 s, TE = 114 ms, 48 axial slices, slice thickness = 3 mm, no gap); high-resolution structural MR images were acquired with a T1-weighted MP-RAGE sequence (TR 2.0 s, TE 2.97 ms, 176 coronal slices, slice thickness = 1 mm, no gap) and structural MR images with a T2-weighted sequence (TR 3.1 s, TE 114 ms, 48 axial slices, slice thickness = 3 mm, no gap).
Medial temporal lobe atrophy, which is indicative of hippocampal atrophy, was rated using a validated 5-point rating scale (Scheltens et al., Reference Scheltens1992), ranging from no (score 0) to very severe (score 4) atrophy. White matter hyperintensities were rated with the Fazekas scale (Fazekas et al., Reference Fazekas, Chawluk, Alavi, Hurtig and Zimmerman1987), which provides a score between 0 (no WMH) and 3 (severe WMH). All ratings were performed by SO; a subset (n = 80) of scans was scored independently by two raters (SO and JMO) with high agreement between both raters (Cohen's κ = 0.78 for the MTA and 0.95 for the WMH ratings).
Statistical analyses
Neuropsychological test scores were z-standardized to enable direct comparison between the different tests. Kruskal–Wallis tests were performed to examine whether the MTA and WMH groups differed with regard to educational level. This is important since education may enhance cognitive reserve and thus obscure the relation between atrophy and performance.
Univariate analyses of variance (ANOVAs) were performed with each individual neuropsychological test score as the dependent variable, and MTA and WMH as separate independent variables. Previous studies have often dichotomized MTA and WMH scores into no/mild MTA (score 0/1) and severe MTA (score ≥ 2) (e.g. Gouw et al., Reference Gouw2006; Bastos-Leite et al., Reference Bastos-Leite, van der Flier, van Straaten, Staekenborg, Scheltens and Barkhof2007) and into mild/moderate WMH (score 1/2) and severe WMH (score 3) (e.g. van der Flier et al., Reference van der Flier2005). To determine a potential threshold effect, all separate MTA and WMH scores were retained in the current analyses. In all instances the assumption of homogeneity of variance was ascertained. Repeated contrasts were employed to determine the precise effect of an increase in MTA or WMH on cognitive task performance. In all analyses the p-value for significance was set at 0.05. A trend was denoted at p ≤ 0.07. Testing was performed one-tailed.
To examine the interaction between WMH and MTA, hierarchical regression analyses were performed with each neuropsychological test score as the dependent outcome variable. Main effects of WMH and MTA were entered as the first model; the interaction term was entered as the second model. WMH and MTA were centered around the mean to avoid multicollinearity between the predictors.
Results
Table 1 presents the characteristics, mean neuropsychological test performance, and median MTA and WMH scores of all patients. Clinical dementia rating (CDR) scores were available for all except two dementia patients. Based on the available CDR scores, overall the dementia patients could be classified as having mild dementia. Only two patients obtained an indication of moderate dementia (CDR score of 2); none of the dementia patients had a CDR score of 3, indicating severe dementia. Four aMCI and 19 dementia patients could not complete the TMT-B, resulting in missing data for this variable. χ2 test revealed that the frequency of a missing TMT-B score did not differ significantly between the aMCI and dementia group (χ2 (1) = 2.96, p = 0.12). In addition, for 9 aMCI and 21 dementia patients no CAMCOG-R executive function score was available. Again, a χ2 test indicated that the frequency of occurrence did not differ between both groups (χ2 (1) = 0.07, p = 0.79). χ2 test furthermore revealed that a missing TMT-B score was not associated with either WMH (χ2 (2) = 0.94, p = 0.63) or MTA (χ2 (3) = 0.51, p = 0.92). WMH and MTA were also not associated with missing CAMCOG-R scores (respectively χ2 (2) = 0.01, p = 1.0, and χ2 (3) = 3.44, p = 0.33).
Main effects of MTA
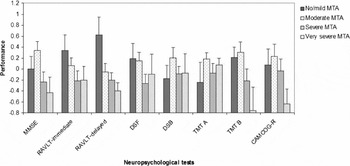
With regard to the degree of MTA, only three participants had a score of 0. For the ANOVAs, we therefore unified those participants with the participants who had a score of 1, together representing no/mild MTA (e.g. Gouw et al., Reference Gouw2006). No/mild atrophy was observed in 20 patients, moderate atrophy (score 2) in 35, severe atrophy (score 3) in 29 and very severe atrophy (score 4) in 10 patients. Performance of these groups is presented in Figure 1. Kruskal–Wallis testing revealed that the MTA groups differed significantly with regard to educational level (H(3) = 13.61, p < 0.01). Since education revealed significant interactions with MTA for all neuropsychological test scores, it is inappropriate to use education as a covariate. The ANOVAs for MTA were therefore performed twice, once while including all patients and once for a selection of patients with a comparable educational level.
Neuropsychological test performance stratified by MTA-score. Scores represent standardized scores (z-scores). A higher score represents better performance. CAMCOG-R: Cambridge Cognitive Examination-revised; DSB: Digit Span Backward; DSF: Digit Span Forward; MMSE: Mini-Mental State Examination; MTA: Medial Temporal Lobe Atrophy; RAVLT: Rey Auditory Verbal Learning Test; TMT: Trail Making Test.

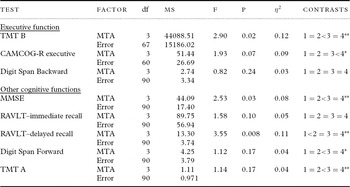
Results of the ANOVAs are presented in Table 2. A significant effect of MTA was found for TMT-B performance and a marginally significant effect was found for the CAMCOG-R executive score, indicating that performance differences are present between the different MTA groups. Repeated contrasts revealed that on the TMT-B test the severe MTA atrophy group performed worse than the moderate atrophy group; a marginally significant worse performance on the CAMCOG-R executive test was found in the very severe compared to the severe atrophy group. Finally, no significant effect of MTA was found for the Digit Span Backward test.
Results of the ANOVAs with medial temporal lobe atrophy as independent variable

Contrasts represent repeated contrasts. CAMCOG-R = Cambridge Cognitive Examination-revised; MMSE = Mini-Mental State Examination; MTA = Medial Temporal Lobe Atrophy; MS = mean square; RAVLT = Rey Auditory Verbal Learning Test; TMT = Trail Making Test.
* p ≤ 0.07
** p < 0.05
The effect of MTA was also significant for the MMSE and the RAVLT-delayed recall, which indicates that performance on these tests differs according to the severity of MTA. Repeated contrasts revealed significantly worse MMSE performance in the severe compared to the moderate atrophy group; performance on the RAVLT-delayed recall test was worse in the moderate atrophy group compared to the no/mild atrophy group. No significant effects of MTA were found for the RAVLT-immediate recall, the Digit Span Forward test and the TMT-A (using the inverse normalized TMT-A score, to ascertain the homogeneity of variance assumption). Repeated contrasts did reveal a trend reflecting worse Digit Span Forward performance in the severe compared to the moderate MTA group. In addition, the severe MTA group performed worse on the TMT-A than the moderate atrophy group.
The effect of MTA was most pronounced for the RAVLT-delayed recall. To examine whether the relationship between MTA and the TMT-B merely reflects an underlying effect of memory decline, an additional ANOVA was run with the TMT-B as dependent variable, MTA as between-subject factor, and the RAVLT-delayed recall as covariate. A significant effect of MTA was found (F(3,66) = 2.63, p < 0.05, η2 = 0.11), with significantly better performance of the moderate MTA group compared to the severe MTA group (p < 0.05). This indicates that the effect of MTA on TMT-B performance extends beyond a mere decline in memory performance.
Matching for education level
Inspection of the educational level of our groups revealed a higher educational level in the moderate MTA group (mean = 5.0, median = 5.0, range 1–7) compared to the no/mild atrophy (mean = 3.55, median = 4.0, range 1–7), whereas the severe atrophy group (mean = 3.9, median = 4.0, range 1–7) and very severe atrophy group (mean = 4.6, median = 4.5, range 1–7) fell somewhere in between. To match the different atrophy groups with respect to educational level, we randomly removed patients with a high educational level (i.e. score 6 or 7) from the moderate MTA group and patients with a low educational score (score 1 or 2) from the no/mild MTA group. This resulted in 15 patients with no/mild atrophy, 30 patients with moderate atrophy, 29 patients with severe, and 10 with very severe atrophy who did not differ with regard to educational level (H(3) = 5.83, p = 0.12).
Overall, the results of the ANOVAs were comparable to previous findings on the executive function tests. A significant effect was found for the TMT-B (F(3,59) = 2.42, p < 0.05, η2 = 0.11) and for the CAMCOG-R executive score (F(3,52) = 2.44, p < 0.05, η2 = 0.12), indicating performance differences are present between the different MTA groups. Most important of all, the significant difference between the moderate and severe atrophy group was retained for the TMT-B (p < 0.05) and the near significant difference between the severe and very severe atrophy group was also still present for the CAMCOG-R executive score (p = 0.055). The effect for the Digit Span Backward was not significant (F(3,80) = 0.17, p = 0.46, η2 = 0.01).
The results overall were also in line with previous findings for the other cognitive tests. The effect of MTA was no longer significant for the MMSE (F(3,80) = 1.81, p = 0.076, η2 = 0.06), but the significantly lower performance in the severe compared to the moderate atrophy group was retained (p < 0.05). The effect of MTA was significant for the RAVLT-delayed recall (F(3,80) = 3.00, p < 0.05, η2 = 0.10), with a significant difference between the no/mild and moderate atrophy groups (p < 0.05). The effect of MTA was non-significant for the RAVLT-immediate recall (F(3,80) = 1.72, p = 0.08, η2 = 0.06), the Digit Span Forward (F(3,80) = 1.21, p = 0.16, η2 = 0.04) and the TMT-A (F(3,80) = 0.45, p = 0.36, η2 = 0.02). Also, no significant differences between the individual MTA groups were found with respect to any of these latter neuropsychological test scores.
Main effects of WMH
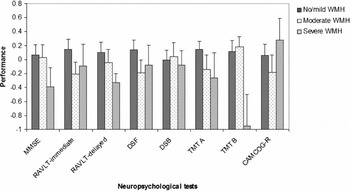
Only five patients obtained a WMH-score of 0; we therefore created a new group that consisted of these patients combined with those who had a WMH-score of 1, reflecting no/mild WMH. No/mild WMH was observed in 50 patients, moderate WMH in 31, and severe WMH in 13 patients. These groups did not differ with regard to educational level (H(2) = 0.12, p = 0.94). Performance of these groups is presented in Figure 2. A significant effect of WMH was found for the TMT-B (F(2,68) = 3.33, p < 0.05, η2 = 0.09). Repeated contrasts revealed that the severe WMH group performed significantly worse than the moderate WMH group (p < 0.01). No significant effects were found for the Digit Span Backward (F(2,91) = 0.06, p = 0.48, η2 = 0.00), the CAMCOG-R executive function score (F(2,61) = 0.87, p = 0.21, η2 = 0.03), the MMSE (F(2,91) = 0.80, p = 0.22, η2 = 0.02), the Digit Span Forward (F(2,91) = 1.12, p = 0.17, η2 = 0.02), the RAVLT-immediate (F(2,91) = 1.24, p = 0.15, η2 = 0.03) and delayed recall measures (F(2,91) = 0.63, p = 0.27, η2 = 0.01), and the TMT-A (F(2,91) = 0.99, p = 0.19, η2 = 0.02). Repeated contrasts revealed a single trend (p = 0.06) for the RAVLT-immediate recall measure, where the moderate WMH group performed marginally worse than the no/mild group. Overall, these results indicate that cognitive performance is not associated with the severity of WMH, with the exception of TMT-B performance.
Neuropsychological test performance stratified by WMH-score. Scores represent standardized scores (z-scores). A higher score represents better performance. CAMCOG-R = Cambridge Cognitive Examination-revised executive score; DSB = Digit Span Backward; DSF = Digit Span Forward; MMSE = Mini-Mental State Examination; RAVLT = Rey Auditory Verbal Learning Test; TMT = Trail Making Test; WMH = White Matter Hyperintensities.

Interaction between MTA and WMH
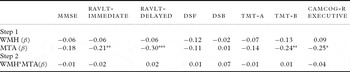
Inverse normalization was applied to the TMT-A, TMT-B, the Digit Span forward and backward scores, and the RAVLT-delayed recall score. Results of the regression analyses are presented in Table 3. Significant main effects of MTA were found for the TMT-B, the RAVLT-immediate and delayed recall scores, and marginally the CAMCOG-R executive score. The main effects of WMH and the interaction effects of WMH and MTA were not significant for any of the neuropsychological tests.
Interaction between WMH and MTA for the different neuropsychological test

A higher cognitive test score represents better performance. The standardized beta coefficients represent the values of the final model. CAMCOG-R = Cambridge Cognitive Examination-revised executive score. DSB = Digit Span Backward; DSF = Digit Span Forward; MMSE = Mini-Mental State Examination; MTA = medial temporal lobe atrophy; RAVLT = Rey Auditory Verbal Learning Test; TMT = Trail Making Test; WMH = White Matter Hyperintensities.
*p ≤ 0.07, ** p ≤ 0.05, ** p < 0.01.
Discussion
The present study focused on the relationship between hippocampal atrophy and executive functions and potential threshold effects of hippocampal atrophy and WMH. In line with previous studies, we found that hippocampal atrophy is associated with lower executive test performance (Oosterman et al., Reference Oosterman, van Harten, Weinstein, Scheltens, Sergeant and Scherder2008a; 2010; Nagata et al., Reference Nagata2011). In our study, significant threshold effects of MTA were present for the TMT-B and the CAMCOG-R executive score, indicating that severe to very severe hippocampal atrophy was associated with lower executive performance. In addition, (near) significant threshold effects were also found for the RAVLT-delayed recall, the MMSE, the Digit Span Forward test, and the TMT-A. A threshold effect of WMH was only present for the TMT-B, but not any of the other cognitive tests.
Nagata and co-workers (2011) recently explored the relationship between hippocampal atrophy and various executive function tests in a sample that is highly comparable to ours. They used the Frontal Assessment Battery, which contains six different executive function tasks, and found an association between hippocampal atrophy and inhibition, but not the other five tasks of this battery. We extend their findings by showing an association with a task of flexibility and a compound executive function score.
Although several studies have shown an association between the hippocampus and executive functions, the precise role of this brain structure in executive function performance remains unclear. One possibility is that integrity of the hippocampi is very important for pre-frontal cortex (PFC) functioning. This is confirmed by studies showing that hippocampal functioning influences PFC functioning (Tierney et al., Reference Tierney, Dégenètais, Thierry, Glowinski and Gioanni2004; Anderson et al., Reference Anderson, Rajagovindan, Ghacibeh, Meador and Ding2010) and by studies showing that functioning of the hippocampi is directly related to executive function performance (Takahashi et al., Reference Takahashi2007, Reference Takahashi2008). This implies that hippocampal atrophy negatively affects PFC functioning. In addition, hippocampal atrophy may disrupt pre-frontal functioning by altering frontal-posterior connectivity. Collette et al. (Reference Collette, Van der Linden, Delrue and Salmon2002) examined AD patients with and without frontal hypometabolism and concluded that frontal hypometabolism was not a prerequisite for lower executive function performance. They suggested that disconnection of the frontal and posterior brain regions, instead of frontal pathology per se, was sufficient for executive dysfunction to occur. Also, most executive function tasks additionally rely on intact memory functions (Philips et al., 1999; Oosterman et al., Reference Oosterman2010) and memory decline may be an important correlate of executive function performance in AD (Baudic et al., Reference Baudic, Barba, Thibaudet, Smagghe, Remy and Traykov2006). The relationship between hippocampal atrophy and executive functions may therefore be mediated by memory deficits, although in the present study the association between MTA and the TMT-B was not altered after controlling for memory performance. Further studies are needed to clarify the precise mechanisms that underlie the relationship between hippocampal atrophy and executive function.
An alternative explanation is that the relationship between executive function and hippocampal atrophy merely reflects underlying general cortical and subcortical brain dysfunction. This could potentially explain the current findings, especially since the effects of hippocampal atrophy were significant only in case of severe atrophy. On the other hand, not all cognitive test scores were associated with hippocampal atrophy. If it were merely the effect of widespread brain damage instead of a specific effect of hippocampal neurodegeneration, one would have expected severe hippocampal atrophy to be associated with lower performance on all cognitive tests. In addition, there were barely any associations between WMH and the cognitive tests, and the interaction between MTA and WMH was not significantly related to any of the cognitive function tests. Again, if the effect of hippocampal atrophy merely reflects underlying widespread brain damage, then a sensible prediction is that severe WMH and the combination of severe WMH and MTA should also be associated with lower cognitive task performance. A previous study furthermore found that the relationship between executive function and hippocampal atrophy persisted after controlling for other changes in brain structure, such as global atrophy and silent infarcts, confirming the unique association between hippocampal atrophy and executive function (Oosterman et al., Reference Oosterman2010). In the study of Nagata and co-workers (2011), the relationship between inhibition and hippocampal atrophy was also independent of global atrophy. Taken together, our findings point to a unique association between hippocampal atrophy and executive function. Such a conclusion remains speculative, however, and further studies are needed that control for global atrophy.
In the present study, WMH were only associated with TMT-B performance, but not significantly with other executive (or cognitive) tests. This is in contrast to other studies that did report such an association (e.g. Burns et al., Reference Burns2005; Huang et al., Reference Huang, Friedland and Auchus2007). One possible explanation is that the executive function tests we employed were not sensitive enough to detect white matter-associated cognitive decline. This may be particularly the case for the Digit Span Backward (Oosterman et al., Reference Oosterman, van Harten, Weinstein, Scheltens, Sergeant and Scherder2008b). Our findings are, however, in agreement with other studies that also failed to find significant associations between WMH and executive, or general, cognitive function (e.g. Mungas et al., Reference Mungas2005). Alternatively, the visual rating scale that was employed only covers four different levels of WMH severity and may therefore lack sensitivity to detect minor changes in white matter integrity that can be visualized with techniques such as diffusion tensor imaging (Burgmans et al., Reference Burgmans2010). Nonetheless, these rating scales may reveal WMH-cognition associations comparable to those obtained with more complex WMH ratings and with volumetric assessments of WMH (Gouw et al., Reference Gouw2006). MTA was also rated with a visual rating scale, a scale that was apparently sensitive enough to detect changes in cognitive function. In addition, this scale may be equally (Westman et al., Reference Westman2011), or even more (Wahlund et al., Reference Wahlund, Julin, Johansson and Scheltens2000), sensitive compared to volumetric measurement of MTA. Despite this strong overlap between visual and volumetric ratings of brain abnormalities, there is a need for replication of the current results with volumetric assessments, preferably including measures of structural integrity (DTI).
One critical note that should be made is that, overall, the effect of MTA on executive function was moderate. No effect on the Digit Span Backward was noted and the effect of MTA on the other executive function tests was only noticeable at a severe level. On the other hand, the RAVLT-delayed recall test was the only test on which we found an effect of moderate MTA. The findings are further in line with findings on other cognitive tests, where also a significant effect of severe, but not moderate, MTA was found. Apparently, in our sample, the effect of MTA on cognition is more pronounced at a high level of atrophy.
To summarize, the present study indicates that MTA is associated with executive function in pathological aging. There appears to be a threshold effect, in which particularly severe MTA is associated with lower executive task performance.
Conflict of interest
None.
Description of authors' roles
SO, JMO, and RPCK designed the study, JMO and RPCK supervised the data collection, and JMO wrote the paper and was responsible for the statistical design of the study and for carrying out the statistical analysis. JC supervised data entry, monitored diagnostic accuracy in the memory clinic database, and instructed the visual MRI rating. SO, MGOR, and JC collected the data and assisted with writing the paper.