Since the first documented case of sickle cell disease in 1910 by Dr James B. Herrick,Reference James 1 sickle cell disease was found to be an autosomal recessive disorder caused by β-globin gene mutation, and one of the most common genetic disorders worldwide. Sickle cell anaemia and the sickle gene are prevalent mostly in Africa but also in North America as well as in the Caribbean, Latin America, India, and the Mediterranean region. Although haemoglobin SS homozygosity represents the most frequent genetic cause for sickle cell disease, compound heterozygosity for haemoglobin S and haemoglobin C, β-thalassaemia, and other rare variants also lead to sickle cell disease phenotypes of various severity.Reference Pearson 2
The sickle haemoglobin has the unique property to polymerise within red blood cells, causing their deformation and increased fragility, which leads to haemolysis and acute and chronic organ damage.Reference Pearson 2 , Reference Driscoll 3 Vaso-occlusive crises, the most common acute events in patients with sickle cell disease, are the result of small vessel blockage by deformed red blood cells as well as increased reticulocyte adhesiveness to the endothelium.Reference Driscoll 3 Vaso-occlusion may cause acute chest syndrome when the vasculature of the lungs is involved. Patients may also suffer from strokes as a result of cerebral vasculopathy. Severe anaemia increases cardiac output and stroke volume, thus altering preload and afterload. Sickle cell disease also impacts cardiac function,Reference Denenberg, Criner, Jones and Spann 4 leading to dilated cardiac cavities with septal hypertrophy and preserved contractility.Reference Covitz, Espeland, Gallagher, Hellenbrand, Leff and Talner 5 In addition, sickle cell disease patients are at increased risk for myocardial infarctions when the coronary circulation is involved.Reference Pannu, Zhang, Andraws, Armani, Patel and Mancusi-Ungaro 6
According to these risks, patients with sickle cell disease should be monitored from the cardiovascular perspective. In particular, those with recurrent acute chest syndrome and vaso-occlusive crises might be at increased risk for myocardial infarction.Reference Pannu, Zhang, Andraws, Armani, Patel and Mancusi-Ungaro 6 Other factors such as electrocardiogram anomalies and abnormal tissue Doppler parameters on echocardiography were separately studied from single haematological factors such as haemoglobin level, reticulocyte count, or myocardial iron deposition.Reference Hankins, McCarville and Hillenbrand 7 , Reference Naoman, Nouraie and Castro 8
In this study, we sought to correlate haematological indices reflecting the severity of sickle cell disease – haemoglobin, aspartate aminotransferase, reticulocytosis, bilirubin, and lactate dehydrogenase – with echocardiography parameters in a series of children with varying severity of sickle cell disease. The aim of this study was to describe the extent of myocardial anomalies and to determine the haematological indices that would mostly impact cardiac function in these patients.
Methods
This retrospective chart review of sickle cell disease children followed-up at Centre Hospitalier et Universitaire Ste-Justine was approved by the institutional review board. According to our institutional policy, all patients with sickle cell disease undergo systematic echocardiography follow-up. We included sickle cell disease patients who were free of vascular crises for at least 6 months before the echocardiography study and had not been transfused in the preceding 3 months. All included subjects may have at least one digitally stored echocardiograph performed between 2005 and 2011. All studies were performed remotely from any eventual vaso-occlusive crisis.
Echocardiography studies were reviewed and measured by a single experienced echocardiographer blinded to the clinical status and biological data of the study subjects. The following measurements were evaluated: diastolic left ventricle diameter, diastolic right ventricle diameter, and left ventricle mass. These parameters were calculated on M mode from the parasternal long-axis of the left ventricle, with the cursor at the tip of the mitral valve and perpendicular to the interventricular septum. Cardiac chamber Z-scores were calculated on the basis of published regression equations.Reference Kampmann, Wiethoff and Wenzel 9 The left ventricular myocardial performance index was calculated from mitral and aortic pulsed Doppler acquired sequentially. Left ventricle free wall E/E’ ratio – ratio of mitral early velocity to early diastolic mitral annulus velocity – which is an indicator for ventricular filling pressure – was calculated from the tissue Doppler recorded at the lateral part of the mitral annulus. To compensate for age-related growth and variation, the left ventricle, right ventricle, left ventricle mass, and left ventricle shortening fraction were normalised according to published Z-score equations.Reference Kampmann, Wiethoff and Wenzel 9 , Reference Foster, Mackie, Mitsnefes, Ali, Mamber and Colan 10 Myocardial performance indexReference Tei, Ling and Hodge 11 and E/E’Reference Mori, Hayabuchi, Kuroda, Nii and Manabe 12 were categorised as normal or abnormal according to known limits for children. Cardiac parameters were correlated with haematological factors: Hb<5th percentile per gender and age, lactate dehydrogenase>400 IU/L, aspartate aminotransferase>30 IU/L, total bilirubin>18 mM/L, reticulocyte count>120×109/L, and microcytosis defined as mean corpuscular volume<80 fl. The effect of hydroxyurea therapy – for more than 1 year – was assessed in comparison with those who were not on such therapy.
Statistical analyses
Continuous data are expressed as mean±SD, and categorical data are expressed as percentages. The Student’s t-test was introduced to compare continuous data in case of a normal distribution; otherwise, it was substituted by the Mann–Whitney U-test, a non-parametric test. Analysis of variance was used for multi-group comparison of continuous data. The receiver operator characteristics analysis was performed, and the area under the curve was determined to correlate the incidence of cardiac chamber dilatation (Z-score>2.0) as well as other abnormal echocardiography findings with various haematological parameters. Subsequently, multinomial regression analyses were performed for best subset correlation between cardiac outcome and haematological parameters. A p value of <0.05 was considered to be statistically significant.
Results
From a total of 112 patients on whom echocardiograms were performed and digitally stored, two were excluded because of incomplete data. The final cohort of 110 patients were 12.14±5.26 years old (13.6%<5 years, 25.4% 5–12 years, and 61% >12 years) at the time of inclusion – 65% homozygotes for haemoglobin SS, 29% compound heterozygotes for haemoglobin SC, and 5% compound heterozygotes for haemoglobin S/β-thalassaemia. The haemoglobin level was 84.37±15.88 for haemoglobin SS, 110.90±13.26 for haemoglobin SC (p<0.001), and 93.8±25.06 for haemoglobin S/β-thalassaemia (n=6). Gender distribution was 51.8% male and 48.2% female. The basic characteristic distribution based on haemoglobin phenotype is summarised in Table 1. From a therapeutic perspective, 23 patients had been on hydroxyurea therapy for at least 12 months at the time of the echocardiogram, including 21 (91.3%) of them with the haemoglobin SS genotype.
Subject distribution and characteristics based on haemoglobinopathy.

β-thal=β-thalassaemia; BSA=body surface area; Hb=haemoglobin
* Comparison between all three Hb phenotypes: HbSS, HbSC and Hb-β-thal
** Comparison between HbSS and HbSC phenotypes
Right ventricular dilatation was predominantly present (61.5%) compared with left ventricular dilatation (42.9%) (p=0.01), irrespective of haemoglobin SS or haemoglobin SC genotype (Table 2). Nevertheless, haemoglobin SS was more often associated with a combined right ventricular dilatation and left ventricular dilatation, as such an association was recorded in 38.9% of patients with haemoglobin SS compared with 12.5% of those with haemoglobin SC (p=0.007). There was no statistically significant correlation between left ventricle diastolic dysfunction (high E/E’) and right ventricle dilatation status, neither in haemoglobin SS (Fisher’s exact test: p=0.594) nor in haemoglobin SC (Fisher’s exact test: p=1.000) subgroups.
Prevalence of cardiac chamber dilatation according to haemoglobin (Hb).

CI=confidence interval; LV=left ventricle; N/A=not applicable; OR=odds ratio; RV=right ventricle
* Comparison between HbSS and HbSC
†p=0.01 versus LV dilatation
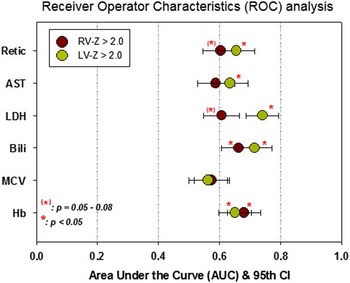
Multinomial regression analyses demonstrated a significant correlation between low haemoglobinaemia (p=0.002) and high bilirubinemia (p=0.005), on the one hand, and right ventricle dilatation, whereas high lactate dehydrogenase and high reticulocyte count yielded a trend association with right ventricular dilatation without reaching statistical significance (p=0.067 and 0.076, respectively). The remaining haematological parameters including microcytosis and high aspartate aminotransferase yielded no significant association with right ventricular dilatation (p=0.208 and 0.131). According to the receiver operator characteristics analysis, biventricular dilatation highly correlated with low haemoglobin (area under the curve 0.732±0.048; p<0.001), as well as high bilirubin levels (area under the curve 0.713±0.005; p<0.001). Detailed area under the curve values in accordance with right ventricular or left ventricular dilatation are displayed in Figure 1.
Summary of area under the curve (AUC) results from ROC analysis of right ventricle (RV) and left ventricle (LV) dilatation (Z-score<2.0) in accordance with abnormal hematological parameters.

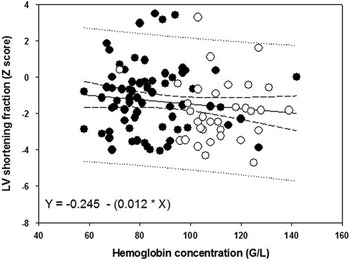
From the myocardial function perspective, all patients had a normal myocardial performance index, whereas 31.4% had an altered diastolic compliance (high E/E’). Although there was an apparent trend towards a higher proportion of dysfunctions in haemoglobin SS, the observation did not reach statistical significance compared with haemoglobin SC (Table 3). Left ventricular systolic function, measured shortening fraction on M-mode imaging, was low (Z-score<−2.0) in 38.1% (Table 3), with no statistical significance based on the genotype – fractional shortening Z-score of −1.18±1.83 in haemoglobin SS versus −1.83±1.76 in haemoglobin SC; p=0.089. In fact, shortening fraction of the left ventricle was inversely proportional to the haemoglobin level (Fig 2), suggesting a compensatory mechanism to anaemia. In addition, a near-zero slope suggests little effect of the degree of anaemia or the causal relationship with the type of haemoglobin – haemoglobin SS versus haemoglobin SC. Instead, a high reticulocyte count and a low haemoglobin level were significantly associated with a diastolic myocardial dysfunction (p=0.004 and 0.006, respectively).
Left ventricle shortening fraction is relatively higher with lower hemoglobin level. Dark circles represents HbSS, white circles represent HbSC.

Prevalence of left myocardial dysfunction as measured by left ventricle (LV) shortening fraction (SF) and E/E’ (Z-score>2.0), according to haemoglobin (Hb) phenotype; a higher trend for HbSS to increase the risk of LV dysfunction than HbSC was observed.

CI=confidence interval; LV=left ventricle; N/A=not applicable; OR=odds ratio
* Comparison between HbSS and HbSC
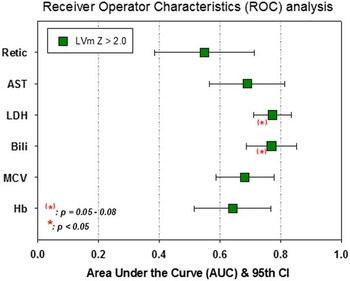
According to the haemoglobin genotype, only haemoglobin SS was associated with abnormal left ventricular mass (Table 4), whereas 25% with haemoglobin SS had high left ventricular mass versus 0% in patients with haemoglobin SC (p=0.001). On the basis of the receiver operator characteristics analysis (Fig 3), haematological parameters yielded no significant association with high left ventricle mass, despite an apparent trend for high bilirubin and high lactate dehydrogenase. The effect of hydroxyurea therapy in haemoglobin SS patients was further analysed. Accordingly, there was no statistical difference between treated and untreated patients in terms of anthropometric characteristics, haemoglobin levels, and bilirubin, lactate dehydrogenase, or aspartate aminotransferase serum concentrations at the time of the study. In contrast, the mean corpuscular volume of red blood cells was higher (89.8±11.5 versus 80.1±8.3 fl; p<0.001) and the reticulocyte count was lower (140.2±86.8×10⁹ versus 277.4±110.1×10⁹/L; p<0.001) in hydroxyurea-treated patients. This translates into a higher prevalence of macrocytosis (38.1 versus 9.8%; p=0.015) and a lower prevalence of elevated reticulocytosis (52.4 versus 92.2%; p<0.001) in patients under hydroxyurea therapy. The mean duration of hydroxyurea therapy before echocardiographic assessment was 4.44±2.75 years. From the cardiac impact perspective, hydroxyurea therapy in haemoglobin SS patients did not affect the right ventricle size, the left ventricle size, or the left ventricle mass (p=not significant). On the other hand, ventricular diastolic function parameters were significantly different based on hydroxyurea therapy: myocardial performance index 0.33±0.12 (untreated) versus 0.27±0.08 (treated), p=0.027, and E/E’ 6.99±1.89 (untreated) versus 5.99±1.36 (treated), p=0.040. Only the prevalence of elevated E/E’ ratio was statistically lower in treated patients (15.8 versus 53.6%; p=0.014). Hydroxyurea had no effect on left ventricular systolic function, neither as a group (left ventricle shortening fraction Z-score −1.52±1.55 versus −1.03±1.93; p=0.310) nor in terms of the prevalence of depressed shortening fraction (34.8 versus 39.1%; p=0.811).
Summary of area under the curve (AUC) results from ROC analysis pertaining to left ventricle mass (LVm) hypertrophy (Z-score>2.0) in accordance with abnormal hematological parameters.

Prevalence of left ventricular mass abnormality according to haemoglobin (Hb) phenotype (thalassaemia trait excluded).

abN=abnormal; CI=confidence interval; LV=left ventricle; N/A=not applicable; OR=odds ratio
* Comparison between HbSS and HbSC
Discussion
Our study evaluated cardiac function in patients with sickle cell anaemia. We found a significant proportion of low left ventricular systolic function, without significant difference based on haemoglobin genotypes. We adjusted shortening fraction to subjects’ age, which yielded a new finding compared with previous studies,Reference Ghaderian, Keikhaei, Heidari, Salehi and Azizi Malamiri 13 , Reference Abdul-Mohsen 14 where such an adjustment was not performed. The reverse proportional relationship between left ventricular systolic function and haemoglobin level in our series suggests a compensatory mechanism in sickle cell disease relative to the degree of anaemia. These findings, however, do not reflect myocardial contractility during vaso-occlusive crises as none of our patients was in such a condition during the study.
Myocardial performance index, which is a composite index of systolic and diastolic interaction, was normal in our series. The prevalence of left ventricular diastolic dysfunction, as reflected by an elevated E/E’, actually underlines a reduced ventricular compliance. High E/E’ is in part an evidence of increased ventricular filling, due to anaemia, and reduced diastolic function. As an early marker of cardiac involvement, diastolic dysfunction precedes the onset of congestive heart failure and is frequently found in children with sickle cell anaemia.Reference Zilberman, Du, Das and Sarnaik 15 , Reference Lamers, Ensing and Pignatelli 16 The exact mechanistic pathways of left ventricle diastolic dysfunction are still uncertain. In the adult, such dysfunction seems to be mainly due to the recurrent myocardial damage from vascular vaso-occlusive disease and iron overload,Reference Sachdev, Machado and Shizukuda 17 but not apparently so in children according to a recent magnetic resonance study.Reference Hankins, McCarville and Hillenbrand 7 Our findings represent early diastolic involvement during childhood, and warrant longitudinal validation to link the two observations together.
From another perspective, left ventricular diameter and myocardial mass were increased. These findings reflect the volume overload on the one hand and cardiac muscular remodelling on the other in chronic anaemia – the latter being a myocardial training with increased cardiac output facing low haemoglobin level. The role of chronic anaemia is demonstrated in our series by the significant relationship between haematological parameters of chronic anaemia and left ventricular dilation.
Previous reports have focussed on the left ventricle, the main systemic ventricle, underestimating the role of the right ventricle in general, and the potential interaction between the right ventricle and the lungs, the latter being affected in sickle cell anaemia patients who suffer from acute chest syndrome. Indeed, the degree of left ventricular dilatation is closely linked to the degree of anaemia, as decreasing levels of haemoglobin correlate with increased interventricular septal thickness, dilated left ventricle, and a general increase in ventricular mass.Reference Lester, Sodt, Hutcheon and Arcilla 18 Chronically anaemic patients are known to compensate for a reduced oxygen transport to the peripheral tissues by increasing stroke volume and heart rate, and subsequently their cardiac output.Reference Varat, Adolph and Fowler 19 To increase stroke volume without altering left ventricular compliance and to maintain normal filling pressure, the left ventricle increases in size.Reference Gerry, Baird and Fortuin 20 The myocardial performance index, an echocardiographic index used for assessing a combined systolic and diastolic function of the heart, was best predicted by the degree of anaemia, reticulocytosis, and high lactate dehydrogenase and aspartate aminotransferase,Reference Batra, Acherman and Wong 21 strengthening the hypothesis that severe haemolytic anaemia triggers adaptive mechanisms in the myocardium. Screening indices of severe and recurrent haemolytic anaemia – abnormal haemoglobin, aspartate aminotransferase, lactate dehydrogenase, reticulocytes and bilirubin – should prompt health professionals to adjust therapy, thus preventing avoidable cardiac consequences. In addition, although hydroxyurea therapy did not affect the prevalence of ventricular dilatation or systolic function, a measurable benefit was observed in terms of preservation of a better diastolic function. Whether this could be attributable to the reported effect of hydroxyurea on myocardial perfusion improvementReference de Montalembert, Maunoury, Acar, Brousse, Sidi and Lenoir 22 remains to be defined.
Right ventricular dilatation is less often reported in sickle cell anaemia, the causes of which remain obscure.Reference Gladwin and Sachdev 23 Haemolytic anaemia is thought to cause pulmonary vasculopathy as well as pulmonary hypertension through a mechanism that blocks nitric oxide and leads to vasoconstriction.Reference Gladwin, Barst and Castro 24 , Reference Doherty, Doyle and Curry 25 A patient screening in the Walk-PHASST cohort (Walk-Treatment of Pulmonary Hypertension and Sickle Cell Disease Sildenafil Therapy),Reference Machado, Barst and Yovetich 26 as well as other screenings,Reference Parent, Bachir and Inamo 27 , Reference Gladwin and Vichinsky 28 showed a strong link between indices of haemolytic anaemia, high N-terminal pro-brain natriuretic peptide, abnormal walk test, and increased Doppler echocardiographic estimates of pulmonary artery systolic pressures. Furthermore, pulmonary hypertension leads to right ventricular dilatation and hypertrophy.Reference Hemnes and Kawut 29 Although our data do not allow us to make any assumption of this nature, further studies assessing pulmonary artery pressure should be taken into consideration. Future prospective studies should also include tricuspid valve regurgitant velocity, and N-terminal pro-brain natriuretic peptide serum levels as they may be markers of right ventricular pressure and strain.Reference Gladwin and Sachdev 23 , Reference Gladwin and Vichinsky 28 Advanced pulmonary hypertension is well correlated to right ventricle dilation,Reference Ryan and Archer 30 , Reference Jone, Hinzman, Wagner, Ivy and Younoszai 31 which was more prevalent in our series compared with left ventricular diastolic dysfunction (high E/E’). This suggests that the left ventricular diastolic impairment was not the culprit for the observed right ventricular dilatation. The predominant right ventricular findings shed a new light from a physiopathological perspective. Determining a relation between right ventricular dilatation and pulmonary hypertension in sickle cell anaemia may now be narrowed down to cases with stigmata of severe haemolytic anaemia when a right ventricular dilatation is present.
There are limitations inherent to the retrospective aspect of this study. Although echocardiography measurements are typically operator dependent, they were performed by a single experienced sonographer blinded to the clinical and biological status of the study subjects. In addition, right ventricular functional data and estimates of the right ventricle and pulmonary pressure could not be assessed properly. In the light of our findings, we now plan a prospective study in this direction. Finally, the right ventricle dilatation we report in this cohort has not been validated with MRI, the currently accepted gold standard.
In conclusion, sickle cell anaemia, which is known to impact the left ventricle, similar to other chronic anaemic states, particularly affects the right ventricle. Our study found that left ventricle dilatation may be secondary to the degree of anaemia. Sickle cell anaemia, in contrast to other types of chronic anaemia, also significantly affects the right ventricle. For these patients, routine echocardiographic studies should be performed as a part of continuous medical care to identify high-risk patients who may benefit from additional investigation and therapy, such as hydroxyurea. The sickling vaso-occlusive events, which could well lead to pulmonary vascular deterioration, warrant further investigation in this direction.
Acknowledgements
P.M.A. is supported with a fellowship grant from Fondation Centre Hospitalier et Universitaire Sainte-Justine. Authors’ Contribution: P.M.A.: data analysis, data collection, literature review, and manuscript writing. G.H.: data collection, analysis, literature review, and manuscript drafting. N.R.: data collection and verification, literature review, and manuscript editing. Y.P.: data collection and verification, analysis, literature review, and manuscript editing. M.-J.R.: echo analyses and interpretation and manuscript editing. D.C.: concept of the project and data verification and analysis. N.D.: concept of the project, literature review, data verification and analysis, and manuscript drafting and editing.
Financial Support
This research received no specific grant from any funding agency or from commercial or not-for-profit sectors.
Conflicts of Interest
None.
Ethical Standards
This retrospective study was approved by the institutional review board.