Mastitis is the single most costly disease on dairy farms (Renau & Packard, Reference Reneau and Packard1991). Somatic cell count (SCC) and bacteriological testing are the tools defined by the International Dairy Federation (IDF, 1984) to determine udder health. SCC measures all types of cells in milk, including eosinophils, lymphocytes, macrophages, neutrophils and epithelial cells (Kehrli & Shuster, Reference Kehrli and Shuster1994) but SCC does not distinguish between the types of cells present in milk, and varies with time; furthermore, SCC varies with frequency of milking, stage of lactation, and season (Corbett, Reference Corbett1998; Kelly et al. Reference Kelly, Tiernan, O′Sullivan and Joyce2000). The types of cells present in milk must be determined because, in mastitic milk, the percentage of PMN has been shown to increase considerably (up to 90%) (Saad, Reference Saad1987; Kehrli & Shuster, Reference Kehrli and Shuster1994).
The differential inflammatory cell count (DICC), which distinguishes between granulocytes and mononuclear cells and enumerates the concentration of granulocytes, makes it possible to detect mastitis in its initial phase, when the SCC is still low, and to evaluate the success of antibiotic treatments (Redelman et al. Reference Redelman1997a, Reference Redelmanb). Low cell counts can occur in healthy and diseased quarters, so microscopic cell differentiation is the standard technique for determining inflammation (Rivas et al. Reference Rivas, Quimby, Blue and Coksaygan2001b). DICC leads to distinct improvement in the reliability of mastitis diagnosis (Schröder & Hamann, Reference Schröder and Hamann2005).
Although microscopy is the common method used to determine DICC, it is not only time consuming but is also known to have poor repeatability due to the subjective evaluation of low cell numbers. In contrast, flow cytometry can measure >10 000 cells within a short time. Whereas the distribution of bovine PMN and lymphocytes in a cytometric dot plot is known, it is difficult to determine the positions of monocytes and macrophages.
To determine the number of these cells, Östensson et al. (Reference Östensson, Hageltorn and Åström1988) and Miller et al. (Reference Miller, Paape, Filep and Link1993) proposed subtracting the number of PMN and lymphocytes from the total number of somatic cells in milk. Another way of differentiating PMN from mononuclear cells, i.e., lymphocytes, monocytes and macrophages, is to stain them with HO432 and propidium iodide (PI) (Redelman, Reference Redelman1997b; Pillai et al. Reference Pillai, Kunze, Sordillo and Jayarao2001). There is no consensus about the dot plot positions of monocytes and macrophages (Rivas et al. 2001b; Dosogne et al. Reference Dosogne, Vangroenweghe, Mehrzad, Massart-Leén and Burvenich2003). Here we studied in detail the differentiation of milk cells and the detection of macrophages, lymphocytes and as viable and non-viable PMN on a flow cytometric dot plot. In addition, a simple and practicable procedure was elaborated for cell differentiation as a mastitis prognostic tool.
Materials and Methods
Two investigations were performed. In the first, specific antibodies were used to determine the position of the different leucocyte types in a flow cytometric dot plot and the second was to confirm the elaborated template for the differentiation of leucocytes after staining cells with PI.
Animals
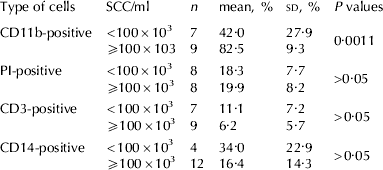
In both investigations, samples were taken of milk from high yielding (30–40 l/d), clinically healthy German Holstein cows in the first 10 weeks of lactation (4 cows for test one, 11 for test two). Quarter milk samples with both low (<100 000 cells/ml) and high (>100 000 cells/ml) SCC were tested. Table 1 shows the number of quarters and their cell counts in the first investigation, Table 2 shows these numbers for the second. Every sample was tested once.
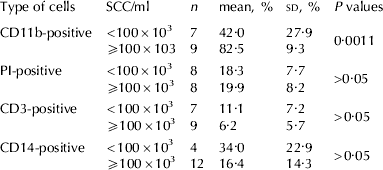
Mean percentages with sd and statistical differences (P values) of different cell types positive for specific antibodies related to SCC/ml in quarter foremilk samples (n) in test 1. For each antibody, 4 cows (n=16 quarters ) were sampled
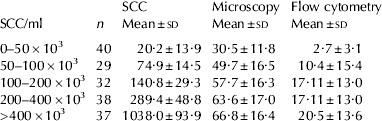
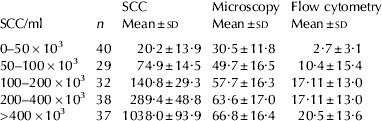
Mean and sd of somatic cell count (SCC), polymorphonuclear neutrophils (PMN) counted by microscopy and percentages of viable PMN estimated by flow cytometry in different cell count classes
Milk sampling
Sampling was conducted on the quarter level according to National Mastitis Council (NMC) Standards (1999). Sampling took place during the morning milking between 6.00 and 7.30. The teats were cleaned and disinfected with 70% ethanol and the first milk jets were discarded. The following 10 ml of milk was collected in sterile glass tubes for cytobacteriological analysis. For further preparation and analysis of milk cells, 200 ml was hand milked for test one and 50 ml for test two.
Cytobacteriological analysis
For both investigations, 10 ml of milk collected in sterile glass tubes was fixed with 60 μl Bronopol and stored at 4°C. SCC was determined by using a fluoro-optic electronic method (Fossomatic 360 cell counter, Foss Electric, Hillerød, Denmark) in accordance with IDF Standards (1984). For bacteriological analysis, 10 μl of milk was smeared onto a Petri dish. After 24-h and 48-h incubation, the bacteria were identified by the morphology of the colonies, haemolysis, and the number of colonies according to NMC standards (1999). For further analysis, results of the reading after 48 h were used.
Microscopy
For microscopic evaluation, 10 ml of milk was centrifuged at 1400 g for 10 min without braking. The supernatant was discarded and the fat removed. The cell sediment on the bottom of the tube was redispersed in 20 μl of 0·9% saline solution. On each slide, two fields with about 3 cm2 were smeared with the sediment. After drying in air the slides were stained by toluidine blue for 5 s. In each field, 100 cells were counted and afterwards, the mean of two fields calculated.
Preparation techniques
Test 1: Separation of milk cells:
Because for incubation with specific antibodies a large number of cells were necessary, samples of 200 ml of milk were diluted with 200 ml of phosphate-buffered saline (PBS). After centrifugation at 1000 g for 15 min the cream layer and supernatant were discarded. The cell pellet on the bottom of the container was then washed once with 30 ml of PBS and centrifuged at 400 g for 10 min. Afterwards, the cells were taken up in 500 μl of a nutrition media, and their concentration was determined by a blood cell counter (MEK-6108G hematology analyzer, NIHON KOHDEN, Bad Homburg, Germany). The milk cells were then diluted with PBS to a concentration of 2×10⁶/ml.
Incubation with antibodies:
Samples of 100 μl of the cell suspension were put into a well of a microtitre plate. The plate was centrifuged at 350 g without braking at 10°C for 4 min. The supernatant was discarded, and 20 μl of every antibody was added to the cell pellet on the bottom of the wells. The whole microtitre plate was stored at 4°C for 20 min. After incubation, 100 μl of buffer was put into every well and the plate was centrifuged at 350 g for 10 min as a wash-step. Again, the supernatant was discarded, whereupon the secondary antibody (rabbit-anti-mouse combined with FITC) was applied, followed by a second incubation for 20 min. After incubation, the cells were again centrifuged with buffer for 10 min and diluted in 200 μl of PBS. A further incubation for 15 min with 50 μl of PI (4 μg/ml) followed without any wash step.
Antibodies used:
The primary antibody used for the detection of PMN was an antibody against CD11b (MCA 1425; SEROTEC, Duesseldorf, Germany). CD11b is mainly expressed on granulocytes (Riollet et al. Reference Riollet, Rainard and Poutrel2001).
CD3 (MM1A; SEROTEC, Duesseldorf, Germany) was used for lymphocytes (MacHugh et al. Reference MacHugh, Mburu, Hamilton and Davis1998). VPM65 is specific for bovine CD14 (Berthon & Hopkins, Reference Berthon and Hopkins1996; Sopp et al. Reference Sopp, Kwong and Howard1996; Immunology Unit, School of Veterinary Medicine, Hannover, Germany). CD14 is mainly expressed by monocytes and macrophages (Riollet et al. Reference Riollet, Rainard and Poutrel2001).
Test 2:
Separation of milk cells. Quarter milk samples belonging to different cell count classes were tested. Table 2 shows the number of quarters tested. To establish a practicable method, 5-ml samples of milk were mixed with 5 ml of PBS and centrifuged at 400 g for 10 min. Fat and supernatant were removed and the cell sediment on the bottom of the centrifugation tube was taken up in 300 μl of PBS and put into flow cytometer tubes. PI (50 μl of 4 μg/ml) were added and after incubation for 15 min, cells were measured.
Measurement and analysis
In both tests, cells were measured by a FACS CALIBUR flow cytometer (Becton Dickinson, Heidelberg, Germany) with a 488-nm argon Laser: 5000 events were measured per sample. Further analysis was carried out with the CellQuestPro® program.
Statistical analysis
Data were recorded with Microsoft Excel Version 2000, and calculated with SAS 8e software (SAS, 2000). Results were tested for normal distribution before further analysis. Mean and sd were calculated by the Proc Univariate step, and Pearson and Spearman correlation coefficients were calculated by the Proc Corr step. Differences between low- and high-SCC groups were calculated by the t test step for independent groups.
Results
Cytobacteriology
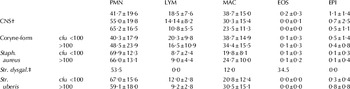
In both tests, groups were formed according to SCC (see Tables 1 and 2). Quarters were either non-infected or infected by staphylococci (Staph. aureus or coagulase-negative staphlococci), streptococci (Str. dysgalactia or Str. uberis) or corynebacteria. Gram-negative bacteria were not detected (Table 3).
Means and sd of bacteria, colony-forming units and differential inflammatory cell count (DICC). in Test 2. Cell types shown are: polymorphonuclear granulocytes (PMN), lymphocytes (LYM), macrophages (MAC), eosinophils (EOS) and epithelial cells (EPI)

† CNS=coagulase-negative staphylococci
‡ Str. dysgal.=Streptococcus dysgalactiae
Microscopic results
Microscopic results are shown in Table 4.
Means and sd of microscopic results for the different cell count classes for polymorphonuclear granulocytes (PMN), macrophages (MAC), lymphocytes (LYM), eosinophils (EOS) and epithelial cells (EPI) in Test 2

Positions of different cell types
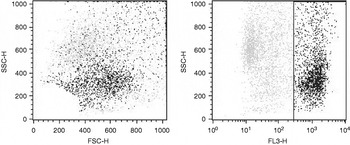
With the help of specific antibodies, different leucocytes were marked. As they were also stained with PI, we could first determine the cells that bound to the specific antibodies, and also detect their position in a dotplot when the fluorescence of PI was shown. Figure 1 shows CD11b-positive cells. The first one shows size (FSC, forward scatter) and granularity (SSC, side scatter) of CD11b-positive cells, the second shows the same events in a dotplot granularity-fluorescence of PI (Fl-3). Table 1 shows mean and sd of CD11b-positive cells.
CD11b-positve cells (black) in FSC (Forward-Scatter)-SSC (Side Scatter) (a) and the same cells in SSC-Fl-3 (b) in milk with SCC/ml=520×103.

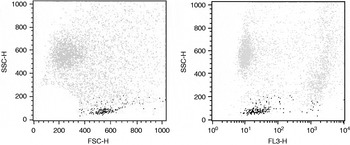
As there may be a great many non-viable cells in milk, it had to be determined whether these formed another population. As PI is a dye that stains the DNA only in non-viable cells, it was used to differentiate between viable and non-viable cells. The results are given in Fig. 2. Differentiation is possible regarding the red fluorescence. In the right image PI-positive, i.e. red fluorescing cells, are non-viable.
Non-viable cells (black) in FSC (Forward-Scatter) SSC (Side Scatter) (a) and the same cells in SSC-Fl-3 (b) in milk with SCC/ml=472×103.

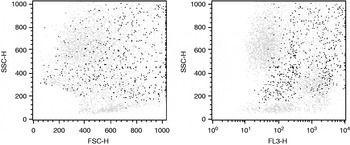
An antibody against CD3 was used to detect the position of lymphocytes. Figure 3 shows CD3-positive cells in FSC-SSC (a) and SSC-Fl-3 (b).
CD3-positive cells (black) in FSC (Forward Scatter) – SSC (Side Scatter) (a) and SSC-Fl-3 (b) in milk with SCC/ml=520×103.

An antibody against CD14 was used in a subsequent assay. Figure 4 shows CD14-positive cells.
CD14-positive cells (black) in FSC (Forward Scatter) – SSC (Side Scatter) (a) and the same cells in SSC-Fl-1 (b) SCC/ml=380 103.

Application of the scheme for prognostic testing of milk samples
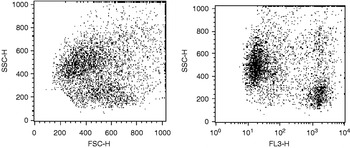
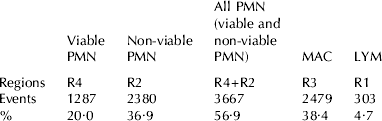
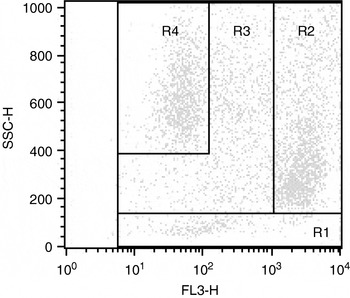
These results showed the localization of the different cells in the dot plot after staining with PI (FSC-FL-3). The analyses indicated in Table 5 were conducted. With the knowledge of the different positions of somatic cells in milk, a template for further differentiation was elaborated.
Evaluation of the template in Fig. 5 to determine the differential somatic cell count. Cell types shown are: polymorphonuclear neutrophils (PMN), lymphocytes (LYM) and macrophages (MAC)
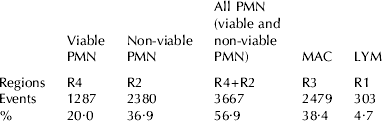
Applying this template to analyse the measurements of the method showed an increase in viable PMN in the various cell classes.
Template for the identification of milk cells in milk with SCC/ml=273×103. Different regions contain mainly one cell population. R 1=lymphocytes; R 2=non-viable polymorphonuclear neutrophils; R 3=macrophages; R 4=vital polymorphonuclear neutrophils.

The number of viable PMN increased significantly (P=0·0029) from SCC-group one to group two. There was no significant increase for the other groups (Table 2).
Comparison of the DICC in test 2 with microscopic results showed significant correlations for all cell types (P<0·001). The coefficient of correlation for PMN was r=0·720, 0·517 for macrophages and 0·327 for lymphocytes. SCC was related to the percentage of viable PMN with r=0·540 and P<0·005, for non-viable cells it was related with r=0·389 and P<0·01.
Discussion
The most accepted tools for the detection of udder health are SCC and bacteriological analysis (IDF, 1984). Another useful parameter is DICC, as cell differentiation makes it possible to detect mastitis in its initial phase. As resident macrophages ingest bacteria and secrete unidentified mediators that, in the next step, stimulate migration of bovine neutrophils, SCC is low in the very first stage of the inflammation (Craven, Reference Craven1983; Rainard & Riollet, Reference Rainard and Riollet2006). So DICC enables one to detect mastitis in its initial phase and to evaluate antibiotic treatments (Redelman, Reference Redelman1997a, Reference Redelmanb). Low cell counts can occur in healthy and diseased quarters, so manual cell differentiation is the standard technique for determining inflammation (Rivas et al. Reference Rivas, Quimby, Blue and Coksaygan2001b).
As microscopy is very time consuming, several studies have been made on flow cytometric differentiation of milk cells (Östensson et al. Reference Östensson, Hageltorn and Åström1988; Miller et al. Reference Miller, Paape, Filep and Link1993; Redelman, Reference Redelman1997a, Reference Redelmanb; Pillai et al. Reference Pillai, Kunze, Sordillo and Jayarao2001; Rivas et al. 2001a; Dosogne et al. Reference Dosogne, Vangroenweghe, Mehrzad, Massart-Leén and Burvenich2003); however, some of the results are contradictory, especially with regard to the position of macrophages.
It is known that DICC is also dependent on the centrifugation step (Schröder & Hamann, Reference Schröder and Hamann2005) but it is the usual routine (Miller et al. Reference Miller, Paape, Filep and Link1993; Rivas et al. Reference Rivas, Quimby, Coksaygan, Alba, Arina and Arrobas2001a, Reference Riollet, Rainard and Poutrelb) and in the present study, it was always the same.
Position of different cell types
This discussion focuses on the position of somatic cells in a dot plot and describes different methods for determining the position of PMN. Here we used antibodies against CD11b. PMN can be identified with a sort option of the flow cytometer (Hageltorn & Saad, Reference Hageltorn and Saad1986; Dosogne et al. Reference Dosogne, Vangroenweghe, Mehrzad, Massart-Leén and Burvenich2003). It is also possible to isolate PMN by density gradient centrifugation with Percoll® and identify them with a monoclonal antibody against bovine granulocytes (cell line CH138A) (Mehrzad et al. Reference Mehrzad2002). The same results were obtained with the antibody against CD11b (Rivas et al. Reference Rivas, Quimby, Coksaygan, Alba, Arina and Arrobas2001a, Reference Riollet, Rainard and Poutrelb). The results of this study show that dots defined as viable PMN are in the same position as those defined as PMN in the cited studies.
As there may be a great many non-viable cells in the milk cell population, it was necessary to determine whether there is an independent population of non-viable cells in a flow cytometric dot plot. After staining with PI, milk was found to contain a population of non-viable cells corresponding to that described by Rivas et al. (Reference Rivas, Quimby, Coksaygan, Alba, Arina and Arrobas2001a, Reference Riollet, Rainard and Poutrelb) and Dosogne et al. (Reference Dosogne, Vangroenweghe, Mehrzad, Massart-Leén and Burvenich2003). As this population is also CD11b-positive, most of the cells were PMN. One must therefore differentiate between viable and non-viable PMN. Viable and non-viable PMN have also been found in different positions when milk samples were mixed with CMFDA (Redelman, Reference Redelman, Butler, Robinson and Garner1988).
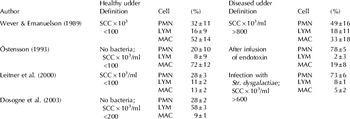
The localization of lymphocytes has often been described, and the results of all reports are comparable. The dot plot position was determined either by sorting and microscopy (Hageltorn & Saad, Reference Hageltorn and Saad1986; Dosogne et al. Reference Dosogne, Vangroenweghe, Mehrzad, Massart-Leén and Burvenich2003) or by the use of monoclonal antibodies that bind to specific subpopulations of lymphocytes (Park et al. Reference Park, Fox, Hamilton and Davis1992; Taylor et al. Reference Taylor, Keefe, Dellinger, Nakamura, Cullor and Stott1997; Soltys et al. Reference Soltys and Quinn1999; Riollet et al. Reference Riollet, Rainard and Poutrel2001; Rivas et al. Reference Rivas, Quimby, Coksaygan, Alba, Arina and Arrobas2001a, Reference Riollet, Rainard and Poutrelb). Despite this agreement it must be pointed out that the repeatability and precision of these reports are not satisfactory. Here we used CD3, a pan-T antibody. The position of lymphocytes was verified even though this antibody binds to only about 90% of these cells. Moreover, there were 6·19% CD3-positive cells in the milk samples with an SCC/ml ⩾100×103. This is in agreement with data published for diseased quarters (Table 6).
Differential inflammatory cell count (DICC) determined by flow cytometry described in literature. Cell types shown are: polymorphonuclear neutrophils (PMN), lymphocytes (LYM) and macrophages (MAC)

An antibody against CD14 was used to identify macrophages. Membrane-bound CD14 is expressed both by PMN and macrophages (Paape et al. Reference Paape, Lilius, Wiitanen, Kontio and Miller1996) but it is mainly expressed by monocytes and macrophages (Riollet et al. Reference Riollet, Rainard and Poutrel2001). CD14 is known as an antigen for the differentiation of macrophages in blood (Sopp et al. Reference Sopp, Kwong and Howard1996). Also in this study, it was used to clearly differentiate monocytes and macrophages from PMN. Riollet et al. Reference Riollet, Rainard and Poutrel2001 used CD14 to separate the lymphocyte from the monocyte/macrophage gate. The morphology and size of phagocytising macrophages is very variable, which may be due to the fact that they have phagocytising capabilities and are of different size due to the ingested fat and bacteria (Mielke & Koblenz, Reference Mielke and Koblenz1980; Paape et al. Reference Paape, Wergin, Guidry and Schultze1981; Paape et al. Reference Paape, Wergin, Guidry and Schultze1981). For this reason, a unique position has not yet been determined for macrophages (Wever & Emanuelson, Reference Wever and Emanuelson1989; Östensson, Reference Östensson1993; Leitner et al. Reference Leitner, Shoshani, Krifucks, Chaffner and Sarana2000; Dosogne et al. Reference Dosogne, Vangroenweghe, Mehrzad, Massart-Leén and Burvenich2003).
Application of the scheme for prognostic testing of milk samples
In this study, a template was elaborated that makes it possible to determine the DICC rapidly. Unlike conventional methods, this procedure can be carried out in only 10 min. By the detection of viable PMN, which are the first cell type that enter the mammary gland within an infection (Rainard & Riollet, Reference Rainard and Riollet2006), it is possible to detect mastitis in its initial phase. If there is a high SCC and a low number of viable PMN, it might be assumed that the inflammation is in resolution. So, besides the SCC, the percentage of viable PMN provides us with additional information about mastitis detection. Viable PMN in this template are clearly visible and distinguishable. So we can determine the onset of an inflammation before clinical signs become visible and even under a cell count level of 100 000 cells/ml. These results show that a very simple and practicable procedure results in sufficient cell differentiation and therefore opens the possibility of including it as a tool for mastitis diagnostics.
Conclusion
It is possible to use a flow cytometric dot plot to differentiate cells into viable and non-viable PMN, lymphocytes and macrophages, and to determine the percentages of these cell types. Their dot plot positions were determined using specific antibodies. The majority of these results are in agreement with earlier published data (Wever & Emanuelson, Reference Wever and Emanuelson1989; Östensson, Reference Östensson1993; Leitner et al. Reference Leitner, Shoshani, Krifucks, Chaffner and Sarana2000; Dosogne et al. Reference Dosogne, Vangroenweghe, Mehrzad, Massart-Leén and Burvenich2003).
This procedure does not need more than 10 min and can be applied easily as a routine test for a meaningful and very early mastitis diagnosis based on milk samples. This method has the advantages of detecting mastitis before clinical signs appear and testing the success of antibiotic treatment. Analysis of percentages of viable PMN makes it possible to determine the age of the inflammation.
The authors thank Mrs. McAlister-Hermann for valuable proofreading of the manuscript.