Introduction
Both cognitive therapy (CT) and interpersonal psychotherapy (IPT) have proven to be well-standardized, effective treatments for major depressive disorder (MDD; Cuijpers et al. Reference Cuijpers, van Straten, Andersson and van Oppen2008). However, it is not clear yet whether one therapy outperforms the other with regard to severity and course of the disorder. Recently, Jakobsen et al. (Reference Jakobsen, Hansen, Simonsen, Simonsen and Gluud2012) meta-analysed results of five randomized controlled trials (RCT) comparing post-treatment effects of CT and IPT on the Beck Depression Inventory (BDI). Three trials examined individual CT and IPT (Elkin et al. Reference Elkin, Shea, Watkins and Imber1989; Luty et al. Reference Luty, Carter, McKenzie, Rae, Frampton, Mulder and Joyce2007; Quilty et al. Reference Quilty, McBride and Bagby2008), one study examined the effects of group therapy (Bellino et al. Reference Bellino, Zizza, Rinaldi and Bogetto2007), and one study included psychodynamic IPT instead of traditional IPT (Hardy et al. Reference Hardy, Barkham, Shapiro, Stiles, Rees and Reynolds1995). Meta-analysis of the three studies that examined individual CT and IPT showed no significant differences in post-treatment depression severity scores between the two interventions [mean difference in favour of CT = 0.62 points on the BDI-II, p = 0.59, 95% confidence interval (CI) 2.86–1.61]Footnote 1 Footnote †. Even though existing research consistently suggests that both treatments are equally effective, additional trials are necessary. As Jakobsen et al. (Reference Jakobsen, Hansen, Simonsen, Simonsen and Gluud2012) pointed out, so far the data collected in randomized comparisons of CT and IPT are insufficient to reliably decide whether the two therapies have differential effects on the BDI. More specifically, trial sequential analysis on the three existing studies examining the effects of individual CT and IPT for depression (n = 388), indicated that data of at least 108 more patients is necessary to detect or reject an intervention effect with a minimal relevant difference of 4 BDI points (80% power). For an effect of 3 BDI points, this is much higher (791 additional patients)Footnote 2 . Furthermore, all studies included in Jakobsen's meta-analysis were classified as having a high risk of bias (especially Elkin et al. Reference Elkin, Shea, Watkins and Imber1989), and none of them included data after treatment termination, leaving long-term effects largely unknown. Another unresolved issue in the comparison of CT and IPT is whether one of the two treatments is indicated for severe depression, as two studies found contradictory evidence: Elkin et al. (Reference Elkin, Shea, Watkins and Imber1989) favoured IPT, whereas Luty et al. (Reference Luty, Carter, McKenzie, Rae, Frampton, Mulder and Joyce2007) found that CT was more effective for severe depression. In addition, treatment moderators and therapist effects are less well studied, but may be at least as important as treatment protocol. Last, it has been frequently argued in psychotherapy research that the effects of treatment studies cannot be attributed to the intervention(s) studied unless a placebo or no-treatment group is included (Klein, Reference Klein1990). Even though several studies have individually compared CT or IPT to a non-active waiting list control (WLC) condition, to date there are no randomized comparisons of CT, IPT and a WLC condition.
Study aims
To address these issues, the current study examined the clinical effectiveness of CT and IPT in a large sample of depressed patients seeking treatment in an outpatient mental health clinic in The Netherlands. The aim of the study was threefold: first, we tested whether one of the treatments was superior to the other in the reduction of depressive symptoms as assessed with the BDI-II and on a set of secondary outcomes at post-treatment (7 months) and up to 5-months follow-up. Second, we tested for therapist differences and examined several potential moderators including baseline depression severity and total number of sessions. Third, and final, we examined whether short-term effects of active treatment were superior to waiting-list control after 2 months. With this we add to previous studies conducted in the USA and New Zealand with a large European sample. In order to determine the relative contribution of our study to the field, we added our data to the existing evidence base of trials that examined individual CT and IPT (Elkin et al. Reference Elkin, Shea, Watkins and Imber1989; Luty et al. Reference Luty, Carter, McKenzie, Rae, Frampton, Mulder and Joyce2007; Quilty et al. Reference Quilty, McBride and Bagby2008), and meta-analysed the findings. Furthermore, using the same set of four studies, trial sequential analysis was performed to determine whether our study added the information necessary to conclude equivalence between CT and IPT. Finally, the risk of bias in our study was assessed.
Method
Trial design
Details about the study design have been fully described elsewhere (Lemmens et al. Reference Lemmens, Arntz, Peeters, Hollon, Roefs and Huibers2011). The data came from a large single-centre RCT (parallel group design) examining the effectiveness and mechanisms of change of individual CT and IPT for depression. In this study, depressed outpatients were randomly allocated to one of three conditions: (a) CT, (b) IPT, (c) a 2-month WLC condition followed by treatment of choice. In reporting the follow-up period of the study, three phases can be distinguished; (1) the ‘Treatment phase’ (baseline to 7 months); the period when therapy was delivered; (2) the ‘Trial follow-up phase’ (months 8–12) in which depression severity was measured monthly; and (3) the ‘Long-term follow-up phase’ (months 12–24); the period covered by retrospective assessment at 24 months. The data presented here concern the acute outcome of therapy at the end of the 7-month treatment phase and data collected in the trial follow-up phase (henceforth called follow-up). The Medical Ethics Committee of Maastricht University approved the study protocol, and all participants provided written informed consent. The study is registered at The Netherlands Trial Register, part of the Dutch Cochrane Centre (ISRCTN 67561918).
Participants and recruitment
Patients were adult outpatients (18–65 yearsFootnote 3 ) referred to the mood disorder unit of the Maastricht Community Mental Health Centre with a primary diagnosis of MDD as confirmed by the Structural Clinical Interview for DSM-IV Axis I disorders (SCID-I; First et al. Reference First, Spitzer, Gibbon and Williams1997) conducted by a trained evaluator. Further inclusion criteria were: internet access, an email address, and sufficient knowledge of the Dutch language. Exclusion criteria were: bipolar or chronic (current episode >5 years) depression, elevated acute suicide risk, concomitant pharmacological or psychological treatmentFootnote 4 , drugs and alcohol abuse/dependence, and mental retardation (IQ < 80).
Procedure
Participants were recruited during regular intakes at our clinical site. After informed consent was obtained and a baseline assessment was completed, the researcher pressed the ‘assign’ button on the computer screen, after which the database randomly allocated the participant to one of three conditions using computer-generated block randomization (10:10:4). The random allocation sequence was generated by an independent computer scientist and was concealed from the researchers who were involved in the randomization procedure to prevent prediction of future assignment (Lemmens et al. Reference Lemmens, Arntz, Peeters, Hollon, Roefs and Huibers2011). Randomization was pre-stratified according to presence or absence of previous episodes. Blinding of patients and therapists for treatment condition was not possible. Sample size calculations of the active conditions CT and IPT were based on long-term expectations of CT v. IPT (Lemmens et al. Reference Lemmens, Arntz, Peeters, Hollon, Roefs and Huibers2011). By combining rudimentary findings from previous randomized trials, a 20% difference in relapse/recurrence rate between the conditions was expected at the end of the 2-year follow-up period. An a-priori power analysis indicated that with 75 patients per arm in the active conditions and taking 15% attrition into account, the study was powered at 80% (two-tailed α = 0.05) to detect a CT-IPT 20% difference in relapse rates. With this sample size, taking 15% attrition into account, the study is powered at 80% to detect a medium effect size difference (Cohen's d = 0.50) in dimensional outcomes at p = 0.05, as in the present study. A second power calculation (powered at 80%, α = 0.05) showed that 28 patients in the WLC condition would suffice to detect a statistically significant difference of six BDI-II points between the two active conditions combined and the waiting list at 2 months (Cohen's d = 0.58)Footnote 5 . The main assessment points for the active conditions (CT and IPT) were baseline, 3, 7, 9 and 12 months. The primary outcome was also assessed at 8, 10 and 11 months. All assessments were administered on a computer. Pre- and post-treatment assessments (baseline and 7 months) were administered at the research centre. Mid-treatment (3 months) and follow-up assessments (8–12 months) took place via the internet. In addition, in order to examine the effect of the waiting list, depression severity of the total sample was assessed at 2 monthsFootnote 6 .
Interventions
Treatment consisted of 16–20 individual sessions of 45 min, depending on the progress of the individual patient. The protocol allowed flexibility in scheduling appointments less often than weekly. Patients were considered to have had an adequate dose of treatment if they attended at least 12 sessionsFootnote 7 . Both interventions were described in a treatment manual. The CT protocol was based on the manual by Beck et al. (Reference Beck, Rush, Shaw and Emery1979) which states that depression results from maladaptive information-processing strategies and is maintained by dysfunctional behavioural responses. In order to decrease depressive symptoms, CT focuses on identifying and altering the function, content and structure of cognitions, schemas and attitudes associated with negative affect (Beck et al. Reference Beck, Rush, Shaw and Emery1979). The IPT protocol followed the guidelines laid out by Klerman et al. (Reference Klerman, Weissman, Rounsaville and Chevron1984). IPT tries to understand the social and interpersonal context in which the depressive symptoms arose and investigates how they relate to the current social and personal context. The theorized mechanism is that if the patient can solve the interpersonal problem or is able to change the relation to this problem, the depressive symptoms should resolve as well (Markowitz & Weissman, Reference Markowitz and Weissman2004). In spite of their different theoretical backgrounds, CT and IPT also share several common features: both are time-limited, symptom-targeted and present-focused, and encourage the patient to regain control of mood and functioning. Furthermore, both try to increase the patient's activity level and pay special attention to the identification of expectations and assumptions using interventions such as exploration and clarification (Ablon & Jones, Reference Ablon and Jones1999; Willemse & Trijsburg, Reference Willemse and Trijsburg2005). In addition, both therapies emphasize the importance of other (non-specific) factors such as structure, motivation and alliance.
Treatment integrity
Treatment integrity and boundaries of both therapies were carefully monitored during the therapist training phase and the study itself. To prevent contamination, therapists were uniquely assigned to one of the treatment conditions. Furthermore, prior to the study, they received additional training by Steven Hollon (CT) and John Markowitz (IPT), experts in the respective interventions. The training (2 × 8 h) addressed the theoretical framework and skills for each treatment using tailored case examples and role-play. During the study, therapists and the investigators who also participated as therapists in the study (M.H. for CT and F.P. for IPT) met bi-weekly in separate consultation sessions for each treatment condition to discuss their caseload. In addition, all sessions were videotaped. Four independent raters evaluated a random selection of 106 tapes on treatment adherence (content and quality) and competence. The raters (three psychotherapists and one psychologist) were highly experienced in providing, teaching and supervising CT and IPT. All raters were trained prior to the study and masked to treatment outcome. Nine tapes were double-coded in order to assess inter-rater reliability. To examine competence in both therapies, the overall quality scores of the Cognitive Therapy Scale (Dobson et al. Reference Dobson, Shaw and Vallis1985) and a short version of the IPT Adherence and Quality Scale (Stuart, Reference Stuart2011) were used. In order to obtain a measure of adherence, the Collaborative Study Psychotherapy Rating Scale – version 6 (CSPRS-6; Hollon et al. Reference Hollon, Waskow, Evans and Lowery1984, Reference Hollon, Evans, Auerbach, DeRubeis, Elkin, Lowery, Kriss, Grove, Tuason and Piasecki1988) was used. This 96-item questionnaire is able to distinguish between CT, IPT and clinical management (Hill et al. Reference Hill, O'Grady and Elkin1992). Items are rated on a 7-point Likert scale (‘not at all’ to ‘extensively’) and higher scores indicate better adherence. Following Luty et al. (Reference Luty, Carter, McKenzie, Rae, Frampton, Mulder and Joyce2007), we modified the original version to distinguish only between CT and IPT by omitting the 20 items pertinent to clinical management and medication, reducing the scale to 76 items.
Outcomes
Primary outcome was depression severity as measured with the Beck Depression Inventory, second edition (BDI-II; Beck et al. Reference Beck, Steer and Brown1996). Scores range from 0 to 63 with higher scores indicating more severe symptoms of depression. Secondary outcome measures included the following: general psychological distress was assessed with the Brief Symptom Inventory (BSI; Derogatis & Melisaratos, Reference Derogatis and Melisaratos1983). A high score is indicative of severe distress (range 0–212). To obtain a measure of impairment in social functioning due to depression, the Work and Social Adjustment Scale (WSAS; Mundt et al. Reference Mundt, Marks, Greist and Shear2002) was used. Scores range from 0 (no impairment) to 40 (severe impairment). Besides clinical outcome measures, several quality-of-life measures were included because they have been shown to provide an important additional dimension to the evaluation of treatments for depression (Kennedy et al. Reference Kennedy, Eisfeld and Cooke2001; Jakobsen et al. Reference Jakobsen, Hansen, Simonsen, Simonsen and Gluud2012). The RAND-36 (van der Zee & Sanderman, Reference Zee van der and Sanderman1993) was used to measure quality of life in terms of impairments due to physical and mental health status. Scores were transformed to a 100-point scale with higher scores indicating more positive experiential quality of life. The EuroQol-6D (EQ-6D; EuroQolGroup, 1990) was used to obtain an overall utility score for population-based quality of life (EQ-5D)Footnote 8 . Utilities refer to the preference for any particular set of health outcomes and are indicated by a number between 0 (worst imaginable condition) and 1 (perfect health; Dolan, Reference Dolan1997; Drummond et al. Reference Drummond, Schulpher, Torrance, O'Brien and Stoddart2005). For the current study, the Dutch value set was used (Lamers et al. Reference Lamers, McDonnell, Stalmeier, Krabbe and Busschbach2006). For a more detailed description of these instruments and their psychometric properties we refer to our protocol paper (Lemmens et al. Reference Lemmens, Arntz, Peeters, Hollon, Roefs and Huibers2011).
Data analysis
A detailed description of statistical procedures is presented in online Data Supplement I. First, we mapped out patient flow from screening to randomization. After that we explored pre-treatment demographic and clinical variables of the three groups using descriptive statistics and checked for baseline differences between conditions in terms of size and clinical importance. Subsequently, therapist characteristics, treatment- and study compliance, and treatment integrity were determined, followed by examination of descriptive statistics on all clinical outcome measures at each time-point.
To examine whether CT and IPT differed in the reduction of depressive symptoms mixed (multilevel) regression analysis was used. We applied intention-to-treat analysis, with the BDI-II as the primary outcome. Our basic model was a two-level (patients and measurements) repeated-measures design with depression severity as dependent variable, condition as a between-subjects factor and time of measurement in weeks as a within-subjects factor. The difference between CT and IPT was represented by the time × condition interaction in the model. Furthermore, in all analyses, we controlled for baseline EQ-5D and BDI-II scores because they showed considerable differences between the groups. Because visual inspection showed separate linear time slopes for the acute (0–7 months) and the follow-up (7–12 months) phase, change over time was assessed in two separate analyses (one for the acute phase, and one for the follow-up). Furthermore, change on secondary outcomes was assessed by testing the two-level basic model on dependent variables BSI, WSAS, RAND-36 and EQ-5D. For BDI-II and EQ-5D mixed gamma regression was used in the follow-up because of skewed distributions. Effect sizes, Cohen's d and r (Cohen, Reference Cohen1988) for the continuous primary and secondary outcomes were computed from the multilevel estimates.
Next, we tested whether initial depression severity moderated the effect of time and condition by adding the two- and three-way interaction(s) of baseline depression severity (BDI-II) with time and condition to the basic model of the primary outcome BDI-II. Subsequently, we checked for influence of therapist and number of sessions by univariately adding them as fixed factors (main effect, and interaction with time) to the final model. Several other baseline characteristics that displayed potentially relevant differences between the treatment groups (gender, work, and marital status) were added to the model as covariates to see whether they would affect the results. All effects were tested at the p < 0.05 level (two-tailed). Then, we examined whether therapy outperformed the waiting list by comparing change in BDI-II scores of patients in the active groups after 2 months of therapy with those of patients in the WLC condition after 2 months of no-treatment. All analyses were performed with SPSS v. 21.0 (SPSS Inc., USA) and results are reported according to the CONSORT guidelines for reporting trials (Moher et al. Reference Moher, Hopewell, Schulz, Montori, Gotzsche, Deveraux, Elbourne, Egger and Altman2010). Furthermore, the methodology of Jacobson & Truax (Reference Jacobson and Truax1991) was used to determine the proportion of patients that showed clinically meaningful change on the BDI-II. Response (the minimum amount of decrease in symptoms that has to be accomplished during therapy) was defined as a decrease of at least 9 BDI-II points during the treatment phase. Remission (the cut-off point between healthy and ‘ill’) was defined as an absolute value of ≤9 on the BDI-II. Frequency differences in response and remission rates between the groups were examined using mixed binary logistic regression.
To determine the relative contribution of our study to the field, we added our BDI-II data to the existing evidence base and meta-analysed findings from all four randomized trials that examined individual CT and IPT (Elkin et al. Reference Elkin, Shea, Watkins and Imber1989; Luty et al. Reference Luty, Carter, McKenzie, Rae, Frampton, Mulder and Joyce2007; Quilty et al. Reference Quilty, McBride and Bagby2008; current study) using the statistical program Open Meta Analysis (Wallace et al. Reference Wallace, Daharbreh, Trikalinos, Lau, Trow and Schmid2012).
Since existing trials did not adjust their outcome variable according to baseline values, non-covariate-corrected means were included as estimates of the effects of the current study. As a sensitivity analysis, we repeated the analysis with (baseline BDI-II and EQ-5D) corrected post-treatment BDI-II score. The same set of four studies was used to perform trial sequential analysis on the BDI-II. Following Jakobsen et al. (Reference Jakobsen, Hansen, Simonsen, Simonsen and Gluud2012), we conducted two analyses; one with a minimal relevant difference of 4 BDI points and 80% power, and one with more strict presumptions (BDI difference of 3 points and 90% power). Both analyses were based on a type I error of 5% and on the variance of all trials. Similar to the meta-analysis, effects of both non-covariate-corrected as well as covariate-corrected means as estimates of the effects of the current study were explored. In addition, folowing Jakobsen et al. (Reference Jakobsen, Hansen, Simonsen, Simonsen and Gluud2012), bias risk was assessed with regard to sequence generation, allocation concealment, intention-to-treat analysis, blinding, drop-out, outcome measure reporting, presence of economic and academic bias (see online Data Supplement V for a full description of the criteria). An independent raterFootnote 9 checked the generated table entries for accuracy.
Results
Description of the sample
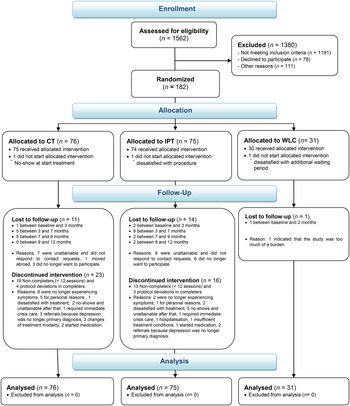
Patient flow is shown in Fig. 1. Of the 1562 patients who were initially screened for eligibility, 1191 did not meet inclusion criteria [mainly because of the use of antidepressant medication (n = 362) or MDD not being the primary diagnosis (n = 434)], 78 patients met inclusion criteria but declined to participate, and 111 were excluded for other reasons. A total of 182 patients were randomized (n = 76, n = 75, n = 31 for CT, IPT and WLC, respectively).
Patient flow chart.

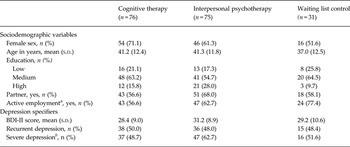
Pre-treatment characteristics of the total sample stratified according to condition are displayed in Table 1. There were no relevant differences between the patients in the two treatment conditions combined and the WLC condition for any of the sociodemographic variables or depression specifiers. However CT and IPT showed considerable differences on the BDI-II and EQ-5D. Therefore, we controlled for this in all analyses. Mean age in the total group was 41.2 (s.d. = 12.1) years and 100 participants (66.2%) were female. Mean baseline BDI-II score was 29.8 (s.d. = 9.0) and 49% of the patients were diagnosed with recurrent depression. More than half of the patients (55.6%) suffered from severe depression (BDI-II score ≥29) and the majority (59.6%) was still actively employed.
Pre-treatment characteristics of the total sample (n = 182) stratified according to condition

BDI-II, Beck Depression Inventory, second edition.
a Data unavailable for CT (n = 1).
b BDI-II score ≥29.
Therapists
The 10 therapists (five for each intervention) who participated in the study were licensed psychologists, psychotherapists and psychiatrists. They ranged in age from 24 to 47 years and 80% were female. At study onset, therapists had an average of 9.1 (s.d. = 5.4) years of clinical experience (range 4–21 years). Each therapist treated between 7 and 30 patients, except for one therapist who left the clinical site after treating only two patients. No differences were found between the CT and IPT therapists with regard to years of experience (t 8 = 1.76, p = 0.12) or the number of patients treated (t 7 = 0.07, p = 0.95)Footnote 10 .
Treatment and study compliance, and treatment integrity
Recruitment took place from February 2007 to April 2012. Treatment was delivered until December 2012. Follow-up data was complete in April 2013. At treatment termination, 117 patients (78%) in the active groups completed at least 12 sessions of therapy, with the mean number of sessions being 17 (s.d. = 2.9) in both conditions. There were no significant differences in session scheduling between CT and IPTFootnote 11 . Of the 34 patients that attended fewer than 12 sessions, eight were early completers (<12 sessions because they were no longer experiencing symptoms), two (one per condition) never started treatment (zero sessions), and the remaining 24 withdrew or were lost to follow-up. Non-completion rates were similar for the two intervention groups. There were no baseline differences between (early) treatment completers and non-completers.
Quality of therapy was rated as being (very) good to excellent in 83.3% of the CT tapes. For IPT this was 90.4%. Analysis of CSPRS-6 scores revealed significant differences in therapy-specific behaviour between conditions, indicating that therapists adhered to protocol. CT-specific behaviour was significantly more evident in CT than in IPT (mean score of 80.80 v. 52.42, t 79.21 = 7.23, p < 0.001). Scores on IPT subscales in turn, were higher in IPT than in CT (85.75 v. 44.57, t 86.96 = 10.79, p < 0.001). No significant differences between therapists were found. Mean intraclass correlation coefficient (ICC) across subscales of double-rated tapes was 0.63 (range 0.50–0.75).
The percentages of participants in the active conditions completing all assessments at 3 and 7 months were 98% and 89%, respectively. Follow-up assessments at 9 and 12 months were completed by 85% of the patients. Patients lost to follow-up were significantly younger (36 v. 42 years; t 149 = 2.13, p = 0.03) and more severely depressed at baseline (33.5 v. 29.0; t 149 = 2.29, p = 0.02) compared to patients who completed all assessments. No significant differences in attrition rates emerged across conditions (see Fig. 1).
Treatment outcomes
Descriptive statistics
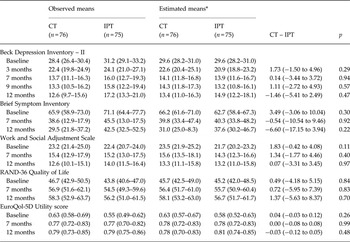
Table 2 presents the observed mean (95% CI) scores and corrected mixed-model estimated means (95% CI) on all outcome measures at each time-point in the treatment groups CT and IPT (n = 151). Estimated means from mixed regression are more valid than observed values because they correct for baseline BDI-II and EQ-5D differences and take missing values into consideration.
Observed mean scores (95% CI), corrected mixed regression-based estimated means (95% CI) and mean differences (95% CI, p) between CT and IPT for all outcome measures in the intention-to-treat sample (n = 151)

CT, Cognitive Therapy; IPT, Interpersonal Psychotherapy; CI, confidence interval.
* Mixed regression-based estimated means corrected for BDI-II and EQ-5D baseline scores (except for models in which BDI-II or EQ-5D were dependent variables); Mean difference scores (95% CI, p) are based on the corrected mixed-model estimates because they are more valid than observed values because they correct for baseline BDI-II and EQ-5D differences and take missing values into consideration; Data unavailable for 3, 17, 23, and 25 patients at 3, 7, 9, and 12 months, respectively.
Results on primary and secondary outcome measures
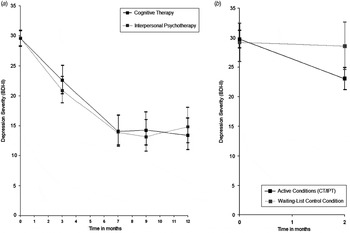
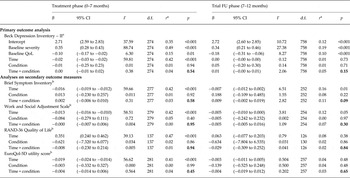
Table 3 shows the final models of the mixed regression analysis on the primary and secondary outcomes in the treatment phaseFootnote 12 and in the follow-up. All time × condition interactions were non-significant, indicating that there were no differential effects in symptom reduction between the two intervention groups. In line with this, no group differences were found on the mean scores at each time point (see Table 2). The analysis of the basic model (time, condition, time × condition controlling for baseline BDI-II and EQ5D) on the primary outcome BDI-II further showed a significant main effect of time in the treatment phase, indicating that depressive symptoms significantly decreased during treatment. The non-significant effect of time in the follow-up phase shows that BDI-II scores remained stable up until 5 months after finishing treatment. A graphic representation of change in depressive symptoms over time as measured with the BDI-II is shown in Fig. 2 a. Analyses on secondary outcomes yielded a similar pattern of results, except for the BSI which also showed a significant effect of time in the follow-up phase (see Table 3).
Course of depression over time. (a) Mixed regression-based estimated means and 95% confidence interval (CI) (corrected for baseline severity and quality-of-life utility score) for the Beck Depression Inventory – II at baseline, 3, 7, 9 and 12 months for cognitive therapy (CT) and interpersonal psychotherapy (IPT). (b) Mixed regression-based estimated means and 95% CI for the Beck Depression Inventory – II at baseline and 2 months for the active conditions (CT/IPT) combined and the waiting-list control condition.

Results of analyses on primary and secondary outcome measures in the treatment phase (0–7 months) and trial follow-up phase (7–12 months)

CI, Confidence interval; FU, follow-up.
a Mixed models gamma regression with log-link on Beck Depression Inventory – II (BDI-II)+1; Baseline severity is standardized BDI-II score at baseline; Baseline Quality of Life (QoL) is standardized EQ-5D utility score at baseline; Condition is CT v. IPT, centred at −0.5 and 0.5, respectively; Time is the linear trend in weeks, with week = 0 at 7 months for the treatment phase and week = 0 at 12 months for the trial FU phase; Time effects in the treatment phase represent change from baseline to 7 months; Time effects in the trial FU phase represent change from 7 to 12 months; Condition main effects represent the difference between conditions at 7 months in the treatment phase and 12 months for the trial FU phase.
b Mixed model regression on RAND-36 Quality of Life; Mixed models gamma regression with log-link on Brief Symptom Inventory (BSI)+1, Work and Social Adjustment Scale (WSAS)+1; (−1 × EQ-5D utility score+1.01) × 100. Condition is CT v. IPT, centred at −0.5 and 0.5, respectively; Time is the linear trend in weeks, with week = 0 at 7 (respectively 12) months; Time effects represent change from baseline to 7 months (respectively 7–12 months), Condition main effects represent the difference between conditions at 7 (respectively 12) months. All models are controlled for standardized baseline BDI-II and EQ-5D scores (except for model in which EuroQol was the dependent variable).
* Effect size r = √(F/(F+df)); Data unavailable for 3, 17, 23, 23, 23, 25, and 25 patients at 3, 7, 8, 9, 10, 11 and 12 months, respectively.
Effect sizes
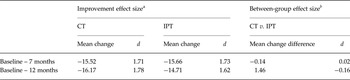
Corrected mixed-model estimates and effect sizes (Cohen's d with baseline s.d.) of within- and between-condition changes of the final models are presented in Table 4. Within-group effect sizes at the end of the treatment phase were large in both groups (>0.80, Cohen, Reference Cohen1988), and remained stable after that. Between-group effect sizes were small.
Corrected mixed-model estimates of within and between condition changes and Cohen's d based on the BDI-II

BDI-II, Beck Depression Inventory – II; CT, cognitive therapy; IPT, interpersonal psychotherapy.
a (M t0−M ti )/s.d. t0.
b Difference in improvement effect sizes between two groups; all models corrected for baseline severity and baseline quality of life utility score.
Moderation analyses
The moderation analysis of baseline severity (BDI-II) in the acute phase (results not shown in Table 3) did not show a time × condition × baseline severity interaction (F 1,755 = 0.05, p = 0.83). After removing the three-way interaction from the model, the two-way interaction between treatment condition and baseline severity was still not significant (F 1,757 = 1.10, p = 0.29), indicating that baseline severity did not moderate treatment outcome in the acute phase. The effect of therapist was not significant either (F 1,267 = 0.35, p = 0.93; see online Data Supplement II), indicating that individual differences between therapists did not influence treatment outcome. In addition, adjustment for number of sessions or potential confounds (gender, work, and marital status) did not affect the results in (see online Data Supplement II). In the follow-up phase, adjustment for baseline severity, as well as for the other potential confounds (total number of sessions, therapist, gender, work, and marital status) did not affect the results of the effectiveness analysis as well (see online Data Supplement III).
Active treatment groups v. waiting list
Response to therapy exceeded response in the WLC condition. Patients in the WLC condition showed minimal changes in depression severity across the 2-month waiting list period, suggesting that there was no spontaneous recovery (see Fig. 2 b). Improvement in the active treatment conditions after 2 months of therapy (mean number of sessions: 6.5, s.d. = 1.7) was significantly larger (mean BDI-II change difference between active conditions combined and WLC condition: 6.16, t 173 = 2.47, p < 0.02, 95% CI 1.21–10.05, r = 0.18).
Response and remission
A complete overview of the observed and mixed regression based estimated response and remission rates of participants in each group for each time point, can be found in online Data Supplement IV. Overall, observed clinical improvement after 3 months was modest, yielding remission in 13% of the patients. After 7 months, remission in the total sample was 34%. Remission rates of 37% at 9 and 12 months show that treatment effects remained stable after treatment termination. Even though mixed regression analysis yielded lower remission rates at 3 months, results at subsequent assessment points resembled those of the observed values. There were no significant differences between the two intervention groups (all p's > 0.12). The trend in favour of CT on the observed remission rates at 12 months (42.1% v. 32.0%) disappeared after controlling for baseline differences in the mixed model analysis.
Relative contribution to the field
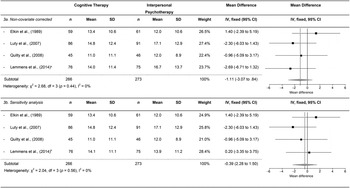
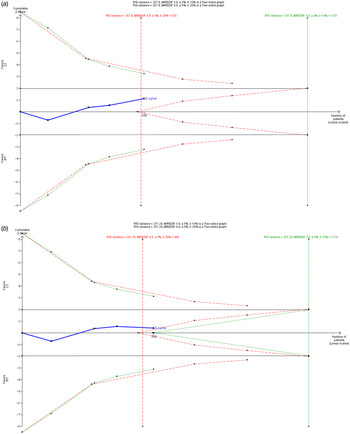
Meta-analysis with the random-effects model on non-covariate-corrected post-treatment BDI data from the four trials that compared individual CT and IPT (i.e. Elkin, Luty, Quilty, Lemmens) showed no significant differences between the two interventions [mean difference in favour of CT = 1.1 BDI(-II) points, 95% CI −3.07 to 0.84; see Fig. 3 a]. A second analysis using covariate-corrected estimated means for the current study showed smaller differences between the two groups (see Fig. 3 b). Trial sequential analysis on these four trials – using the non-covariate-corrected means as estimates of the effects of the current study – based on a minimal relevant difference of 4 BDI points and 80% power, showed that the futility boundary was crossed (minimal required information size of n = 526, total n = 539). This indicates that our study provided the final information necessary to conclude equivalence of CT and IPT, within a 4-point limit (see Fig. 4 a). Analysis with more strict presumptions (3-point BDI difference and 90% power) indicated that more data (total n = 1251) is needed to definitively settle the question of a differential effect. Analyses using covariate-corrected means yielded similar results (see Fig. 4 b; required information sizes of n = 494 and n = 1174 for the lenient and strict procedures, respectively). Assessment of bias risk indicates that our study meets the majority of criteria for low-risk trials (see online Supplementary data file V).
Post-treatment effect of cognitive therapy v. interpersonal psychotherapy on the Beck Depression Inventory [random-effects model using the unstandardized mean difference score with a 95% confidence interval (CI)]. (a) Since existing trials did not adjust their outcome variable according to baseline values, non-covariate-corrected means were included as estimates of the effects of the current study. (b) As a sensitivity analysis, we repeated the analysis with (baseline BDI-II and EQ-5D) corrected post-treatment BDI-II scores. s.d., Standard deviation; IV, inverse variance; df, degrees of freedom. a Non-covariate-corrected estimated means; b covariate-corrected estimated means.

Trial sequential analysis (TSA) of the cumulative meta-analysis of the effect of cognitive therapy (CT) v. interpersonal psychotherapy (IPT) for depression on the Beck Depression Inventory (BDI). (a) TSA using non-covariate-corrected means as estimates of the effects of the current study; the required information size of 526 participants (red/dotted lines) is calculated based on an intervention effect compared with IPT of 4 BDI points, and a power of 80%. With these presumptions, the cumulated Z curve (blue/bold curve) crosses the futility boundary, implying that there are no significant differences in effect between the two interventions and no more trials are needed. The required information size of 1251 (green/etched lines) is calculated based on an intervention effect compared with IPT of 3 BDI points, and a power of 90%. With these presumptions, the cumulated Z curve (blue/bold curve) does not cross the trial sequential monitoring boundaries, implying that there is no firm evidence for a beneficial effect of CT compared with IPT. Both analyses based on a variance of 267.8 and a risk of type I error of 5%. (b) TSA using covariate-corrected means (baseline BDI-II and EQ-5D) as estimates of the effects of the current study; the required information size of 494 participants (red/dotted lines) is calculated based on an intervention effect compared with IPT of 4 BDI points, and a power of 80%. With these presumptions, the cumulated Z curve (blue/bold curve) crosses the futility boundary, implying that there are no significant differences in effect between the two interventions and no more trials are needed. The required information size of 1174 (green/etched lines) is calculated based on an intervention effect compared with IPT of 3 BDI points, and a power of 90%. With these presumptions, the cumulated Z curve (blue/bold curve) does not cross the trial sequential monitoring boundaries, implying that there is no firm evidence for a beneficial effect of CT compared with IPT. Both analyses based on a variance of 251.3 and a risk of type I error of 5%.

Discussion
Main results
In this study it was found that CT and IPT do not differ in the treatment of depression in the acute phase and beyond. By demonstrating that both treatments exceeded response in the WLC condition and led to considerable improvement in depressive symptoms that was sustained 5 months beyond the end of treatment, our study does not only replicate, but also extends findings of other RCTs that examined individual CT and IPT head-to-head (Elkin et al. Reference Elkin, Shea, Watkins and Imber1989; Luty et al. Reference Luty, Carter, McKenzie, Rae, Frampton, Mulder and Joyce2007; Quilty et al. Reference Quilty, McBride and Bagby2008). A substantial number of patients (67%) responded to therapy, and the overall improvement in depressive symptoms as assessed with the BDI-II was about 50% in each group. At the end of the 7-month treatment phase, 34% of patients were in remission. Even though this is lower than the rates of response, it is within the range of reported effects in RCT efficacy contexts (Keitner et al. Reference Keitner, Ryan and Solomon2006). However, it does indicate that the majority of patients experienced residual symptoms at the end of treatment, making them vulnerable for relapse. Pre- to post-treatment effect sizes in our trial were within range of those reported by Elkin et al. (Reference Elkin, Shea, Watkins and Imber1989), Luty et al. (Reference Luty, Carter, McKenzie, Rae, Frampton, Mulder and Joyce2007), and Quilty et al. (Reference Quilty, McBride and Bagby2008). It should be noted that our treatment phase was somewhat longer than in other trials, which gave patients more time to improve. Therapist effects were found to be non-significant, indicating that experienced therapists in a research-oriented routine clinical setting who receive additional training and are carefully monitored throughout, show comparable results. This is in line with previous research by Crits-Christoph et al. (Reference Crits-Christoph, Baranackie, Kurcias, Beck, Carroll, Perry, Luborsky, McLellan, Woody, Thompson, Gallagher and Zitrin1991) that concludes that therapist effects are more likely to be found in outcome studies with minimal training and supervision.
Change in our trial occurred later in time than in other (often US-based) trials. A direct comparison at 2 months shows an average drop of only 6 BDI-II points in the current study compared to 10–15 points in other trials (Jarrett et al. Reference Jarrett, Schaffer, McIntire, Witt-Browder, Kraft and Risser1999; Dimidjian et al. Reference Dimidjian, Hollon, Dobson, Schmaling, Kohlenberg, Addis, Gallop, McGlinchey, Markley, Gollan, Atkins, Dunner and Jacobson2006). An explanation might be the difference in session frequency. In The Netherlands, patients receive treatment mostly once a week, whereas in US (efficacy) trials, this is mostly twice a week, especially in the first phase of treatment. It is expected that an increase from one to two sessions per week in the initial phase of treatment, while keeping the total number of treatment sessions constant, explains the differences in early response rates, whereas post-treatment results remain similar. Furthermore, in contrast to previous findings, baseline severity did not moderate the effect of time and condition. However, this effect has been mainly established in comparisons between active treatments v. non-specific controls (Driessen et al. Reference Driessen, Cuijpers, Hollon and Dekker2010; Fournier et al. Reference Fournier, DeRubeis, Hollon, Dimidjian, Amsterdam, Shelton and Fawcett2010). We would not expect such differences between the two active treatments, unless they differed in quality of treatment delivered, which was not the case in the current study.
Methodological considerations
This study has both strengths and limitations. First, our study is one of the largest clinical trials in the field. With a sample size of n = 151 in the active groups, we provided the final information necessary to conclude equivalence of individual CT and IPT for adult depression within a 4 BDI-point limit. Furthermore, it is the first study that replicates research results obtained in the USA and New Zealand in a European sample, and it thereby extends knowledge about the relative effectiveness of these treatments around the world. In addition, our study was the first to add a WLC condition to a randomized comparison of CT and IPT. The inclusion of an untreated control group diminished uncertainty about whether or not the observed effect was a result of natural course. Given that the WLC condition showed minimal spontaneous remission, the within-condition estimates of the active groups are good estimators of the true effects of CT and IPT. With 85% of patients providing data at the 12-month assessment, attrition rates were low. We therefore are confident that only minimal biases occurred as a result of missing data. By training therapists in a research-oriented routine clinical setting we took care of both the trial's quality as well as generalizability of the trial findings. Other strengths include a broad range of outcomes, the use of modern statistical techniques, intention-to-treat analyses, assessment of bias risk, and an extensive integrity check. However, with regard to the integrity check, it should be noted that even though the overall ICC was acceptable, the range was somewhat less satisfactory, which is a limitation of the present study.
Some other limitations should be mentioned as well. First, as outlined by Cuijpers et al. (Reference Cuijpers, Li, Hofmann and Andersson2010) it is important to include both clinician-rated and self-report measures of depression to assess improvement in depressive symptoms over the course of psychotherapy. Although structured diagnostic interviews ensured accurate classification of patient's diagnoses at baseline, all follow-up measures were based on self-report. We therefore have no information on actual diagnoses at follow-up. Furthermore, inter-rater reliability data on the SCID-I diagnoses is lacking. Third, the duration of the WLC condition was significantly shorter than the treatment time. Therefore a comparison of the full effects of treatment v. no treatment was not possible. However, given the study population (patients with major psychopathology who already applied for treatment on their own accord), and the distress and risks related to depression, we considered it unethical to include a full WLC condition. We therefore decided to include a waiting list that was as short as possible. Fourth, because we used a fixed post-treatment assessment and allowed flexibility in scheduling treatment sessions, not all patients finished treatment within the 7-month treatment phase. As a result, the score they provided at the 7-month assessment is a reflection of their progress up until that point, and cannot be considered an absolute post-treatment score. However, because these patients were in the final stage of therapy and only received one or two additional sessions on average, we do not think that this has led to marked changes in outcomes. This was further underlined by the results at 9 months, the point by which all patients had finished treatment, which yielded the same pattern of results. Furthermore, the exclusion of patients receiving concomitant treatment, and those using antidepressant medications in particular, may have reduced generalizability to the whole population of treatment-seeking depressed patients. However, because medication is not a preferred option for initial treatment of episodic depression in The Netherlands (see Spijker et al. Reference Spijker, Bockting, Meeuwissen, van Vliet, Emmelkamp, Hermens and van Balkom2013), only a small group was excluded from the trial for this reason. We therefore think that the negative effects on generalizability for the Dutch situation are relatively small. However, it should be noted that this is probably different for countries in which the use of medication plays a more prominent role in the treatment of MDD. Last, we did not control for multiple testing on the secondary outcomes.
Clinical implications and future research
The present study is the fourth to conclude that no significant differences could be detected between individual CT and IPT in treating depression in the acute phase across the full range of severity. What does this mean for clinical practice? Although it may seem attractive to shift the focus to cost-effectiveness, we think that this would be too early because several crucial aspects for treatment evaluation are still unknown. First of all, existing studies are powered to demonstrate a medium effect between conditions at a modest power level (e.g. 80%). This leaves room for smaller differences between the two approaches that could not be detected. True equivalence trials are necessary to test whether CT and IPT are really equivalent. However, it should be noted that these studies usually require very large sample sizes (depending on what difference is viewed as clinically relevant), and therefore are a challenge in itself. Furthermore, in spite of general equality of treatments, it might be the case that one treatment is superior to the other with regard to certain subgroups of depressed patients. It is therefore important to identify (patient) characteristics that predict differential treatment response. Unfortunately these moderators and predictors of treatment success are still largely unknown. In addition, the fact that therapies that show a distinguishable theory and use specific therapeutic techniques do not necessarily lead to specific outcomes, calls for specification of their underlying mechanisms. One could argue that different specific pathways lead to similar results (specificity hypothesis). However, it is also possible that change is driven by more common factors such as motivation and therapeutic alliance (non-specificity hypothesis). Process research is needed to settle this question (Kazdin, Reference Kazdin2009). Finally, existing studies, including the present, only focus on the short-term effectiveness. It might be the case, however, that even though both treatments are equally effective in the acute phase of treatment, differences will come forward in the long-term with regard to relapse prevention. It is therefore also important to examine long-term effects more closely, which we plan to do in a subsequent paper.
Supplementary material
For supplementary material accompanying this paper visit http://dx.doi.org/10.1017/S0033291715000033.
Acknowledgements
This research is funded by the research institute of Experimental Psychopathology (EPP), The Netherlands, and the Academic Community Mental Health Centre (RIAGG) in Maastricht, The Netherlands. Both organizations have no special interests in specific outcomes of the trial. We acknowledge the contribution of participating patients and therapists at RIAGG Maastricht. Without their cooperation the trial would have been impossible to conduct. Furthermore, we gratefully thank Annie Raven and Annie Hendriks for their assistance during the study. In addition we also acknowledge Carolien Christ, Kosse Jonker, Meike Krüger and Dina Snippe for their contributions to the treatment integrity check; Heleen van Teeseling for her earlier contributions to the study; and Rosanne Janssen for the development of the infrastructure for online data collection.
Declaration of Interest
None.