Introduction
Eighteenth century London has been an important area of study in historical demography and epidemiology because of the dramatic changes in mortality that took place in the population. During the eighteenth century the population of London grew rapidly in size and density through a combination of high rates of immigration and fertility. This was combined with increasing mortality from the beginning to the late 1700s as shown in the London Bills of Mortality, which recorded weekly data on deaths in each parish. In the first half of the eighteenth century, over 400,000 more burials than baptisms took place in London (Landers, Reference Landers1990). There is a consensus that seventeenth and eighteenth century childhood mortality in London was greatly in excess of the rates in other English parishes during the same period (Landers, Reference Landers1990; Galley & Shelton, Reference Galley and Shelton2001). By the 1860s, however, infant mortality rates in London had decreased dramatically (Landers, Reference Schellekens1990; Schellekens, Reference Schellekens2001), although the estimated mortality rates and the magnitude of decline in mortality over this period vary according to the method of calculation (Woods, Reference Woods2006). The relative mortality of male and female infants is poorly documented in London during this important period of demographic and economic transition.
Infant mortality rates provide an important marker of population health and well-being, both in contemporary and historical studies (Galley & Shelton, Reference Galley and Shelton2001; Galley, Reference Galley2009). Studies of infant mortality commonly partition deaths into those that are due to causes prior to, or associated with, birth (endogenous mortality) and those that can be attributed to the postnatal environment (exogenous mortality) (Bourgeois-Pichat, Reference Bourgeois-Pichat1951; Lewis & Gowland, Reference Lewis and Gowland2007). Deaths in the neonatal period (0–27 days) are more likely to be caused by endogenous factors such as inborn diseases, congenital abnormality, birth trauma or pre-term birth. Postneonatal infant deaths (28 days to 1 year), in contrast, are more likely to have exogenous causes, such as infectious disease, feeding behaviours, malnutrition and poor living conditions.
Bourgeois-Pichat (Reference Bourgeois-Pichat1951) devised the biometric method as a way of separating infant mortality into endogenous and exogenous components based on the age structure of infant mortality. The biometric method plots the cumulative mortality of infants against age (expressed as [log(n+1)]3), where n is age in days, and this has been observed to produce an approximately linear plot from the ages of 1–12 months. Extrapolation of a linear trend backwards to age zero (the y-intercept) can be used to partition neonatal mortality into endogenous and exogenous deaths. Estimated endogenous mortality is indicated by the intercept of the extrapolated line at age zero. Estimated exogenous infant mortality in the first month is calculated by subtracting estimated endogenous mortality from the total number of deaths up to the age of 1 month. Historical studies have explored the use of the biometric method to differentiate between endogenous and exogenous deaths in situations where the individual causes of death are not known (Landers, Reference Landers1993; Galley & Woods, Reference Galley and Woods1999, Scott & Duncan, Reference Scott and Duncan1999). An underlying assumption is that all deaths after 1 month are due to exogenous factors. Contemporary data show that deaths due to endogenous causes, such as congenital anomalies of the heart, birth asphyxia and hypoxia, do occur after 28 days (WHO, 2011). The extension of endogenous mortality beyond the first month of life is largely due to recent advances in medical care (London, Reference London1993). In historical populations, which lacked a high standard of neonatal care, it is likely that the majority of deaths due to endogenous causes would have occurred within the first month of life.
One application of the biometric model has been to detect and correct for under-registration in parish records, based on the premise that a lower than realistic estimate of endogenous mortality implies an under-registration of infant deaths resulting in a deflated estimate of infant mortality (Wrigley, Reference Wrigley1977). Under-enumeration of the number of births is likely to be a problem where the number of live births is inferred from registered baptisms since those who died prior to baptism would not be included. The problem of under-registration is likely to have increased due to a lengthening of the interval between birth and baptism between the 18th and 19th centuries (Midi Berry & Schofield, Reference Midi Berry and Schofield1971; Wrigley, Reference Wrigley1977; Smith & Oeppen, Reference Smith, Oepen, Garrett, Galley, Shelton and Woods2006). As the age of baptism increased across the eighteenth century, it became more common to bury unbaptized infants within church grounds, but not record their deaths in the burial register (Wrigley et al., Reference Wrigley, Davies, Oeppen and Schofield1997). As a result under-enumeration of the number of deaths, particularly those of young infants, would have increased. This application relies on the original premise of the biometric model that the proportion of neonatal to postneonatal exogenous deaths in infancy is constant and invariant (Bourgeois-Pichat, Reference Bourgeois-Pichat1951).
In practice biometric plots may deviate from linearity (Knodel & Kintner, Reference Knodel and Kintner1977; Scott & Duncan, Reference Scott and Duncan1999; Galley & Shelton, Reference Galley and Shelton2001) implying that the age structure of infant mortality between 1 and 12 months is variable. In this situation estimates of endogenous mortality (the y-intercept) vary according to which data points are used for the extrapolation (Bourgeois-Pichat, Reference Bourgeois-Pichat1951; Knodel & Kintner, Reference Knodel and Kintner1977; Lynch et al., Reference Lynch, Greenhouse and Brandstrom1998). Whilst some authors have argued that the model is invalidated since the underlying assumptions do not always hold (e.g. Lynch et al., Reference Lynch, Greenhouse and Brandstrom1998; Galley & Shelton, Reference Galley and Shelton2001), others have focused on the potential explanatory value of the exceptions. Knodel & Kintner (Reference Knodel and Kintner1977) demonstrated a close relationship between the cumulative age structure of infant mortality and nursing behaviour using data from late 18th and early 19th century cities in Germany and the US. According to their model, a population of infants that is predominantly breast-fed will have lower than expected cumulative mortality in the first 6 months of life relative to that from 6–12 months, whereas a population with low rates of breast-feeding will have higher than expected cumulative mortality from 0–6 months of age relative to that from 6–12 months. Similarly, a sudden increase in infant mortality at a particular age (as indicated by changes in the slope of the cumulative mortality curve) may indicate the abrupt cessation of breast-feeding (Knodel & Kintner, Reference Knodel and Kintner1977). The implication of this study is that the age structure of infant mortality can be used to infer nursing behaviour when transformed according to the biometric method (Knodel & Kintner, Reference Knodel and Kintner1977; Sawchuk et al., Reference Sawchuk, Herring and Waks1985; Herring et al., Reference Herring, Saunders and Katzenberg1998).
The most reliable estimates of infant mortality prior to the introduction of civil registration of birth and deaths in 1837 are based on family reconstitution studies (Wrigley et al., Reference Wrigley, Davies, Oeppen and Schofield1997). These require a careful linkage between baptisms and infant deaths, as recorded in the burial register. The linking process may be difficult and unreliable where populations are residentially mobile since the baptisms and burials of individuals, siblings and different generations of the same family may have been registered in different parishes. Moreover, the small size of many London parishes meant that moving house would often result in moving across a parish boundary (Finlay, Reference Finlay1981). For this reason, most family reconstitution studies have been undertaken on rural parishes although even in rural areas, the process is time-consuming and not always successful (Galley & Shelton, Reference Galley and Shelton2001). The effect of high residential mobility in London, combined with high rates of inward migration, has mitigated against family reconstitution studies (Smith & Oeppen, Reference Smith, Oepen, Garrett, Galley, Shelton and Woods2006). Exceptions to this include the partial reconstitution of eight London parishes from 1580 to 1650 (Finlay, Reference Finlay1981) and a detailed analysis of infant mortality in Cheapside and Clerkenwell between 1600 and 1753 based on family reconstitution (Newton, Reference Newton2011). Most previous estimates of infant mortality in London relied on the Bills of Mortality or the records from sub-populations such as the Quakers (Landers, Reference Landers1993). The Bills of Mortality are considered to under-enumerate deaths (due to burials taking place outside London) and births (due to some infants not being baptized or dying before baptism) (Woods, Reference Woods2006). A further limitation of studies employing the Bills of Mortality is that all deaths of children aged less than 2 years were grouped together, so the proportion of infants within this age group has to be estimated.
Few studies, either within or outside London, have analysed the mortality profiles of male and female infants separately in the period prior to the introduction of Civil Registration in 1837. The London Bills of Mortality did not distinguish between male and female infants and studies of infant mortality in other parishes or sub-populations did not examine male and females separately (Newton, Reference Newton2011; Landers, Reference Landers1993). An analysis of male and female mortality rates in London during 1580–1650 observed higher male infant mortality in poorer parishes of London, but no sex differences in infant mortality in wealthier parishes (Finlay, Reference Finlay1981). The interpretation of these results is complicated by the common practice in wealthier households during this period of sending infants away to be wet-nursed, and the deaths of these infants not being recorded within the parish of birth (Finlay, Reference Finlay1981). A family reconstitution study for the Parish of Penrith evaluated separate male and female mortality in six intervals covering the period 1557 to 1812 (Scott & Duncan, Reference Scott and Duncan1999). Application of the biometric model to these data revealed that the progressive improvement in mortality rates in both sexes was caused primarily by a reduction in endogenous mortality, although male infant mortality was higher than that of females in each cohort. Wrigley et al. (Reference Wrigley, Davies, Oeppen and Schofield1997) examined mortality of males and females in infancy and childhood from 1580 to 1837 for 26 English parishes, all of which were outside London. This study provided some evidence of excess male mortality, particularly during the period from 1750 to 1774, with a male:female mortality ratio of 1.13 (Wrigley et al., Reference Wrigley, Davies, Oeppen and Schofield1997).
Given the importance of the demographic changes in London during the eighteenth and early nineteenth century, and paucity of information on male–female infant mortality ratios during this period, the aim of this paper is to examine sex-specific changes in infant mortality from burial and baptism registers. A further aim of the paper is to consider changes in male and female infant mortality in relation to the biometric model to understand the contribution of exogenous and endogenous factors to infant mortality, and to infer possible changes in infant feeding patterns over this period. Male infants have an inherent biological susceptibility to mortality at all ages compared with females, but this is particularly pronounced in early life. This underlying pattern of mortality, however, may be significantly influenced by infant feeding, weaning and health care behaviours for male and female infants, practices that are often socially and culturally determined (Waldron, Reference Waldron1983, Reference Waldron1987).
The focus of this investigation is the parish of Christ Church Spitalfields, situated to the east of the City of London. This parish was chosen as a case study to examine the effects of the dramatic demographic and economic changes within London on patterns of infant mortality and sex differences in infant mortality during the demographic transition. A further reason for choosing the parish of Christ Church was that the parish records consistently recorded the age at death in the burial registers for the entire period of parochial registration. This information is available for very few London parishes, as well as being rare nationally (Finlay, Reference Finlay1981). The parish was created when Christ Church was consecrated in 1729 following a period of rapid urban expansion and industialization. Spitalfields served as the centre of the English silk industry throughout the 18th century, providing employment and a degree of prosperity, but the area went into decline as the silk industry went through a series of depressions and eventually faltered due to cheaper production elsewhere (Molleson & Cox, Reference Molleson and Cox1993). Despite the economic opportunities afforded by the flourishing silk trade, Christ Church Spitalfields clustered with other London parishes exhibiting high mortality for the period 1750–59 (Landers, Reference Landers1993). The latter half of the 18th century saw various measures aimed at improving paving, lighting and sanitation, but conditions worsened in the 19th century due to increased population, overcrowding and a deterioration of housing stock (Cox, Reference Cox1996).
Methods and Results
Copies of the burial and baptism registers for Christ Church Spitalfields are stored at the Metropolitan Archive in London. Burial records for Christ Church Spitalfields began in 1729 and ceased around 1852 with the prohibition of intramural burials (Molleson & Cox, Reference Molleson and Cox1993; Reeve & Adams, Reference Reeve and Adams1993). Each entry in the burial register records the family and given name of the individual buried, their age at death in years, months or days and typically their residential address. Buried individuals were inferred to be male or female on the basis of their given names. Three 10-year periods of burials (1750–1759, 1790–1799 and 1830–1839) were selected to represent early, middle and late samples from the documented period. Records for the three separate 10-year periods were transcribed onto an Excel database. The completed database contains details of more than 15,000 burials (Bello & Humphrey, Reference Bello and Humphrey2007). A reduced dataset comprising information from burial records for 2720 individuals who died during infancy was used to determine the age distribution of infant deaths and for application of the biometric model. Age at death for infants was recorded in months, weeks or days, and in a few cases in hours. There is some indication of age heaping around whole weeks or months, but no age heaping on a quarter-year basis. Stillborn infants were excluded from all analyses.
The number of baptisms recorded in the church registers was calculated for the same 10-year periods (1750–59, 1790–99 and 1830–39) as a proxy indicator of the number of births within the Spitalfields district. In total, 2934 baptisms were registered at Christ Church Spitalfields from 1750–59, compared with 3111 from 1790–99 and 4280 from 1830–39. Each entry in the baptism register includes the family and given name of the individual baptized, the names of their parents, occupation of the father and residential address.
Within each of the three periods, one full calendar year (1759, 1799 and 1839) was fully transcribed in order to identify the sex of the baptized infant. Infants were inferred to be male or female on the basis of their given name or names. There were only two baptism records where sex of the infant was uncertain. The baptisms in 1759, 1799 and 1839 showed a slight excess of male baptisms with male:female ratios of 1.08, 1.09 and 1.05 respectively (total baptisms for each year n=296, 322 and 293). The sex ratio at birth observed throughout contemporary populations in the absence of sex selection in utero or at birth is 1.06 (Maconochie & Roman, Reference Maconochie and Roman1997). The proportions of male:female baptisms at Christ Church Spitalfields in 1759, 1799 and 1839 were not significantly different from the expected value of 1.06 (chi-squared test=ns).
Studies of infant mortality through the use of burial and baptism records are subject to a number of methodological limitations relating to under-enumeration and possible bias in the extent of under-enumerations according to age or sex. Firstly, the number of baptisms is likely to under-enumerate the actual number of births since a proportion of infants are likely to have died prior to baptism. The extent of under-enumeration of infant births may have varied over time due to variations in the average age of baptism. Information concerning age at baptisms recorded at Christ Church Spitalfields altered over the period of study causing some differences in the data available for analysis. During 1750–59 the age of the infant at baptism was recorded in the register. For the period 1790–99 the date of birth and the date of baptism were both recorded in the register, allowing the calculation of age at baptism. In 1830–39 registers, only the date of baptism was reported, hence date of birth and age at baptism are unknown.
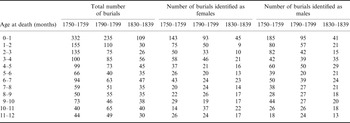
In 1759, the mean age at baptism for 276 infants was 18 days (mean 17.5 in males and 18.4 in females, median 17 days in boys and girls), with a range of 1–120 days. One child was baptized at the age three and a half years and was not included in the calculation of the mean. By 1799 the mean age at baptism had increased to 49 days for 297 infants baptized under the age of 1 year (mean 47.1 in males and 50.2 in females, median 28 and 26 days respectively), and a further fourteen children were baptized between the ages of 1 and 4 years. The increase in mean age at baptism between 1759 and 1799 could have led to a greater discrepancy between the actual and estimated number of births. The number of infants baptized in the first month of life declined from 92.1% in 1759 to 56.5% in 1799. During the 1750s the number of deaths of infants under 1 month was 332 compared with only 235 in the 1790s (Table 1). Theoretically, if no effort was made to baptize unhealthy infants, this could translate to 20 infants ‘missing’ from the baptism registers in the 1750s and 111 infants ‘missing’ from the baptism registers in the 1790s, resulting in a substantial difference in the extent of under-enumeration of births between periods.
Distribution of infant mortality by monthly age intervals

The shift towards a later age at baptism observed at Christ Church Spitalfields is consistent with a general trend towards an increased interval between birth and baptism between the early 18th and early 19th centuries, although there was substantial variation between parishes and over time (Midi Berry & Schofield, Reference Midi Berry and Schofield1971). The increase in age of baptism may reflect either a reduced sense of urgency resulting from a lower expectation of death or a reduced concern over the possible consequences of death occurring prior to baptism. It has also been suggested that families of less healthy infants with a high risk of dying would have made efforts to ensure that the infant was baptized prior to death (Herring et al., Reference Herring, Saunders and Katzenberg1998).
The number of infant deaths would have been under-enumerated if unbaptized infants were not recorded in the burial registers, and the distribution of infants deaths would have been biased against younger age groups. At Spitalfields, it appears that the burials of at least some unbaptized infants were registered. In total 85 infants or young children with no given name but with an age at death indicating a live birth were recorded in the registers. Four of these are unknown (foundlings or workhouse) and the rest are presumed to have been unbaptized. The majority (71/81) of these unbaptized infants were less than 1 month old. These burials represent 1.5% (5/332) of neonatal burials in the 1750s, 17.7% (42/235) of neonatal burials in the 1790s and 22.0% (24/109) of neonatal burials in the 1830s. The increase over time is likely to reflect the trend towards a later age of baptism. The total number of unbaptized infants and children represent 1.5% (6/1247) of burials in the 1750s, 5.2% (49/947) of burials in the 1790s and 4.9% of (26/526) of burials in the 1830s. It is possible that these infants would have been baptized at a later age if they had survived, so it cannot be assumed that these percentages reflect the percentage of unbaptized children in the community.
The increase in average age of baptism over time and the likelihood that at least some deaths of unbaptized infants were registered in all three periods both indicate a probable under-enumeration of births based on baptism records. The number of unbaptized infants in the burial register represents a minimum estimate of the extent of under-registration in each of the three periods. There was no significant difference between the mean age at baptism of male and female infants at Christ Church Spitalfields in both 1759 and 1799, suggesting that registration practices were the same for both sexes. The proportions of male:female baptisms in 1759, 1799 and 1839 were not significantly different from the expected sex ratio at birth of 1.06 in contemporary populations. While this does not rule out the possibility that there were differences in male and female mortality during the interval between birth and baptism it suggests that any such differences are small. The extent of under-enumeration of births is therefore likely to be the same between the sexes and should not confound relative estimates of male and female mortality.
A further possible source of bias in the burial records may result from the practice of sending infants away from their homes to be wet-nursed, which was common in wealthy families and for abandoned infants (Finlay, Reference Finlay1981; Newton, Reference Newton2011). Nursing infants who died in the care of their wet-nurses or during the journey from London were usually buried and recorded in the local parish, rather than in the city (Fildes, Reference Fildes1988). This would lead to an underestimation of the number of infant deaths relative to births. Information on the prevalence of wet-nursing during different periods is scarce, but there is some evidence to suggest that the practice was already far less common by the middle of the eighteenth century than in earlier periods (Newton, Reference Newton2011). The number of nurse-children buried in parishes around London declined steeply in the early eighteenth century reaching very low numbers by the 1750s (Fildes, Reference Fildes1988) suggesting either that living conditions had improved substantially, or more likely that fewer infants were being sent from London for wet-nursing by the mid-eighteenth century. Analysis of the 1695 Marriage Duty Assessment in conjunction with family reconstitutions revealed that more than 80% of expected children under 3 years were absent from wealthier households in Cheapside, suggesting nursing outside the parish (Newton, Reference Newton2011). Nevertheless changes in cumulative infant mortality suggest that the practice of sending infants away from the parish for nursing was already much diminished by the early eighteenth century (Newton, Reference Newton2011). During the mid- to late-eighteenth century it became fashionable for wealthy mothers either to raise their infants by hand, possibly employing a dry-nurse in the home, or to breast-feed their own infants (Fildes, Reference Fildes, Stuart-Macadam and Dettwyler1995). There is no evidence from the literature that rates of abandonment or the practice of sending infants away was different for male or female infants.
A further consideration when using church registers is that the baptism community of Christ Church Spitalfields may have been subtly different from the burial community. A gradual shift in these communities over time could cause an apparent reduction in infant burials that did not accurately reflect mortality patterns. The place of residence of the infants buried or baptized at Christ Church Spitalfields was examined in each 10-year period in order to determine whether these groups were drawn from equivalent areas. The address given in the burial or baptism register was used to determine whether individuals were resident in the parish of Christ Church Spitalfields, resident in a nearby parish or resident in a more distant parish. Nearby parishes were defined according to Cox (Reference Cox1996) and include Bethnal Green, Bishopgate, Mile End New Town, Stepney, Whitechapel and the two liberties of Norton Folgate and the Artillery Ground.
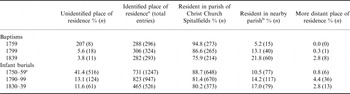
Individuals buried and baptized at Christ Church Spitalfields came predominantly from within the parish or from one of the adjacent parishes (Table 2). The percentage of baptisms represented by individuals resident within the parish declined from 94.8% in the 1750s to 75.9% in the 1830s and was offset by a rise in the percentage of baptisms from nearby parishes, such that the total percentage of baptisms of local residents remained above 97%. The proportions for infant burials are similar, with a slight decline in the percentage of burials of residents of the parish from 88.7% in the 1750s to 80.2% in the 1830s and a slight rise in the percentage of burials of residents of nearby parishes such that the total percentage of local burials remained above 95%. The addresses given in the burial and baptism registers for Christ Church Spitalfields reflect a predominantly local community but reveal a gradual increase in the percentage of both baptisms and burials of residents from more distant parishes over time. The fact that individuals were buried or baptized in Christ Church Spitalfields despite being resident elsewhere must reflect the existence of family or community ties that extended beyond the rigid constraints of the parish boundaries (Molleson & Cox, Reference Molleson and Cox1993).
Place of residence of infants buried or baptized at Christ Church Spitalfields

a This excludes entries where no address was entered or the address was illegible or could not be located on a map.
b Nearby parishes were defined according to Cox (1996) and include: Bethnal Green, Bishopgate, Mile End New Town, Stepney, Whitechapel and the two liberties of Norton Folgate and the Artillery Ground.
c Place of residence was not provided in registers before 1754.
Percentages are expressed as a proportion of the total number of burials with an address provided (n=755).
A final concern relating to the use of parish registers to estimate numbers of births and deaths is that the baptisms and burials of non-conformists are frequently under-represented in Anglican parish registers, and not necessarily to the same extent (Midi Berry & Schofield, Reference Midi Berry and Schofield1971; Landers, Reference Landers1992; Galley, Reference Galley2009). If both burials and baptisms were under-enumerated at the same rate, then estimates of infant mortality would be unaffected (Galley, Reference Galley2009). If all deaths were registered, but births were under-enumerated, then an inflated estimate of infant mortality would result.
The Spitalfields district included a large concentration of Huguenot families. These families may have chosen to baptize their infants in one of the Huguenot chapels in the district, which would have depressed the level of Anglican baptisms relative to burials (Landers, Reference Landers1993). The number of baptisms conducted at the French Churches decreased over the period of study. At La Patente and Artillary, baptisms were discontinued after 1785 and 1786, but they continued until 1809 at Eglise Neuve and until 1823 at St Jean. Landers estimated an additional 841 baptisms in the Spitalfields community for the period 1750–59 based on the number of baptisms recorded at the French Chapels (Landers, Reference Landers1993, p. 339). The number of baptisms in the French Chapels has not been determined for 1790–99 but is likely to have been lower than for 1750–59. By 1830–39, baptism within the local French Chapels had been discontinued. There were no burials in the French Chapels.
Male and female deaths during infancy
Infant mortality rates were calculated using the number of burials of males or females aged less than 1 year and the estimated number of live births. The number of baptisms registered at Christ Church Spitalfields was 2934 between 1750 and 1759; 3111 from 1790–99 and 4280 from 1830–39. The number of births estimated for 1750–59 was increased by 841 to account for baptisms in the Huguenot chapels during this period. The number of baptisms for 1790–99 may be underestimated since the number of baptisms taking place in the French Chapels has not been determined. Dummy baptisms, based on the number of registered burials of unbaptized infants, were also added to the total number of baptisms in each 10-year cohort. The number of male and female births in each 10-year period was estimated from the total number of baptisms in the same period, plus dummy baptisms, assuming a sex ratio of 1.06. The numbers of infant burials within the same 10-year intervals were 1247, 947 and 526.
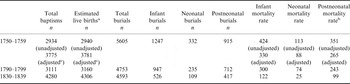
If it is assumed that the number of baptisms represents the number of infants at risk, infant mortality rates were 425 per 1000 in 1750–59, 304 per 1000 in 1790–99 and 123 per 1000 in 1830–39. After including an additional 841 baptisms (see above), the adjusted number of baptisms for the Spitalfields community from 1750–59 was 3775, resulting in a revised infant mortality rate of 330 per 1000 for this 10-year interval. Estimates of the numbers of births in all three periods were increased to account for the number of burials of unbaptized infants, giving revised estimates of the number of infants at risk of 3781 for 1750–59, 3160 for 1790–99 and 4306 for 1830–39. Based on these revised figures infant mortality rates decreased from 330 per 1000 in 1750–59, to 300 per 1000 in 1790–99 and 122 per 1000 in 1830–39 (Table 3). Neonatal mortality rates showed a similarly steep decline from 88 per 1000 in 1750–59 to 74 per 1000 in 1790–99 and 25 per 1000 in 1830–39. Postneonatal mortality rates declined from 265 per 1000 in 1750–59 to 243 per 1000 in 1790–99 and 99 per 1000 in 1830–39 (Table 3).
Number of baptisms, burials (infants, neonates and postneonates) and mortality rates of infants, neonates and postneonates in 1750–59, 1790–99 and 1830–39

a Includes number of baptisms plus dummy baptisms (burials of liveborn unbaptized infants).
b Calculated using neonatal survivors at 28 days as the denominator.
c Includes 841 baptisms at the French Chapels from 1750–59.
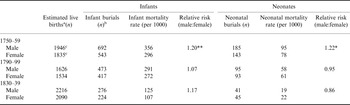
Mortality rates of male and female infants were compared using relative risks. The relative risk or risk ratio expresses the risk of dying in boys divided by the risk of dying in girls. Table 4 shows the relative risks for male:female mortality in infancy and the neonatal period. Male infant mortality was significantly higher than female mortality in 1750–59 (356 vs 296 per 1000 births; relative risk 1.20, p<0.001), but thereafter, males and females showed similar infant mortality rates. Male neonatal mortality was higher than that of females in 1750–59 (95 vs 78 per 1000 births; relative risk 1.22, 0.1>p>0.05), but there were no significant differences in neonatal mortality between the sexes in later cohorts.
Male and female infant and neonatal mortality rates and the relative risk of male:female deaths

* *p<0.001; *0.05<p<0.1.
a Includes dummy baptisms.
b The number of males and females does not add up to the total number of burials shown in Table 3 because sex could not be determined for a small percentage of individuals (1.0% in 1750–59, 6.0% in 1790–99 and 4.9% in 1830–39).
c Includes 841 baptisms at the French Chapels from 1750–59.
Age distribution of infant burials
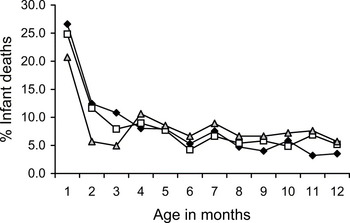
The distribution of infant burials according to age differs between the three 10-year periods (Table 1, Fig. 1). In all three periods the number of burials in successive months decreased between the first and third months. During the period 1750–59, this decrease continued until 6 months after birth. During the period 1790–99, there was a slight increase in the number of infant burials between the third and fourth months, and during 1830–39 the number of infant burials more than doubled between the third and fourth months after birth. After the age of 4 months, the pattern of infant burials was similar in all three decades, decreasing between 4 and 6 months, increasing slightly from 6 to 7 months and remaining at a relatively low level between 8 and 12 months.
Age distribution by month of infant burials during 1750–59 (black diamonds), 1790–99 (open squares) and 1830–39 (grey triangles)

The age distribution of infant burials differed slightly in males and females. In males, there was an increase in the number of infant burials between the fourth and fifth month in 1750–59 and 1790–99, and between the third and fourth months in 1830–39, whereas in females the number of infant burials increased between the third and fourth months in all three periods. The largest increase in the number of infant burials between successive months occurred during the period 1830–39, when the number of burials more than doubled between the third and fourth months in both males and females.
Application of the Bourgeois-Pichat biometric model
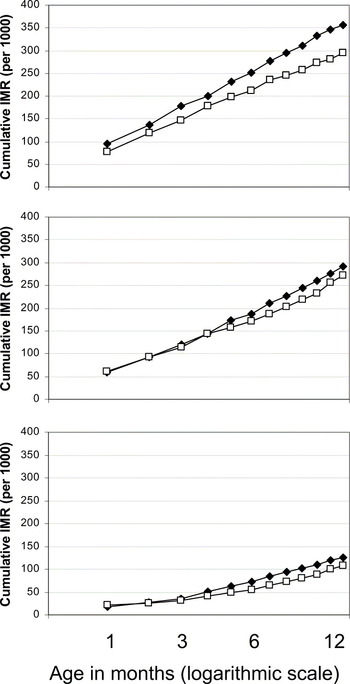
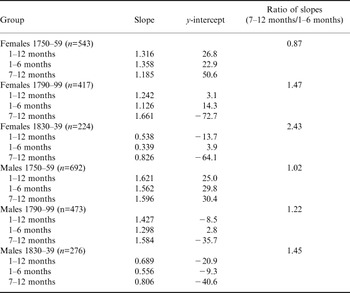
The biometric method can be used to partition neonatal mortality into endogenous and exogenous deaths by extrapolating backwards from a line fitted to the cumulative infant mortality data for 1 to 12 months (Bourgeois-Pichat, Reference Bourgeois-Pichat1951; Knodel & Kintner, Reference Knodel and Kintner1977). Cumulative infant deaths for each month between birth and 12 months were determined separately for males and females in each 10-year interval using the transcribed records for infant burials. Cumulative infant deaths per 1000 baptisms were plotted against age in days expressed as the function [log(n+1)]3, where n is age in days. Linear regression analysis was used to determine the slope of the plots for 1–6 months, 1–12 months and 6–12 months. The ratio of the two lines representing the slope from 6–12 months and the slope from 1–6 months was determined to explore infant feeding. In cases where the relationship between cumulative infant mortality and log-transformed age is not linear, estimates of endogenous mortality (the y-intercept) will vary according to which data points are used for the extrapolation. There is clear evidence of non-linearity in the current data set where backwards extrapolation of the lines fitted to 1–12 months, 1–6 months and 7–12 months in males and females from each of the three periods produces highly divergent estimates of endogenous mortality (y-intercept in Table 5, Fig. 2). In particular, where there is a tendency for infant mortality to rise steeply in later months, extrapolation back to zero can produce a negative estimate of endogenous mortality, as seen in females for 1830–39 and males for 1790–99 and 1830–39.
Cumulative infant mortality rates in male (black diamonds) and female (open squares) burials during 1750–59 (top), 1790–99 (middle) and 1830–39 (bottom).

Slope and intercept of regression lines fitted to cumulative mortality data determined according to the biometric model

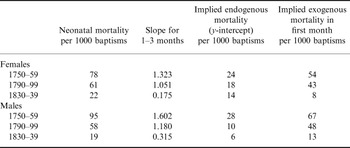
In order to minimize the problem of non-linearity associated with a steep rise in cumulative infant mortality in later months, estimates of endogenous mortality were based on the slope of the plots between 1 and 3 months determined using linear regression analysis, since changes in the slope occur after this age (see also Scott & Duncan, Reference Scott and Duncan1999). Results reveal a steep decline in endogenous mortality between the 1750s and 1830s in both males and females (Table 6). Estimated endogenous mortality for females decreased from 24 per 1000 births/baptisms in 1750–59, to 18 in 1790–99 and 14 in 1830–39, whereas exogenous mortality in the first month of life fell from 54 per 1000 in 1750–59, to 43 in 1790–99 to 8 in 1830–39. Estimated endogenous mortality for males decreased from 28 per 1000 in 1750–59, to 10 in 1790–99 and 6 in 1830–39, whereas exogenous mortality for males in the first month of life fell from 67 per 1000 in 1750–59, to 48 in 1790–99 and 13 in 1830–39.
Application of biometric model using cumulative infant mortality from 1–3 months

Interpretation of the biometric model in terms of nursing behaviour is based on changes in the slope of the biometric plot. In populations in which the average duration of breast-feeding is short, infant mortality is expected to rise more steeply than expected in the first 6 months, such that the ratio of the slopes of the lines between 6 and 12 months and 1 and 6 months is less than unity. In populations in which extended breast-feeding is common, infant mortality is expected to rise more steeply than expected after 6 months such that the ratio is greater than unity (Knodel & Kintner, Reference Knodel and Kintner1977; Herring et al., Reference Herring, Saunders and Katzenberg1998). A sudden sharp rise in slope can occur if the age at weaning is tightly controlled within a population. The male plot for 1750–59 is almost linear with a ratio of slopes of 1.02, whereas the female plot is steeper between 1 and 6 months than between 7 and 12 months, with ratio of slopes of 0.87 (Table 5). The female ratio implies slightly excessive mortality in the first few months of life and is consistent with values determined for populations with a relatively low prevalence of breast-feeding (Knodel & Kintner, Reference Knodel and Kintner1977). The ratio for males is consistent with values for populations where breast-feeding was more common. The plots for 1790–99 and 1830–39 reveal a strongly positive ratio of slopes implying excessive mortality in the second half of the year. These ratios are comparable to those of populations where most infants are breast-fed. Interestingly both male and female plots for 1830–39 illustrate a sharp upturn in infant mortality after 3 months (Fig. 2, Table 4). This pronounced shift is consistent with a widespread exposure to a novel risk factor at this age.
Discussion
This study has used original records of baptisms and burials to estimate the birth and death rates for the parish of Christ Church Spitalfields in three 10-year cohorts covering an 80-year period (1750–1839). This is one of few studies to examine changes in male and female infant mortality separately during the dramatic demographic shifts associated with the industrial revolution, and is an important addition to our understanding of the population of Christ Church in Spitalfields, which has been based primarily upon the burial sample from the crypts rather than the burial and baptismal population of the parish as a whole (Molleson & Cox, Reference Molleson and Cox1993). The strengths of this study lie in the transcription of infant sex from the burial registers for over 95% of records, and the availability of infant age at death recorded as days, weeks or months throughout the registers for the period of study. The results show that infant mortality was very high in 1750–59, with strong evidence of excess male infant mortality. Infant mortality declined substantially over the next 80 years, and while more males died in infancy than females, the excess of male infant deaths was no longer statistically significant by the 1830s.
Overall changes in infant mortality
Subject to the limitations outlined above, the estimates of infant mortality indicate a marked decline in the risk of death during infancy, with the proportion of deaths falling from 330 per 1000 in the 1750s to 122 per 1000 in the 1830s. The overall decline in infant mortality at Spitalfields during the late 18th and early 19th centuries is similar to that of London Quakers. Infant mortality rates in London Quakers derived from a family reconstitution study were 341 per 1000 in 1725–49, 327 per 1000 in 1750–75, 231 per 1000 in 1775–99, 194 per 1000 in 1800–24 and 151 per 1000 in 1825–49 (Landers, Reference Landers1993). Woods (Reference Woods2006) estimated infant mortality for Londonusing the Princeton Model North combined with the percentage of burials under age 10 listed in the Bills of Mortality. The derived infant mortality rates were 242 per 1000 in 1750–59; 211 per 1000 in 1790–99 and 177 per 1000 in 1820–29. This provides a lower estimate of infant mortality in the 1750s and 1790s compared with the Christ Church values and those reported by Landers (Reference Landers1993) and a slighter higher estimate of infant mortality in the 1830s. The differences between the estimates of Landers (Reference Landers1993) and Woods (Reference Woods2006) could result from the different methodologies employed, or could reflect differences in mortality patterns for a local sub-population (the Quakers) as opposed to a London-wide analysis as done by Woods (Reference Woods2006). From this perspective, the local sub-population of Christ Church might be expected to display infant mortality similar to that of the London Quakers.
Sex differences in mortality
The data for Christ Church Spitalfields reveal an excess of male deaths at a time when infant mortality was particularly high. In 1750–59, males were significantly more likely to die in infancy than females. Neonatal mortality was also higher in males than females in the 1750s compared with later cohorts. Finlay (Reference Finlay1981) reported equal mortality rates of male and female infants in two wealthy parishes from 1580–1650 (107 per 1000 for both sexes), but higher male than female infant mortality in two poor parishes during the same period (235 per 1000 in males vs 200 per 1000 in females; RR=1.17). The comprehensive reconstitution study of Wrigley et al. (Reference Wrigley, Davies, Oeppen and Schofield1997) reported a male:female mortality ratio of 1.13 calculated from 26 parishes outside of London for the period 1750–1774, compared with 1.20 in the present study. In 1825–37 the male:female infant mortality ratio fell slightly to 1.10 (Wrigley et al., Reference Wrigley, Davies, Oeppen and Schofield1997) compared with 1.17 in 1830–39 observed in the present study.
Greater mortality risk and reduced life expectancy among males compared with females is well established in contemporary and historic populations. The underlying causes of excess male mortality stem from a number of biological and physiological differences between male and female infants (Stinson, Reference Stinson1985; Drevenstedt et al., Reference Drevenstedt, Crimmins, Vasunilashorn and Finch2008). Research on contemporary and historic populations shows that male fetuses are more likely to be born pre-term (Ingemarsson, Reference Ingemarsson2003), and that mortality among low birth weight infants is higher in males (Stevenson et al., Reference Stevenson, Verter, Fanaroff, Oh, Ehrenkranz and Shankaran2000; Bello & Boëtsch, Reference Bello and Boëtsch2007). Males show increased rates of neonatal deaths due to respiratory distress syndrome (Khoury et al., Reference Khoury, Marks, McCarthy and Zaro1985; Mage & Donner, Reference Mage and Donner2004) and in contemporary populations excess neonatal mortality in males is most prominent during the first week of life (Khoury et al., Reference Khoury, Marks, McCarthy and Zaro1985). Other causes of excess male mortality in early infancy include Sudden Infant Death Syndrome (SIDS) and increased death rates from infectious disease (Waldron, Reference Waldron1987). Recent analysis of data for fifteen developed countries demonstrated that excess male mortality increased in association with an overall decrease in infant mortality between the 1750s and 1970. This increase in male disadvantage was associated with a decline in the contribution of infectious disease to infant mortality. Conversely a decrease in male disadvantage since about 1970 was associated with a decline in the contribution of perinatal conditions to infant mortality (Drevenstedt et al., Reference Drevenstedt, Crimmins, Vasunilashorn and Finch2008).
Endogenous and exogenous mortality
Estimates of endogenous and exogenous mortality in the neonatal period are highly sensitive to deviations from linearity and results should be regarded with a degree of caution. In this study estimated values for male endogenous mortality in 1790–99 and 1830–39 are improbable, in part because they are very low and in part because values are lower than those estimated for females in the same period. Endogenous mortality reflects causes preceding or associated with birth such as low birth weight and birth trauma. Males have higher late prenatal mortality and lower growth rates than females under stressful intrauterine conditions, and typically suffer higher rates of mortality in the first week of life (Stinson, Reference Stinson1985). Historically, endogenous mortality could not have been influenced by differential treatment of males and females or a cultural or parental preference for one or other sex. The low level of male endogenous mortality inferred from the data available for 1790–99 and 1830–39 may reflect an underestimation of male neonatal deaths as it was not possible to ascertain the sex of most of the infants who were buried prior to baptism.
Nevertheless results suggest that the decrease in neonatal mortality observed in both males and females between the 1750s and 1830s was caused by a reduction in both endogenous and exogenous causes of death. Between the 1750s and 1790s there was a 46% reduction in endogenous mortality compared with a 23% reduction in exogenous mortality (sexes combined). This situation was reversed between the 1790s and 1830s, which saw a 29% reduction in endogenous mortality compared with a 78% reduction in exogenous mortality. These results point to a change in the underlying causes of reduced neonatal mortality between the late 18th and early 19th centuries. Landers (Reference Landers1993) also reports a steep reduction in the endogenous component of infant mortality in London Quakers from the mid-eighteenth century, with rates falling from 81 in 1725–49 to 14 in 1825–49. Even allowing for slight differences in methodology, this suggests that endogenous mortality at Spitalfields may have been considerably lower than in the Quaker sample in the mid-eighteenth century but declined less steeply such that levels were more similar in the second quarter of the nineteenth century.
The main decrease in endogenous neonatal mortality at Spitalfields occurred between the 1750s and 1790s. This was still a time of relative economic prosperity at Spitalfields (Molleson & Cox, Reference Molleson and Cox1993) and the reduction in endogenous mortality may reflect improvements in maternal health and nutrition during and prior to pregnancy. Maternal health and conditions during fetal development are known to have a significant impact on subsequent neonatal and infant survival, with birth weight being a strong determinant of subsequent survival (Drevenstedt et al., Reference Drevenstedt, Crimmins, Vasunilashorn and Finch2008). Although deaths due to endogenous causes continued to fall after the 1790s, more than 90% of the decrease in neonatal infant mortality between the 1790s and 1830s can be attributed to exogenous causes. Living conditions in the Spitalfields area had deteriorated by the early 19th century. The value of annual real estate dropped by more than 20% between 1815 and 1829 and the population of the region rose between 1801 and 1831 suggesting more crowded living conditions for many families (Molleson & Cox, Reference Molleson and Cox1993). The abandonment of the Spitalfields Act in 1824 reflected a further decline in the silk industry that had allowed the area to prosper (Molleson & Cox, Reference Molleson and Cox1993). The dramatic reduction in neonatal mortality in general and exogenous mortality in particular between the 1790s and 1830s therefore occurred in spite of declining economic prosperity and increased population density.
The relative risk reveals that the overall decline in infant mortality between the 1750s and 1790s was also associated with a reduction in excess male mortality from 1.20 to 1.17. Neonatal and infant mortality in 1790–99 and 1830–39 showed no evidence of excess male mortality when calculated as a proportion of baptisms; however, the sample sizes, particularly for neonatal deaths, were small in these cohorts. Within the Spitalfields sample it is notable that a decline in excess male mortality occurs during a period in which there is a reduction in both endogenous and exogenous mortality, but that there is no further reduction in male disadvantage in the early 19th century when reductions in infant mortality can be almost entirely attributed to exogenous causes such as infection or poor nutrition. Improved maternal health may have been a major cause of the reduction in male disadvantage in the late 18th century. The increased survival prospects of infants at the London Foundling Hospital after 1760 has also been attributed to a national fall in endogenous mortality, suggesting a widespread improvement in levels of nutrition among the population that was translated into improved fetal viability and reduced levels of early mortality (Levene, Reference Levene2005). Wrigley et al. (Reference Wrigley, Davies, Oeppen and Schofield1997) reported a marked decline in maternal mortality between the periods 1725–49 to 1825–37 and a parallel decline in endogenous causes of infant mortality during the same period. The association between declining excess male mortality and reduced endogenous mortality observed in Spitalfields during the latter half of the 18th century mirrors the recent situation in which a decrease in male disadvantage was associated with a decline in the contribution of perinatal conditions to infant mortality (Drevenstedt et al., Reference Drevenstedt, Crimmins, Vasunilashorn and Finch2008).
Nursing behaviour
Interpretation of the biometric model in terms of nursing behaviour is based on the changes in the slope of the cumulative infant mortality plots (Knodel & Kintner, Reference Knodel and Kintner1977). Results suggest that at least some infants were breast-fed throughout the period under study, but that the prevalence of breast-feeding increased between the 1750s and 1830s. The low ratio for female infants during the 1750s indicates excess female mortality in the first few months of life. This early mortality may have been caused by an absence of breast-feeding or by the early introduction of artificial foods as a substitute or supplement to breast milk. It suggests that exclusive and/or prolonged breast-feeding of female infants was less common than for male infants at this time. Alternatively, male and female infants may have been weaned at a similar early age but female infants may have been given different and less appropriate weaning foods. The difference between males and females is reversed in the 1790s and 1830s with higher female ratios. It is not possible to determine whether this is caused by a higher level of excess female mortality between the ages of 7 and 12 months or a higher level of excess male mortality between the ages of 1 and 6 months. The most unexpected result from these data is the sharp upturn in male and female mortality after the age of 3 months for the period 1830 to 1839 (see also Fig. 1), which suggests a marked and widespread shift in nursing behaviour at this age. The excessive mortality after 3 months may imply the complete cessation of breast-feeding and replacement by artificial feeding but is more likely to reflect the use of inappropriate or contaminated complementary foods. The introduction of non-breast-milk foods is associated with several novel risks for the infant including exposure to new sources of infection associated with contaminated foodstuffs, water or feeding implements, malnutrition caused by a diet that is deficient in specific nutrients or caloric density or cannot easily be digested by the infant, and the risk of choking (Katzenberg et al., Reference Katzenberg, Herring and Saunders1996; Humphrey, Reference Humphrey and Schultkowski2008). The risks associated with the use of inappropriate breast milk substitutes are well documented in historic populations (Howarth, Reference Howarth1905; Fildes, Reference Fildes, Stuart-Macadam and Dettwyler1995; Reid, Reference Reid2002). A detailed analysis of diet of all infants born between November 1900 and November 1903 revealed that mortality up to 12 months in hand-fed infants was nearly three times that of breast-fed infants (Howarth, Reference Howarth1905).
An alternative explanation for the apparent upturn in infant mortality after 3 months is that the relatively low number of infant deaths during the first 3 months in the 1830s could reflect an increase in the under-registration of the deaths of unbaptized infants associated with a higher average age of baptism during this later period. It was not possible to determine the average age of baptism of infants at Christ Church Spitalfields during the 1830s because neither date of birth nor age at baptism were recorded in the baptism register during that period. However, it is worth noting here that, while there was a marked increase in the percentage of burials of unbaptized infants between the 1750s and 1790s, there was no further increase between the 1790s and 1830s. This may suggest that the trend towards increasing age of baptism during the 18th century, and the associated problem of increased under-registration of births, had levelled off by the early 19th century.
Historical information on weaning in London during the eighteenth and nineteenth centuries is not sufficiently detailed to reveal specific changes in nursing behaviour between the three periods for which mortality data are presented. Fildes (Reference Fildes, Stuart-Macadam and Dettwyler1995) reports that infants in Britain were typically weaned at a younger age during the eighteenth century than in previous centuries but does not report on weaning behaviour during the nineteenth century. Weaning behaviour is likely to have varied between rural and urban areas and according to the socioeconomic status of the mother and whether she was employed away from her own household. After the mid-eighteenth century it became increasingly fashionable for middle and upper class women to breast-feed their own babies instead of employing wet-nurses. At the same time dry feeding was introduced for foundling infants resulting in extremely high mortality (Fildes, Reference Fildes, Stuart-Macadam and Dettwyler1995). The age structure of infant mortality at Spitalfields implies that the prevalence of breast-feeding at Spitalfields may have been higher during the 1830s than during earlier periods. This is consistent with evidence from stable isotope analysis, which indicates that breast-feeding was more widely practised in the 19th century than the 18th century (Nitsch et al., in press).
Nursing behaviour is likely to have been influenced by cultural expectations and medical opinion but individual choices would have been constrained or dictated by personal circumstances, both practical and financial. Schellekens (Reference Schellekens2001) demonstrated a positive relationship between long-term changes in postneonatal mortality and income levels, measured by a real-wage index. Higher income may be associated with an increased use of breast-milk substitutes, which would become more affordable. A stronger economy may also result in a greater participation of women in the labour market, requiring an earlier introduction of breast-milk substitutes. The data for Christ Church Spitalfields imply that breast-feeding became more prevalent in the early 19th century, during a period of economic decline, suggesting that reduced household income or employment opportunities may have been contributory factors.
The changes in infant mortality observed at Christ Church Spitalfields during the mid-eighteenth to early nineteenth century reflect the particular socioeconomic circumstances of this parish and the broader context of changes in the pattern and causes of mortality across the metropolis (e.g. Landers, Reference Landers1993). Regional variations in cause of death across London were highlighted by an analysis of the causes of death recorded in the Bills of Mortality. During the period 1720–69, the district of Stepney, including Christ Church Spitalfields, had relatively low levels of mortality due to consumption, medium levels of mortality due to fevers and high levels of mortality linked to smallpox and during infancy compared with other districts of London (Landers, Reference Davenport, Schwartz and Boulton1993). During the period 1765–1814, the level of mortality associated with consumption and fever remained at low and medium levels, and the level of mortality linked to infancy and smallpox both decreased to low and medium levels compared with other London districts (Landers, Reference Davenport, Schwartz and Boulton1993). The percentage of deaths from smallpox in the London Bills of Mortality showed a gradual decline through the latter half of the 18th century and a more rapid decline after 1800 following the introduction of vaccination (Landers, Reference Landers1993; Davenport et al., Reference Davenport, Schwartz and Boulton2011).
Conclusion
This study examines sex differences in neonatal and infant mortality in the parish of Christ Church Spitalfields between 1750 and 1839 using information recorded in the burial and baptism registers in three 10-year periods. Absolute estimates of infant mortality cannot be calculated from this study because record linkage was not feasible in this population. However, these records provide valuable measures of the relative mortality of males and females, and the age distribution of burials during the first year of life. At the start of this period when overall infant mortality is considered to have been very high there was a marked excess of male infant mortality and borderline excess male neonatal mortality. Excess male mortality during infancy and the neonatal period declined alongside overall infant mortality in the latter half of the 18th century and early 19th century, and was no longer statistically significant in the 1790s and 1830s.
There was a marked decline in endogenous infant mortality, reflecting conditions already present at birth, during a period of relative economic prosperity between the 1750s and 1790s, which may reflect improvements in maternal health and nutritional status during that period. Contrastingly, the reduction in total infant mortality was particularly steep between the 1790s and 1830s, despite the fact that this was a period of economic decline in the parish of Christ Church Spitalfields. Population increase during this period is likely to have resulted in more crowded and less sanitary living conditions and the decline of the weaving industry may have caused higher unemployment and lower household incomes. The reduction in infant mortality between the 1790s and 1830s was particularly marked in the first 3 months of life. Following on from this, there is a marked and unexpected rise in the number of deaths between 3 and 4 months in both males and females in the 1830s consistent with the introduction of a novel risk factor at this age. A plausible interpretation for these results is that exclusive breast-feeding until the age of 3 months was widely practised in the 1830s resulting in substantially lower infant mortality in the first 3 months of life than in earlier periods. Changes in infant feeding may have been driven by economic factors including the availability of employment away from the home and household income. This paper indicates that maternal health and infant feeding practices may have been important contributory factors to the infant mortality in eighteenth and early nineteenth century London, alongside other factors such as changing employment patterns, population mobility and the disease environment.
Acknowledgments
The authors would like to thank Emmy Bocaege for assistance with the transcription of archival records, and two reviewers for helpful comments on a previous version of this paper.