Introduction
Canfieldite, Ag8SnS6, is a rare silver-bearing sulfosalt mineral which typically contains variable amounts of germanium substitution at the tin site and tellurium at the sulfur site. This mineral has been identified as one of the dominant Ag-bearing minerals in the recently discovered large Shuangjianzishan Ag–Pb–Zn deposit in NE China (Kuang et al., Reference Kuang, Zheng, Lu, Liu, Zhang, Li and Cheng2014; Wu et al., Reference Wu, Liu, Zeng, Liu, Sun, Yin and Yin2014). Furthermore, canfieldite in this deposit exhibits an exceptional enrichment in selenium.
Canfieldite is one of the five members of the argyrodite group, the other four members are argyrodite (Ag8GeS6; Weisbach, Reference Weisbach1886), alburnite (Ag8GeTe2S4; Tămaş et al., Reference Tămaş, Grobety, Bailly, Bernhardt and Minuţ2014), putzite [(Cu4.7Ag3.3)Σ8GeS6; Paar et al., Reference Paar, Roberts, Berlepsch, Armbruster, Topa and Zagler2004] and spryite (Ag8As0.53+As0.55+S6; Bindi et al., Reference Bindi, Keutsch, Morana and Zaccarini2017). Argyrodite and canfieldite are found to contain appreciable amounts of Te substituting for S, while in alburnite, Te appears to be ordered at specific structural sites (Tămaş et al., Reference Tămaş, Grobety, Bailly, Bernhardt and Minuţ2014). Tellurium-rich canfieldite has been reported from several localities, e.g. Revelstoke, Canada (Harris and Owens, Reference Harris and Owens1971), Nakatatsu mine, Japan (Marioko, Reference Marioko1981), Roşia Montană deposit, Romania (Popescu and Neacşu, Reference Popescu and Neacşu2011), Cirotan mine, Indonesia (Milési et al., Reference Milési, Marcoux, Nehlig, Sunarya, Sukandar and Felenc1994), Panasqueira deposit, Portugal (Dykqs, Reference Dykqs1985) and Lengenbach quarry, Binntal, Switzerland (Bindi et al., Reference Bindi, Nestola, Guastoni, Zorzi, Peruzzo and Raber2012). From the structural point of view, Bindi et al. (Reference Bindi, Nestola, Guastoni, Zorzi, Peruzzo and Raber2012) showed that Te does not occupy specific positions in the canfieldite structure, but it exhibits a disorder among the three available anion positions of the cubic F  $\bar{4}$3m structure. Although a very similar structural response is expected for the Se-for-S substitution, it is of interest to verify such a behaviour, even though Se-bearing varieties of canfieldite have been reported rarely, and then only from occurrences in the ex USSR (e.g. Nekrasova and Borodaev, Reference Nekrasova and Borodaev1972).
The present study aims to primarily provide a crystal-chemical characterisation of Se-rich canfieldite, and to clarify the structural role of selenium in these minerals by a multimethodic approach using a field emission scanning electron microprobe (FESEM), electron microprobe analyses (EMPA) and single-crystal X-ray diffraction (SCXRD).
Regional and deposit geology
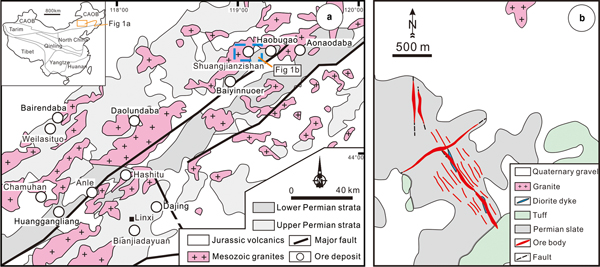
The Shuangjianzishan Ag–Pb–Zn deposit is located in the southern segment of the Great Hinggan Range Metallogenic Belt in NE China, which lies in the easternmost segment of the Central Asian Orogenic Belt (Fig. 1a). The Central Asian Orogenic Belt evolved through complex closure of the Paleo-Asian Ocean from the Neoproterozoic to the late Phanerozoic (Wilde, Reference Wilde2015). This region records complex processes of tectonic events that marked the transition from the dominantly NE–SW directed motion of the Paleo-Asian plate to the E–W directed motion of the Paleo-Pacific plate (Wilde, Reference Wilde2015; Zhou et al., Reference Zhou, Wilde, Zhao and Han2017 and references therein). The tectonic evolution of the Central Asian Orogenic Belt since the late Permian can be summarised briefly as follows: (1) closure of the Paleo-Asian Ocean was completed in the Late Permian (~260 Ma); (2) a switch in geodynamic setting in the Late Permian to Early Triassic (~260–250 Ma) reflected by the Paleo-Asian Ocean closure and the onset of tectonics associated with subduction of the Paleo-Pacific plate; (3) events associated with the westward advance of the Paleo-Pacific plate dominated in the Early Jurassic to Early Cretaceous (~250–140 Ma); and (4) the Paleo-Pacific plate retreated eastwards after the Early Cretaceous (~140 Ma), resulting in an extensional setting associated with regional thinning and delamination of the lithosphere in NE China (e.g. Li, Reference Li2006; Wu et al., Reference Wu, Sun, Ge, Zhang, Grant, Wilde and Jahn2011; Wilde, Reference Wilde2015; Zhou et al., Reference Zhou, Wilde, Zhao and Han2017; Liu et al., Reference Liu, Zhang, Wilde, Zhou, Wang, Ge, Wang and Ling2017 and references therein).
(a) Geological map of the southern Great Hinggan Range in NE China showing the distributions of the Mesozoic granites and the locations of major ore deposits (modified from Zhai et al., Reference Zhai, Liu, Zhang and Sun2017); (b) Simplified geologic map of the Shuangjianzishan Ag–Pb–Zn deposit (based on Wu et al., Reference Wu, Liu, Zeng, Liu, Sun, Yin and Yin2014). CAOB = Central Asian Orogenic Belt.

The southern segment of the Great Hinggan Range Metallogenic Belt hosts a number of porphyry Mo–(Cu), skarn Fe–(Sn), and polymetallic (Ag–Pb–Zn–Cu) epithermal and hydrothermal vein deposits (Fig. 1a; Ouyang et al., Reference Ouyang, Mao, Zhou and Su2015; Shu et al., Reference Shu, Chang, Lai, Zhou, Sun and Yan2016; Chen et al., Reference Chen, Zhang, Wang, Pirajno and Li2017; Gao et al., Reference Gao, Klemd, Zhu, Wang, Li, Wan, Xiao, Zeng, Shen, Sun and Qin2017; Zhai et al., Reference Zhai, Liu, Wang, Yang, Zhang, Wang, Zhang, Wang and Liu2014a,Reference Zhai, Liu, Zhang, Yao, Wang and Yangb, Reference Zhai, Liu, Tombros and Williams-Jones2018a, Reference Zhai, Liu, Cook, Wang, Yang, Zhang and Jiao2019). These deposits are hosted mainly by Permian strata (e.g. slate, sandstone, siltstone, mudstone and carbonates) and Mesozoic granites (Fig. 1a) produced during regional Mesozoic magmatism (Mao et al., Reference Mao, Pirajno, Lehmann, Luo and Berzina2014; Ouyang et al., Reference Ouyang, Mao, Zhou and Su2015; Zhai et al., Reference Zhai, Liu, Zhang and Sun2017; Gao et al., Reference Gao, Klemd, Zhu, Wang, Li, Wan, Xiao, Zeng, Shen, Sun and Qin2017 and references therein). Recent exploration has revealed that Ag–Pb–Zn vein-type deposits are predominantly common in this region (Fig. 1a), which has led to new discoveries of the Shuangjianzishan, Bianjiadayuan, Bairendaba and Weilasituo deposits (e.g. Ouyang et al., Reference Ouyang, Mao, Santosh, Wu, Hou and Wang2014; Liu et al., Reference Liu, Bagas and Wang2016; Zhai et al., Reference Zhai, Liu, Zhang and Sun2017, Reference Zhai, Liu, Zhang, Tombros and Zhang2018b), defining the southern segment of the Great Hinggan Range as the most important Ag–Pb–Zn polymetallic metallogenic belt in northern China. The ore deposits in this region are related mostly to Jurassic to Cretaceous magmatism (Mao et al., Reference Mao, Pirajno, Lehmann, Luo and Berzina2014; Ouyang et al., Reference Ouyang, Mao, Zhou and Su2015; Gao et al., Reference Gao, Klemd, Zhu, Wang, Li, Wan, Xiao, Zeng, Shen, Sun and Qin2017), and regionally, both mineralisation and Mesozoic (Jurassic to Cretaceous) granites demonstrate a close spatial distribution (Fig. 1a).
The main rocks exposed in the Shuangjianzishan ore district are composed of late Permian strata, the Mesozoic granites and volcanics, and the Quaternary paleo-placers (Fig. 1b). The strata in the ore district belong to the Dashizhai Formation, which consists mainly of argillaceous and sandy slate with a thickness of >950 m, which generally strike NE and dip NW with dipping angles of 55–65°. The Permian strata are the main ore-host rocks (Fig. 1b). The Mesozoic volcanics, of probable Jurassic age (Wu et al., Reference Wu, Liu, Zeng, Liu, Sun, Yin and Yin2014), are located mainly in the southeast of the Ag–Pb–Zn mineralised zones. They demonstrate an unconformable contact relationship with the underlying Permian slates (Fig. 1b). These volcanic rocks consist largely of rhyolitic tuff and ignimbrite with a thickness of >200 m. A large volume of Quaternary gravels, which consist of unsorted rock fragments with a thickness of 15–50 m, are widespread in the ore district (Fig. 1b). Intrusive rocks are rare in the ore district, and the only exposed one is a granite intrusion located 2 km to the north of the ore deposit (Fig. 1b). Diorites mainly occur as dykes in the ore district, and strike NW or NE with a length of 50–300 m and a width of 1–8 m. Several diorite dykes are crosscut by the mineralised veins. The major faults in the ore district are NW-, NE- and NS-trending, and the Shuangjianzishan Ag–Pb–Zn veins are controlled primarily by NW-trending faults (Fig. 1b). Several ore bodies are also dominated by the NE-trending faults.
The Shuangjianzishan Ag–Pb–Zn deposit was first discovered in 2013. More than 70 major veins, and numerous stockworks and disseminations have been identified at the Shuangjianzishan ore district, all of which are hosted by the Permian slate. According to the recent 2018 exploration report, a total resource of 161.2 Mt ores have been discovered at Shuangjianzishan, and the identified Ag reserve is >18.6 kt with an average grade of 128.5 g/t, the Pb reserve is 0.85 Mt (average grade of 0.6%) and the Zn reserve is 1.91 Mt (average grade of 1.6%), making this deposit the largest Ag deposit in China as well as in Asia (Kuang et al., Reference Kuang, Zheng, Lu, Liu, Zhang, Li and Cheng2014). The identified Ag–Pb–Zn ores are hosted primarily by NW-trending open-space filling veins, which commonly strike 312° and dip NE with dipping angles of 50–60°. The ore bodies usually occur as parallel veins with a length between 100 and 800 m, and extend vertically at a depth greater than 500 m. Their widths vary usually from 1 to 10 m. Hydrothermal alteration is dominantly characterised by an assemblage of ‘sericite’, chlorite, quartz, calcite and illite (or smectite). Alteration halos are distributed asymmetrically on both sides of the mineralised veins. The spatial alteration zonation is commonly not apparent as alteration assemblages are superimposed upon one another.
Occurrence of canfieldite
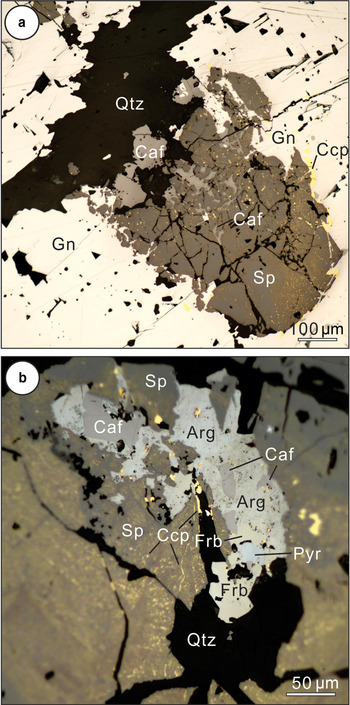
Systematic microscopic observations identify that canfieldite, argentite and freibergite are the most abundant and widely distributed Ag-bearing ore minerals in the deposit studied (Fig. 2a, b), making up roughly >80 vol.% of the total Ag-bearing ores. Canfieldite is usually present independently (Fig. 2a) or associated with argentite and freibergite (Fig. 2b), which commonly replaces the earlier formed sulfides (sphalerite, galena and pyrite) along their mineral boundaries, or occur along cracks in those sulfides (Fig. 2a,b), showing that the Ag-bearing minerals mostly formed in a relatively late sequence compared to the base-metal sulfides. Canfieldite is also intergrown with other Ag-bearing minerals, occurring in lesser amounts in the mineralisation, e.g. polybasite, stephanite and pyrargyrite (Fig. 2b). In some cases, canfieldite can also be crosscut, rimmed, and replaced by galena (Fig. 3a,b), suggesting that insignificant canfieldite may also occur in the early ore stage associated with sulfides. Commonly, canfieldite occurs as small anhedral grains (20–50 µm). However, it can occasionally also occur as relatively coarse grains (>500 µm) associated with galena and sphalerite (Fig. 3a).
Reflected light photomicrographs of sulfides and silver-bearing ore minerals from the Shuangjianzishan deposit. (a) Canfieldite crosscuts sphalerite and galena; (b) canfieldite with association of argentite, freibergite and pyrargyrite fill cracks in sphalerite. Abbreviations: Arg – argentite; Caf – canfieldite; Ccp – chalcopyrite; Frb – freibergite; Gn – galena; Pyr – pyrargyrite; Qtz – quartz; Sp – sphalerite.

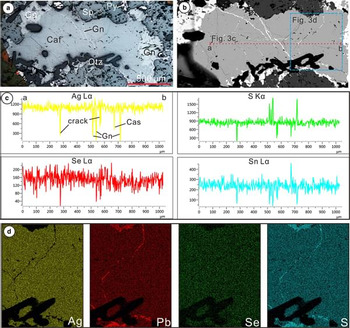
Occurrence of Se-rich canfieldite from the Shuangjianzishan Ag–Pb–Zn deposit. (a) A large canfieldite grain intergrown with galena, sphalerite and quartz (reflected light); (b) The same mineral to (a) in BSE, and the locations for element line scanning and mapping for (c) and (d) are shown; (c) element line scanning patterns of Ag, S, Se and Sn, and the different patterns revealing cracks and mineral inclusions of galena and cassiterite in canfieldite; (d) element mapping patterns of Ag, Pb, Se and S for canfieldite. Abbreviations: Caf – canfieldite; Cas – cassiterite; Gn – galena; Py – pyrite; Qtz – quartz; and Sp – sphalerite.

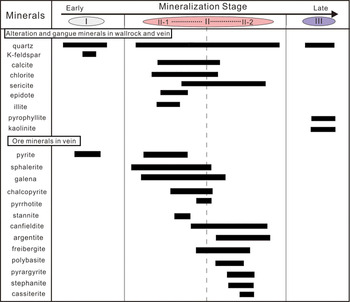
Based on field vein crosscutting relationships and the mineral assemblages, the Ag–Pb–Zn mineralisation at Shuangjianzishan can be divided into three distinct ore stages: (I) early pre-ore pyrite + quartz ± K-feldspar; (II) main ore sulfide + sulfosalt + quartz + calcite + ‘sericite’ + chlorite ± illite ± epidote; and (III) post-ore quartz + pyrophyllite + kaolinite (Fig. 4). In addition, stage II could be divided further into two sequences, substages II-1 and II-2 (Fig. 4). The early sequence (stage II-1) consists of ore minerals of galena + sphalerite + pyrite + chalcopyrite ± canfieldite ± freibergite, which are associated closely with alteration/gangue assemblages of quartz + calcite + chlorite ± epidote ± illite ± ‘sericite’. The subsequent ore sequence (stage II-2) is composed dominantly of a series of silver-bearing ore minerals (mainly abundant sulfosalts and argentite) ± pyrrhotite ± galena ± sphalerite ± chalcopyrite. The silver-bearing minerals are associated spatially with alteration/gangue mineral assemblages composed of quartz + ‘sericite’ ± calcite ± chlorite. The late sequence in stage II is the most important period for extensive Ag precipitation in the deposit.
Summary of the paragenetic sequence for the Shuangjianzishan Ag–Pb–Zn mineralisation.

Analytical methods
Sixty polished thin sections were examined in reflected and transmitted light from the samples collected from different mining levels and drill holes from the Shuangjianzishan deposit. A FESEM, a Zeiss Supra 55 Sapphire, at the China University of Geosciences Beijing (CUGB) was used to image ore textures and determine mineral compositions semi-quantitatively for the purpose of identification. Element line scanning using energy dispersive spectroscopy (EDS) was undertaken for AgLα, SbLα, PbMα, FeKα, SnLα, SeLα and SKα. The accelerating voltage was 20 kV and the working distance 15 mm. Compositions of canfieldite were determined using a JEOL 8230 Superprobe equipped with EDS, wavelength dispersive spectroscopy (WDS), and a back-scatter electron detector at the Chinese Academy of Geological Sciences (CAGS). The accelerating voltage was 20 kV. Beam current and count times for major elements were 20 nA and 20 s, respectively (10 s for background measurement), and beam size was 1 µm. The detection limits were 155 ppm for Au, 210 ppm for Ag, 400 ppm for Cu, 150 ppm for Fe, 300 ppm for Co, 130 ppm for Ni, 90 ppm for Se and 260 ppm for Te. Natural and synthetic mineral standards (chalcopyrite, sphalerite, galena, pyrrhotite, InAs and native Ag, Sb, Se and Sn) were utilised for calibration. X-ray lines measured were AgLα, SbLα, AsLα, PbLα, ZnLα, SnLα, FeKα, CuKα, SeKα and SKα. The analytical results for numerous Se-bearing canfieldite grains, along with sample numbers, are listed in Supplementary Table S1 (see below). X-ray element mapping was performed using an energy-dispersive X-ray detector on the JEOL 8230 Superprobe at CAGS. The dwell time was set to 20 μs to provide the highest possible resolution.
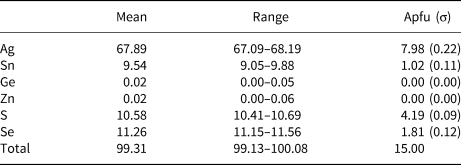
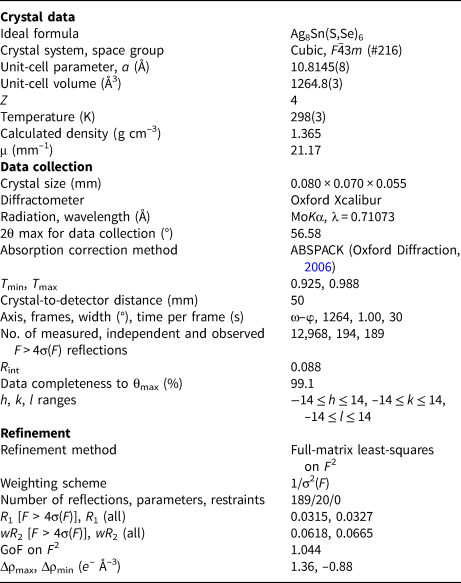
The crystal richest in Se (Fig. 3a) was handpicked from the rock sample and preliminarily rechecked with the electron microprobe. Major and minor elements were determined using a JEOL-JXA electron microprobe. The analytical conditions were 20 kV accelerating voltage and 40 nA beam current, with 30 s counting time. For the WDS analyses the following lines were used: AgLα, SnLα, SeKα and SKα. The estimated analytical precision is: ± 0.40 for Ag, ± 0.30 for Sn and ± 0.20 for Se and S. Pure elements were used for all standards. The canfieldite fragment was found to be homogeneous within analytical error. The average chemical composition for the crystal with the largest amount of Se (5 analyses on different spots), together with ranges of wt.% of elements, is reported in Table 1. On the basis of 15 atoms, the formula can be written as Ag7.98Sn1.02(S4.19Se1.81)Σ6.00. The same crystal was then examined by means of an Oxford Xcalibur single-crystal diffractometer using graphite-monochromatised MoKα radiation. Intensity integration, standard Lorentz polarisation and absorption correction were performed with the Crysalis (Oxford Diffraction, 2006) software package. Given the similarities in the unit-cell, cubic symmetry and reflections conditions between the examined crystal and Te-rich canfieldite (Bindi et al., Reference Bindi, Nestola, Guastoni, Zorzi, Peruzzo and Raber2012), the crystal-structure refinement was carried out starting with the atom coordinates reported for the F  $\bar{4}$3m structure of Te-rich canfieldite. The full-matrix least-squares program SHELXL-97 (Sheldrick, Reference Sheldrick2008) was used for the refinement of the structure. The site occupancy of all the positions was allowed to vary using different couples of neutral Sn, Ag, S and Se scattering curves (Ibers and Hamilton, Reference Ibers and Hamilton1974). Similarly to Te-rich canfieldite (Bindi et al., Reference Bindi, Nestola, Guastoni, Zorzi, Peruzzo and Raber2012), the Ag1 and Ag2 positions were found to be partially occupied, but an equation was added on the global Ag occupancy to fulfil the overall charge balance (i.e. Ag = 8.00 atoms per formula unit for Z = 4). At the last stage, with anisotropic atomic displacement parameters for all atoms and no constraints, the residual value settled at R 1 = 0.0315 for 189 observed reflections [F o > 4σ(F o)] and 20 refined parameters, and at R 1 = 0.0327 for all 194 independent reflections. The inspection of the difference-Fourier map revealed that maximum positive and negative peaks were 1.36 and 0.89 e –/Å3, respectively. Experimental details of the data collection and refinement are given in Table 2. Fractional atom coordinates and anisotropic-displacement parameters are shown in Table 3. Bond distances are reported in Table 4. The crystallographic information files have been deposited with the Principal Editor of Mineralogical Magazine and are available as Supplementary material (see below).
Electron microprobe data for Se-rich canfieldite (means and ranges in wt.% of elements) and atoms per formula unit (apfu, on the basis of 15 atoms) with their standard deviations (σ) in parentheses.

Crystallographic data and refinement parameters for Se-rich canfieldite.

 $\eqalign{& R_{{\mathop{\rm int}}} = {{{\lpar {n/n-1} \rpar }^{1/2}\Big [ {F_o^2 -F_o{(mean)}^2} \Big] } / {\sum {F_o^2}}} \cr & R_1 = {{\sum {\vert\vert F_o} \vert-\vert F{}_c\vert\vert} / {\sum {\vert F_o}}} \vert\quad \quad wR_2 = \left\{ {\sum {{{\Big [ {w{\lpar {F_o^2 -F_c^2} \rpar }^2} \Big ] } / {\sum {\Big[ {w{\lpar {F_o^2} \rpar }^2} \Big] }}}}} \right \}^{1/2} \cr & GoF = \left\{ {\sum {{{\Big[ {w{\lpar {F_o^2 -F_c^2} \rpar }^2} \Big] } / {\lpar {n-p} \rpar }}}} \right\}^{1/2}{\rm where} \;n = {\rm no}{\rm. \;of \;reflections,} \, p = {\rm no}{\rm. \;of\; refined } \cr &{\rm parameters}} $
Atoms, Wyckoff letter, site occupancy, fractional atom coordinates (Å) and atomic displacement parameters (Å2) for Se-rich canfieldite.

Selected bond distances (Å) for Se-rich canfieldite.

Results and discussion
Canfieldite chemistry, texture and origin
Measured compositions for canfieldite (Tables 1 and S1) demonstrate that Ag, Sn and S contents range commonly from 59.2 to 69.6, 9.05 to 19.3, and 10.4 to 21.5 wt.%, respectively. Analyses also show minor amounts of Cu, Fe, Zn, Ge, Au and Te in canfieldite (Tables 1 and S1). The Se contents show a relatively large variation from below the detection limit (0.01 wt.%) to 11.6 wt.%. In detail, the highest Se analyses are entirely from one large canfieldite grain (Fig. 3a), which shows homogeneous features (Fig. 3b) and, for this reason, was selected for the SCXRD study. The element line scanning of this large canfieldite grain reveals that Se, as well as other major elements (e.g. Ag and Sn), are distributed homogeneously (Fig. 3c), which is consistent with the results of the element mapping of part of this large canfieldite grain (Fig. 3d). Furthermore, cassiterite has also been identified as small mineral inclusions in canfieldite on the basis of element line scanning (Fig. 3c).
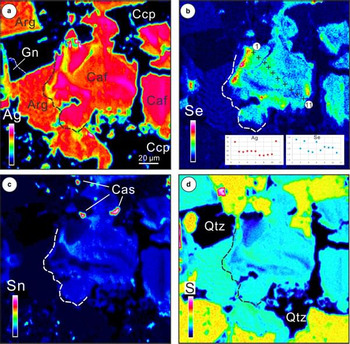
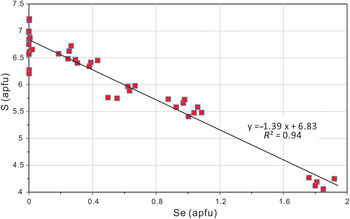
Numerous EMPA on distinct Se-bearing canfieldite grains, however, yield that Se is remarkably heterogeneous in canfieldite. This compositional inhomogeneity is evident on the trace-element maps of an individual grain (Fig. 5a–d), which show that both high- and low-Se domains exist (Fig. 5b). Similar patterns of heterogeneous Ag distribution in freibergite have been reported by Zhai et al. (Reference Zhai, Liu, Cook, Wang, Yang, Zhang and Jiao2019) from a nearby Ag–Pb–Zn vein-type deposit in the southern Great Hinggan Range, which are mostly attributable to a series of retrograde reactions resulting in diverse decomposition and exsolution of primary phases during cooling. Similarly to freibergite, the observed chemical heterogeneity in canfieldite is probably related to the fact that we had originally a single grain that experienced exsolution and decomposition during its cooling. Alternatively, the compositionally zoned pattern could be related to influxes of Se-rich fluids during the formation of canfieldite. Finally, a very good negative correlation (R 2 = 0.94) between Se and S can be observed for canfieldite, suggesting an ideal Se-for-S substitution (Fig. 6), as also demonstrated from the structural study.
Element mapping of Ag (a), Se (b), Sn (c) and S (d) for canfieldite. The positions and results for 11 EMPA along the mineral grain are shown in (b). Abbreviations: Arg – argentite; Caf – canfieldite; Cas – cassiterite; Ccp – chalcopyrite; Gn – galena; and Qtz – quartz.

Plot of Se vs. S contents in canfieldite (in atoms per formula unit).

A number of EMPA of other Ag-bearing ore minerals (argentite, freibergite, polybasite, stephanite and pyrargyrite) produces Se contents normally below the detection limit, demonstrating that Se is almost entirely restricted to canfieldite in the deposit studied (Fig. 5b). However, the origin of Se in canfieldite precipitated from hydrothermal fluids is still unclear. The evident enrichment of Se in ore fluids at Shuangjianzishan most probably reflects a close genetic association with a magmatic body. For example, the presence of Se-bearing ore minerals in the Perama Hill high-sulfidation deposit in Greece has been suggested to be compatible with direct deposition of metals from the vapour phase of a degassing magmatic (porphyry) body (Voudouris et al., Reference Voudouris, Melfos, Spry, Moritz, Papavassiliou and Falalakis2011). Considering a regional ore district scale, the porphyry-epithermal ore system in NE Greece is characterised by a close spatial association among granitic intrusion centres, base-metal enrichment, and a trace-element signature that involves Ag, Au, Sn, Se, Te, Bi and Mo (Voudouris et al., Reference Voudouris, Melfos, Spry, Moritz, Papavassiliou and Falalakis2011). Furthermore, numerous magmatic-hydrothermal ore deposits adjacent to the studied deposit in the southern Great Hinggan Range, such as the Bianjiadayuan Ag–Pb–Zn, the Weilasituo Cu–Zn, the Huanggangliang Fe, the Dajing Cu–Sn, and the Baiyinnuoer Pb–Zn deposits (Fig. 1a), all reflect proximity to, and a close genetic association with, a granitic porphyry/intrusion (Ouyang et al., Reference Ouyang, Mao, Zhou and Su2015; Zeng et al., Reference Zeng, Liu, Chu, Guo, Gao, Guo and Zhai2016; Zhai et al., Reference Zhai, Liu, Zhang and Sun2017). In addition, sulfur and lead isotope results suggest the origin of both sulfur and metals (Ag, Pb and Zn) in the Shuangjianzishan deposit from a granitic magmatism (Jiang et al., Reference Jiang, Zhu, Huang, Xu and Zhang2017). Therefore, we suggest that Se enrichment in the Ag-bearing ore minerals is due to its derivation from a felsic magma, and could be regarded as a mineralogical indicator of a direct magmatic contribution.
Crystal-chemical remarks
The crystal structure of Se-rich canfieldite shows close similarities with that of Te-rich canfieldite (Bindi et al., Reference Bindi, Nestola, Guastoni, Zorzi, Peruzzo and Raber2012). It is also topologically identical to that of putzite (Paar et al., Reference Paar, Roberts, Berlepsch, Armbruster, Topa and Zagler2004) and that of the synthetic Cu8GeS6 cubic compound (Ishii et al., Reference Ishii, Onoda and Shibata1999). It can be generally described as based on regular polyhedra such as Sn(X)4, (X)Ag6, (X)Ag12 and (X)Ag12, with X = (S, Se). If we use the classic polyhedral description and ignore the short Ag–Ag contacts (due to the disorder of the two partially occupied silver positions), the Ag1 atom may be considered as three-fold coordinated with a mean Ag–X distance of 2.49 Å, a value very similar to that found for the Ag1 position in the crystal structure of Te-rich canfieldite (2.53 Å; Bindi et al., Reference Bindi, Nestola, Guastoni, Zorzi, Peruzzo and Raber2012). The Ag2 atom adopts a close-to-tetrahedral coordination with an overall mean Ag–X distance of 2.71 Å, which is slightly smaller than that found for Te-rich canfieldite (2.76 Å; Bindi et al., Reference Bindi, Nestola, Guastoni, Zorzi, Peruzzo and Raber2012), but perfectly matching the range of bond distances observed for the pearceite–polybasite group of minerals (range: 2.68–2.72 Å: Bindi et al., Reference Bindi, Evain and Menchetti2006, Reference Bindi, Evain and Menchetti2007; Evain et al., Reference Evain, Bindi and Menchetti2006).
The refinement of the site-occupancy factors indicated Se to be disordered among the three anion positions (Table 3), resulting in the formula Ag8Sn(S4.15Se1.85)Σ6, which is in excellent agreement with that obtained from microprobe data, Ag7.98Sn1.02(S4.19Se1.81)Σ6.00. Bindi et al. (Reference Bindi, Nestola, Guastoni, Zorzi, Peruzzo and Raber2012) observed that Te exhibited a site preference for X1; however we, on the contrary, observed no site preference for Se, indicating that the Bindi et al. (Reference Bindi, Nestola, Guastoni, Zorzi, Peruzzo and Raber2012) Te-for-S substitution at X1 was not driven by any intrinsic difference in the anion environment. The Sn position shows a regular tetrahedral coordination, with a mean bond distance of 2.34 Å.
Acknowledgements
This research was supported financially by the National Natural Science Foundation of China (Grant 41672068), and by “Progetto di Ateneo 2015” of the University of Florence, Italy. Single-crystal diffraction studies were undertaken at CRIST, Centro di Cristallografia Strutturale, University of Florence, Italy. We thank Dongjie Tang (CUGB) for the SEM analyses, and Zhenyu Chen and Xiaodan Chen (CAGS) for the microprobe analyses. Meng Dai and Wenbin Jia are thanked for the field help and sample collections, and Nigel Cook and Wenyuan Liu for the discussions. Peter Leverett, Federica Zaccarini, and one anonymous reviewer are thanked for their helpful comments that improved this work. Editor Stuart Mills and Associate Editor František Laufek are thanked for their helpful suggestions.
Supplementary material
To view supplementary material for this article, please visit https://doi.org/10.1180/mgm.2018.158.