I. INTRODUCTION
With the increasing global energy demand and limited fossil resources, solar cells have been considered to be a promising renewable energy source. Reference Li, Wang, Kang, Wang and Qiu1 Up to now, the solar cells based on silicon are currently in the dominant position due to its high energy conversion efficiency. Reference Rokhmat, Sutisna, Wibowo, Khairurrijal and Abdullah2 However, its application is restricted because of the high cost. Owing to the relatively low energy cost, abundant resources of raw materials, reduced negative influences on the environment, and facile production process, Reference O’Regan and Gratzel3–Reference Zhang, Wang and Wang5 the dye-sensitized solar cells (DSSCs) have been attracting increasing attentions. But, the DSSCs still have some drawbacks, such as low light harvesting and high recombination rate of photogenerated electrons, restricted the dye loading capacity and utilization of the solar spectrum. Reference Yao, Huang, Fu, Deng, Ding, Shao and Xu6–Reference Lu, Shen, Huang, Tung and Yang9 To improve the DSSC’s performance, various strategies have been used, which mainly focus on the discovery of new types of light-harvesting dyes, Reference Narayanaswamy, Swetha, Kapil, Pandey, Hayase and Singh10 fabrication of novel photoanode structures and materials, Reference El-Sherbiny, Cheema, El-Essawy, Abdel-Megied and El-Shafei11 and synthesis of new electrolytes. Reference Wang, Zhang, Xu, Xu, Wu, Gong, Chu and Xiong12
Among various of photoanodes, titanium oxide (TiO2) was widely investigated because of its low cost and good stability. Reference O’Regan and Gratzel3 Nonetheless, for its wide band gap, the application of TiO2 as a photocatalyst is limited to invisible light. Up to now, many efforts have been made to improve the DSSC’s performance. For example, Cui et al. Reference Cui, Qiu, Zhao, Lu, Hu, Yang, Ma, Xu, Xu and Li13 fabricated porous TiO2 photoanodes embedded with hollow spheres, and the cell’s power conversion (5.43%) was improved due to the significant light scattering effect. In Wang et al.’s work, Reference Wang, Tang, He, Chen, Chen and Yu14 CaF2 was used to decorate the TiO2 nanocrystallite photoanodes, and the DSSC with TiO2/0.5 wt% CaF2 nanocrystallite has a maximum power conversion efficiency of 7.66%. Besides, an impressive conversion efficiency of 9.98% was also reported by incorporating TiO2 nanocrystalline photoanodes with SiO2. Reference Xu, Tang, He, Li and Chen15
Except for incorporating TiO2 photoanodes with other materials or nanostructures, doping the photoanodes was also popular. Metal ions such as Zn2+, Reference Wang and Teng16 Mg2+, Reference Peng, Fan, Zhao and Chen17 and nonmetal elements such as I, Reference Hou, Zheng, Chen, Zhou, Deng and Tao18 N, Reference Ma, Akiyama, Abe and Imai19 and S Reference Sun, Zhang, Wang, Zheng, Zhang, Cui, Feng and Zhu20 have been used for the doping strategy. Owning to the 4f orbit and vacant 5d orbits, rare earths possess various intermediate energy states which permit multiple configurations and thus have a great potential in improving the DSSCs’ performance. For example, in Shogh et al.’s work, Reference Shogh, Mohammadpour, Zad and Taghavinia21 TiO2 nanoparticles were doped with neodymium by a method of hydrothermal treatment. Their study showed that the cell’s performance was improved due to the reduced trap states density and enhanced charge collection efficiency. In Wu’s work, Reference Wu, Xie, Lin, Lan, Huang and Huang22 Y2O3:Eu3+ as a luminescence medium was introduced into TiO2 photoanode. In addition, the co-doping strategy was also applied to enhance the power conversion efficiency. Reference Wu, Wang, Lin, Lan, Tang, Huang, Huang, Fan, Li and Tang23,Reference Li, Lin, Wu, Zhang, Yue, Peng and Huang24
For the mostly used dyes such as N719 and N3, they mainly absorbed sunlight in the visible range, leaving most of the solar ultraviolet irradiation unused. Down-conversion luminescence materials could transform the incident ultraviolet sunlight into visible range, and therefore more sunlight irradiation could be absorbed by the dyes. Reference Mou, Pal, Jiménez and Pérez-Rodríguez25–Reference Grätzel27 Lanthanide compounds have been widely used as effective conversion materials because of their special 4f electronic structure and unique properties. Among various lanthanide ions, Sm3+ had been considered to be the most suitable down-conversion material. Reference Abdul Gafoor, Thomas, Musthafa and Pradyumnan28,Reference Gao, Song, Hu, Pan, Qin, Wang, Dai, Fan, Liu and Liu29
In this article, we used the hydrothermal method to prepare Sm-doped TiO2 photoanodes. The properties and performances of DSSCs with different samarium doping concentrations were also investigated. With an optimal doping concentration, the photovoltaic performance of samarium-doping DSSCs was greatly improved compared with DSSC based on the pristine TiO2 photoanode.
II. EXPERIMENTAL SECTION
A. Fabrication of photoanodes
TiO2 nanoparticle pastes were synthesized similar with Xu’s work. Reference Xu, Tang, He, Li and Chen15 With a doctor-blade method, a TiO2 porous thin film with a thickness of about 5 μm was constructed on the fluroine-doped tin oxide (FTO) conductive sheet glass using the obtained TiO2 paste. The working area of all the TiO2 photoanodes was adjusted to approximately 0.5 × 0.5 cm2. The prepared photoanodes were then sintered at 450 °C with a heating rate of 2 °C/min for 30 min. To obtain the Sm3+-containing solution, 0.044 g of samarium oxide (Beijing Fangzheng Rare-earth Company, Beijing, China) was added into 0.050 mL of nitric acid (68.0 wt%, Tianjin Basifu Chemical Co., Ltd., Tianjing, China), and the volume of the mixture was adjusted to 25 mL with deionized water to form a 0.010 M Sm3+ solution. After magnetically stirred, the solution was transferred into a teflon-lined autoclave and then the TiO2 photoanode was placed in the autoclave and heated at 100 °C for 12 h. Subsequently, the obtained doped photoanodes were heated at 500 °C with a heating rate of 2 °C/min for 30 min. Hereby the samarium-doped photoanode was denoted as TiO2:0.010 Sm. With the similar process, photoanodes (TiO2:0.015 Sm, TiO2:0.025 Sm) were also fabricated.
B. Cell assembly
For the sensitization process, the prepared photoanodes were soaked into 0.5 mM (in ethanol) N719 ([cisdi(thiocyanato)-N,N′-bis(2,2′-bipyridyl-4-arboxylic acid)-4-tetrabuty-lammonium carboxylate], Heptachroma Co., Ltd., Dalian, China) dye at the room temperature for 24 h. To assemble DSSC, a platinum-coated FTO glass was placed over the dye-sensitized samarium-doped TiO2 photoanode, and they were tightly clipped together. A drop of electrolyte [0.1 M KI, 50 mM I2, 0.5 M 4-tert-butylpyridine (TBP) and 0.6 M 1,2-dimethyl-3-propylimidazolium iodide (DMPII) in acetonitrile] was added into the space between the two electrodes. Hereby the cells were assembled and ready for the subsequent photovoltaic measurements.
C. Characterization
X-ray profiles of the prepared nanoparticles were recorded by an X-ray powder diffractometer (Rigaku Corporation, Tokyo, Japan, D-MAX2500 diffractometer with Cu Kα radiation, λ = 0.154178 nm, 40 kV accelerating voltage and 100 mA current) in the 2θ range of 20°–60°. The surface morphology of the photoanodes was characterized with a scanning electron microscopy (SEM) obtained by a field-emission scanning electron microscope (FE-SEM; JEOL Ltd., Tokyo, Japan, JSM-6700F). Transmission electron microscopy (TEM) and selected area electron diffraction (SAED) tests were collected from a field-emission transmission microscope (FETEM; JEOL Ltd., Tokyo, Japan, JEM-2100). For the TEM and SAED tests, the samples were peeled off from the prepared photoanodes. The X-ray photoelectron spectroscopy (XPS) data were obtained on an X-ray photoelectron spectrometer (Kratos Corporation, Manchester, United Kingdom, XSAM800) equipped with an X-ray source of monochromated Al Kα (hυ =1486.6 eV), operating at 15 kV and 150 W. The UV-Vis spectra of the unsensitized TiO2 photoanodes were obtained with an UV-Vis spectrometer (Cary500, Varian Corporation, Palo Alto, California) at room temperature. The photoluminescence (PL) emission spectra of the photoanodes were measured at room temperature under the excitation wave length of 370 nm with a fluorescence spectrometer (Edinburgh Instrument, Livingstone, United Kingdom, FLS920).
The photovoltaic tests of the cells were carried out by measuring the photocurrent–photovoltaic curves with an electrochemical workstation (CHI660D, Shanghai Chenhua Instrument Co., Ltd., Shanghai, China) under a one sun (AM 1.5 G) illumination with an output power of 100 mW/cm2 produced by a solar light simulator (Oriel Sol 3A class AAA, Newport Corporation, Irvine, California). A 450 W Xenon lamp (Newport 6991, Newport Corporation, Irvine, California) was used as the light source. The overall energy conversion efficiency (η) and the fill factor (FF) of the cells were calculated according to the following equation Reference Hafez, Saif and Abdel-Mottaleb30 :
 $${\rm{FF}} = {{{{\left( {J \times V} \right)}_{\max }}} \over {{J_{{\rm{sc}}}} \times {V_{{\rm{oc}}}}}}\quad ,$$
 $$\eta (\% ) = {{{J_{\max }} \times {V_{\max }}} \over {{P_{{\rm{in}}}}}} \times 100\% = {{{J_{{\rm{sc}}}} \times {V_{{\rm{oc}}}} \times {\rm{FF}}} \over {{P_{{\rm{in}}}}}} \times 100\% \quad .$$
The J sc was the short-circuit photocurrent density (mA/cm2), while V oc represented the open-circuit voltage (V). P in was the intensity of incident light, which was 100 mW/cm2. J max (mA/cm2) and V max (V) were the current density and voltage at the point of maximum power output on the J–V curves, respectively.
III. RESULTS AND DISCUSSION
A. Structural properties
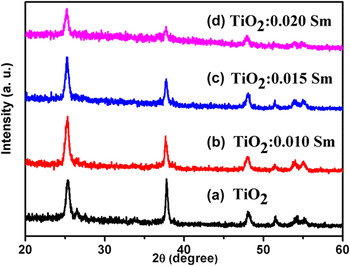
Figure 1 showed the XRD analysis of the different photoanodes. From Fig. 1, it was clear that the XRD peaks located at 2θ = 25.4°, 37.7°, 48.0°, and 54.1° for the doped and un-doped TiO2 photoanodes could be indexed to (101), (004), (200), and (105) planes of anatase TiO2 (JCPDS #21-1272). In addition, the another peak located at 26.6° on curve (a) was attributed to the SnO2 structure from the FTO substrate, Reference Hsu, Li, Chien, Salunkhe, Suzuki, Yamauchi, Ho and Wu31 which corresponds to the (110) crystalline planes of the SnO2 (JCPDS Card No. 46-1088). With the increase of samarium doping concentration, more and more samarium oxides could cover on the FTO, which may result in the concentration of SnO2 below the detection limit of the XRD instrument. So the peak gradually disappeared with the increase of samarium doping concentration. Furthermore, no peaks for the samarium content were observed, which may be attributed to the samarium low concentration.
XRD patterns scanning from 20°–60° for different TiO2 photoanodes: (a) Pristine TiO2; (b) TiO2:0.010 Sm; (c) TiO2:0.015 Sm and (d) TiO2:0.020 Sm.

B. Morphology properties
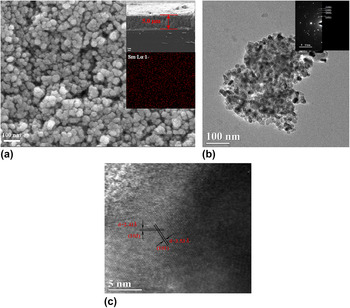
Morphology of the sample TiO2:0.015 Sm was characterized with SEM and TEM techniques, and they were shown in Fig. 2. In Fig. 2(a), it could be shown that the TiO2 thin film possessed a porous nature and that the TiO2 nanoparticles owned a generally uniform size distribution about 20–25 nm. From the insert of Fig. 2(a), the film thickness was found to be about 5.0 μm. The EDS mapping result indicated a uniform dispersion of the samarium element in the TiO2:0.015 Sm photoanode. From the TEM image [Fig. 2(b)], it could be seen that the nanoparticles were well dispersed. In insert of Fig. 2(b), four diffraction rings shown in SAED pattern confirmed the anatase TiO2 nature. From the HRTEM image, the lattice fringes of the crystal were found to be 3.53 Å and 2.41 Å, which could be assigned to the space of (101) plane and (103) plane of anatase TiO2, respectively.
(a) SEM image, cross-sectional image and EDS mapping result (insert) of the sample TiO2:0.015 Sm photoanode (b) TEM image and SAED pattern (insert) (c) High-resolution TEM image of the TiO2:0.015 Sm powder.

C. Elemental composition and chemical state
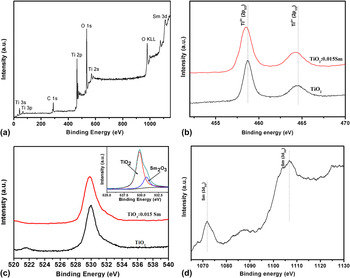
Figure 3 presented the X-ray photoelectron scanning spectra of two typical samples: TiO2:0.015 Sm and pristine TiO2. Figure 3(a) was the overall scanning spectrum, in which the existence of Ti, O, and Sm elements could be confirmed. The C element may be attributed to the trace organic substances from the XPS instrument. In Fig. 3(b), two peaks located at 458.8 and 464.5 eV could be assigned to the spin–orbit splitting of Ti 2p: Ti4+ (2p 3/2) and Ti4+ (2p 1/2), respectively, Reference Zhang, Peng, Chen, Chen and Han32 indicating the Ti4+ valence state of Ti. Compared to pristine TiO2, it can be seen that the Sm-doped sample exhibited a small blue shift (∼0.1 eV) toward low binding energy. This may be due to formation of the Sm–O–Ti bond over the TiO2 surface, which may influence the surrounding environment chemical status of TiO2, lead to an increase of the electron cloud density and reduce the binding energy. In Fig. 3(c), the peak located at 529.7 eV matched well to the O element bounded to Ti. Reference Sleigh, Pijpers, Jaspers, Coussens and Meier33 However, for the sample TiO2:0.015 Sm, two peaks located at 529.6 and 530.5 eV could be resolved [see insert of Fig. 3(c)], which may be assigned to O from TiO2 and O element derived from possible samarium species (Sm2O3, etc.). Reference Sleigh, Pijpers, Jaspers, Coussens and Meier33,Reference Uwamino, Ishizuka and Yamatera34 In Fig. 3(d), the binding energy of the Sm 3d appeared at ∼1105.9 and ∼1086.1 eV corresponded to the energy of the Sm3+ photoelectron. Reference Cao, Zhao, Yi, Ma, Zhou, Wang, Li and Qiu35
(a) XPS scanning spectrum of the sample TiO2:0.015 Sm; (b)–(d) High-resolution XPS spectra of Ti 2p (b), O 1s (c) and Sm 3d (d); Insert of (c): fitted spectrum of O 1s for the sample TiO2:0.015 Sm.

D. Optical properties
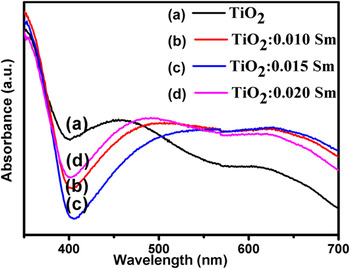
Figure 4 showed the UV-Vis spectra of the photoanodes with different Sm doping concentrations. It appeared that all the tested samples including the pristine TiO2 presented a radiation absorption in a wave length of about 400 nm. And as shown, the samarium doping resulted in a blue shift of the absorption edge toward the smaller wave length, which indicated an increased band gap (E g). According to Zalas’s work, Reference Zalas, Walkowiak and Schroeder36 the widened E g may make an effective energy barrier to suppress the electron recombination. It was also suggested that the widening of E g could be responsible for the increase of V oc. Furthermore, all the Sm-doped photoanodes exhibited an enhanced radiation absorption in the visible light region (400–700 nm) compared with that of pristine TiO2, which matched better to the absorption spectrum of N719 dye. Reference Chang, Lin, Chen, Wang, Chang and Lin37 This was beneficial for the DSSCs to achieve the enhanced utilization of sunlight and may improve the cell’s performance.
The UV-Vis spectra of the different photoanodes: (a) Pristine TiO2; (b) TiO2:0.010 Sm; (c) TiO2:0.015 Sm; and (d) TiO2:0.020 Sm.

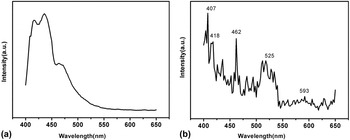
Figure 5 showed the PL emission spectra (recorded at λ = 370 nm) of the pristine TiO2 photoanode and TiO2:0.015 Sm photoanode. In Fig. 5(a), the board peak around 420–470 nm originated from the defect of the host TiO2. Reference Hafez, Saif and Abdel-Mottaleb30 In Fig. 5(b), except for the board peak from TiO2, the sharp peaks of emission located at about 407 nm, 418 nm, 462 nm, 525 nm, and 593 nm may be the electronic transition of 4K11/2 − 6H5/2, 6P5/2 + 4M19/2 − 6H5/2, 4F5/2 + 4I13/2 − 6H5/2, 4F3/2 − 6H5/2, and 4G5/2 − 6H7/2, respectively, Reference Hafez, Saif and Abdel-Mottaleb30,Reference Li, Chang, Lin, Chang and Lin38 which were within the absorption wave length of the N719 dye. As a result, the ultraviolet part of the sunlight irradiation may be transformed into visible light and reabsorbed by the N719 dye via this down-conversion luminescence effect of Sm3+. This could enhance the light-harvesting ability of the cell and may improve the cell’s performance. Reference Liu, Qiang, Yang and Liu39
The PL emission spectra (excited by λex = 370 nm) of (a) pristine TiO2 photoanode and (b) TiO2:0.015 Sm photoanode.

E. Photovoltaic performance measurement
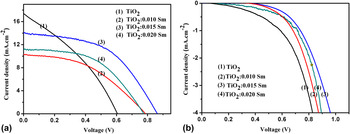
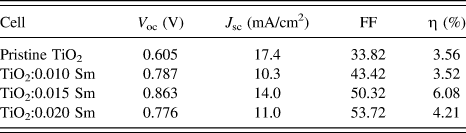
To investigate the influence of samarium doping on the photovoltaic performance of the cells, J–V curves of DSSCs with TiO2 photoanodes under different Sm doping concentrations were measured under the illumination of one sun (AM 1.5 G, 100 mW/cm2), which was shown in Fig. 6(a). The corresponding photovoltaic parameters were indicated in Table I. It could be seen that among the cells with different photoanodes, the TiO2:0.015 Sm exhibited the best power conversion efficiency (η) with an open-circuit voltage (V oc) of 0.86 V and a short-circuit current density (J sc) of 14.0 mA/cm2. With the doping concentration increased, the J sc decreased at first and then increased. For V oc, all the doped samples exhibited an enhanced V oc compared with the pristine TiO2, and a maximum V oc of 0.863 was discovered for TiO2:0.015 Sm.
(a) The current density–voltage (J–V) characteristic curve of the prepared cells with different photoanodes measured under illumination of one sun (AM 1.5 G, 100 mW/cm2) of the DSSCs with different photoanodes: (1) TiO2; (2) TiO2:0.010 Sm; (3) TiO2:0.015 Sm; and (4) TiO2:0.020 Sm. (b) The J–V curve measured in the dark of different cells: (1) TiO2; (2) TiO2:0.010 Sm; (3) TiO2:0.015 Sm; and (4) TiO2:0.020 Sm.

Summary of the photovoltaic characteristics of the DSSCs with different photoanodes.

To evaluate the charge recombination process of the cells, J–V curves under dark conditions were also measured, and they were presented in Fig. 6(b). Generally, dark current is considered as a qualitative technique to describe the extent of back electrons transfer to recombine with oxidized species (I3 − ions) in the electrolyte, which is a great loss to the cell’s performance. Reference Lei, Zhang, Qiao, Zheng, Hu, Huang, Sun, Sun and Zhang40 From Fig. 6(b), it was seen that the pristine TiO2 exhibited the highest dark current density in all investigated cells, indicating an impaired electron recombination process between electrons on the conduction band of TiO2 and the electrolyte. Reference Li, Que, Mo, Chen, Ding, Ma, Jiang, Hu and Dai41 Moreover, it could be found that the dark current density decreased with the Sm dopant amount of 15% and then increased when the Sm dopant amount increased. The results revealed that the electron transport enhanced in the TiO2:0.015 Sm films, which may be a benefit from the coating of Sm2O3. The Sm2O3 coating could act as an energy barrier to suppress the electron back reaction with I3 in the electrolyte effectively. However, the coating of Sm2O3 (insulator) may be thickened when the doping concentration of Sm was excessive, which may result in blocking of the electron transport and greatly compromise the cell’s performance.
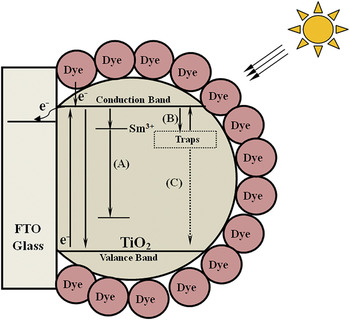
According to references about other rare-earth doped DSSCs Reference Zalas, Walkowiak and Schroeder36,Reference Lu, Li, Peng, Fan and Dai42 and the results above, the effect of the Sm doping on TiO2 photoanodes was studied (Fig. 7). First of all, the Sm3+ doping could transform the incident ultraviolet light into visible light with a down-conversion luminescence effect as confirmed by the PL measurement (Process A), which improved the utilization rate of sunlight for the dye and could more effectively excite the electrons. Second, the samarium doping could also introduce traps into the TiO2 photoanode. Reference Lu, Li, Peng, Fan and Dai42 When excited electrons are injected from the dye molecules to the external layer of the TiO2 electrode, the photogenerated electrons could be captured and stored by these traps (Process B). The process effectively suppressed the photoexcited electrons recombination after their transfer to the TiO2 layer, and therefore their lifetime was prolonged. But, with the increase of samarium doping concentration (higher than 0.015 M), more traps may be introduced and more electrons may be trapped. Because some of the trapped electrons would arrive to the valence band in the form of a nonradiative transition (Process C), the excessive formation of traps was unfavorable for the cell’s photovoltaic performance. All in all, if the factors discussed above could reach a good balance, the electron loss could be alleviated and the cell’s photovoltaic performance could be better. The TiO2:0.015 Sm owned the proper traps and showed the best photovoltaic efficiency of 6.08%.
Schematic illustration of the photovoltaic process for the Sm-doped TiO2 photoanode.

IV. CONCLUSION
In this work, dye-sensitized solar cells based on TiO2 photoanodes doped with samarium ions via a method of hydrothermal treatment were fabricated. Different samarium doping concentrations were investigated to see the influence on cell’s properties and photovoltaic performance. Doping TiO2 photoanodes with samarium ions was considered to be a promising strategy to enhance the DSSCs’ power conversion efficiency. The sample TiO2:0.015 Sm yielded the best power conversion efficiency of 6.08%, which achieved a great improvement compared with the cell based on pristine TiO2 photoanode.
ACKNOWLEDGMENT
This work was mainly supported by the National Natural Science Foundation of China (NSFC, Grant No. 51272115 and NSFC, Grant No. 61504073).