Implications
This study shows that evaluation of sustainability of pig breeding activities for conventional and differentiated farming systems can be performed across several countries and on a large scale. The results show substantial variation in the sustainability of performed breeding activities in 15 European pig farming systems.
Introduction
Consumer demand for pig meat is growing, but society is also critical of some practices in animal production. Impacts on animal welfare and the environment are particular concerns (Flint and Wolliams, Reference Flint and Woolliams2008). In the EU-funded project Q-PorkChains, eight themes of the sustainability of European pig production were assessed (Bonneau et al., Reference Bonneau, de Greef, Brinkman, Cinar, Dourmad, Edge, Fàbrega, Gonzàlez, Houwers, Hviid, Ilari-Antoine, Klauke, Phatsara, Rydhmer, van der Oever, Zimmer and Edwards2014a). In this article we present results from one theme: breeding programmes.
In the Code of Good Practice for Farm Animal Breeding and Reproduction Organisations, sustainability is defined as ‘the extent to which animal breeding and reproduction, as managed by professional organisations, contribute to maintenance and good care of animal genetic resources for present and future generations’ (European Forum of Farm Animal Breeders (EFFAB), 2013). As pig production serves rather different markets in different regions, a number of different types of pig breeding programmes are needed (Kanis et al., Reference Kanis, de Greef, Hiemstra and van Arendonk2005). The policy goal of ‘sustainable use and development’ is given high priority in the Food and Agriculture Organization’s (FAO) global plan of action on animal genetic resources (FAO, 2007), however, as has been shown by Gamborg and Sandøe (Reference Gamborg and Sandøe2005), we lack a single, universal definition of sustainability in animal production. The ideal of sustainability has, in any case, to be adapted to the distinctive needs of each breeding organisation and stakeholder. These needs differ from one farming system to the next, and therefore sustainable breeding can only be defined within a given farming system in a given environment. The aim of this study was to assess the sustainability of the breeding activities performed in 15 contrasting pig farming systems in Europe.
In Q-PorkChains the three cornerstones of the sustainability concept (economic, environmental and societal sustainability) were expanded to eight themes: breeding programmes (this paper), economy (Ilari-Antoine et al., Reference Ilari-Antoine, Bonneau, Klauke, Gonzàlez, Dourmad, de Greef, Houwers, Fàbrega, Zimmer, Hviid, van der Oever and Edwards2014), animal health, animal welfare, market conformity (Gonzàlez et al., Reference Gonzàlez, Gispert, Gil, Hviid, Dourmad, de Greef, Zimmer and Fàbrega2014), meat safety; environmental sustainability (Dourmad et al., Reference Dourmad, Ryschawy, Trousson, Bonneau, Gonzàlez, Houwers, Hviid, Zimmer, Nguyen and Morgensen2014) and human working conditions. Clearly, these themes are related to each other in various ways. Selection for improved meat quality, or improved welfare, could, for example, be necessary if a high price for a product in a niche market is to be introduced, and this will inevitably have a bearing on farm incomes. For an overall assessment including all themes, see Bonneau et al. (Reference Bonneau, Klauke, Gonzàlez, Rydhmer, Ilari-Antoine, Dourmad, de Greef, Houwers, Cinar, Fàbrega, Zimmer, Hviid, van der Oever and Edwards2014b).
Ideally, the findings presented here will be referred to by researchers and breeding organisations when they seek to assess the sustainability of farming systems in the future. The approach used in this study could help to raise awareness and foster good practice in farm animal breeding. More generally, it may inspire teachers and students in animal breeding to include sustainability assessments in exercises and projects.
Material and methods
Data structure and description of farming systems
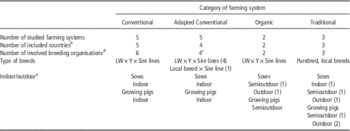
The study covered one conventional and three differentiated categories of pig farming systems in Europe (Table 1). In total, 15 farming systems were studied: five Conventional (C), five Adapted Conventional (AC), three Traditional (T) and two Organic (O). For a general description of these categories of farming systems, see Bonneau et al. (Reference Bonneau, Antoine-Ilari, Phatsara, Brinkmann, Hviid, Christiansen, Fàbrega, Rodríguez, Rydhmer, Enting, de Greef, Edge, Dourmad and Edwards2011). To maintain anonymity the systems are labelled with codes in the present paper. Countries and farming systems were chosen to cover a wide spectrum of different conditions and practices in pig production. The Conventional systems are all common, and indeed standard, in the countries in which they operate, but as a consequence of those countries’ differing laws, markets, policies and climate, they are configured in different ways. Adapted Conventional systems differ from the Conventional systems in their claim to possess the following positive features: superior animal welfare (AC-1 and AC-4), superior meat quality (AC-2, AC-3 and AC-5) and environmental friendliness (AC-4). The Organic farming systems were designed to reflect the organic principles laid down by the International Federation of Organic Agriculture Movements (IFOAM, 2013), although one of them was not classified as organic according to EU rules and regulations on organic production. The Traditional farming systems were small-scale systems associated with specific regions of Europe. The average herd size in these systems was less than 20 sows.
Characteristics of the studied categories of farming systemsFootnote a

a Number of systems within parentheses.
b In total, farming systems from five European countries were studied. Each farming system was located to only one country.
c For one farming system, data were collected separately for sire and dam lines, that is, two geneticists from the same company were interviewed.
d Three of the breeding organisations providing genetic material to Conventional systems also provided the same genetic material to one or two differentiated systems included in the study. Data were collected from nine breeding organisations in total.
e ‘Semioutdoor’ means indoor with access to outdoor concrete runs. ‘Outdoor’ means access to pasture or forest.
Breeding activities
The evaluated breeding activities for each farming system included activities performed by breeding organisations within their breeding programmes and the choice of breeding animals and semen at the farm level. The Traditional farming systems used local breeds. The population sizes for these breeds were around 200, 500 and 1100 sows. One Adapted Conventional farming system used a standard breed×local breed cross. The other Adapted Conventional, the Conventional and the Organic systems used standard breed crosses with dam lines from Large White and Landrace and sire lines from Duroc, Hampshire, Pietrain or synthetic sire lines.
The 15 farming systems obtained their genetic material from nine breeding companies and breed organisations (henceforth ‘breeding organisations’). Both farmers’ cooperatives and private companies were represented, with regional, national or multinational activity. In some farming systems, animals or semen from several breeding organisations were used. In those cases the breeding activities of a breeding organisation that was a ‘common, standard choice’ for many farmers within the system was chosen for study. One farming system used different companies for the sire and dam line. In this case the activities of both companies were included in the evaluation. In some cases, more than one farming system used animals or semen provided by the same breeding programme. Organic and Adapted Conventional farming systems used genetic material from breeding programmes designed for conventional farming systems. Animals and semen from some of these breeding programmes were also used in Conventional systems included in this study. As one breeding programme can be more or less relevant for different farming systems, each system was assessed separately, even when the breeding organisation gave the same answers for all farming systems using their genetic material. To maintain anonymity, details on which breeding organisations that were related to which farming systems and countries are not presented.
Data collection
A checklist for sustainable breeding schemes by Woolliams et al. (Reference Woolliams, Berg, Mäki-Tanila, Meuwissen and Fimland2005) was used as a base for the study. It includes 10 questions: (1) Is the market and product well defined, in relation to the system?; (2) Is the breeding goal well defined, in relation to the system?; (3) Is sensitivity to external factors addressed?; (4) Are sufficient economic, technical (including R&D) and human resources available?; (5) Can livestock resources and selection strategies secure a sufficiently large effective population size to keep inbreeding increase under 1% per generation?; (6) Is recording sufficient?; (7) Are the expected effects of selection predicted?; (8) Is genetic progress monitored and evaluated?; (9) Have time horizons and milestones been defined?; and (10) Is the profitability of the breeding scheme evaluated? When assessing farming systems using traditional, local breeds, questions about the characteristics of the breed were added to that list, based on Ruane (Reference Ten Napel, Van der Veen, Oosting and Groot Koerkamp1999).
Most of the data were collected from the breeding organisations. Some data were also collected from the 135 farms included in the Q-PorkChains project. The farm data were collected during farm visits when data for the other themes studied in the project were obtained. On average, five farmers per farming system (range 0 to 11) provided data for this study on breeding activities; 70 farmers in total.
Participating breeding organisations were contacted by e-mail or telephone; the nature and purpose of Q-PorkChains were explained. A questionnaire (Supplementary Table S1) was sent to the breeding organisation (five cases), or used as the basis of an interview conducted over the telephone (two cases) or during an arranged visit (three cases). Those who collected the information were instructed to collect the answers given by the breeding organisation without evaluating them. The people answering the questions at the breeding organisation were geneticists and breeders with an active role in the breeding work. For one farming system, data were collected separately for sire and dam lines. The questionnaire was presented in English (for half of the studied farming systems) or translated into the local language. Likewise, the answers were sometimes given in English and sometimes translated into English by those collecting the information. The information collectors were all researchers involved in Q-PorkChains.
Evaluation of qualitative data
Breeding activities performed in the 15 farming systems were evaluated based on qualitative data from breeding organisations and farmers. The breeding organisations, some of which were competitors, were not expected to reveal details of their breeding work. Thus, rather general questions were asked, and brief answers were requested. The assessment is therefore based on the way the breeding organisations described their work, rather than on their actual results. For example, information about genetic progress, expressed in euros per annum, was not sought, and thus was not evaluated. Instead, the content of the breeding goal and the relevance of the selection traits were evaluated. Likewise, the evaluation was based on the breeding organisation’s description of how they handle inbreeding instead of estimates of increase in inbreeding rate.
Answers from the respondents were arranged in four dimensions, all of which were assumed to be equally important for sustainability (Supplementary Table S2). The first dimension, ‘Breeding goal and market’, concerned the question whether the market for the product was well defined, and whether the breeding goal reflected the farming system and the farmers’ demands. It also included questions on sensitivity to external factors, the breeding organisation’s definition of sustainable breeding and future threats to the breeding programme. The second dimension, ‘Recording and selection’, described routines for data collection, selection procedures and estimation of predicted and realised genetic change in traits important within the system. The issue of whether the recording was sufficient to achieve the breeding goal, and the issue how the different traits were balanced within this goal, were included here as well as questions on economic weights. The third dimension, ‘Genetic variation’, described genetic variation, both within and between pig breeds. This dimension included questions on effective population size and monitoring of increase in inbreeding rate (e.g. use of optimum contribution selection), on uniqueness of breed and the risk of extinction (local breeds), and on different stakeholders’ interests in the management of genetic diversity. The fourth dimension, ‘Management of the breeding organisation’, described the functioning of the breeding organisation and included questions on statement of goals for market share and customers’ demands and subscription to the Code of Good Practice (Code EFABAR). Communication and transparency, as well as available human and technical resources, were covered by this dimension. Use of methods such as marker-assisted selection and genomic selection was also included.
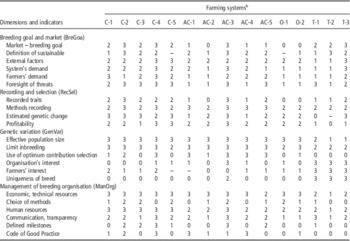
The answers from all questionnaires were transformed into standardised notes by the first author of this article, and the assessment was based on these notes. Supplementary Table S2 shows which questions in the questionnaire that were used to evaluate the different indicators included in the four dimensions. In total, 22 indicators (4 to 6/dimension) were used for the assessment (Table 2). A subjective evaluation of sustainability, based on the information in the standardised notes, was made. The evaluation used a scale of 0 to 3, where 0=‘unfavourable effect’, 1=‘no or a small favourable effect’, 2=‘favourable effect’ and 3=‘very favourable effect’ on sustainability. For example, the following notes from four questions (describing a Conventional farming system) were combined and assessed as score 3 for the indicator called ‘Foresight of threats’.
Indicator scoresFootnote a for 15 contrasted pig farming systems evaluated with regard to the sustainability of the breeding activities
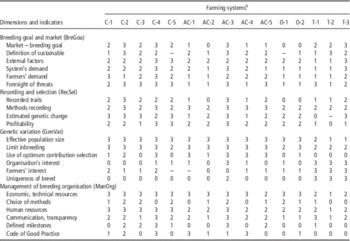
a All indicators were evaluated along a 0 to 3 scale, where 0 means unfavourable effect, 1 means no or a small favourable effect, 2 means favourable effect and 3 means very favourable effect on sustainability.
b In total, 15 farming systems were included in the study and they were of four different categories. Five Conventional (C), five Adapted Conventional (AC), two Organic type (O) and three Traditional (T) systems were evaluated.
Question 2.2: What does the breeding organisation expect for the future of this system? Trends in political, economic and social attitudes, including social conformity (the degree to which that production system meets the requirements and expectations of the society) of production.
Answer: Animal welfare will become more important, especially in Europe. More emphasis on feed conversion. More empasis on piglet loss, vitality and mothering abilities; important to have a balanced breeding goal.
Question 2.3: Has the breeding organisation analysed the need for marketing?
Answer: There is a marketing committee actively describing the market needs in the future, in different parts of the world and for different production systems.
Question 6.2: Does the breeding organisation see any trends in the market?
Answer: Trends are pointing towards higher weights at slaughter, ‘easy-to-manage-sows’ for larger farms with less-educated staff and less work hours per animal.
Question 13: What is, according to the breeding organisation, the main future threat to the breeding programme? To the studied production system?
Answer: Trends in the market can be more or less predicted. However, trends in politics and legislation are hard to predict. This has a major impact on selection pressure on traits like boar taint and litter size. The largest threat for our pig industry is to keep the ‘license to produce’. Therefore, sustainability is important in our policy. It is a problem that pig producers do not clearly see this threat; they are busy surviving until next year because of the low economic results in the pig industry during the last years.
The same scale (0 to 3) was used to assess all indicators in all four dimensions, and averages of these scores were calculated for each farming system and dimension. Irrelevant indicators (e.g. method of recording selection traits in a farming system where no selection was performed) were not included in the calculation of the average dimension score. For some indicators, the fact that no answer had been provided was included in the evaluation (e.g. where a breeding organisation provided no answer to the question about future threats to the farming system). In cases of this kind, it was assumed that the relevant issue had not been discussed in the organisation, and this was treated as an unfavourable indictor so far as the sustainability of the breeding activities was concerned.
Statistical analyses of indicator scores
Statistical analyses of indicator scores were performed to describe similarities and differences between farming systems and associations between indicators. All statistical analyses were carried out in R version 2.8.1 (R Development Core Team, 2008). Correlations between indicator scores were calculated using the COR procedure (Pearson correlations). A principal component analysis (PCA) was performed, using the PCA procedure in R. The idea of PCA is to reduce the dimensionality of a data set with a large number of interrelated variables (i.e. the indicator scores in this study), whereas retaining as much as possible of the variation present in the data set (Jolliffe, Reference Jolliffe2002). The PCA was done with the 22 indicators presented in Table 2 as active variables and the 15 farming systems as individuals, ignoring the category of system they belonged to. Average scores per dimension and the overall assessment score for each farming system (named breeding programme, BP; the average of the four dimension scores) were included in the analysis as passive variables. A cluster analysis was then carried out. The aim of cluster analysis is to group a set of objects (i.e. the farming systems in this study) so that objects in the same group are more similar to each other than to those in other groups. The cluster analysis was based on the results of the PCA analysis (see e.g. Jollife, Reference Jolliffe2002). The cluster analysis was done using the AGNES procedure in R. The three resulting cluster groups of systems were then compared with the overall means of the 15 systems, using the CATDES procedure.
Results
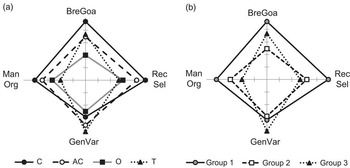
Results of the evaluation of the breeding activities related to the 15 farming systems are presented as indicator scores in Table 2 and the average dimension scores of the four categories of farming systems are presented in Figure 1a.
Assessment of breeding activities in 15 European pig farming systems sorted into four categories (C=Conventional; AC=Adapted Conventional; O=Organic type; T=Traditional) in Figure 1a and into three groups as defined by a cluster analysis in Figure 1b (group 1 includes farming systems C-1, C-2, C-3, C-4, C-5, AC-3 and AC-5; group 2 includes AC-1, AC-2, AC-4, O-1 and O-2; and group 3 includes T-1, T-2 and T-3). The assessment includes four dimensions: Breeding goal and market (BreGoa), Recording and selection (RecSel), Genetic variation (GenVar) and Management of breeding organisation (ManOrg). The scores range from 0 (unfavourable effect on sustainability) to 3 (very favourable effect on sustainability).

Evaluation of conventional farming systems
Among the Conventional systems (C-1 to C-5), C-4 had the highest score for ‘Breeding goal and market’ (Table 2). This score was connected with better knowledge of the market and of external factors influencing the farming system, a broad definition of sustainability, and a good match between farming system and breeding goal. Furthermore, the breeding organisation involved in C-4 seemed to have reflected on future threats to the farming system. C-4 also had the highest score for ‘Management of breeding organisation’, which was connected with applications of the Code of Good Practice, an emphasis on communication and transparency, and substantial economic and technical resources. C-1 had the lowest score for ‘Breeding goal and market’. It was related to a narrow definition of sustainable breeding and limited analyses of the market. C-2 had the highest score for ‘Recording and selection’ largely because it achieved a good match between goal traits and the recording of selection traits, and because it used clear instructions on how to perform recordings. C-2 also estimated the genetic gain and evaluated the profit of the breeding programme regularly, but its monitoring of negative side-effects of selection seemed weak. C-3 and C-5 had low scores for ‘Genetic variation’. This was connected with failure to employ optimum contribution selection and one of them seemed to have a low level of interest in the management of genetic diversity. Furthermore, the breeds here were not unique, although this was something they shared with all other conventional systems (Table 2).
Evaluation of differentiated systems
In the Adapted Conventional systems (AC-1 to AC-5) the range between the highest and the lowest scores was wider than that observed in the Conventional systems (Table 2). AC-3, which had the highest scores for all dimensions, was the only Adapted Conventional system that had a breeding programme specially developed for the farming system; the others used genetic material selected for conventional production. AC-1 and AC-4 had very similar scores, and they used animals from the same breeding programme. The breeding programme behind AC-1 and AC-4 obtained higher scores for the Conventional farming system than the breeding programme behind AC-2, and this was also reflected in the scores for the Adapted Conventional systems.
The two Organic farming systems (O-1 to O-2) both used genetic material from breeding programmes developed for conventional production and they had similar scores for all indicators. The Traditional farming systems (T-1 to T-3) were based on local breeds. Here the management of animal genetic resources was the main issue. T-2 performed no genetic evaluation, and T-1 had only one trait in its genetic evaluation. T-3, which had a broad breeding goal relevant to the farming system and its market, obtained high scores for ‘Breeding goal and market’ (Table 2).
Associations between indicators
Within each dimension a high score in one indicator was often correlated with a high score in another indicator (Supplementary Table S3). A high score (⩾2) in ‘Market – breeding goal’ (n=9) was often accompanied by a high score in ‘System’s demand’ (7 out of 9) and in ‘Foresight of threats’ (8 out of 9). Likewise, a high score in ‘Organisation’s interest’ (n=4) was always associated with a high score in ‘Uniqueness of breed’. The only within-dimension negative correlations were observed in the dimension ‘Genetic variation’, where high scores in ‘Organisation’s interest’, ‘Farmer’s interest’ and ‘Uniqueness of breed’ were accompanied by low scores in ‘Effective population size’ and ‘Limit inbreeding’.
Associations between dimensions
Three of the four average dimension scores were significantly correlated but the average dimension score for ‘Genetic variation’ was not correlated to the other average dimension scores (Supplementary Table S4). All farming systems with high scores (⩾2) for ‘Breeding goal and market’ (n=7) had high scores also for ‘Recording and selection’ and all farming systems with high scores for ‘Management of the breeding organisation’ (n=3) had high scores also for ‘Breeding goal and market’. ‘Recorded traits’ was positively correlated with many of the indicators in ‘Breeding goal and market’ and ‘Management of breeding organisation’. ‘Human resources’ was positively correlated with many of the indicators in ‘Breeding goal and market’ and ‘Recording and selection’ (data not shown).
Comparison of farming system categories
When the average scores for each dimension in different categories of farming systems were compared, it was found that Conventional systems had higher scores for all dimensions except ‘Genetic variation’, where Traditional systems had the highest average (Figure 1a). The high score for ‘Genetic variation’ in Traditional systems is explained by the uniqueness of the breeds, and by the considerable interest in genetic biodiversity shown by the organisations and farmers. Both Organic farming systems (O-1 to O-2) used genetic material from breeding programmes developed for conventional production. The breeding organisations seemed to have limited awareness of the demands on animals in Organic farming systems, and this resulted in low scores, especially for ‘Breeding goal and market’. The low scores for ‘Management of breeding organisation’ in all Traditional systems were partly owing to lack of human resources in small organisations. The farming systems using genetic material from breeding organisations that had signed the Code of Good Practice (n=4) had, on average, slightly higher average dimension scores than systems using genetic material from breeding organisations not planning to sign the Code. This difference was greatest for ‘Recording and selection’ (2.2 as against 1.9).
PCA
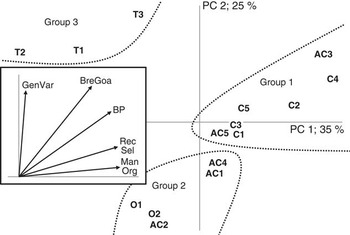
The first principal component of the PCA explained 34.9% of the total variation and it seemed to cover the breeding organisation and its activities. The indicators that contributed most to the first principal component were (listed in decreasing order of importance): ‘Human resources’, ‘Profitability’, ‘Effective population size’, ‘Defined milestones’ and ‘Economic, technical resources’. ‘Management of breeding organisation’ and ‘Recording and selection’ were highly related to this component (Figure 2). The second principal component of the PCA explained 24.7% of the total variation and it seemed to cover the breeds and the breeding goals. Indicators contributing most to the second principal component were (in decreasing order): ‘Market – breeding goal’, ‘Uniqueness of breed’, ‘Organisation’s interest’, ‘Farmers’ interest’ and ‘Effective population size’. ‘Genetic variation’ was highly related to this component (Figure 2).
Map of 15 contrasted pig farming systems on the plane defined by the first and second components of a principal component analysis (PCA). Systems C-1 to C-5 are Conventional; AC-1 to AC-5 are Adapted Conventional; O-1 and O-2 are Organic type; T-1 to T-3 are Traditional. The dotted lines delineate three groups of systems identified by the cluster analysis. The factor map is presented as an inset at the left of the figure. For clarity the supplementary variables, that is, average dimension scores and the overall assessment score (BP), are presented instead of the 22 active variables that participated in the PCA analysis. BreGoa=Breeding goal and market; RecSel=Recording and selection; GenVar=Genetic variation; ManOrg=Management of breeding organisation; BP=overall assessment of breeding programmes.

Cluster analysis
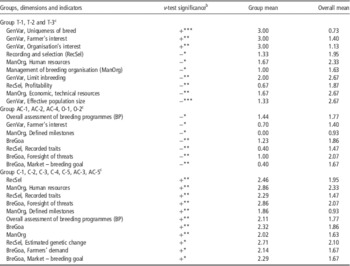
The cluster analysis resulted in the identification of three groups. The position of the groups on the PCA map is shown in Figure 2. Characteristics of the three groups are presented in Figure 1b and Table 3. One group included the three Traditional farming systems. This group deviated positively from the overall mean with regard to ‘Uniqueness of breed’ and negatively with regard to ‘Effective population size’. One group included the two Organic systems; it also included three of the Adapted Conventional systems, of which two have claims on animal welfare and one on meat quality. This group deviated negatively from the overall mean, especially with regard to ‘Market – breeding goal’. The last group included all of the Conventional systems, and then two Adapted Conventional systems, both of which made claims in respect of superior meat quality. This group deviated positively from the overall mean, especially with regard to ‘Defined milestones’.
Differences between the group means and overall mean for three groups of pig farming systems identified by a cluster analysisFootnote a

BreGoa=Breeding goal and market; RecSel=Recording and selection; GenVar=Genetic variation; ManOrg=Management of breeding organisation.
a Indicators with non-significant differences are not shown.
b A positive v-test indicates that the mean score for the group is higher than the overall mean and a negative v-test indicates that it is lower. *P⩽0.05; **P⩽0.01; ***P⩽0.001.
c Systems C-1 to C-5 are Conventional; AC-1 to AC-5 are Adapted Conventional; O-1 and O-2 are Organic type; T-1 to T-3 are Traditional.
Discussion
Strengths and weaknesses of the different categories and groups of farming system
Both between and within categories of farming system considerable variety in the sustainability of breeding activities was found. By comparing the results of a specific farming system with other systems within the same category, breeding organisations and their customers can identify the weaknesses they need to tackle. This could help the breeding organisations to contribute to the improvement of the sustainability of the farming systems they provide animals and semen to.
According to Figure 1a, animal breeding seem to be a weak point of organic production. Different possibilities to improve the genetic material used for Organic farming systems are discussed in a study by Nauta et al. (Reference Nauta, Spengler Neff, Conington, Ahlman, Løvendahl and Rydhmer2012). In general, the Conventional systems obtained the highest mean scores in three of the four dimensions, that is, in ‘Breeding goal and market’, ‘Recording and selection’ and ‘Management of breeding organisation’. The highest overall score was, however, achieved by an Adapted Conventional system (AC-3). That system, together with another Adapted Conventional system (AC-5), joined with all the Conventional systems to form group 1 in the cluster analysis. Figure 1a and b show very similar overall assessments of the category Conventional and the group 1. Group 1 had a significantly higher overall assessment score than the mean of all systems (Table 3). It was associated with breeding organisations that have defined goals for genetic progress, market share and acceptance. AC-3 had a specific breeding programme for its farming system. This was not the case for AC-5, but the breeding organisation providing the genetic material to AC-5 was well aware of the needs of this system. The breeding organisations involved in this group cooperate with other organisations and universities, and they have a large and well-educated staff. They record relevant selection traits and run education programmes for farmers and staff. They have also tried to foresee future developments in societal demand and anticipate threats to the production. Ten Napel et al. (Reference Woolliams, Berg, Mäki-Tanila, Meuwissen and Fimland2011) proposed that the resilience of farming systems is enhanced by the ability of people to base their decisions on what they expect in the future.
The three Traditional farming systems, which formed their own group (group 3), are vulnerable with regard to breeding activities as a result of their small scale. Their low score in ‘Management of breeding organisation’ (Figure 1a and b) is mainly because of the limited human and technical resources available in small breeding organisations. This group also differs negatively from the overall mean in ‘Profitability’, which reflects the breeding organisation’s performance and presentation of economic analyses. Hoffmann (Reference Hoffmann2011) states that society should reward livestock keepers conserving at-risk breeds and create both economic incentives (e.g. economic support to breed conservation organisations) and non-economic incentives (e.g. exhibitions where hobby breeders can show their animals).
The issue of within-breed v. between-breeds variation in livestock biodiversity is illustrated by the negative correlations between indicator scores within the dimension ‘Genetic variation’ (Supplementary Table S3). Between-breeds variation (i.e. keeping many different breeds) could be regarded as the responsibility of the society, whereas within-breed variation is the responsibility of the breeding organisation and the farmers. In spite of the small population sizes for two of the traditional breeds, and the attendant risk of increased inbreeding, the focus on biodiversity in Traditional systems earned them high scores in ‘Genetic variation’. Their management of genetic resources could, however, be improved. Gourdine et al. (Reference Gourdine, Sørensen and Rydhmer2012) showed in a simulation study that optimum contribution selection opens up room for selection in populations of the same small size as those included in this study. The organisations involved in these systems, which are more focused on conserving local breeds than selection, could use optimum contribution selection with substantial weight on relationship relative to breeding score. This would lower the increase in inbreeding rate. The mean score of ‘Limit inbreeding’ for the group of Traditional systems was significantly lower than the overall mean.
Three of the Adapted Conventional and both Organic systems formed one group (group 2 in Figure 1b). These five systems all used genetic material from sire and dam lines selected for conventional production. This group was characterised by low average scores for ‘Breeding goal and Market’ and ‘Recording and selection’ as no traits of specific importance in these farming systems were recorded or included in the breeding goal. For example, the genetic material used in the Organic systems was not selected with the aim of improving health, although one of IFOAM’s general principle states: ‘Organic management practices promote and maintain the health and well-being of animals through… breed selection for resistance to diseases, parasites and infections’ (IFOAM, 2013). Likewise, pork from one of the Adapted Conventional systems in this group is marketed as a gourmet product but the assessment by Gonzàlez et al. (Reference Gonzàlez, Gispert, Gil, Hviid, Dourmad, de Greef, Zimmer and Fàbrega2014) reveals that meat quality is lower than average for the 15 systems evaluated in Q-PorkChains. In spite of this weakness, no meat quality trait is included among the selection traits. The mean score of this group was also low for ‘Market – breeding goal’, as a result of the breeding organisations’ ignorance of non-conventional systems and their lack of concern with genotype–environment interactions. The improvement of traits relating to disease resistance, leg problems, sow longevity and mothering ability is especially important in non-conventional systems (Pryce et al., Reference Pryce, Conington, Sorensen, Kelly and Rydhmer2004; Wallenbeck, Reference Wallenbeck2009). The proper management of a breeding programme is, however, expensive, and most non-Conventional systems are simply too small to handle the costs of a special breeding programme within their systems. The European Consortium for Organic Animal Breeding recently presented an overview of organic animal breeding that highlighted these kinds of problems typically arising in organic animal production (Nauta et al., Reference Nauta, Spengler Neff, Conington, Ahlman, Løvendahl and Rydhmer2012).
The breeding organisation is crucial for the sustainability of a farming system. The PCA showed that the first principle component, which could (in a simplified way) be named ‘the organisation’, explained one-third of the total variation. The second principle component could be named ‘the animals’ and it explained a quarter of the total variation (Figure 2). Increased awareness, within breeding organisations, of the diversity of farming systems in which their animals and semen are used, could result in more sustainable developments in breeding work in general. Differentiated possibilities, such as using different economic weights when ranking AI boars for non-conventional systems, could also be more readily identified. Gourdine et al. (Reference Gourdine, de Greef and Rydhmer2010) simulated the effect of different economic weights on animal welfare in outdoor farming systems. Improvements in traits impacting positively on welfare were achieved together with a reduction in the genetic gain in production traits. Thus, the implementation of a breeding programme for welfare in outdoor production should not focus on the market value of genetic progress alone (Gourdine et al., Reference Gourdine, de Greef and Rydhmer2010). To the extent that further changes in systems, market or society are to be expected, the low score for ‘Foresight of threats’ (Table 2), which includes analysis of need for marketing and social conformity, in group 2 (AC-1, AC-2, AC-4, O-1 and O-2) is a cause for concern.
The method of evaluation
The evaluation revealed substantial differences in the farming systems with a clear bearing on their long-term sustainability. In the Q-PorkChains project the 15 farming systems included in this study have been evaluated separately against seven other themes of sustainability (Bonneau et al., Reference Bonneau, de Greef, Brinkman, Cinar, Dourmad, Edge, Fàbrega, Gonzàlez, Houwers, Hviid, Ilari-Antoine, Klauke, Phatsara, Rydhmer, van der Oever, Zimmer and Edwards2014a and Reference Bonneau, Klauke, Gonzàlez, Rydhmer, Ilari-Antoine, Dourmad, de Greef, Houwers, Cinar, Fàbrega, Zimmer, Hviid, van der Oever and Edwards2014b). Most of the data collected for those themes were recorded quantitatively, for example, frequency of pigs with skin lesions. By contrast, the data in this assessment were verbal. The interpretation of responses to the questionnaire and the following transformation of notes to the scores that formed the basis of our analysis, are in this sense both subjective and capable of being questioned. Notwithstanding this, the group analysis revealed informative contrasts between three groups of systems. According to the cluster analysis, the Traditional systems and the Conventional systems were positioned in different groups, which could be expected. The Adapted Conventional systems were, however, located in two different groups; some of them were grouped together with the Conventional systems and the others together with the Organic systems. Conventional and differentiated systems using genetic material from the same breeding organisation were positioned in different groups, which illustrates that an evaluation of the sustainability of breeding activities should be performed based on farming system rather than on breeding organisation.
An assessment similar to the one reported here, but performed by the breeding organisation itself, could also include information on estimates of realised genetic progress and increase in inbreeding rate. In this way, the development of the breeding work over time could be monitored and evaluated. Each breeding organisation needs to adapt the concept of sustainability to its and its stakeholders’ specific needs (Gamborg and Sandøe, Reference Gamborg and Sandøe2005). Thus, an assessment of the kind performed in this study might have a greater influence on the development of the breeding work if it is performed by each breeding organisation. In fact, the checklist by Woolliams et al. (Reference Woolliams, Berg, Mäki-Tanila, Meuwissen and Fimland2005) was developed for the breeding organisations’ own use. It should, however, be remembered that breeding organisations are competing in an open market. In an internal evaluation, an organisation’s own results would not be compared with the results of competitors unless specific agreements were made between them. The provision of a base for bench-marking could, perhaps, be a task for an independent organisation such as EFFAB in the future.
The present study shows that evaluation of the sustainability of breeding activities across several countries and on a large scale is feasible. Using a questionnaire, we were able to collect qualitative data about breeding activities from 15 farming systems and 9 breeding organisations, which provided these systems with animals and semen. The responses we obtained depended on the knowledge of the person answering the questionnaire, and also, of course, the knowledge of the person who asked the questions and translated the answers. Ideally, all data should be collected in interviews performed by just one geneticist who is fluent in all of the national languages involved, but in practice this will no doubt prove impossible. By making some of the questions more specific, and providing multiple-choice answers to others, it would be possible to improve the comparability of the raw data collected in the survey. On the other hand, spontaneous answers to open questions like ‘How do you define sustainable breeding?’ probably reveal more about consciousness of sustainability issues within an organisation than multiple-choice responses. According to Glavič and Lukman (Reference Glavič and Lukman2007), the delivery of sustainable systems will require a change in thinking patterns and life styles. Change of this sort is probably better captured in qualitative studies rather than through quantitative investigations.
Correlations between scores within a dimension show some questions to be redundant. For example, the correlation between ‘Uniqueness of breed’ and ‘Organisation’s interest’ (in genetic variation) was above 0.9. A revised questionnaire should include fewer questions, of which some have multiple-choice answers, in order to make it more user friendly than the original questionnaire presented in Supplementary Table S1.
Societal values and acceptance of pig meat
The long-term nature of sustainability is emphasised in EFFAB’s Code of Good Practice (EFFAB, 2013). The outcome of livestock breeding is, however, very often expressed in economic terms, with a focus on the current perspective of commercial farmers. This tends to lead to the prioritisation of traits that are profitable in the short term. The questionnaire included questions on goal traits important for the income or the costs of production in a short-term economic perspective as well as traits related to animal welfare, consumer health and environmental impact (see questions 4.9 and 5.9 to 10 in Supplementary Table S1). Olesen et al. (Reference Olesen, Groen and Gjerde2000) discuss how the selection pressure on a trait favouring sustainable production in the long term can be increased by augmenting the economic weight with a weight based on a non-market value. In this study, few of the breeding organisations described their selection traits in terms of ‘traits with market values’ and ‘traits with non-market values’ when answering the questionnaire. This may reflect the fact that the geneticists are unfamiliar with the scientific literature on economic weighting (e.g. Olesen et al., Reference Olesen, Groen and Gjerde2000; Kanis et al., Reference Kanis, de Greef, Hiemstra and van Arendonk2005), which would not be very encouraging so far as sustainable development is concerned. Alternatively, the explanation may be that geneticists regard description couched in these terms as irrelevant, which by contrast could be a good sign of a long-term perspective. One of the geneticists stated: ‘All traits have market value, in the short or long term’. The breeding organisation for which this person worked had one of the broadest breeding goals and had the highest scores in several dimensions.
The farmer’s interest in animal production and consumer’s acceptance of farming systems and the resulting products are important factors in all breeding programmes. Both meat quality traits and traits important for welfare are highly relevant to societal approval, and thus critical in sustainable production. The environmental impact of animal production might have been less obvious to consumers and citizens in the past but the debate following the FAO report Livestock’s long shadow (Steinfeld et al., Reference Wallenbeck2006) has increased public awareness in this area. Consequently, some breeding organisations in this study stress the importance of the relationship between high feed efficiency and low environmental impact. There are, however, several conflicts between the goals of animal welfare and the goals of reducing environmental impact. For example, loose-housed sows on deep litter may enjoy greater welfare but also generate more greenhouse gases. The breeding organisations’ awareness of such goal conflicts, and their willingness to discuss these in relation to their breeding, is one step towards adaptation to the demands of future members of society. Thus, the revised questionnaire should include questions about goal conflicts with an impact on the development of sustainable breeding.
Both Gamborg and Sandøe (Reference Gamborg and Sandøe2005) and EFFAB (2013) have stressed the importance of communication and transparency in efforts to maintain sustainable farm animal breeding. A constructive dialogue between different stakeholders may be even more important when new genetic techniques are introduced to animal breeding (Gibbs et al., Reference Gibbs, Holloway, Gilna and Morris2009). The present study shows how pig breeding programmes can be evaluated and described, but the questionnaire can be used also as a tool to stimulate dialogue with stakeholders, including consumers.
Concluding remarks
A weakness shared by most of the studied Adapted Conventional and Organic systems is that their breeding goals are not tailored to the farming system. For example, an Adapted Conventional system claiming superior meat quality could be expected to include a meat quality trait in the genetic evaluation. On the other hand, the results of this study show that an Adapted Conventional system with an adapted breeding programme can achieve very good results across a range of sustainability aspects. The scores obtained for the five Conventional systems evaluated in this study display considerable variation. As the great majority of pigs are farmed in conventional systems, real gains in the sustainability of European pig production would be secured if the breeding activities of all conventional systems were to reach the same level as the best such system in this study.
Acknowledgements
The authors gratefully acknowledge the European Community’s financial participation under the Sixth Framework Programme for Research, Technological Development and Demonstration Activities, for this Integrated Project Q-PorkChains FOOD-CT-2007-036245. The authors also wish to thank the breeding organisations that participated in this study and the geneticists and farmers who took time to respond to the questionnaires, and Albrecht Weber, Joel Gonz��lez, Julie Ryschawy, Monica Hansson, Per Eidnes Sorensen and Wim Houwers for collecting and editing data.
Disclaimer: The views expressed in this study are the sole responsibility of the authors and do not necessarily reflect the views of the European Commission. Neither the European Commission nor any person acting on behalf of the Commission is responsible for the use that might be made of the information. The information in this study is provided as it is, and no guarantee is given that the information is fit for any particular purpose. The user, therefore, uses the information at its sole risk and liability.
Supplementary material
To view supplementary material for this article, please visit http://dx.doi.org/10.1017/S175173111400216X