Introduction
The world’s population is expected to reach 9 billion people by 2050. It is a great challenge to ensure both food security and sustainable development at the same time (Zhao et al., Reference Zhao, Miao, Wang, Su, Fan and Zhang2013; Chen et al., Reference Chen, Cui, Fan, Vitousek, Zhao and Ma2014). Wheat is an important food crop in China, and over-application of nitrogen (N) fertilizers is very common in North China Plain (NCP), resulting in serious environmental problems (Miao et al., Reference Miao, Stewart and Zhang2011).
Precision N management (PNM) aims to optimize N fertilizer inputs by considering both spatial and temporal variability in crop N demand and N supply and has been regarded as a promising strategy to improve N use efficiency (NUE) and protect the environment (Miao et al., Reference Miao, Mulla, Hernandez, Wiebers and Robert2007; Cao et al., Reference Cao, Cui, Chen, Khosla, Dao and Miao2012; Diacono et al., Reference Diacono, Rubino and Montemurro2013). The GreenSeeker active crop canopy sensor-based PNM strategy has been demonstrated to significantly increase NUE for winter wheat and rice as compared with farmer’s practice in China, but did not increase crop yield (Li et al., Reference Li, Miao, Zhang, Cui, Li and Chen2009 and Yao et al., Reference Yao, Miao, Huang, Gao, Ma and Zhao2012). In recent years, scientists have developed regionally optimum crop management (ROCM) practices to increase crop yield, resource use efficiency and reduce environmental pollution at the same time. Such strategies don’t consider field to field soil fertility and crop growth variability or year to year weather differences; therefore, there are still rooms for further improvements. It is a practical strategy to combine PNM and ROCM practices to increase both grain yield and NUE compared with farmer’s practice and to further improve NUE compared with ROCM (Zhao et al., Reference Zhao, Miao, Wang, Su, Fan and Zhang2013).
The GreenSeeker sensor has two spectral bands (red and near-infrared) and vegetation indices, with the normalized difference vegetation index (NDVI) being commonly used in PNM. This index becomes saturated at medium and high biomass conditions (Yao et al., Reference Yao, Miao, Cao, Wang, Gnyp and Bareth2014; Cao et al., Reference Cao, Miao, Feng, Gao, Li and Liu2015). Crop Circle ACS 470 is a relatively new user-configurable active canopy sensor, with a choice of six different spectral bands covering blue, green, red, red edge and near-infrared regions. Some red edge-based vegetation indices derived from this sensor were found to be able to overcome the saturation problem of NDVI and were more suitable for high yield cropping systems (Cao et al., Reference Cao, Miao, Feng, Gao, Li and Liu2015; Reference Cao, Miao, Shen, Yu, Yuan, Cheng, Huang, Wang, Yang and Liu2016). Cao et al. (Reference Cao, Miao, Li, Gao, Liu and Lu2017) developed a new Crop Circle ACS 470 sensor-based PNM strategy for winter wheat, which needs further evaluation under on-farm conditions. The objective of this study was to evaluate the newly developed Crop Circle ACS 470 sensor-based PNM strategy in two different winter wheat cropping systems: farmer’s conventional management (FCM) and ROCM under on-farm conditions in NCP.
Material and Methods
Experimental site
The experiments were carried out in 2015–2016 in Laoling County, Shandong Province of NCP. The climate is warm-temperate semi-humid continental monsoon. It has annual sunshine hours of 2509.4 and the annual mean temperature is 12.4°C, with the maximum and minimum being 13.6°C and 11.2°C, respectively. The annual mean precipitation is 527.1 mm and the mean frost-free period is 198 days. Winter wheat is generally planted in early October and harvest in early June the following year.
Experimental design
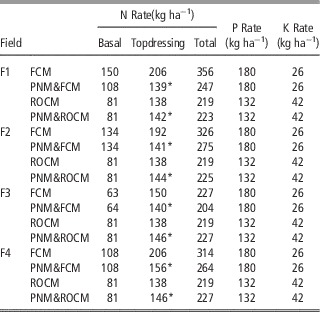
Four famer’s fields were selected for this study. In each field, there were four treatments: FCM, PNM in the FCM system (PNM&FCM), ROCM, PNM in the ROCM system (PNM&ROCM). The fertilizer application is shown in Table 1.
Fertilizer application rates for different treatments in four famers’ fields.

* The topdressing rate was determined according to the Crop Circle ACS 470 sensor-based N recommendation algorithm (Cao et al., Reference Cao, Miao, Li, Gao, Liu and Lu2017).
The FCM system was managed by the farmers according to his conventional practices using narrow-row seeding (17 cm row spacing) with 300 kg seeds ha−1. The ROCM system applied 219 kg Nha−1 in total, with 81 and 138 kg Nha−1 being applied as basal fertilizer before planting and as topdressing at Feekes 6 stage (BBCH 31, stem elongation stage), respectively. The ROCM integrated a series of high-yielding and high efficiency technologies, using wide-row planting (27 cm row spacing and 165 kg seeds ha−1) methods. In the PNM&FCM treatments, the same amount of basal N fertilizers as the farmers was generally applied, with the exception where one farmer applied 150 kg N ha−1 as basal fertilizer and the PNM&FCM treatment reduced the basal fertilizer rate. For PNM&ROCM, the basal N rate was the same as ROCM. For both PNM&FCM and PNM&ROCM, the topdressing N was applied at Feekes 6 stage based on the Crop Circle ACS470 sensor-based algorithm developed by Cao et al. (2017). Other managements of PNM&FCM and PNM&ROCM were the same as FCM and ROCM, respectively. The N source for topdressing was urea. No obvious water, weed, pest or disease stress was observed during the growing seasons.
Sensor data collection
The Crop Circle ACS-470 sensor was used to collect canopy reflectance across each plot at approximately 0.7–0.9 m above wheat canopy at 10 Hz (10 readings per second) in each plot at Feekes 6 stage, and the average values were used to represent each plot. The sensor path was parallel to the seed rows or the beam of light was perpendicular to the seed row.
Plant sampling and measurements
Plant samples were taken from scanned plants following sensing data collection in each plot at Feekes 6 stage. They were dried in the ovens at 105°C for 30 minutes and then at 75°C until constant weight for determination of dry weight biomass. The sub-samples ground to pass a 1 mm screen in a sample mill were mineralized using sulfuric acid—hydrogen peroxide (H2SO4–H2O2), and plant N concentration (PNC) was determined using the Kjeldahl method. The early season plant N uptake (PNU) was determined by multiplying PNC by dry aboveground biomass. At maturity stage, three 1 m2 areas were selected randomly in each plot for grain yield determination. Grain yield was adjusted to 14.5% moisture content.
Data analysis
The statistical analysis was performed using Microsoft Excel (Microsoft Corporation, Redmond, Washington, USA) and SPSS18.0 (SPSS Inc., Chicago, Illinois, USA).
Results
Predicting early season plant nitrogen uptake
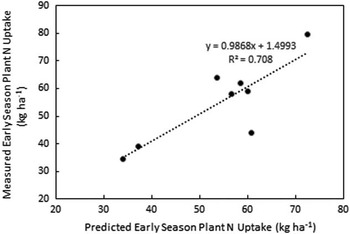
The early season PNU estimation model developed by Cao et al. (Reference Cao, Miao, Li, Gao, Liu and Lu2017) was used to predict the early season PNU in the farmer’s fields for estimating topdressing N application rate. The results indicated that the performance of this model was acceptable, with R2 being 0.71 (Figure 1).
The relationship between predicted early season plant N uptake (PNU) using the model developed by Cao et al. (Reference Cao, Miao, Li, Gao, Liu and Lu2016b) and the measured PNU in the farmer’s fields.

Nitrogen application rate
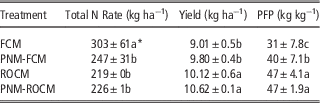
On average, the FCM system applied 303 kg ha−1 N fertilizers, which is typical in NCP. The PNM&FCM reduced N application by an average of 18% than FCM. The ROCM system applied 219 kg N ha−1, which was a reduction of 28% compared with FCM. The PNM&ROCM system applied similar amount of N fertilizers as ROCM (Table 2).
The average total N application rate, yield and N partial factor productivity (PFP) for different crop management systems

* Values followed by different letters within a column are significantly different (P<0.05)
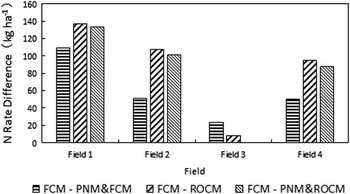
Field-specific analysis indicated that all the improved management systems saved more N fertilizers in Field 1 than other fields, due to the high N application rate by the farmer in Field 1. In Field 2 and 4, the three systems saved 50–100 kg N ha−1 than the FCM system. In Field 3, the three systems applied similar amount as the FCM system (Figure 2).
The total N rate differences between farmer’s conventional management (FCM) and precision N management (PNM) in FCM (PNM&FCM), regional optimum crop management (ROCM) and PNM in ROCM (PNM&ROCM) systems in different fields.

Grain yield and yield components
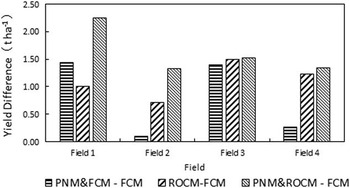
Compared with FCM, the PNM&FCM, ROCM and PNM&ROCM systems increased yield by an average of 9%, 12% and 18% over FCM, respectively. The PNM-ROCM system produced the highest yield, which was 5% higher than ROCM (Table 2). The PNM&FCM system increased about 1.4 t ha−1 yield than FCM in both Field 1 and Field 3, but did not increase yield in either Field 2 or Field 4. The PNM&ROCM system had the highest yield in Field 1, which was 13% higher than ROCM. In Field 2, the corresponding increase was 6%. In Field 3 and Field 4, these two systems produced similar yield (Figure 3).
The yield difference between precision N management (PNM) in farmer’s conventional management (FCM) (PNM&FCM), regional optimum crop management (ROCM) and PNM in ROCM (PNM&ROCM) systems and FCM (PNM&FCM minus FCM, ROCM minus FCM, and PNM&ROCM minus FCM) in different fields.

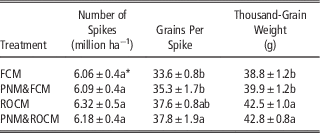
The yield component data indicated that the number of spikes was similar among different crop management systems, while the ROCM and PNM&ROCM systems had higher number of grains per spike and thousand-grain weight (Table 3). In the same crop management system, these yield components were not significantly affected by PNM.
The average number of panicles, grains per spike and thousand-grain weight for different crop management systems

* Values followed by different letters within a column are significantly different (P<0.05)
Partial Factor Productivity
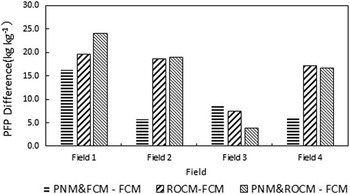
The PNM&FCM systems increased PFP by an average of 29% over FCM (Table 2). The ROCM and PNM&ROCM systems had the same PFP, which was 52% higher than the FCM system. The PNM&FCM improved PFP the most in Field 1 over FCM, which was an increase of 70%. In other three fields, the increase was all about 20%. In Fields 1, 2 and 4, the ROCM and PNM&ROCM all further increased PFP over PNM&FCM, while the PNM&ROCM only further increased PFP by 10% over ROCM in Field 1 (Figure 4).
The PFP difference between precision N management (PNM) in farmer’s conventional management (FCM) (PNM&FCM), regional optimum crop management (ROCM) and PNM in ROCM (PNM&ROCM) systems and FCM (PNM&FCM minus FCM, ROCM minus FCM, and PNM&ROCM minus FCM) in different fields.

Discussion
In the FCM system, using similar amount of basal N rate (except in Field 1) and only adjusting topdressing N application based on Crop Circle ACS 470 sensor-based N recommendation as developed by Cao et al. (Reference Cao, Miao, Li, Gao, Liu and Lu2017), PNM increased 9% yield using 18% less N fertilizers, resulting in an increase of 29% PFP. The basal N application rate was quite high except in Field 3, and should be further reduced to about 80 kg ha−1 as adopted in the ROCM system. This way, the PFP could be further improved. In Field 1, the PNM strategy reduced the basal N rate from 150 kg ha−1 to 108 kg ha−1, which resulted in an increase of 70% for PFP in this field.
The ROCM system reduced seeding rate by 45%, decreased N rate by 28%, but increased yield by 12% and improved PFP by 52% as compared with FCM. In FCM, the high planting density and N application rates resulted in more unproductive tillers. The ROCM system reduced planting density and N rate, which resulted in more productive tillers. Over-application of N fertilizers can also negatively affect the grain filling process and result in delayed maturity. As a result, the number of spikes was similar between ROCM and FCM, but ROCM and PNM&ROCM systems had higher grains per spike and thousand grain weight, and higher crop yields. This should result in significant increase in economic returns, which will be determined in further analysis.
An objective of this study was to determine if the PNM strategy can further improve NUE in the ROCM system. The result of this study indicated that the PNM strategy did not significantly increase yield or PFP as compared with ROCM. This was only based on results from 1 year and four fields, and more studies are needed to further test these systems. In addition, the sensor-based PNM was developed using data collected in Quzhou, Hebei Province, while the study was conducted in Laoling, Shandong Province. Although they are all located in NCP, they were about 300 km apart and farmers used quite different varieties. The sensor-based algorithm should probably be further updated using local data.
Conclusions
This study evaluated the Crop Circle ACS 470 sensor-based PNM strategy as developed previously for winter wheat in both FCM and ROCM systems. The results indicated that the PNM strategy significantly increased PFP by 29% in the FCM system, but did not have any significant improvement in the ROCM system, as compared with the farmer’s N management practice or the regional optimum N management. This result was based on only one year’s results obtained from four farmer’s fields. More studies are needed to further evaluate this PNM strategy in different crop management systems under more diverse on-farm conditions.
Acknowledgements
The authors would like to thank Jun Liang at Laoling County Bureau of Agriculture in Shandong Province for their assistance during this research. It was financially supported by the 973 National Basic Research Program (2015CB150405).