Introduction
The idealized “steady-state” glacier can only be found in textbooks. Climate is constantly changing on many time-scales, forcing ice masses to respond on a separate set of time-scales. When accurate measurements are collected, changes in ice thickness of any ice mass are usually detected. The spatial pattern of these changes is a powerful means to determine both the specific nature of the response and the kind of forcing. This is true whether the ice mass is a small mountain glacier or a large ice sheet. In this paper, both theoretical and applied approaches of classical glacier response are used to interpret published rates of ice-thickness change of three large ice streams of West Antarctica.
Ice streams are critical components of the ice flow in the potentially unstable West Antarctic ice sheet. Understanding their current behavior has been a major goal of recent Antarctic research. It is known that they flow on a lubricated, deforming, marine sediment at speeds faster than most glaciers, but with surface slopes much lower than most glaciers. The longitudinal pattern of ice-thickness change for Ice Stream B was published by Shabtaie and others (1988) and for Ice Streams D and E by Bindschadler and others (in press). This paper shows that this pattern is broadly consistent between these ice streams and argues that this pattern indicates these ice streams are actively surging. Thinning at the heads of the ice streams implies the West Antarctic ice sheet may have a lifetime of 1200–6000 years.
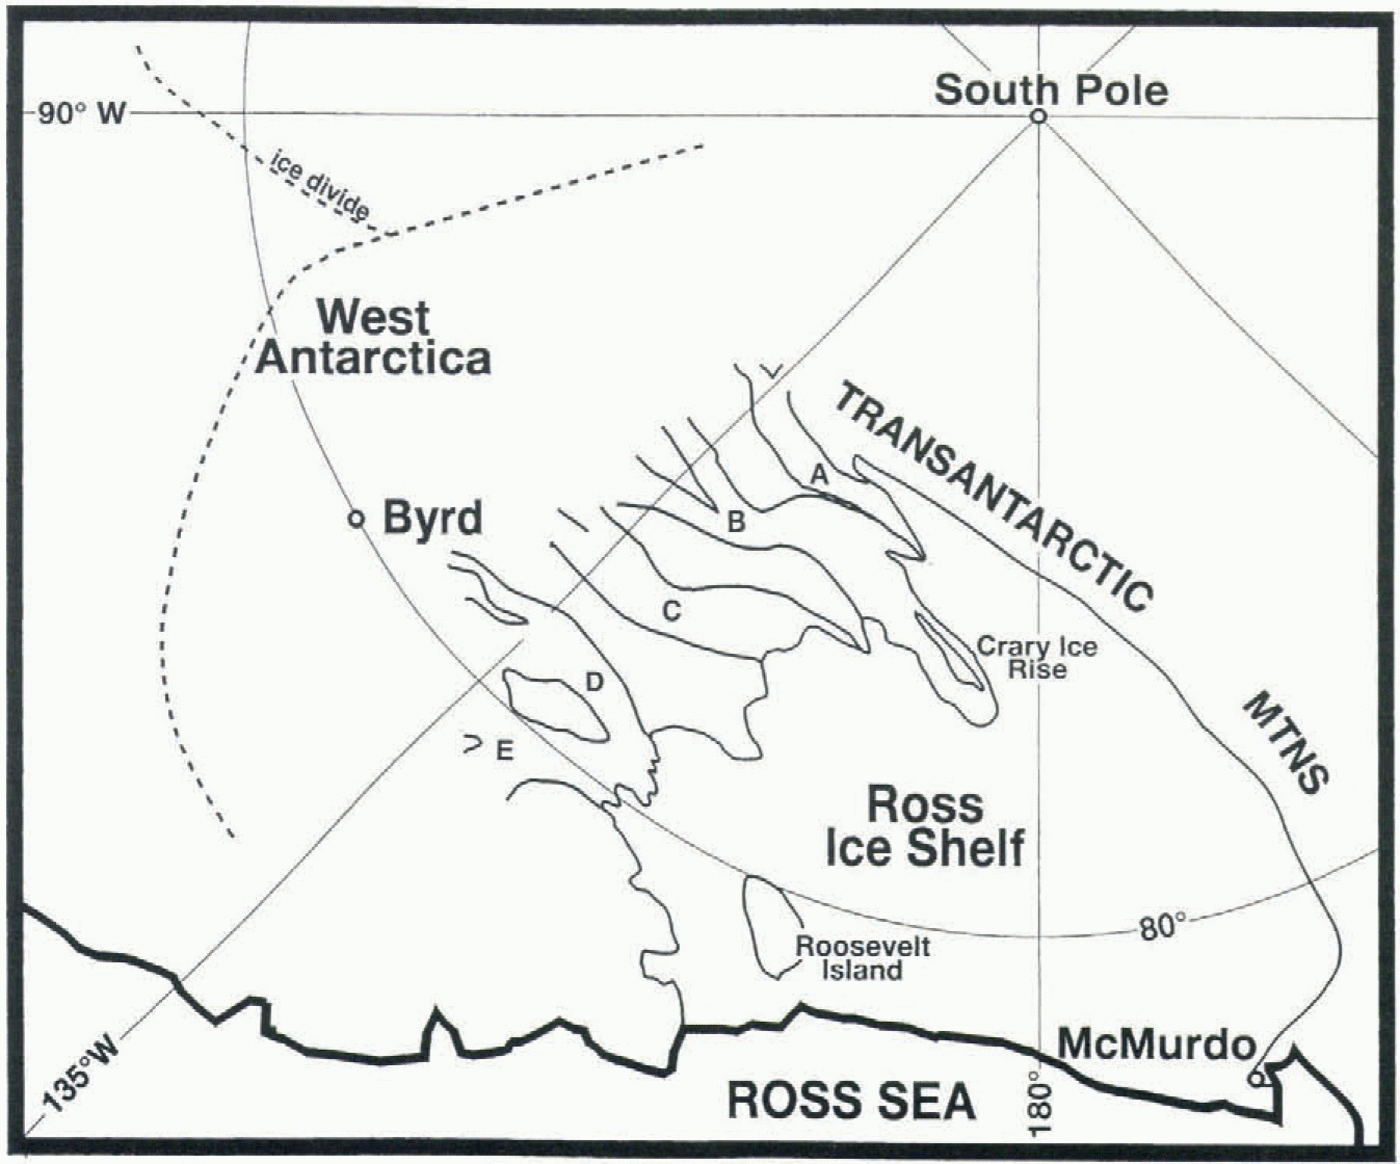
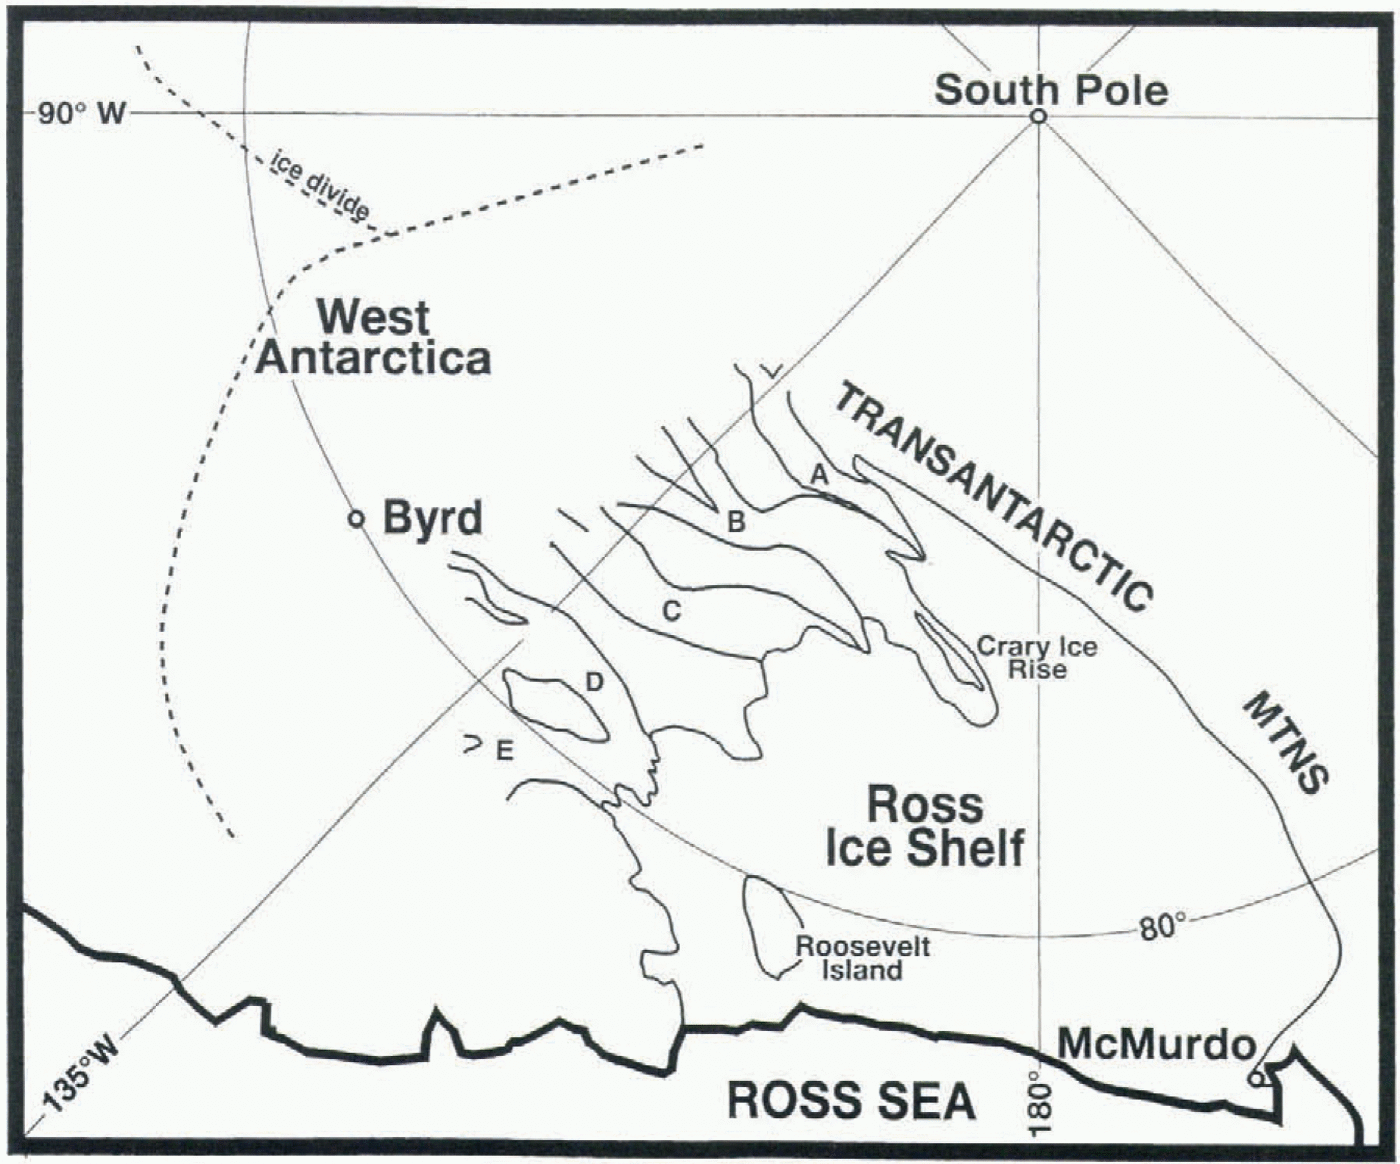
Map of ice streams draining the West Antarctic ice sheet into the Ross Ice Shelf.
Mass-Balance Patterns of Ice Streams B, Dand E
The West Antarctic ice sheet drains roughly one-third of its mass into the Ross Ice Shelf. Ice Streams B, D and E are the primary routes; Ice Stream C is inactive and Ice Stream A’s catchment lies more in East Antarctica (Fig. 1). The mass balance of Ice Stream B was determined by studying it through a combination of airborne radar (for ice thickness) and surface surveys combined with aerial photogrammetry (for ice velocity) (Shabtaie and others, 1988). Mass-balance calculations of Ice Streams D and E were based on a combination of surface and airborne radar and satellite imagery (Bindschadler and others, in press).
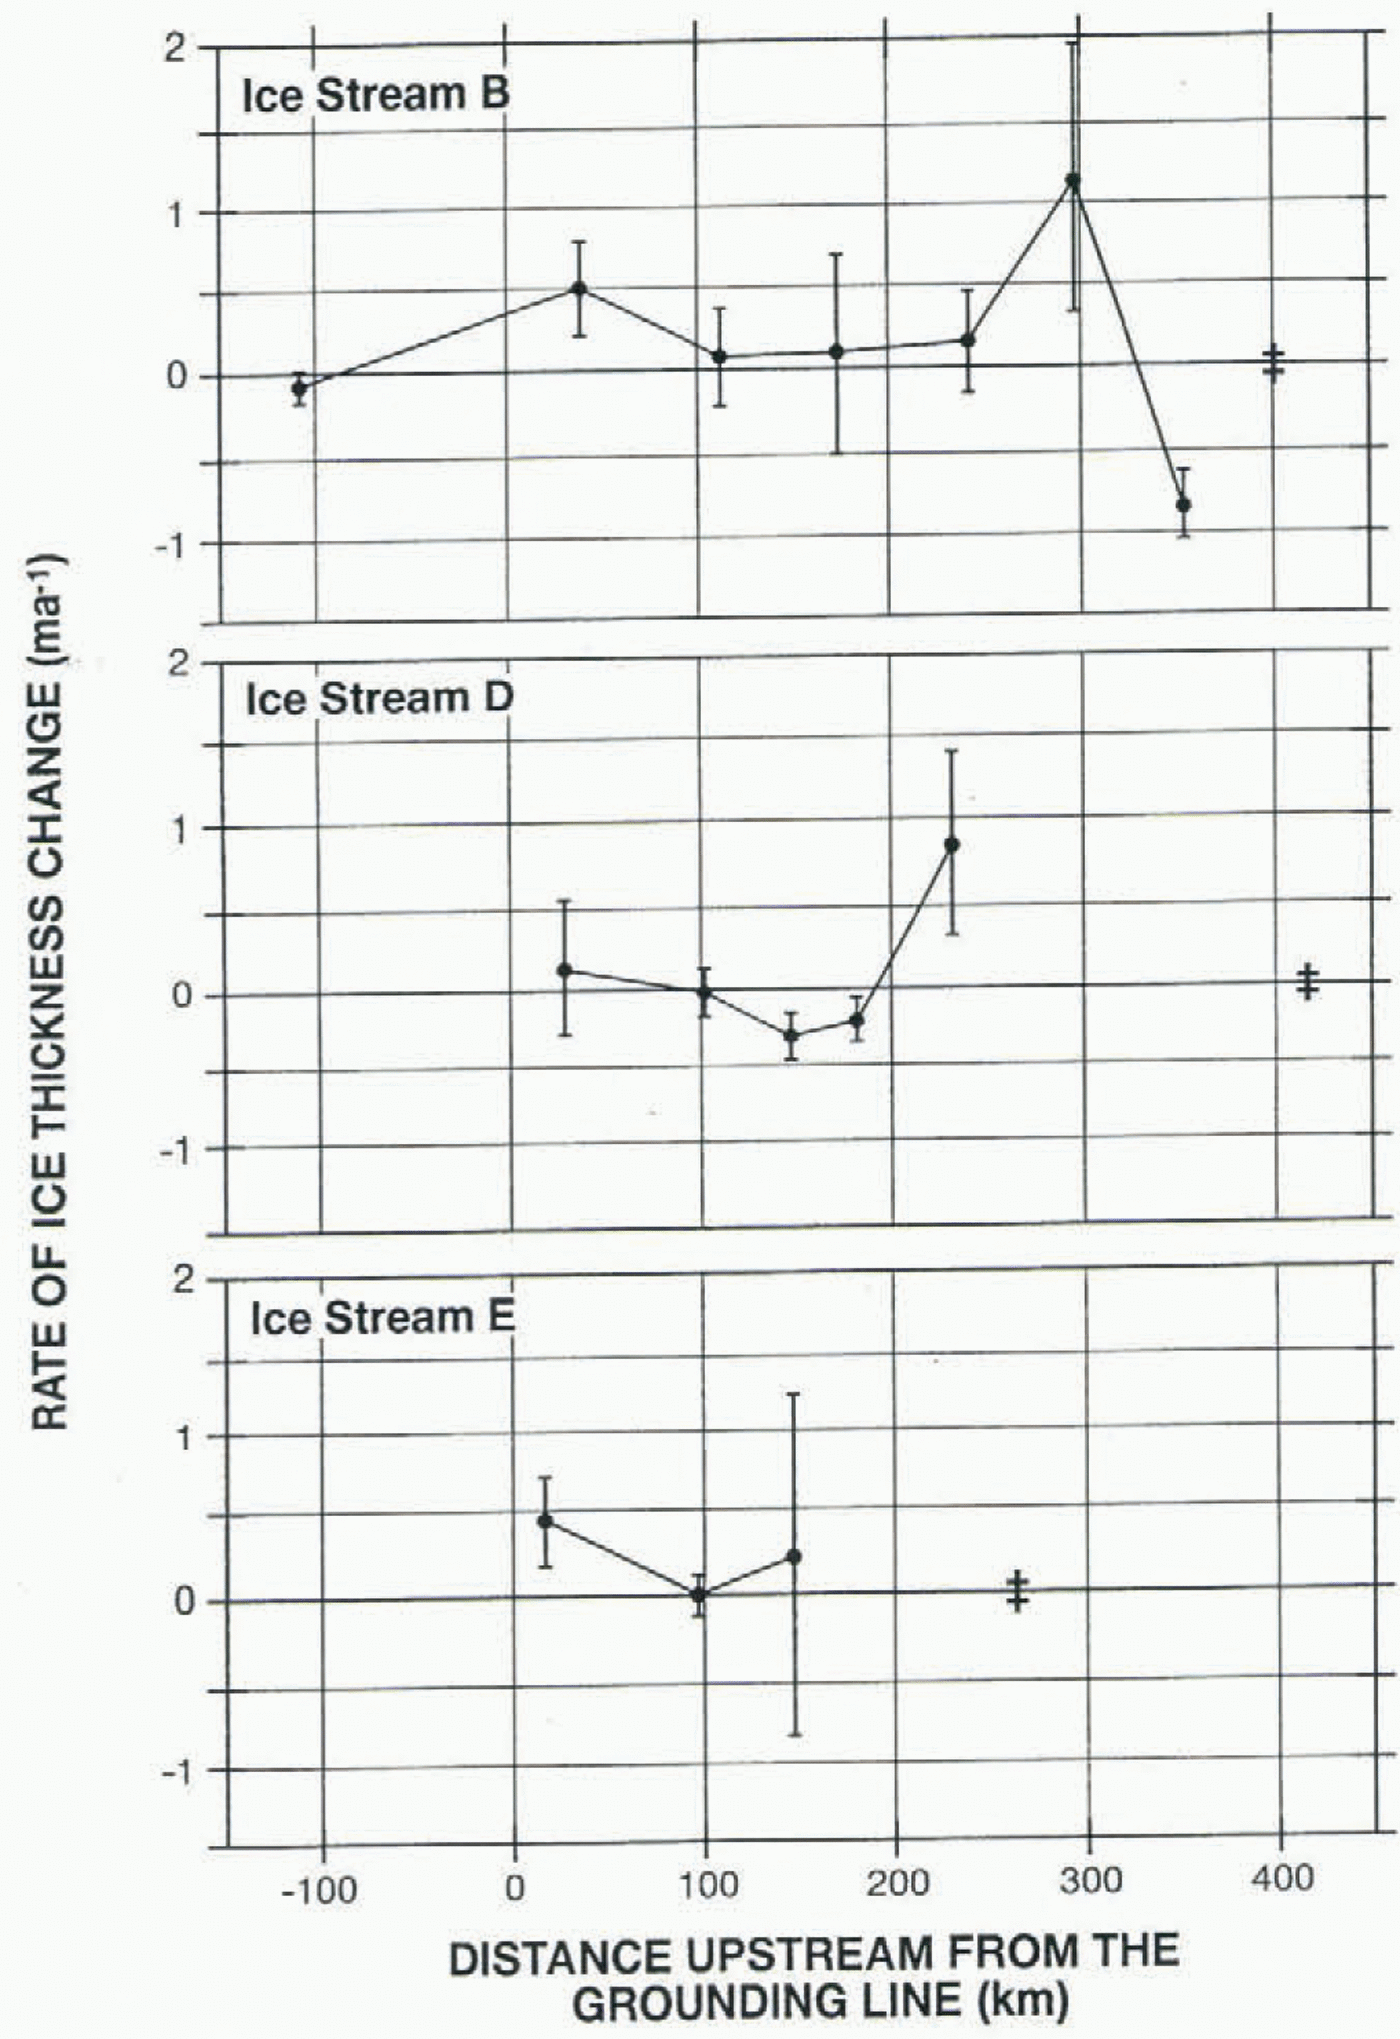
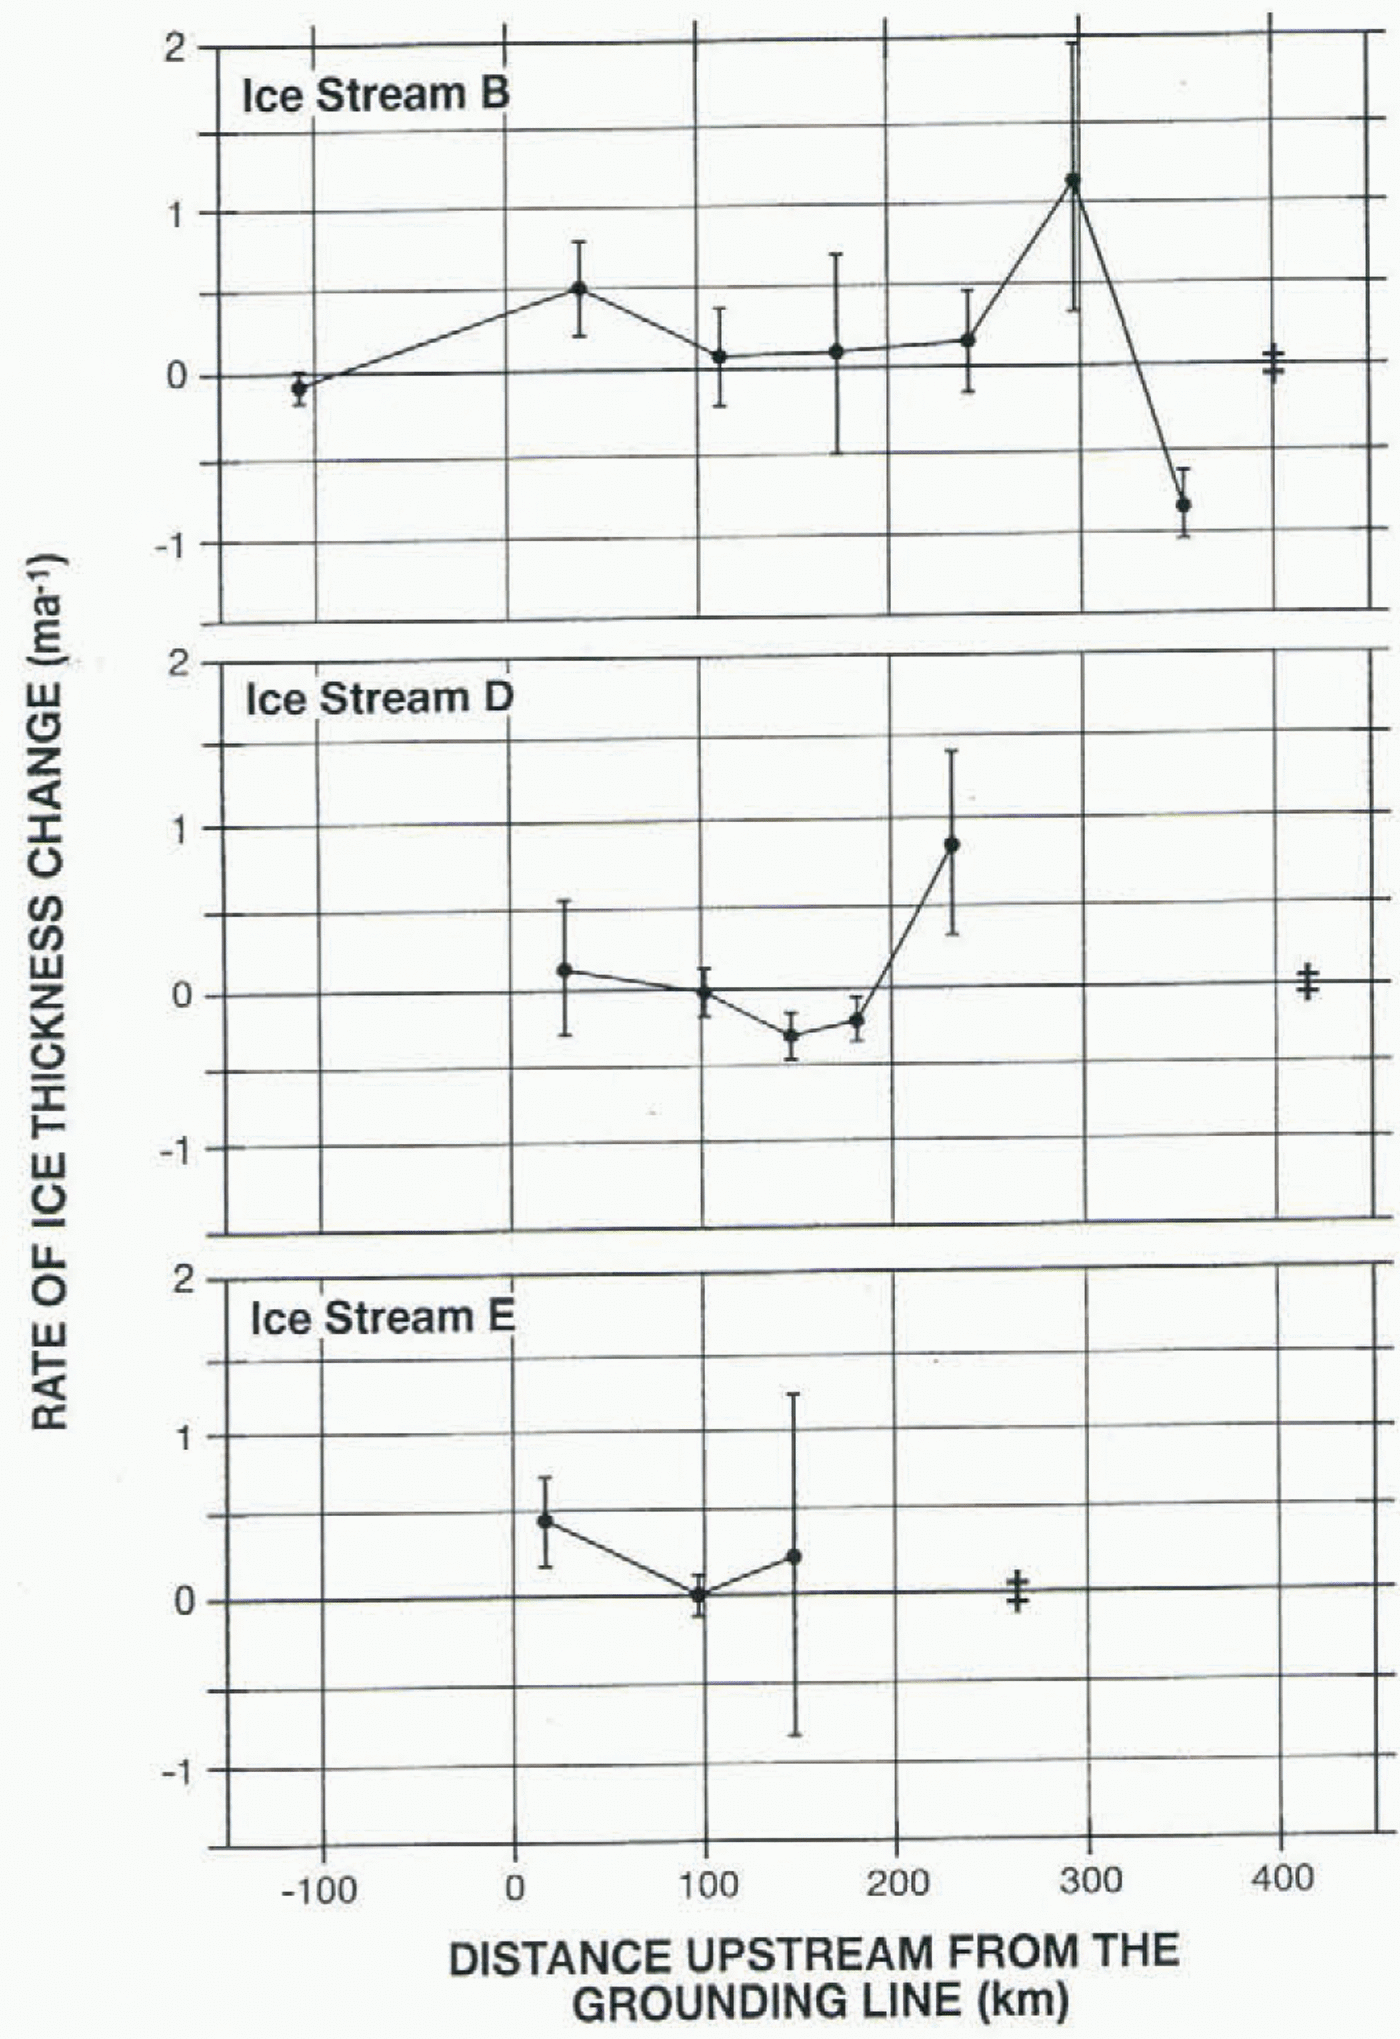
Figure 2 shows the longitudinal profiles of the rate of ice-thickness change for these three ice streams. The points represent the average rate of thickness change for a box defined by transects (or gates) across each ice stream where the along-stream flux was calculated from field and satellite measurements. The value at 38 km on Ice Stream B has been corrected from the value published by Shabtaie and others (1988) by a velocity adjustment as discussed by Bindschadler (1993). This adjustment removed the effect of older, faster velocities being used at one gate near Ice Stream B’s grounding line. Included in the figure is the position of the most upstream crevasse, which indicates the approximate beginning of each ice stream.
A consistent pattern is present in all three profiles, with thickening upstream and downstream of a central region of substantially diminished thickening or, in the case of Ice Stream D, thinning. Although the uncertainty of any single mass balance is often large, as indicated by the error bars, this overall pattern is identifiable in each ice stream. The vertical and horizontal scalings of each ice stream in Figure 2 are identical, despite their different geometries. Figure 1 shows that Ice Stream E is shorter and wider with more intense convergence than either Ice Stream B or D. Ice Stream B is formed by the convergence of two rather equally dimensioned tributaries, while Ice Stream D’s origin is based more on a single tributary that is consistently added to from the side for a distance of over 100 km. Given this considerable range of geometries, it is remarkable that the overall pattern of thickness change is so consistent. Extension of this consistency to the upstream areas of Ice Streams D and E suggests they also maybe thinning between the most upstream crevasses and the most upstream mass-balance measurement.
Some of the differences between profiles are due to the different limits of coverage and length differences. Proportional scaling to a common distance between the first crevasse (double cross in Figure 2) and the grounding line would increase the similarity. There is thinning in the central part of Ice Stream D that is not seen on either Ice Stream B or E. It is difficult to infer the cause of this difference. It may be the result of significant tributary flow into the central part of Ice Stream D known to occur on D but not on either B or E (see Bindschadler and others, in press) or of secondary effects that may have changed the local flow rates (such as basal lubrication or subglacial water flow).
Longitudinal profiles of the calculated rates of ice-thickness change on Ice Streams B, D and E. Vertical error barsrepresent 1 σ uncertainties. Double crosses show position of most upstream crevasse indicating location of the ice-stream headand onset of stream flow. (Data source as indicated in text.)
Similarity to Glacier Surge Behavior
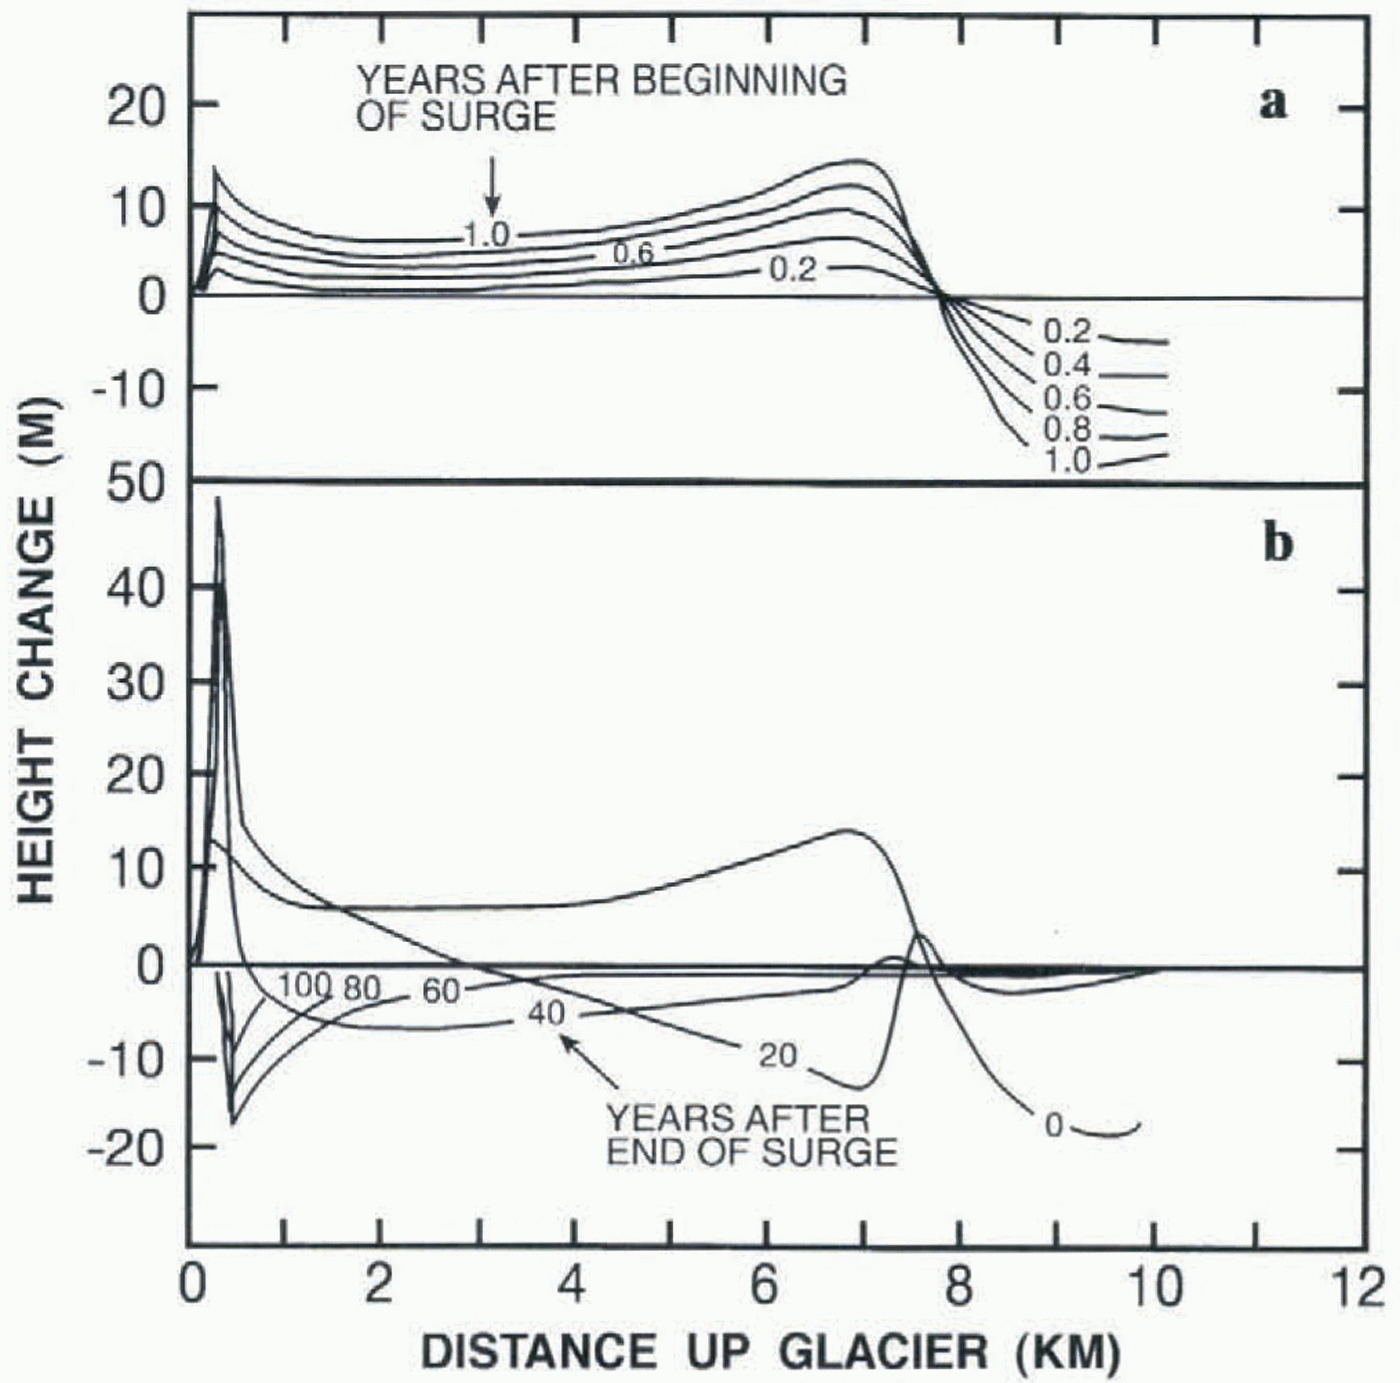
The similarity between Ice Stream B’s profile of thickness change and that predicted for a surging glacier has been noted by Shabtaie and ohters (1988). This similarity is even more striking once the velocity adjustment mentioned above is applied. Figure 3 reproduces figures from Rasmussen and Campbell (1973) that show how the thickness of a modeled valley glacier changes during an imposed l year surge and for several 20 year intervals after the surge was terminated. Using a non-linear expression for the flow law, the surge was forced by increasing the coefficient that determines volume fluxes by a factor of 20 for 1 year before restoring it to the pre-surge value. A distinctive longitudinal signature of ice-thickness change builds up progressively during the surge, characterized by a thinning upstream, intense thickening in the adjacent downstream region, diminishing thickening farther downstream, returning to larger thickening rates in the terminal area. The pattern is distinctly different during the recovery as the thinned area upstream rapidly spreads downstream and thickening occurs in an ever-diminishing terminal region. The post-surge response represents the down-glacier traverse of a diffusing kinematic wave (kinematic waves and diffusion will be discussed in the next section).
Longitudinal profiles of thickness change calculated by numerical simulation of a surging glacier. (a) Height change from steady-state during the 1 year surge. (b) Height change at 20 year intervals after the surge. Figure adapted from Rasmussen and Campbell (1973).

The observations of the complete profile of Ice Stream B, supported by the shorter profiles of Ice Streams D and E, are consistent with the surging profiles, rather than with any of the recovery profiles. All three ice-stream profiles include the decrease in thickening rate followed by an increase as the grounding line is approached. This longitudinal pattern is particularly important because it is present in each profile and it is a major feature that distinguishes active surging not only from all the recovery profiles, but also from other modeled glacier responses to climatic perturbations, such as changes in accumulation rate (see Campbell and Rasmussen, 1970). The dynamic cause of this increase in thickening near the terminus is longitudinal compression downstream of the equilibrium line. While ice streams exist entirely in the accumulation zone and, thus, do not have an equilibrium line, all three of these ice streams do exhibit longitudinal compression just above the grounding line (Bindschadler and others, 1993, in press).
Not only is the shape of the ice-stream profiles consistent with the surge-model results, but a rough quantitative scaling of the model results lends additional support to the similarity argument. The surge glacier is only 2 km wide and 10 km long compared with a width of 40 km and length of 400 km for Ice Stream B. Thus, the rate of thickness change calculated for the model should be reduced by a factor of 20–40. This would reduce the maximum rate of thickening (14 m a–1) for the glacier to an expected value of 0.35–0.7 m a–1 for Ice Stream B, close to the measured maximum of 1.1 m a–1.
This comparison strongly suggests that these three ice streams are in a state of active surging. Because these are the only three ice streams for which this level of detailed mass balance has been completed, and all show the same pattern, it can be hypothesized that active surging behavior is characteristic of ice streams.
Consequences of Surge Behavior
There is extensive literature on the phenomenon of surging (see the review by Clarke, 1987). Usually it is associated with temperate or polythermal glaciers, but, on occasion, it has been attributed to Antarctica, particularly the ice streams of West Antarctica (Hughes, 1975; Lingle, 1987). These attributions have been based on the relationship between fast ice flow and low driving stresses. Here the association is made on the basis of the longitudinal pattern of ice-thickness change.
Surging implies a strong negative local mass balance at the head of the stream where slow ice accelerates into the faster stream. Whillans and others (1987) noted the complexities of flow in the upstream areas of Ice Stream B. They suggested that the irregular position of the ice-stream head might be due to the spatial pattern of basal stress concentrations and that, with time, the thinning at the head might cause the point of ice-stream initiation to jump from one concentration to another farther inland, causing ice-stream “rafts” in the process.
This general concept of headward migration is expanded here by calculating an average migration rate. Assuming that the regional surface slope of 1.7 x 10⁻³ near the head of Ice Stream B is to be maintained, the calculated rate of thinning at Ice Stream B’s onset (–0.83 m a–1, from Shabtaie and others (1988)) implies an average inland migration rate of 488 m a–1.
Migration of the ice-stream head suggests that the ice stream itself is probably a mobile phenomenon. Troughs associated with the current ice streams feeding the Ross Embayment are seen extending all the way to the edge of the continental margin (Hughes, 1977), yet it is unlikely that the heads of these streams were positioned at the current locations when their grounding lines rested at the continental-shelf edge. Such a situation would stretch Ice Stream B’s length by a factor of six, with a corresponding decrease in the driving stresses. Noting that all West Antarctic ice streams have lengths of roughly 250–450 km, it is likely that entire ice streams migrate in rough synchronicity with the migrating head.
Marine sedimentological data indicate that Ice Stream B was grounded in the vicinity of Coulman Island 15 000 years ago (personal communication from E. W. Domack, 1995), implying a slower average migration rate of roughly 100 m a–1. A similar retreat rate results from measurements of calving-line retreat in the western Ross Sea range (personal communication from E. W. Domack, 1995). The inferred migration rate at the head of Ice Stream B is only slightly higher. A number of interpretations are possible: the surface slope at Ice Stream B’s onset could be steepening (resulting in a lower migration rate); movements of the head and grounding line are independent (although it is suggested above that they are not); or a period of rapid inland migration is under way.
Ice Stream B’s grounding line lies 600 km from the ice divide. At the more rapid migration rate, the grounding line would reach the divide in 1200 years, resulting in the complete disappearance of the ice sheet. At the slower rate of 100 m a–1, 6000 years would be required. In terms of sea level, a net loss of grounded ice equal to twice the current volume of West Antarctica since the Last Glacial Maximum has been estimated (Denton and Hughes, 1981). Spread over 15 000 years, this converts to an average rate of 0.7 mm a–1 in global sea-level rise. Using the above range of 1200–6000 years for the discharge of the remaining West Antarctic ice sheet results in a predicted sea-level contribution of 0,8–4.1 mm a–1.
Based on the above analysis, the length of the surging phase is less, possibly substantially less, than 21 000 years. By contrast, regeneration of the roughly 2000 m thick ice sheet, at an average accumulation rate of 0.1 m a–1, would take a few times longer than the 20 000 years required to accumulate that much ice, because developing flow would gradually reduce the rate of growth. A reasonable range is 50 000–100 000 years. This is many times the projected surging phase, suggesting that the original definition of surging which dictates that the surge period is much shorter than the quiescent phase may be applicable (Meier and Post, 1969).
This surge view of the West Antarctic ice sheet must be reconciled with the existence of Ice Stream C, which has ceased surging before reaching the ice divide. Alley and others (1994) have associated the stagnation of Ice Stream C with the headward growth of Ice Streams B and C, combined with the particular basal topography. It is not necessary that every ice stream surge forever—only that enough ice streams continue to surge so that effective drainage of the interior ice sheet is maintained. Finally, it is known that the combined discharge of Ice Streams B and C is roughly that needed to balance the accumulation of their combined catchment basins. Thus, there may well be no inconsistency.
Classical View of Response Behavior Applied to Ice Streams
While the absence of critical data leaves the question of ice-stream surging necessarily equivocal, the classical perturbation analysis formulated by Nye (1963) provides additional insight into the expected character of the dynamic response of icc streams.
Nye began by partitioning the perturbations in the volume flux, Q 1, into the components due to perturbations in surface slope, α 1, and ice thickness, H 1.

where

and

Subscripts refer to the perturbations in the respective quantities. By substituting Equations (1)–(3) into the depth-averaged continuity equation,

where t is time, W is width (assumed constant), x is longitudinal position, and A is accumulation rate, Nye arrived at the following equation:

The three terms on the righthand side of Equation (5) represent, in order, the exponential decay of a change in ice thickness with time, a kinematic wave of thickness H 1 moving down-glacier, and diffusion of a perturbation in ice thickness. Each term is analyzed below.
For West Antarctic ice streams, sliding dominates the ice velocity, so the flux is

We adopt a standard flow-law sliding relationship such as that suggested by Budd (1969):

where U is the ice speed, τ 1 is the base stress, and K is a coefficient that accounts for temperature and the lubrication effect of pressurized subglacial water. For the following analysis, K is assumed constant. Thus, the dynamic response is not affected by changes in either temperature or water pressure. Ignoring the temperature dependence is acceptable since the time-scale of temperature changes is long. However, water pressure is known to change rapidly and affect the dynamics of Ice Stream B (personal communication from B. Kamb, 1994). This effect is not included here for the pragmatic reason that the functional relationship between K and water pressure is not known for ice streams.
On ice streams, resistance to the driving stress is shared between shear resistance at the lateral margins and basal shear. Force balance for a section of ice stream requires that

where

t d is the driving stress (approximately 0.1 bar) and t s is the side shear (approximately 1 bar).
Equations (l)–(9) allow the evaluation of the three terms relevant to the response characteristics of icc streams.
Discussing first the exponential decay term of Equation (5), the perturbation in ire thickness decays with a time constant

For these ice streams, typical values are U = 400 m a–1, H = 1000m and ∂H/∂x = –2 X 10⁻³. Using m = 3 gives T = –62 years. The negative value, due to the sign of ∂H/∂x, implies that the response will be unstable: analogous to the response of the downstream portion of glaciers (where H decreases as the terminus is approached). Negative thickness gradients are characteristic of marine ice sheets and are expected throughout most of West Antarctica. Nye explained that this instability grows until the arrival of a kinematic wave restores stability which, as shown below, arrives quickly by diffusion.
The second term in Equation (5) describes a kinematic wave of amplitude H 1 moving wilh a velocity,

For glaciers, the (m + 2)U term usually dominates with ∂D0/∂x positive in the accumulation zone and negative in the ablation zone. For ice streams, α is low, so the second term (arising from ∂D0/∂x in Equation (5)) can be large. Also the sign of this second term can be cither positive or negative since ∂U/∂x is usually positive, but ∂H/∂x is generally negative. Thus, there are some cases where the kinematic wave velocity may be negative, indicating waves that travel upstream. Using ranges of typical values for the individual terms in Equation (11), kinematic wave velocities range from –0.6 to + 6.3 km a–1.
The third term of Equation (5) describes the diffusion of perturbations with a diffusion coefficient

Using typical ice-stream values, D0/W - 7 X 10⁸ m2 a–1, as compared with typical values of 106 m2 a–1 on glaciers. All terms in this expression combine to make diffusion much faster on ice streams than on glaciers: ice streams are faster, deeper and have lower slopes than typical glaciers. The effect is that perturbations will spread over an ice stream much faster than over glaciers. In practical terms, this means that it will be difficult to recognize kinematic waves on ice streams.
A quantitative example illustrates this point. A topographic perturbation of Gaussian shape with a half-width of 1 km on an ice stream will spread to a half-width to 100 km in less than 4 years. This rapid diffusion precludes the development of instability as implied by the exponential response discussed above for the first term of Equation (5).
An independent theoretical treatment of response dynamics that included longitudinal stress gradients indicated a wavelength dependence of the diffusion coefficient (Gudmundsson, 1995). In that analysis, shorter-scale perturbations took longer to decay on ice streams than on glaciers. Thus, the above analysis is most applicable for perturbations of a scale a few times the average ice thickness or longer.
Ice-Stream Models
The above results are based on a theoretical approach and include rough approximations. It is worth examining published results from more numerically complex ice-stream models to see if they are at least consistent with the above analysis.
Past perception of ice-stream behavior was linked to the concept of ice-shelf buttressing, and most ice-stream model applications studied scenarios involving a change in ice-shelf or grounding-line conditions rather than surging or climatic response. Thus, model runs that include the downstream propagation of kinematic waves could not be found in the literature. Nevertheless, examination of published results for a variety of models confirms that diffusion is rapid relative to the kinematic wave speed.
Alley and others (1987) showed that instantaneous thinning at the grounding line quickly affected the entire ice stream. Rapid diffusion is apparent (see their Fig. 3) but difficult to quantify. The maximum thickening traveled upstream at an average speed of 7 km a–1 (see their fig. 4, p. 8934). Based on the above analysis, a kinematic wave of constant thickness perturbation (not maximum thickening) is predicted to move upstream at 40 km a–1. The most likely reason for this poor agreement is that the model included till dynamics. Till, with a stiffer rheology than ice, would tend to slow the response time-scale.
Results of similar scenarios, but without an integrated till layer, for Ice Stream E were computed by Lingle and Brown (1984). Again, the scenarios investigated involve changes in the ice shelf. Evidence of rapid diffusion is again present but is impossible to quantify because of model startup effects. The maximum rate of thickness changes took 50–100 years to travel 100–150 km upstream. These speeds are somewhat slower than Alley and others produced but it appears that changes were rapidly transmitted upstream at reduced amplitudes.
Conclusions
The longitudinal pattern of mass balance on three West Antarctic ice streams appears to be consistent. The only longitudinal response profile from glacier-response studies that fits this profile is one of active surging. Surging is not an equilibrium situation and implies inland migration of the ice-stream head. On Ice Stream B, this migration rate is estimated to be 488 m a–1. If basal conditions permit the continuation of surging behavior without additional modification to the current dynamics, the expected lifetime of the West Antarctic ice sheet is 1200–6000 years, after which regeneration would require 50 000–100 000 years. This fits the classical definition of surging.
The application of classic glacier-response theory to ice streams illustrates that diffusion is much faster on ice streams than on glaciers. Rapid diffusion makes it unlikely that localized perturbations in ice-stream flow will be detectable as the ice streams quickly propagate such perturbations over the full length of the ice stream.
Acknowledgements
D. Bahr and H. Gudmundsson reviewed this paper and made many helpful suggestions. In addition, the author would like to thank R. Jacobel, D. Blankenship, T. Scambos and M. Fahnestock, who were involved in the initial drafts, for their comments. Finally, questions asked by I. Whillans, G. Bentley and J. Zwally when this subject was presented orally also improved this paper. This work was supported by grant OPP-9317627 from the U.S. National Science Foundation.