INTRODUCTION
Methane (CH4) is the second most important greenhouse gas from domestic ruminants with a major contribution to anthropogenic methane emissions (Boucher et al. Reference Boucher, Friedlingstein, Collins and Shine2009). Besides the contribution of methane to greenhouse gas emissions, methane synthesis in the rumen also represents a loss of dietary energy of c. 2–12%, depending on the composition and quality of the diet (Johnson & Johnson Reference Johnson and Johnson1995). Minimizing methane synthesis during rumen fermentation without altering animal production is, therefore, desirable both as a strategy to reduce global warming and as a means to improve feed conversion efficiency. Methane emissions from the rumen can be reduced by feeding extra fermentable starch (Ellis et al. Reference Ellis, Dijkstra, Kebreab, Bannink, Odongo, McBride and France2008) and adding oils (Alexander et al. Reference Alexander, Singh, Sahoo and Bhat2008; Castillejos et al. Reference Castillejos, Calsamiglia, Martín-Tereso and Ter Wijlen2008) or secondary plant compounds, such as condensed tannins (CT), to the diet (Carulla et al. Reference Carulla, Kreuzer, Machmüller and Hess2005; Waghorn Reference Waghorn2008). Condensed tannins have been considered an anti-nutritional factor in animal diets, but now it is acknowledged more and more that certain CT may also have beneficial effects (Mueller-Harvey Reference Mueller-Harvey2006). Negative or positive effects of CT on animal performance depend on the type and level of tannins in the plant (McNabb et al. Reference McNabb, Waghorn, Barry and Shelton1993; Wang et al. Reference Wang, Douglas, Waghorn, Barry, Foote and Purchas1996; Min et al. Reference Min, Barry, Attwood and McNabb2003), the amount ingested and animal species involved (Mueller-Harvey Reference Mueller-Harvey2006). Singh & Bhat (Reference Singh and Bhat2001) indicated that the negative effects associated with dietary CT are reduction of feed intake and lower digestibility when supplementing high concentrations of dietary CT (60–120 g/kg dry matter (DM)). Low concentrations of these tannins (20–40 g/kg DM), however, can have positive effects on protein degradation, animal performance, urinary nitrogen secretion; they can reduce the occurrence of rumen bloat in cattle and can increase milk production and milk protein content in dairy cows (Min et al. Reference Min, Barry, Attwood and McNabb2003; Ramírez-Restrepo & Barry Reference Ramírez-Restrepo and Barry2005). Condensed tannins negatively affect ciliate protozoa, fibre-degrading bacteria and methanogenic archaea depending on the structure and concentration of dietary CT (Min et al. Reference Min, Barry, Attwood and McNabb2003; Kumar et al. Reference Kumar, Choudhury, Carro, Griffith, Dagar, Puniya, Calabro, Ravella, Dhewa, Upadhyay, Sirohi, Kundu, Wanapat and Puniya2014). As a result, CT can reduce CH4 production (Ramírez-Restrepo & Barry Reference Ramírez-Restrepo and Barry2005; Bhatta et al. Reference Bhatta, Uyeno, Tajima, Takenaka, Yabumoto, Nonaka, Enishi and Kurihara2009, Reference Bhatta, Saravanan, Baruah, Sampath and Prasad2013; Grainger et al. Reference Grainger, Clarke, Auldist, Beauchemin, McGinn, Waghorn and Eckard2009). By increasing CT concentration in ruminant diets, it was found that methane production and size of archaeal and protozoal populations decreased (Bhatta et al. Reference Bhatta, Uyeno, Tajima, Takenaka, Yabumoto, Nonaka, Enishi and Kurihara2009; Hariadi & Santoso Reference Hariadi and Santoso2010). Few studies, however, are available about which structural CT features are most responsible for reducing ruminal CH4 production. The three main CT features are; (i) the mean degree of polymerization (mDP), (ii) the ratio between prodelphinidins : procyanidins (PD : PC) (proportion of PD) and (iii) the ratio between cis : trans flavan-3-ols (proportion of cis) within CT (Gea et al. Reference Gea, Stringano, Brown and Mueller-Harvey2011).
The objective of the current study was to examine the relationship between tannin structures and CH4 production and fermentation characteristics during in vitro incubation by using eight different tannin extracts with a wide range of mDP, proportion of PD and cis within CT.
MATERIALS AND METHODS
Plant samples for extracting condensed tannins
Blackcurrant (Ribes nigrum) and redcurrant (Ribes rubrum) leaves were collected at Hildred pick your own (PYO)-farm, Goring-on-Thames, UK; goat willow (Salix caprea) leaves and twigs were collected from Goring-on-Thames, UK; weeping willow (Salix babylonica) catkins were collected on Evesham Rd., Emmer Green, Reading, UK; white clover (Trifolium repens) flowers were collected from the National Institute of Agricultural Botany (NIAB, Cambridge, UK); whole sainfoin (Onobrychis viciifolia, var. Esparsette) plants were collected from Barham, Kent, UK; pine bark was provided by University of Turku, Finland. After collection, the plant materials were freeze-dried and then ground to pass a 1-mm sieve using an impeller mill (Retsch GmbH, SM1, Haan, Germany).
Extraction of condensed tannins
The CT extracts were prepared according to a slightly modified method of Gea et al. (Reference Gea, Stringano, Brown and Mueller-Harvey2011). Finely ground plant powder (50 g) was extracted with acetone/water (500 ml; 7 : 3; v/v) under constant stirring for 60 min. The mixture was transferred into a Buchner funnel, fitted with a Whatman filter paper and filtered under vacuum. The filtrate was extracted with dichloromethane (CH2Cl2) to remove lipids and chlorophyll and concentrated in a rotary evaporator at <37 °C. The remaining aqueous solution was centrifuged for 6 min at 4500 rpm (Thermo Electron Corporation, Jouan CR3i Multifunction Centrifuge, Basingstoke, UK) in order to remove residual chlorophyll and any other insoluble material. Extracts were frozen, freeze-dried and stored at −20 °C.
Analysis of condensed tannin extracts
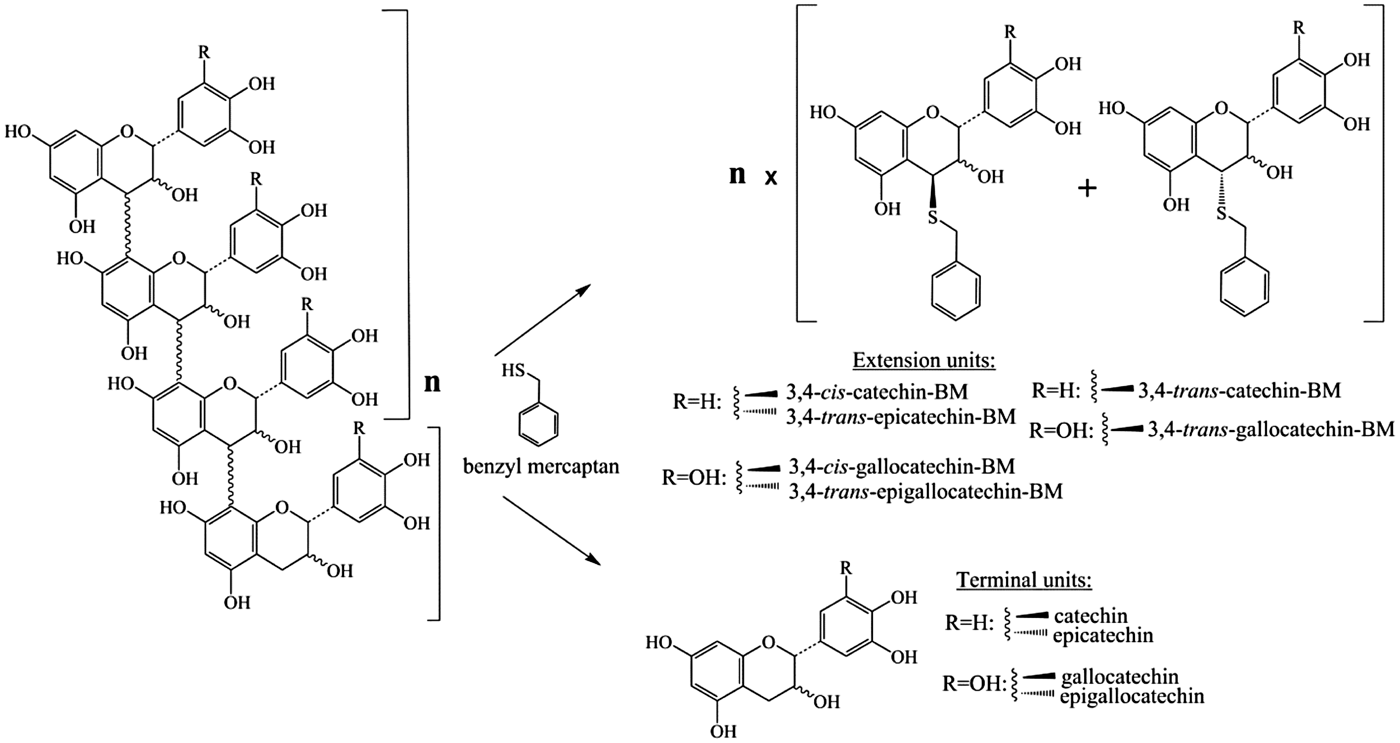
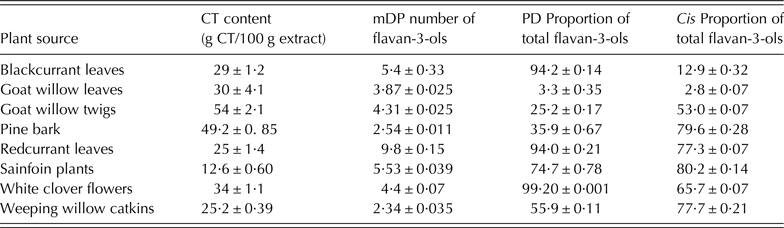
Extracts were analysed for CT content and structural properties by thiolytic degradation, followed by high performance liquid chromatography (HPLC) analysis (Novobilský et al. Reference Novobilský, Mueller-Harvey and Thamsborg2011; Williams et al. Reference Williams, Fryganas, Ramsay, Mueller-Harvey and Thamsborg2014). This provided information on the proportion of flavan-3-ols (catechin, epicatechin, gallocatechin and epigallocatechin) in the CT terminal and extension units (Fig. 1). In addition, it allowed calculation of the mean degree of polymerization (mDP), prodelphinidins : procyanidins (PD : PC) and cis : trans flavan-3-ol ratio in the CT polymers based on the following formulae (1, 2, 3) (Gea et al. Reference Gea, Stringano, Brown and Mueller-Harvey2011) (Table 1):
 $${\rm mDP} = \displaystyle{\matrix{\hbox{sum of extension and terminal} \hfill \cr \quad \hbox{flavan-3-ol units} ({\rm mol}) \hfill} \over {\hbox{sum of terminal flavan-3-ol units} ({\rm mol})}}$$
 $${\rm PD} = \displaystyle{{{\rm Proportion\; of\; GC} + {\rm EGC\; units}} \over {{\rm Proportion\; of\; C} + {\rm EC} + {\rm GC} + {\rm EGC\; units}}}$$
 $$cis = \displaystyle{{{\rm Proportion\; of\; EC} + {\rm EGC\; units}} \over {{\rm Proportion\; of\; C\;} + {\rm GC} + {\rm EC} + {\rm EGC\; units}}}$$
where C = catechin, EC = epicatechin, GC = gallocatechin and EGC = epigallocatechin flavan-3-ols, proportion of PD + PC = 100; proportion of cis + trans = 100.
Thiolytic degradation of condensed tannin polymers. Extension subunits are released as flavan-3-ol benzyl mercaptan (BM) adducts, terminal subunits are released as the free flavan-3-ols (Gea et al. Reference Gea, Stringano, Brown and Mueller-Harvey2011).

Condensed tannin (CT) content, mean degree of polymerization (mDP), proportion of prodelphinidins and cis in extracts obtained from eight plant sources

Values are means ± standard deviation.
Experimental design
The effects of CT structural features on CH4 production and fermentation kinetics during in vitro incubation were evaluated using tannin-free grass silage as a control substrate. The chemical composition of grass silage was: DM = 937·0 g/kg; organic matter (OM) = 911·3 g/kg DM; crude protein (CP) = 151·4 g/kg DM, neutral detergent fibre (NDF) = 498·5 g/kg DM. Condensed tannin were added to the substrate at an effective concentration of 40 g CT/kg of substrate in the presence (+PEG) or absence (−PEG) of polyethylene glycol (PEG 6000) to inactivate the tannins (Makkar et al. Reference Makkar, Blümmel and Becker1995). Condensed tannins (10 mg) and substrate (250 mg) with or without PEG (100 mg; CT : PEG = 1 : 10 w/w) (Pellikaan et al. Reference Pellikaan, Stringano, Leenaars, Bongers, Van Laar-Van Schuppen, Plant and Mueller-Harvey2011b ) were weighed into duplicate 250 ml bottles (Schott bottle, GL45, Mainz, Germany) per tannin extract within each run, with two separate runs. Test substrate was incubated with a mixture of rumen liquid collected from three different rumen fistulated lactating Holstein-Friesian dairy cows per run (i.e. total of six rumen fistulated cows). These cows were fed a grass and maize silage mixture in the morning and afternoon and 9 kg of concentrate according to their requirements. The handling of the animals was approved by the Institutional Animal Care and Use Committee of Wageningen University, Wageningen, the Netherlands and in accordance with Dutch legislation on the use of experimental animals. Rumen fluid was collected before the morning feeding in pre-warmed thermos flasks, which were filled with carbon dioxide (CO2) and transported directly to the nearby laboratory. All further manipulations were done under CO2 to ensure anaerobic conditions. The rumen fluid was pooled and filtered through two layers of cheesecloth into a flask flushed with CO2. Filtered rumen fluid was mixed with a buffer solution with constant stirring and continuous flushing with CO2 and maintained in a water bath at 39 °C. Buffer solution was made as described by Williams et al. (Reference Williams, Bosch, Boer, Verstegen and Tamminga2005). After adding 30 ml of the buffered rumen liquid mixture, bottles were directly placed in a shaking water bath at 39 °C and connected to an automated time-related gas production (GP) system (Pellikaan et al. Reference Pellikaan, Hendriks, Uwimana, Bongers, Becker and Cone2011a ) and GP was measured over 72 h. Gas production in blanks (i.e. buffered rumen fluid mixture without substrate and CT extracts) was 2·7 ± 0·21 ml for run1 and 9·9 ± 0·35 ml for run 2. Condensed tannin extracts consisted of 46·2–87·4 (g/100 g extracts) of non-CT compounds, which may contribute to fermentation. Therefore, blanks were also included containing CT extracts only, with and without PEG. The average GP in CT extracts with and without PEG in run 1 was 10·4 and 4·8 ml, and in run 2 were 16·7 and 4·8 ml, respectively. After 72 h incubation, the fermentation fluid pH was recorded (Mettler Toledo FE20/EL20 pH meter, Schwerzenbach, Switzerland) and fermentation fluid from each bottle was collected for volatile fatty acid (VFA) and ammonia (NH3) analysis.
In vitro gas and methane production
Total cumulative gas (GP) and methane (GPCH4) production were measured using an automated GP system at the laboratory of the Animal Nutrition Group of Wageningen University, the Netherlands (Pellikaan et al. Reference Pellikaan, Hendriks, Uwimana, Bongers, Becker and Cone2011a ). Methane concentration in the headspace of the fermentation bottle was measured by gas chromatography (GC8000Top, CE Instruments, Milan, Italy). Fermentation bottles were modified (Pellikaan et al. Reference Pellikaan, Hendriks, Uwimana, Bongers, Becker and Cone2011a ) to sample CH4 from the headspace. In brief, bottles were fitted with a glass extension that was sealed with a screw cap and an air-tight septum (Grace, XLB-13 Septa 1/2). Ten μl aliquots of the bottle headspace gas were sampled through the septa at distinct time points of incubation (0, 2, 4, 6, 8, 10, 12, 24, 30, 36, 48, 56 and 72 h) using a gas-tight syringe (Gastight® # 1701 Hamilton 1701N, 10 µl Syringe, Point style 5, Bonaduz, Switzerland). They were injected directly into the GC, which was equipped with a stainless steel column (6 m long, 0·53 mm internal diameter, 25 µm film thickness and packed with PoraPack Q50-80 mesh, Grace, Breda, the Netherlands) and connected to a flame ionization detector. The temperature of the injector, column and detector were maintained at 150, 60 and 150 °C, respectively. The carrier gas was nitrogen, and the pressure for nitrogen, hydrogen and air was set at 100, 50 and 100 kPa, respectively. The CH4 concentration was calculated by external calibration using a certified gas mixture with a known CH4 concentration in synthetic air (Linde Gas Benelux, Schiedam, and the Netherlands). Peak areas were determined by automatic integration system software (Chrom-Card data system Version 2.3·3, September, 2005, Rodano Milan, Italy) for GC.
Cumulative CH4 production was calculated according to the procedure described by Pellikaan et al. (Reference Pellikaan, Stringano, Leenaars, Bongers, Van Laar-Van Schuppen, Plant and Mueller-Harvey2011b ) by taking the sum of the increase in headspace CH4 concentration between two successive valve openings and the amount of CH4 vented from the bottle:
 $$CH_4 = \; \mathop \sum \limits_{i = 1}^{i = 1 + n} \left\{ {V_{HS}\left( {C_{i + 1} - C_i} \right) + \; G_{i + 1}C_{i + 1}} \right\}$$
where CH 4 = cumulative CH4 production (ml/g of incubated OM); V HS = the bottle headspace volume (ml); C i , C i+ 1 = CH4 concentration in the bottle headspace gas at valve opening i and i + 1, respectively; G i+1 = the amount of gas vented at valve opening i + 1 (ml).
Curve fitting and calculations
Total cumulative gas (GP) and CH4 production curves were fitted with biphasic and monophasic Michaelis-Menten equations, respectively (Groot et al. Reference Groot, Cone, Williams, Debersaques and Lantinga1996) using the non-linear least squares regression procedure in SAS (2002):
 $$OMCV = \mathop \sum \limits_{i = 1\; or\; 2}^n \; \displaystyle{{A_i} \over {1 + {(C_i/t)}^{B_i}}}$$
where OMCV = GP or CH4 production (ml/g of incubated OM), A = the asymptotic gas production (ml/g of incubated OM), B = the switching characteristics of the curve, C = time at which half of the asymptotic gas production is reached (half-time, T½, h) and t = the time (h). The value of i indicates the number of phases (i = 1 or 2). The maximum rate of gas production (R max, ml/h) was calculated using the estimated A, B and C-values as described by Bauer et al. (Reference Bauer, Williams, Voigt, Mosenthin and Verstegen2001).
 $$R_{{\rm max}} = \displaystyle{{A \times C^B \times B \times \left[ {TR_{{\rm max}}^{( - B - 1)}} \right]} \over {{\left[ {1 + C^B \times TR_{{\rm max}}^{( - B)}} \right]}^2}}$$
where TR max is the time at which R max occurs;
 $$TR_{{\rm max}} = C \times \left\{ {{\left[ {\displaystyle{{B - 1} \over {B + 1}}} \right]}^{\left\{ {1/B} \right\}}} \right\}$$
The maximum rate of substrate degradation (R M, %/h) was calculated from the A, B and C-values as estimated from the CH4 production curves (Groot et al. Reference Groot, Cone, Williams, Debersaques and Lantinga1996).
 $$R_M = \left( {B \times tR_M^{(B - 1)}} \right)/\left( {C^B + tR_M^B} \right)$$
where tR M is the time at which R M occurs;
 $$tR_M = C \times (B - 1)^{1/B}$$
Chemical analysis
Grass silage was air dried, ground through a 1-mm sieve using a cross beater mill (Peppink 100 AN, Deventer, The Netherlands) and analysed for DM (ISO 6496, 1999), ash (ISO 5984, 2002) and nitrogen (N) (ISO 5983, 2005). Crude protein content was calculated as: CP = 6·25 × N. Neutral detergent fibre was analysed according to Van Soest et al. (Reference Van Soest, Robertson and Lewis1991) after a pre-treatment with a heat stable amylase and corrected for residual ash.
Fermentation fluid, sampled for VFA analysis (750 µl), was acidified with 750 µl of ortho-phosphoric acid solution. The ortho-phosphoric acid solution was composed of 25 ml of 85% (v/v) ortho-phosphoric acid dissolved in 200 ml Millipore water and 300 ml of a 4 g/l 2-methylvaleric acid solution. Volatile fatty acid concentration was analysed by GC following procedures of Pellikaan et al. (Reference Pellikaan, Stringano, Leenaars, Bongers, Van Laar-Van Schuppen, Plant and Mueller-Harvey2011b ) with the carrier gas modified by using hydrogen instead of helium to enhance baseline separation. Isocaproic acid was included as the internal standard. The total VFA (tVFA) concentration in the fermentation fluid was expressed as mm/g of incubated OM. Fermentation fluid samples for NH3 analysis (750 µl) were mixed with 750 µl of 10% trichloroacetic acid solution. Ammonia was determined using a colorimetric method (Pellikaan et al. Reference Pellikaan, Stringano, Leenaars, Bongers, Van Laar-Van Schuppen, Plant and Mueller-Harvey2011b ) after deproteinizing the supernatant with 100 g/l trichloroacetic acid and the resulting chromophore was measured at 623 nm using an ultra-violet spectrophotometer (Evolution 201-Themo Scientific).
Statistical analysis
Effects of the CT structural properties on the substrate (grass silage) in combination with (+PEG) or without (−PEG) on fermentation kinetics and fermentation end-products were tested by analysis of variance using the MIXED procedure of SAS (2002) as:
 $$Y_{ijk} = \mu + T_i + P_j + R_k + (T \times P)_{ij} + \varepsilon _{ijk}$$
where Y ijk = the dependent variable, μ = the overall mean, T i = the tannin extract type (i = 1 to 9), P j = the effect of PEG (j = 1 to 2), R k = run (k = 1 to 2), (T × P) ij = the effect of tannin extract type and PEG interaction and ε ijk = the residual error term. The statistical unit was the average of replicate in vitro bottles within run. Differences among treatment means were analysed using Tukey-Kramer's multiple comparison procedure in the LSMEANS statement in SAS with effects considered significant at a probability value of P < 0·05, and trends at a probability value of P < 0·10.
Relationships between CT content, mDP, proportion of PD and proportion of cis and fermentation parameter estimates were analysed using the multiple stepwise regression procedure in SAS (2002) where CT content (g CT/100 g extract), mDP, proportion of PD and proportion of cis were included as independent variables. The criteria to include variables in the model were a combination of a low value for the Mallow's Cp-criterion, a high coefficient of determination (R 2), and setting the residual degrees of freedom (d.f.) in the regression model at >65% of the total d.f.
RESULTS
Effect of condensed tannin source on total gas and methane production
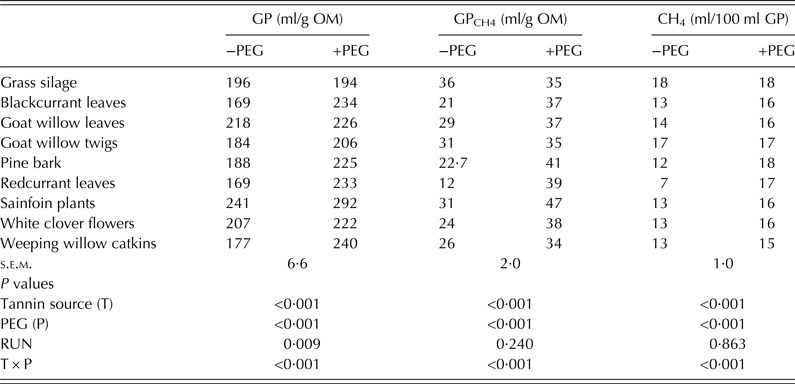
Table 2 shows that tannin source and PEG addition affected GP, GPCH4 and CH4 concentration. In general, CT addition gave an increase in GP and reduced GPCH4 except for sainfoin, and reduced CH4 concentration (all P < 0·001). Addition of PEG resulted in a general increase (P < 0·001) in GP, GPCH4 and CH4 concentration. There was an effect of interaction between tannin source and PEG (P < 0·001) on GP, GPCH4 and CH4 concentration. Addition of CT without PEG did not affect total GP compared with grass silage (control), except for sainfoin CT, which increased GP (P < 0·001). However, CT without PEG reduced both GPCH4 and methane concentration (both P < 0·001). Redcurrant CT gave the lowest GPCH4 (P < 0·001) and CH4 concentration (P < 0·001) compared with other CT extracts. In general, PEG addition increased GP (P < 0·001) by 18%, GPCH4 (P < 0·001) by 47% and CH4 concentration by 25% (P < 0·001) compared with the no PEG treatments.
Total gas (GP) and CH4 (GPCH4 ) production, and the calculated CH4 concentration from fermentations that contained different tannin types in the presence or absence of polyethylene glycol (+PEG or −PEG)

GP, GPCH4 = volume of total gas and methane produced per gram organic matter (OM) initial substrate weight at time t = 72 h; CH4 = methane concentration in total gas produced; +PEG, −PEG = with/without PEG addition; s.e.m = standard error of the mean.
Effects of condensed tannin source on fermentation parameters and kinetics
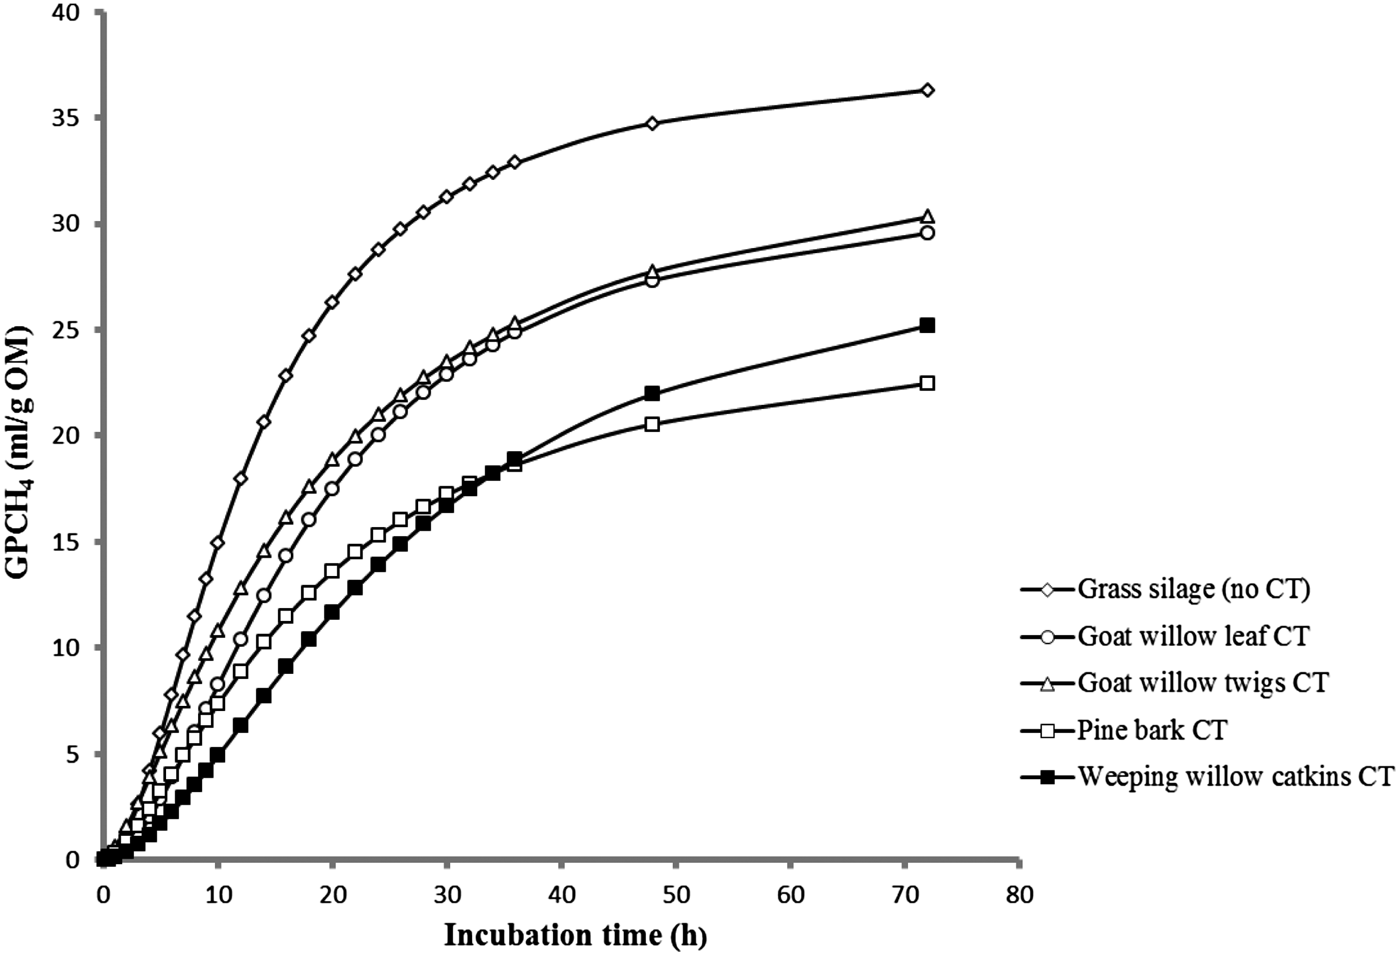
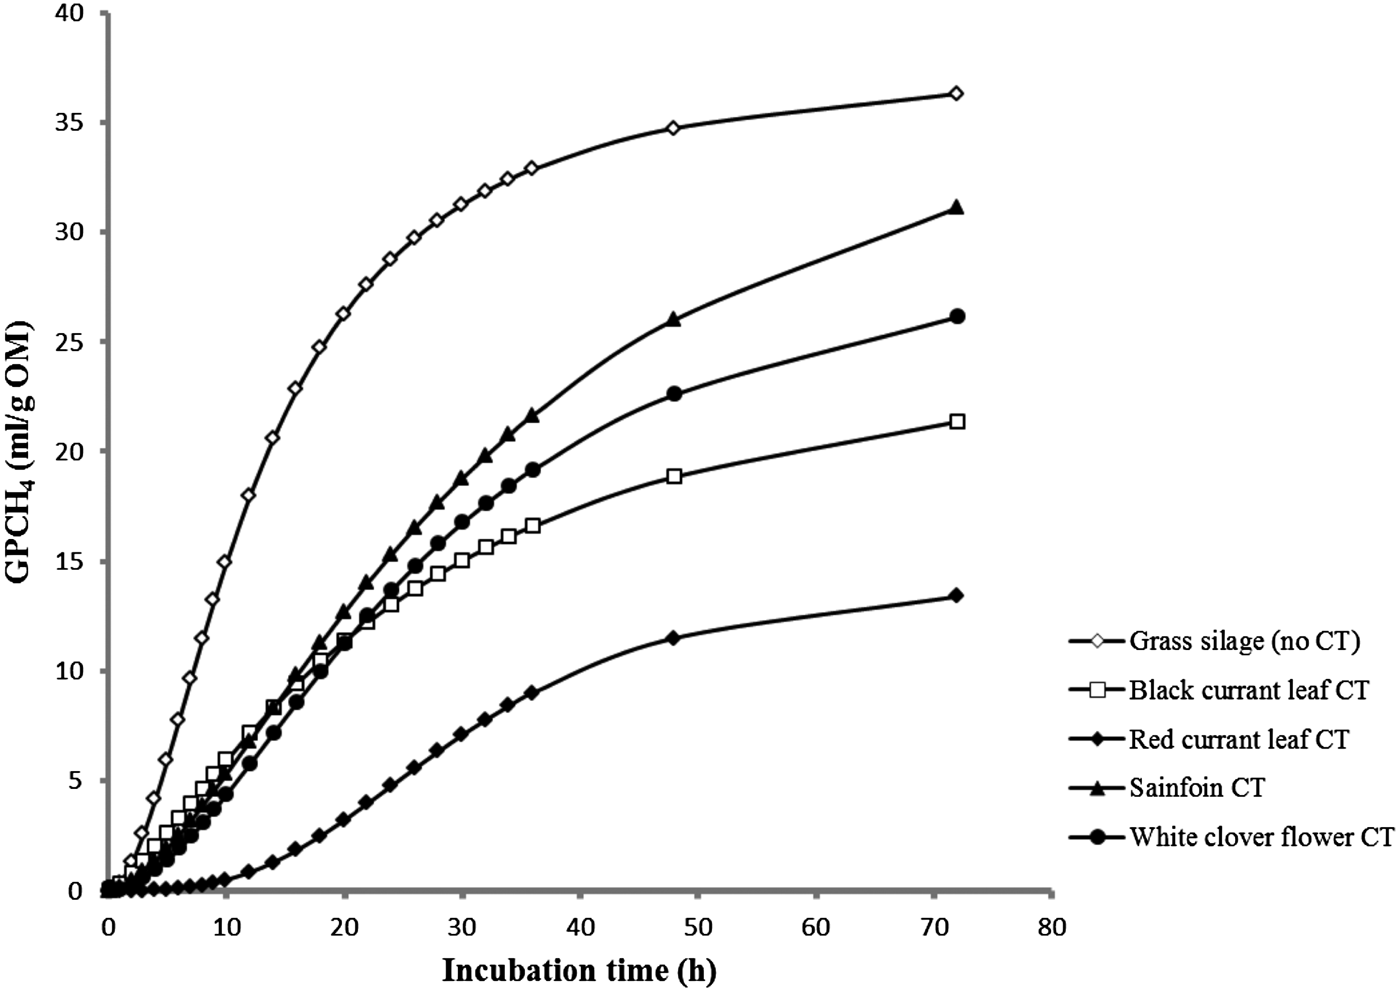
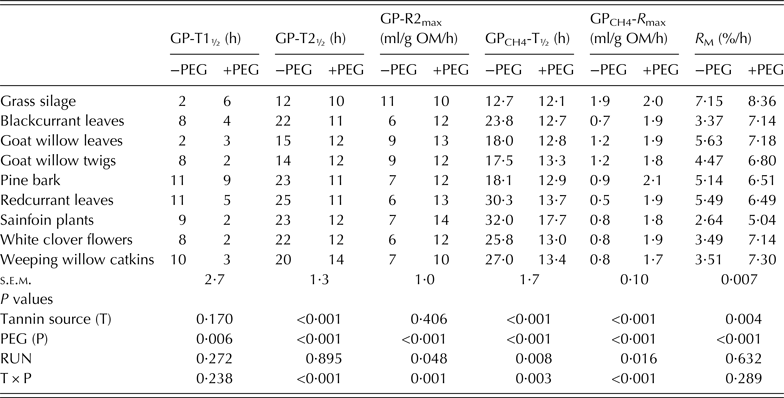
The time at which half of the asymptotic GP (GP-T1½; half time) in the first phase was reached was not affected (P = 0·170) by CT source (Table 3). The half times of GP for the second phase (GP-T2½) and of methane production (GPCH4-T½) were in general increased (P < 0·001) when CT was added to the control, while GPCH4-R max and R M were decreased (P = 0·004; Table 3). The addition of PEG significantly decreased (P = 0·006) the values for GP-T1½, GP-T2½ and GPCH4-T½, and increased (P < 0·001) the GP-R2max, GPCH4-R max and R M. An effect of interaction between tannin source and PEG was found (P = 0·003) for GP-T2½, GP-R2max, GPCH4-T½, and GPCH4-R max. Individual CT types affected GP-T2½ and GPCH4-T½ differently, with CT extracts from redcurrant leaves and sainfoin causing the largest increase compared to the control (P ⩽ 0·001). The maximum rate of GP in the second phase (GP-R2max) and CH4 production (GPCH4-R max) both decreased (P < 0·001) when CT was added to the control. Adding blackcurrant leaf CT to the control created the largest decrease (P = 0·031) in GP-R2max, whereas redcurrant leaf CT generated the largest decrease (P < 0·001) in GPCH4-R max. Addition of CT decreased (P = 0·004) the rate of substrate degradation (R M) as derived from the CH4 production curves, with the largest reduction caused by sainfoin CT (2·6%/h). Figures 2 and 3 describe the CH4 production profiles that resulted from the CT additions without PEG. The profiles also show the large CT effects from redcurrant leaves, blackcurrant leaves and white clover flowers on the extent and kinetics of CH4 production.
Methane production profiles of grass silage with four condensed tannins extracts without polyethylene glycol (−PEG) (proportion of prodelphinidins, PD ⩽ 60).

Methane production profiles of grass silage with four condensed tannins extracts without polyethylene glycol (−PEG) (proportion of prodelphinidins, PD > 60).

Total gas (GP) and CH4 (GPCH4 ) production kinetic parameters (T½, Rmax, RM ) from fermentations containing different condensed tannin types with (+) and without (−) PEG were added

GP-T1½ = half time of asymptotic gas in first phase; GP-T2½ = half time of asymptotic gas in second phase; GPCH4-T½ = half time of asymptotic methane production; GP-R2max = maximum rate of gas production in second phase; GPCH4-R max = maximum rate of methane production; +PEG, −PEG = with/without PEG addition; R M = rate of substrate degradation; s.e.m. = standard error of the mean.
Effects of condensed tannin source on fermentation end-products
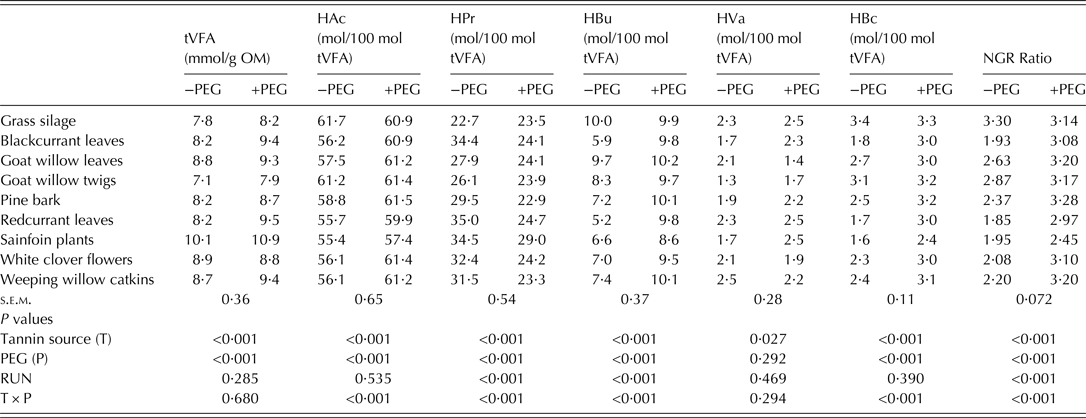
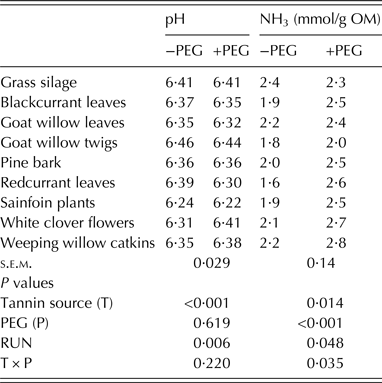
Tannin source affected tVFA, the molar proportion of individual VFA (acetate [HAc], propionate [HPr], butyrate [HBu] and valerate [HVa]), the molar proportion of branched chain VFA (HBc) and non-glucogenic to glucogenic VFA (NGR) ratio, as well as pH and NH3 (P = 0·014; Tables 4 and 5). Addition of PEG showed a similar significant (P < 0·001) effect except for pH and HVa, which were not affected. In general, CT addition gave an increase (P < 0·001) in tVFA and the molar proportion of HPr, whereas the molar proportions of HAc and HBc decreased (P < 0·001), as did NGR ratio and the NH3 concentration. Addition of PEG resulted in a general increase (P < 0·001) in tVFA, the molar proportions of HAc and HBc, the NGR ratio and NH3 concentration, while molar proportions of HPr were decreased (P < 0·001). There was an effect of interaction between tannin source and PEG (P = 0·035) on HAc, HPr, HBu, HBc, NGR ratio and NH3 concentration. Addition of CT without PEG, tVFA and pH were similar among treatments (Table 4). There were significant differences in tVFA and pH (both P ⩽ 0·001) between sainfoin and goat willow twig treatments: sainfoin gave the highest tVFA (10·08 mm/g OM) and the lowest pH (6·24), whereas goat willow twigs gave the highest pH (6·48) and the lowest tVFA (7·13 mm/g OM) compared with the other CT extracts. All CT additions without PEG decreased (P = 0·014) the NH3 concentrations compared with control. Redcurrant leaf extract gave the lowest (P = 0·041) NH3 concentration (1·56 mm/g OM). Addition of CT decreased (P < 0·001) the molar proportion of HAc, except for CT from goat willow twigs, and increased (P < 0·001) the molar proportion of HPr with the highest proportion found with the redcurrant leaf CT. Addition of CT decreased (P < 0·001) the molar proportion of HBc and the NGR ratio, with the largest reduction caused by sainfoin and redcurrant leaf CT. In general, PEG addition increased (P < 0·001) NH3 and tVFA concentration, increased the molar proportions of HAc, HBc as well as the NGR, and decreased the molar proportion of HPr (P < 0·001).
Fermentation end-products produced in in vitro incubations containing different condensed tannin types with (+) and without (−) PEG

+PEG, −PEG = with/without PEG addition; tVFA = total volatile fatty acid (tVFA = HAc + HPr + HBu + HVa + HBc); HAc = acetic acid; HPr = propionic acid; HBu = butyric acid; HVa = valeric acid; HBc = branched–chain volatile fatty acids (HBc = iso-butyric + iso-valeric acid); NGR = non–glucogenic to glucogenic VFA ratio [NGR = (HAc + 2 × HBu + 2 × iso-butyric + HVa + iso-valeric)/(HPr + HVa + iso-valeric)]; s.e.m. = standard error of the mean.
Fermentation end-products produced in in vitro incubations containing different condensed tannin types with (+) and without (−) PEG

+PEG, −PEG = with/without PEG addition; NH3 = ammonia; SEM = standard error of the mean.
Relationships between condensed tannin structure and fermentation kinetics and end-products
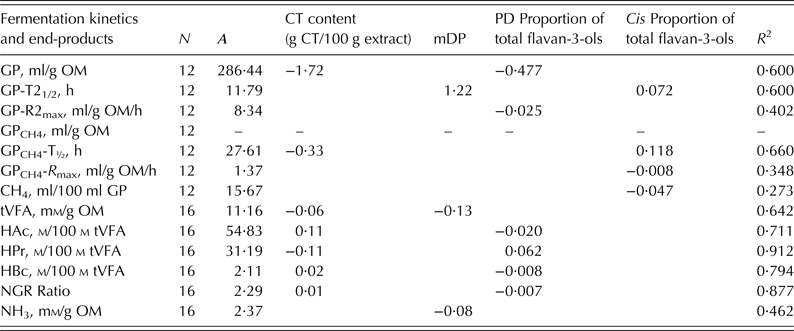
Table 6 shows the relations between CT content (g CT/100 g extract), mDP, proportion of PD, and proportion of cis flavan-3-ols within CT and fermentation kinetics or fermentation end-products. Condensed tannin content affected (P = 0·011) GP, GPCH4-T½ and fermentation end-products and had a relatively strong effect on most fermentation end-products as R 2 values ranged from 0·64 to 0·91, except for NH3 (0·46) and CH4 concentration (0·27). Prodelphinidins affected (P = 0·035) GP, GP-R2max, HPr, HBc, and NGR, however, the relation between PD and fermentation end-products had higher R 2 values (0·79 to 0·91) compared with the fermentation kinetic parameters (R 2 ⩽ 0·60). The proportion of cis flavan-3-ols affected fermentation kinetics of methane production, but the R 2 values ranged only from 0·27 to 0·65.
The relations between structural features of condensed tannins and fermentation kinetics and fermentation end-products as estimated by multiple stepwise regression

n = number of observations; α = intercept; CT = condensed tannin content (g/100 g extract); mDP = mean degree of polymerization (i.e. the average number of flavan-3-ol monomers per polymer); PD = proportion of prodelphinidin subunits gallocatechin (GC) and epigallocatehin (EGC) units); Cis = proportion of flavan-3-ols with cis configuration. GP, GPCH4 = volume of total gas and methane produced per gram organic matter (OM) initial substrate weight ; CH = methane concentration in total gas produced; GP-T21/2 = half time of asymptotic gas in second phase; GPCH4-T½ = half time of asymptotic methane production; GP-R2max = maximum rate of gas in second phase; GPCH4-R max = maximum rate of methane production; tVFA = total volatile fatty acid (tVFA = HAc + HPr + HBu + HVa + HBc); HAc = acetic acid; HPr = propionic acid; HBc = branched–chain volatile fatty acids (HBc = iso-butyric + iso-valeric acid); NGR = non–glucogenic to glucogenic VFA ratio [NGR = (HAc + 2 × HBu + 2 × iso-butyric + HVa + iso-valeric)/(HPr + HVa + iso-valeric)]; NH3 = ammonia; R 2 = coefficient of determination.
DISCUSSION
Waghorn et al. (Reference Waghorn, Shelton and McNabb1994) suggested that >50 g CT/kg Lotus pedunculatus may negatively affect feed intake whereas lower dietary CT concentrations have no influence on feed intake by ruminants. Therefore, in the current study, tannin contents were accounted for and the final concentration adjusted to 40 g CT/kg initial substrate. Addition of 40 g CT/kg substrate did not affect GP and tVFA compared with control, except for sainfoin CT, which gave higher GP and tVFA values. This result could be due to the fact that tannin extracts differed considerably in CT content (12·6 g/100 g in sainfoin to 53·8 g/100 g in goat willow twigs extracts). Non-tannin compounds present in the tannin extracts may be fermented; therefore, in addition, blanks containing CT extracts were incubated with and without PEG in the current study (average GP data presented in Materials and Methods section). The GP of blanks with sainfoin extracts, with and without PEG, were 42·7 and 26·1 ml, respectively. Thus, non-CT compounds in the extracts may have influenced the current findings, despite the corrections made for blanks. In spite of having no effect on GP, addition of CT decreased the maximum rate of GP in the second phase and increased the half time of asymptotic GP in the second phase. This suggests that CT inhibited the initial rate of fermentation but not the extent of DM degradation. The current study demonstrated clearly that CT delayed the initial rate of fermentation, when added CT decreased the rate of substrate degradation from 7·2%/h in grass silage to 4·2%/h on average. In addition, a reduction of ruminal NH3 and HBc means that CT can act as a protein protectant against ruminal microbial degradation and will increase rumen escape protein (Waghorn Reference Waghorn1990; Bunglavan & Dutta Reference Bunglavan and Dutta2013).
A reduction of ruminal NH3 and HBc in the present study agrees with previous reports by Bhatta et al. (Reference Bhatta, Uyeno, Tajima, Takenaka, Yabumoto, Nonaka, Enishi and Kurihara2009) and Pellikaan et al. (Reference Pellikaan, Stringano, Leenaars, Bongers, Van Laar-Van Schuppen, Plant and Mueller-Harvey2011b ). Ammonia is a product of amino acid deamination, whereas iso-butyrate and iso-valerate are breakdown products of the carbon skeleton of the essential amino acids valine and leucine, respectively, during rumen fermentation (Van Soest Reference Van Soest1994). Tannins can bind proteins to form insoluble complexes and thus reduce protein degradation in rumen fluid (Mueller-Harvey Reference Mueller-Harvey2006; Patra & Saxena Reference Patra and Saxena2011); hence, this explains the decrease of NH3 and branched chain VFA concentrations. On the other hand, the reduction in NH3 and HBc could be due to enhanced utilization of HBc and NH3 for microbial protein synthesis (Waghorn & Shelton Reference Waghorn and Shelton1997). Pellikaan et al. (Reference Pellikaan, Stringano, Leenaars, Bongers, Van Laar-Van Schuppen, Plant and Mueller-Harvey2011b ) also reported lower in vitro NH3 and HBc concentrations when lucerne substrate was supplemented with quebracho CT. Condensed tannins have higher affinities for proteins than polysaccharides (Patra & Saxena Reference Patra and Saxena2011). This may explain the more profound effect of tannins on NH3 concentration compared with their impact on tVFA production.
In the current study, all CT sources reduced CH4 production and CH4 concentration compared with the control. This reduction could be due to lower fibre degradation caused by the formation of CT and lignocellulose complexes, which in turn prevent microbial fermentation, or by direct inhibition of cellulolytic micro-organisms or a combination of both (McSweeney et al. Reference McSweeney, Palmer, McNeill and Krause2001). Moreover, lower CH4 production could also stem from a lower acetate proportion and a higher propionate proportion due to CT. The mechanism of CT effect on acetate and propionate production could possibly be the result of a change in microbial profile or composition and microbial activity. Jones et al. (Reference Jones, McAllister, Muir and Cheng1994) found that CT inhibited the growth of Butyrivibrio fibrisolvens bacteria, which are involved in fibre fermentation. Fermentation of organic matter to acetate and butyrate liberates 2[H]− ions, which are used in the rumen to produce CH4, whereas propionate production is considered to be a [H]− ion sink (Tavendale et al. Reference Tavendale, Meagher, Pacheco, Walker, Attwood and Sivakumaran2005; Beauchemin et al. Reference Beauchemin, McAllister and McGinn2009). Addition of CT did not change the ruminal pH and all pH values (6·24 to 6·46) were in the normal range for optimal microbial digestion of fibre and protein (Van Kessel & Russell Reference Van Kessel and Russell1996).
The current study confirmed that PEG, which was used as a CT neutralizing agent (Silanikove et al. Reference Silanikove, Perevolotsky and Provenza2001; Tavendale et al. Reference Tavendale, Meagher, Pacheco, Walker, Attwood and Sivakumaran2005; Beauchemin et al. Reference Beauchemin, McAllister and McGinn2009), clearly influenced the fermentation characteristics. It has been used in many studies (Makkar et al. Reference Makkar, Blümmel and Becker1995; Getachew et al. Reference Getachew, Makkar and Becker2000a , Reference Getachew, Makkar and Becker2002; Calabrò et al. Reference Calabrò, Guglielmelli, Iannaccone, Danieli, Tudisco, Ruggiero, Piccolo, Cutrignelli and Infascelli2012) in order to measure the effect of tannin-containing substrates on rumen fermentation in vitro. Polyethylene glycol is an inert compound able to inactivate CT (Makkar et al. Reference Makkar, Blümmel and Becker1995). It is supposed to make tannins inert by forming tannin–PEG complexes and even to be able to displace protein from a tannin–protein complex. This would explain the interaction effect observed between tannin sources and PEG in the current study. The results of the current study showed an increase in GP, GPCH4 and CH4 concentration, a decrease in half time and an increase in the maximum rate of fermentation for GP and GPCH4 in the presence of PEG. This is probably caused by an increase in available nutrients to rumen microbes, especially nitrogen (Getachew et al. Reference Getachew, Makkar and Becker2000b ) due to protein being released from a tannin–protein complex. When more nitrogen is available, in the presence of sufficient carbohydrate, more amino acids are absorbed into the bacterial cells, resulting in greater microbial growth, and consequently, an increased fermentation activity with higher gas production and tVFA production (Calabrò et al. Reference Calabrò, Guglielmelli, Iannaccone, Danieli, Tudisco, Ruggiero, Piccolo, Cutrignelli and Infascelli2012).
The individual CT source had different effects on fermentation kinetics and fermentation end-products, although, in the current study, the same amount of CT was added to the control (40 g CT/kg of grass silage substrate). This ensured that the effects of tannins on fermentation kinetics and fermentation end-products could be assessed. The effects varied depending on the CT source, agreeing with observations in the literature (Beauchemin et al. Reference Beauchemin, McGinn, Martinez and McAllister2007; Pellikaan et al. Reference Pellikaan, Stringano, Leenaars, Bongers, Van Laar-Van Schuppen, Plant and Mueller-Harvey2011b ; Hassanat & Benchaar Reference Hassanat and Benchaar2013). In the current study, the purity of CT (12·6–53·8 g CT/100 g extract) affected both fermentation kinetic and end-product parameters. These results could be due to non-tannin compounds in the extract, such as sucrose and flavonoids (Marais et al. Reference Marais, Mueller-Harvey, Brandt and Ferreira2000; Regos et al. Reference Regos, Urbanella and Treutter2009). Effects of the CT purity on GP were also reported by Pellikaan et al. (Reference Pellikaan, Stringano, Leenaars, Bongers, Van Laar-Van Schuppen, Plant and Mueller-Harvey2011b ), where CT content ranged from 14·5 to 95·1 g CT/100 g extract.
In the current study, the degree of polymerization affected NH3 concentration negatively and delayed the half time of asymptotic GP in the second phase. The mDP of CT ranged from 2·3 (weeping willow catkins) to 9·8 (redcurrant leaves). Addition of CT from redcurrant leaves had the largest mDP and gave the lowest NH3 concentration. This agrees with Makkar et al. (Reference Makkar, Dawra and Singh1988), who reported that the protein precipitation capacity of CT depends on the degree of polymerization. Interestingly, Hatew et al. (Reference Hatew, Hayot Carbonero, Stringano, Sales, Smith, Mueller-Harvey, Hendriks and Pellikaan2015) also found a negative correlation between mDP and protein degradation.
The proportion of PD negatively affected GP, HBc and NGR and positively affected GP-R2max and HPr. Prodelphinidins have more hydrogen bonding sites than procyanidins and this may enhance their affinity to fibres and proteins. This agrees with Hatew et al. (Reference Hatew, Hayot Carbonero, Stringano, Sales, Smith, Mueller-Harvey, Hendriks and Pellikaan2015), who also found that prodelphinidins had a greater effect on fibre than protein digestion. Condensed tannins with a higher PD proportion have more hydrogen bonding sites, which may enhance the affinity of this type of CT to bind to fibre and create CT-fibre complexes, thus reducing fibre degradation in the rumen fluid (Hatew et al. (Reference Hatew, Hayot Carbonero, Stringano, Sales, Smith, Mueller-Harvey, Hendriks and Pellikaan2015). The formation of insoluble CT-fibre and CT-protein complexes is likely to have reduced the fermentation. This could be seen as a reduction in GP and an increase in GP-R2max in the current study. The PD : PC ratio (expressed as proportion of PD within the CT) was the most important factor among all of the CT features and showed a negative correlation with the total GP and acetate proportion (Hatew et al. Reference Hatew, Hayot Carbonero, Stringano, Sales, Smith, Mueller-Harvey, Hendriks and Pellikaan2015). Molan et al. (Reference Molan, Attwood, Min and McNabb2001) also found that PD, rather than PC, inhibited particularly the growth of proteolytic bacteria.
The proportion of cis flavan-3-ols negatively affected the GPCH4-R max and CH4 concentration and increased GP-T2½ and GPCH4-T½, but the coefficients of determination (R 2) with GPCH4-R max and CH4 concentration were only 0·34 and 0·27, respectively. Hatew et al. (Reference Hatew, Hayot Carbonero, Stringano, Sales, Smith, Mueller-Harvey, Hendriks and Pellikaan2015) also found no correlation (neither positive nor negative) between proportion of cis and fermentation kinetics or fermentation-end products; however, they only evaluated CT from different sainfoin (Onobrychis viciifolia) accessions, where mDP, proportion of PD and proportion of cis values were correlated and thus these CT offered limited opportunities for assessing the effects of the different CT structural features. The present study, in contrast, evaluated a greater diversity of CT that originated from eight different plant sources. Based on the coefficient of determination (R 2), the CT content and prodelphinidin were the most important factors among the CT features that affected fermentation kinetics and fermentation end-products with R 2 values ranging from 0·6 to 0·9.
CONCLUSIONS
Condensed tannins extracted from different plants had diverse effects on the extent and rate of gas and CH4 production and also reduced CH4 production and concentration. The CT content and proportion of prodelphinidin were the most important factors among the CT properties that affected fermentation kinetics and fermentation end-products. Thus, higher CT and prodelphinidin contents contributed most to lower methane production without negatively affecting the overall fermentation.
The authors thank Michel Breuer and Erika Beukers-van Laar for VFA analysis and Saskia van Laar for assistance during in vitro methane measurements. The authors also thank to Mr and Mrs Prudence, Mr P. Davy and Mrs Karonen for providing plant material. Financial support was provided by the European Commission (Marie Curie Initial Training Network, PITN-GA-2011-289377, “LegumePlus”).