1. Introduction
Research on legged robots has its origins in the 1960s. In comparison to wheeled and tracked robots, legged robots demonstrate superior adaptability to various terrains and enhanced capabilities for traversing obstacles, which allows them to perform tasks in intricate environments [Reference Gor, Pathak, Samantaray, Yang and Kwak1–Reference Kousik, Rahul and Annigeri4]. As advancements in robot control technology continue, legged robots have increasingly emerged as a focal point of research interest [Reference Amir, Yuan and Yan5–Reference Huaizhi, Junhui and Jiang7]. These robots are characterized as time-varying, strongly coupled, and multivariable dynamic systems that are significantly affected by gravitational forces, resulting in substantial computational requirements for motion control. Among the different types of legged robots, quadruped robots are noted for their exceptional performance in terms of load-bearing capacity, diverse movement patterns, and effective motion control [Reference Akshit, Vijay and Krishnan8]. Presently, the control strategies employed for quadruped robots can be broadly categorized into two main types: model-based control methods and model-independent control methods [Reference Fan, Pei, Wang, Li, Tang and Liu9, Reference Hui, Yibin and Song10].
Model-based control methodologies generally entail the development of a model of the robotic system through the analysis of kinematics and dynamics, followed by the planning of a desired trajectory [Reference Shengyang, Yue, Lei and Xiaojun11, Reference Xiaojun, Shengyang and Jiang12]. Subsequently, feedback control is employed to progressively align the actual motion trajectory with the intended trajectory. Notable examples of model-based control techniques include Zero Moment Point control [Reference Takeuchi13, Reference Yoneda and Hirose14], Three-Part Control (3 PC) [Reference Raibert Marc and Sutherland Ivan15, Reference Raibert Marc and Tello Ernest16], and virtual model control (VMC) [Reference Pratt and Dilworth17, Reference Aizhen, Teng and Rong18].
In contrast, model-independent control strategies do not depend on the dynamic model of the robot; rather, they operate based on input-output signals and pertinent real-time data. This characteristic allows for the maintenance of stable robot operation even in the presence of model inaccuracies or uncertainties. A prominent example of this approach is the central pattern generator-based motion control method [Reference Yasuhiro, Hiroshi and Cohen Avis19–Reference Michele, Amina, Aubakir, Giuseppina, Alessio Mauro and Matteo22]. With advancements in machine learning technologies, an increasing number of researchers have introduced model-independent control strategies that leverage intelligent algorithms [Reference Xin, Tao and Kai23–Reference Sibo, Shangke, Hongyin and Donglin26].
An examination of pertinent research findings reveals that model-independent control methods operate independently of precise dynamic models. These methods attain control objectives by continuously modifying the control output in response to feedback derived from interactions with the environment, demonstrating significant adaptability. However, the absence of guidance from specific models poses challenges in maintaining reliable control stability within complex environments. Conversely, model-based control methods depend on dynamic models, which facilitate robots in executing desired motion trajectories with enhanced accuracy, control precision, and stability. Theoretically, optimal control outcomes can be realized when based on an accurate dynamic model. Nevertheless, in practical applications, the dynamic factors involved are often intricate and complex, complicating the modeling process. Furthermore, the models that are developed typically pertain to specific operational conditions, thereby constraining their adaptability in multifaceted environments.
Taking all factors into consideration, the VMC method belongs to the category of model-based control methods, but it simplifies the dynamic modeling process by directly establishing a correlation model between the end-effector and the robot body. Furthermore, VMC constructs virtual models in the form of equivalent and universal mechanical components, which possess broad generality. By adjusting relevant virtual parameters, it can be adapted to different motion control models. Therefore, it is feasible to propose an optimized adaptive VMC method that realizes model-based control while enhancing adaptability and robustness.
The VMC method approaches from the perspective of intuitive control, envisioning virtual mechanical components connecting the robot’s body (internal action points) with the external environment (external action points), such that the generated virtual forces can drive the robot to perform corresponding actions. Then, based on the principle of virtual work, the virtual forces are mapped into torques in the joint space, serving as the output targets for the joint motors. Chew [Reference Chew and Pratt27] implemented walking control for biped robots based on VMC and proposed an adaptive VMC using sliding mode control theory. Later, Massachusetts Institute Of Technology, combining model predictive technology, achieved control of complex actions like jumping on the Cheetah3 robot [Reference Gerardo, Powell Matthew and Katz28, Reference Di Carlo, Wensing Patrick and Katz29]. Zhang [Reference Zhang, Rong and Hui30] et al. proposed a joint torque servo and active compliance control method for robot legs based on VMC, and subsequently, Chen [Reference Chen, Sun and Xu31] et al. transformed the force distribution problem into a QP optimization problem to achieve motion control under optimal foot force.
Numerous research initiatives pertaining to VMC concentrate on the prediction and allocation of the requisite virtual forces, thereby optimizing control during the final output phase. Nonetheless, the formulation of the virtual model, particularly the selection of virtual parameters, exerts a direct influence on the control efficacy of VMC. Variations in virtual models yield distinct dynamic characteristics within VMC systems. The attainment of adaptive modeling of the virtual model, tailored to the specific demands of motion and the fluctuations in the motion environment, can substantially improve the adaptability of the VMC controller and enhance its overall control performance [Reference Sabri32, Reference Li, Xu, Yu, Xu and Xiao33].
Therefore, this paper proposes a VMC method based on backpropagation neural network (BPNN) optimization from the perspective of constructing virtual models. In this method, a BPNN is used to equivalently replace the virtual parameter matrix in VMC. Leveraging the self-training capability of BPNN, adaptive tuning of virtual parameters, that is, adaptive modeling of virtual mechanical components, is achieved. Depending on changes in the environment or motion state, BPNN can also effectively achieve adaptive optimization of the model and virtual parameters, thus improving the adaptability of the controller. The main achievements are:
-
1. Adaptive tuning of virtual parameters, which realizes adaptive modeling of the virtual component model. This enables the VMC controller to automatically adjust parameters based on different environments and task requirements, improving the robot’s adaptability and flexibility.
-
2. Optimized trajectory and velocity tracking performance, effectively reducing tracking errors. This ensures that the robot can maintain precise and stable movement under different motion targets.
-
3. Enhanced control stability and motion stability. The robot can maintain a stable operating state even in dynamic environments, reducing the risk of losing control.
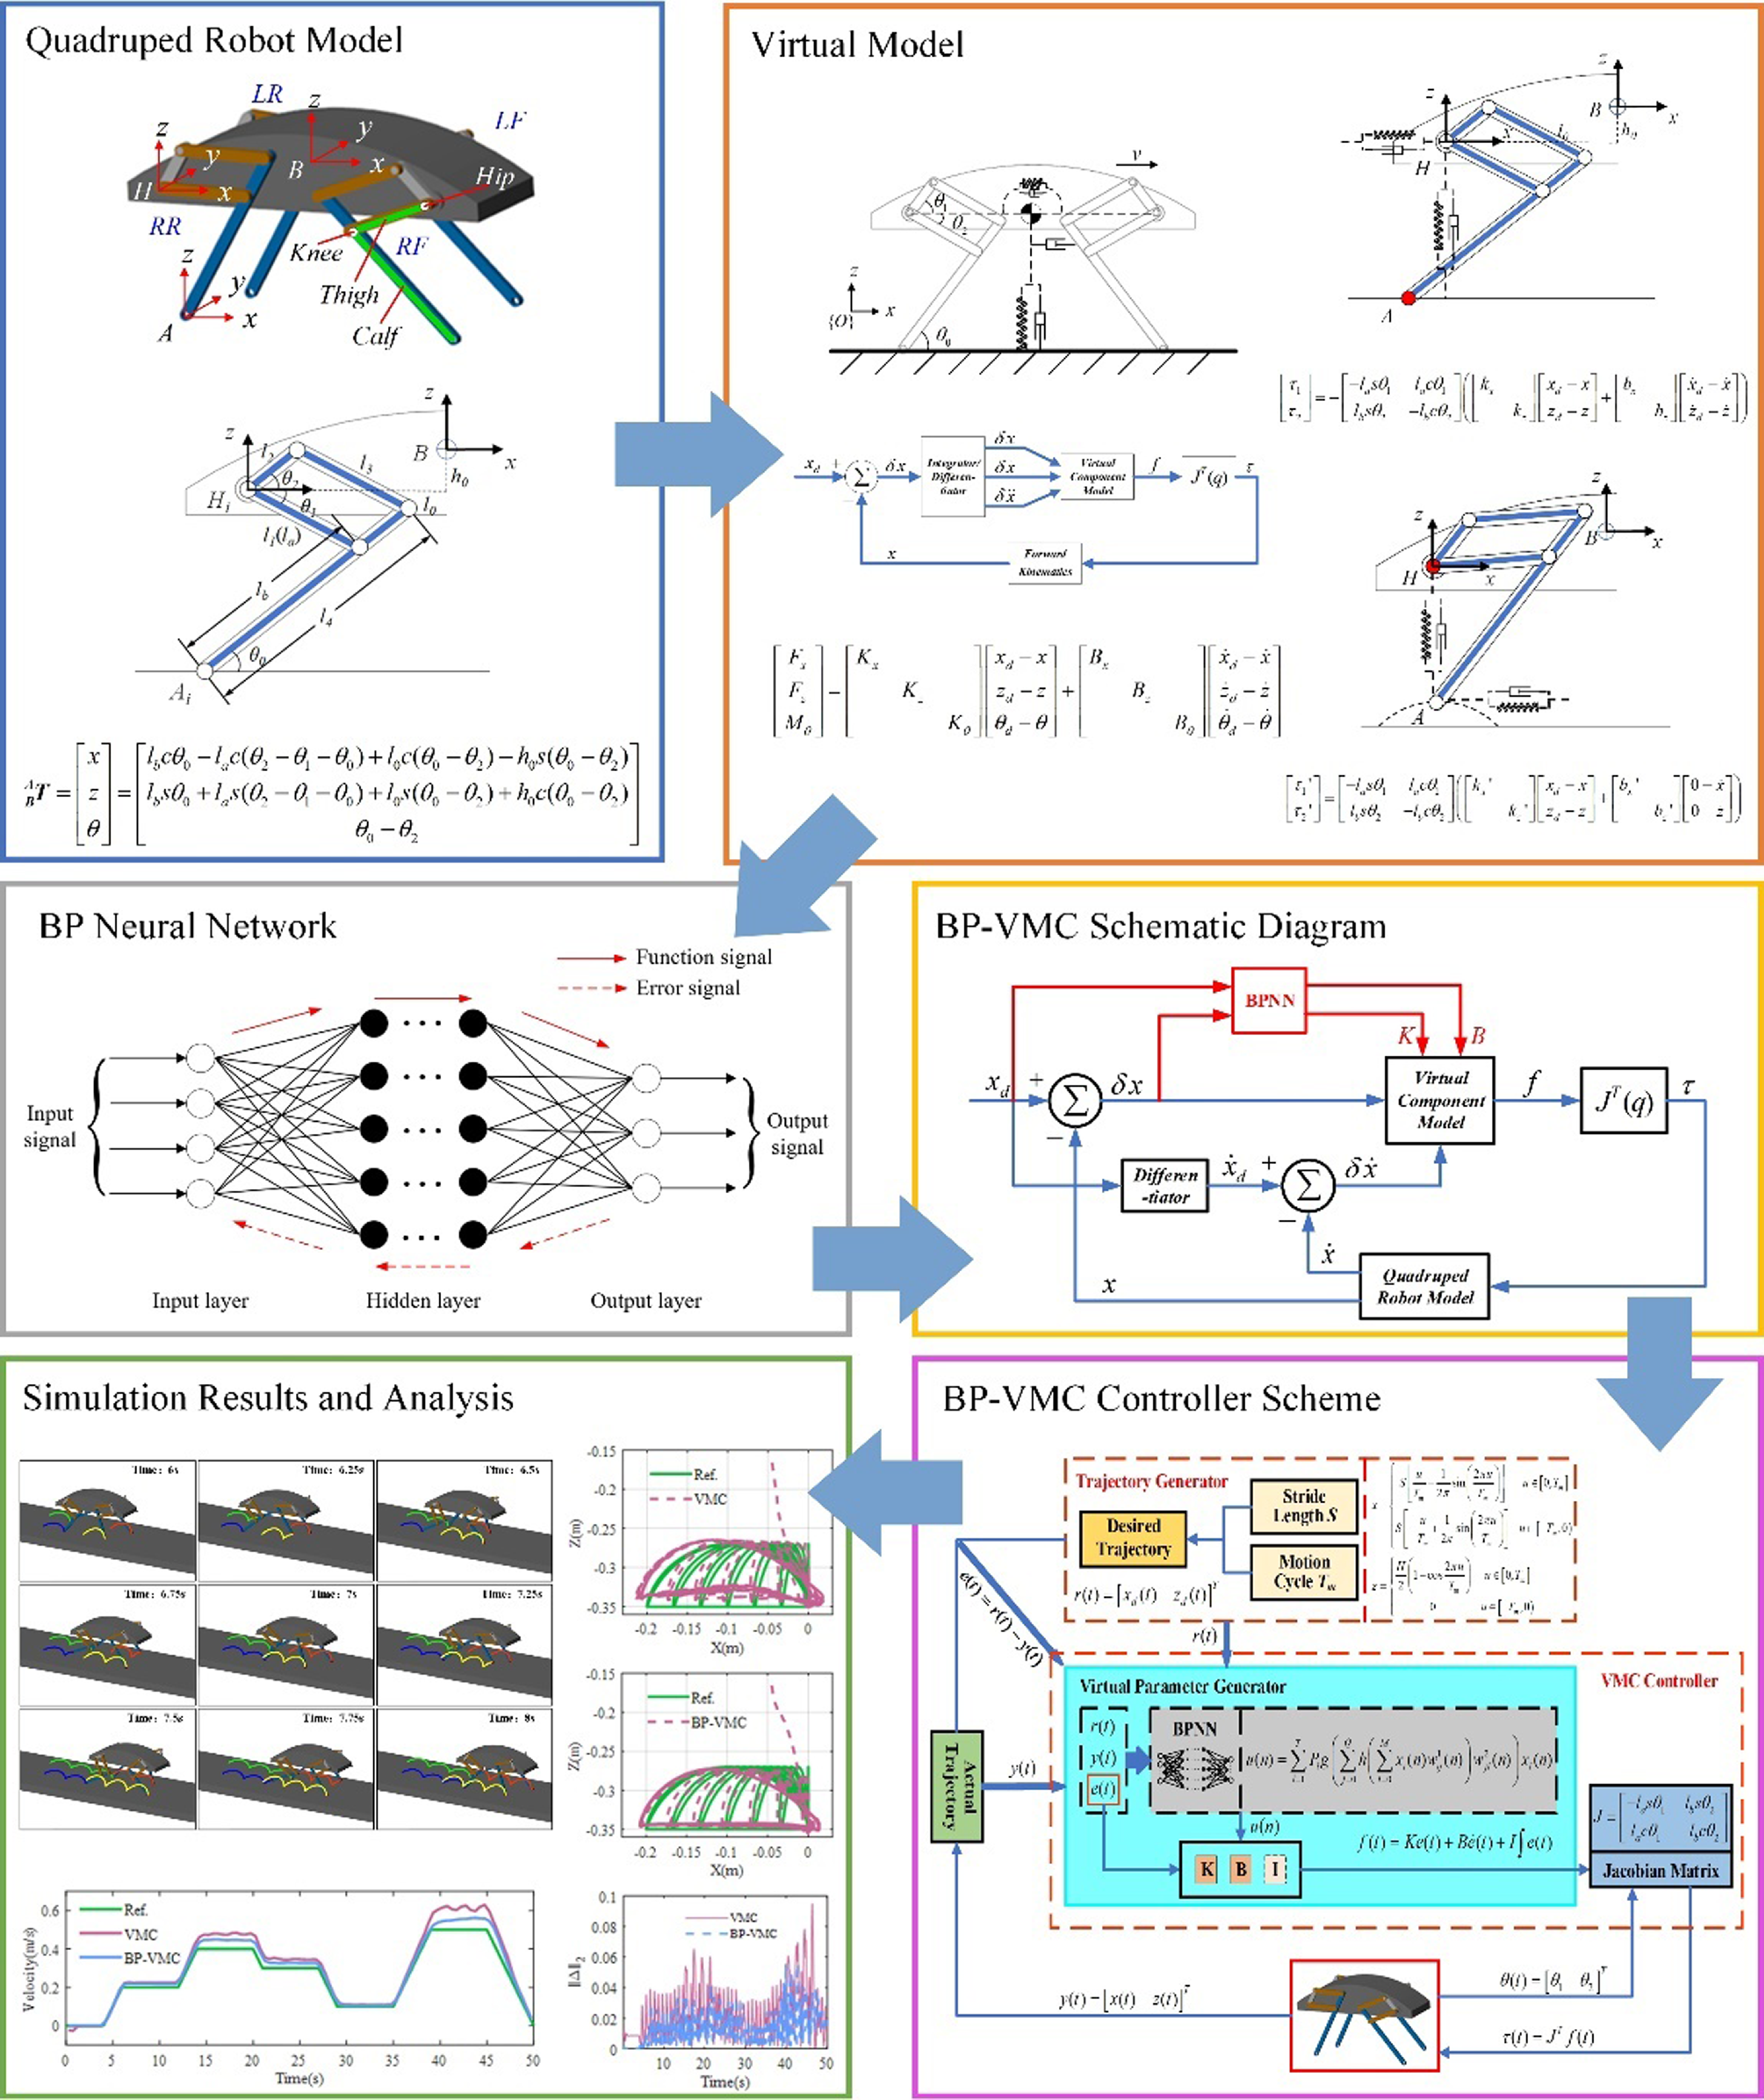
The framework of this article is shown in Figure 1. In Sections 2 and 3, a quadruped robot model is established based on kinematic analysis, and a virtual control model is constructed accordingly. In Sections 4 and 5, the control systems and frameworks for VMC and BP-VMC are developed. In Section 6, the improved BP-VMC control algorithm is applied to the gait planning and motion trajectory control of the quadruped robot, and a comparative analysis is conducted with VMC as the control group.
Framework of this paper.

2. Quadruped robot model
In the control of leg movement, the more degrees of freedom (DOF) a leg has, the more flexible the movement becomes, but also the more complex the control becomes. Considering the primary movement needs of quadruped robots, each leg typically has three DOFs, which, respectively, achieve hip abduction, thigh swing, and shank swing. The hip abduction DOF mainly serves as a corrective control function based on stability. Therefore, when analyzing the kinematic model of a quadruped robot during locomotion, the hip abduction DOF is temporarily excluded. The main focus is on analyzing the thigh and shank swing DOFs.
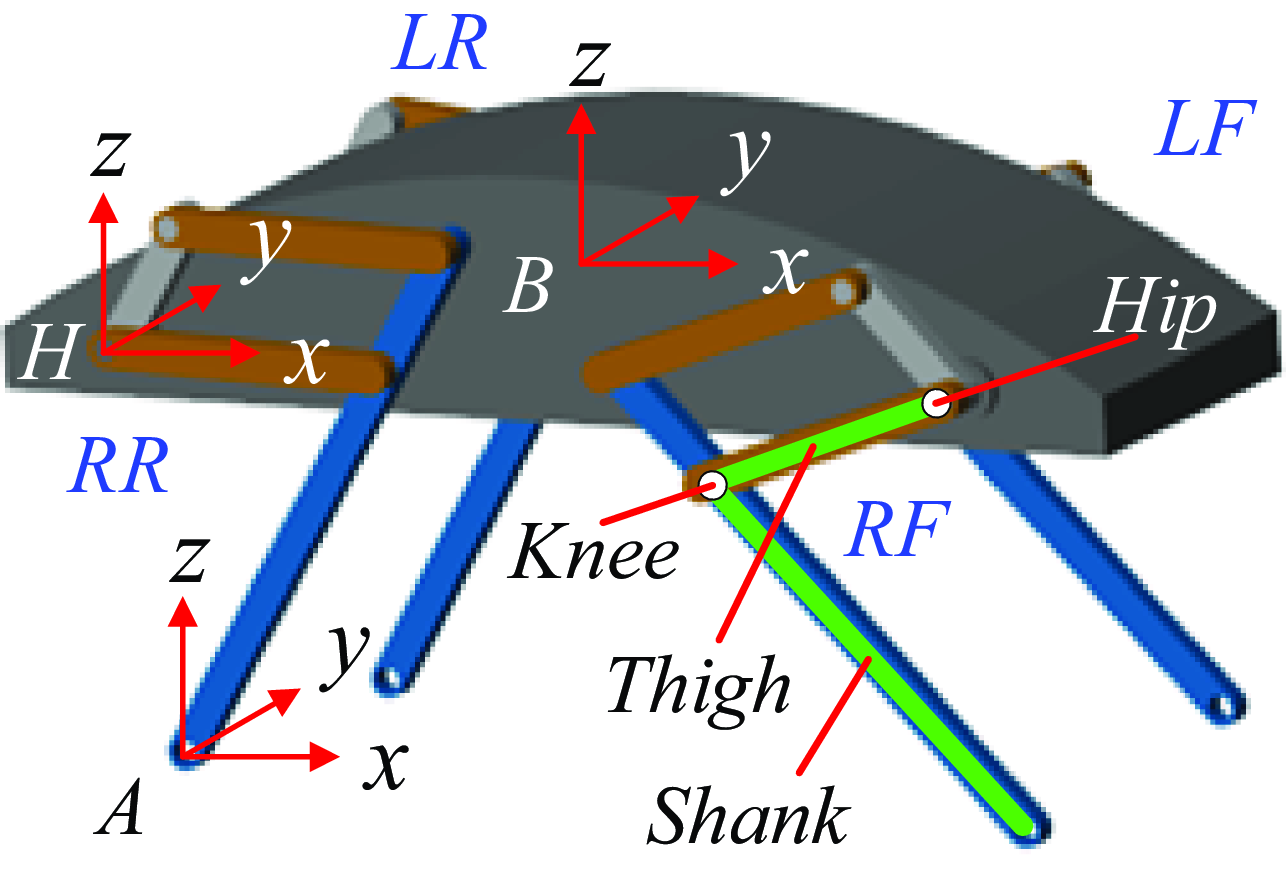
The quadruped robot model studied in this paper adopts a front elbow-rear knee configuration, as shown in Figure 2. Compared to other leg configurations, this configuration exhibits a more compact overall structure, a uniform distribution of mass, and reduced self-motion fluctuations, all of which contribute to the stability of the robot during its movement. To facilitate the subsequent description of the positional relationships between various joint points, three coordinate systems are defined: the body coordinate system
 $B-XYZ$
with the centroid of the body as the reference, the hip coordinate system
 $H-xyz$
with the hip joint as the origin and the y-axis aligned with the rotation axis, and the foot-end coordinate
 $A-xyz$
system with the end-point A of the leg as the origin.
Quadruped robot model.

In the process of walking motion control, the main approach is to control the rotation angles of the thigh and shank swing to achieve changes in the position output of the leg’s end-effector, thus fulfilling the purpose of controlling the legged movement of the robot. This involves issues related to the kinematics analysis of the robot, which requires both the ability to derive the end-effector position output based on the input of the actuated joints and to determine the required input of the actuated joints based on the desired position output of the end-effector. This ensures the certainty of the robot’s motion control.
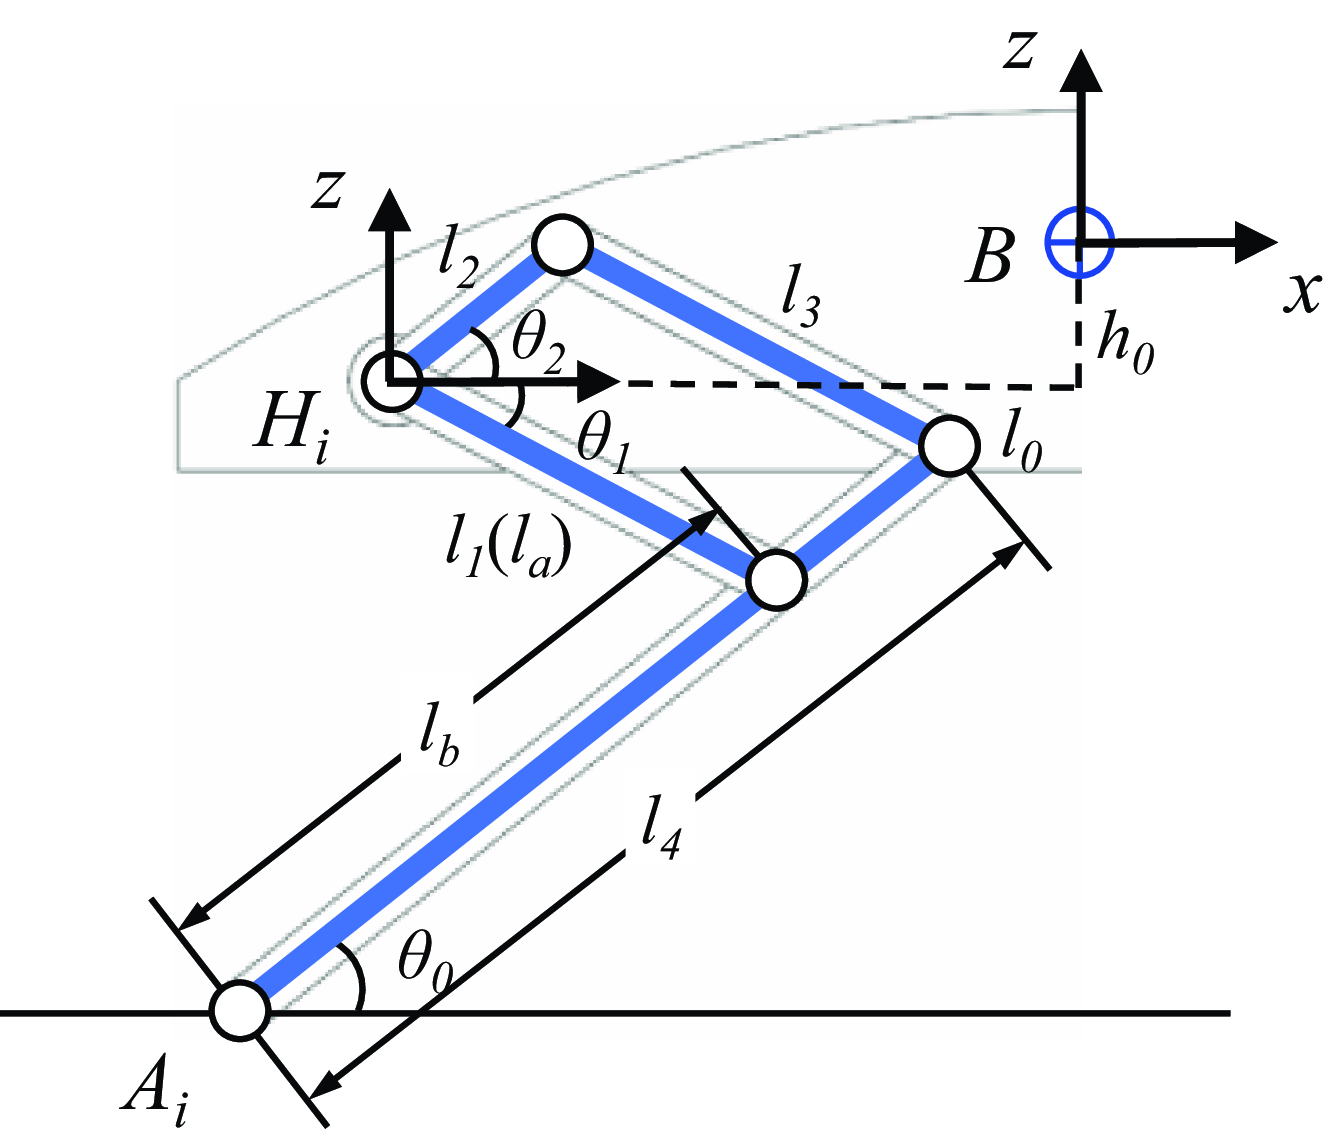
Due to the symmetrical structure of the legs of the quadruped robot, the right rear leg is selected for analysis without loss of generality. The single-leg structure is shown in Figure 3.
 $\theta _{0}$
represents the angle of the passive joint established at the interface between the foot-end and the ground,
 $\theta _{1}$
and
 $\theta _{2}$
represent the angles of the active joints, A is the endpoint of the leg, H is the hip joint of the robot’s leg, B is the center of mass of the robot, and the subscript
 $i(i=1,2,3,4)$
indicates relevant parameters of the ith leg.
Analysis of single-leg structure.

Let the lengths of the four rods be represented by the variables
 $l_{1}, l_{2}, l_{3}$
and
 $l_{4}$
, with the stipulation that
 $l_{1}=l_{3}$
. The length of the robot body is denoted as
 $2l_{0}$
, the height of the centroid is denoted as
 $h_{0}$
, the length of the thigh is denoted as
 $l_{a}$
, and the length of the shank is denoted as
 $l_{b}$
. The relationships among these variables are articulated through the equations
 $l_{a}=l_{1}$
and
 $l_{b}=l_{4}-l_{2}$
. The forward kinematics mapping relationship from point A to point B can be derived as follows:
 \begin{equation} ^{A}_{B}{\boldsymbol{T}}{}=\left[\begin{array}{l} x\\ z\\ \theta \end{array}\right]=\left[\begin{array}{l} l_{b}c\theta _{0}-l_{a}c\left(\theta _{2}-\theta _{1}-\theta _{0}\right)+l_{0}c\left(\theta _{0}-\theta _{2}\right)-h_{0}s\left(\theta _{0}-\theta _{2}\right)\\[3pt] l_{b}s\theta _{0}+l_{a}s\left(\theta _{2}-\theta _{1}-\theta _{0}\right)+l_{0}s\left(\theta _{0}-\theta _{2}\right)+h_{0}c\left(\theta _{0}-\theta _{2}\right)\\[3pt] \theta _{0}-\theta _{2} \end{array}\right] \end{equation}
By taking the partial derivatives of the joint angles, the Jacobian matrix is obtained as follows:
 \begin{equation} ^{A}_{B}{\boldsymbol{J}}{}=\left[\begin{array}{l@{\quad}l@{\quad}l} \begin{array}{l} -l_{b}s\theta _{0}-l_{a}s\theta _{+2-1-0}-l_{0}s\theta _{+0-2}-h_{0}c\theta _{+0-2}\\[3pt] l_{b}c\theta _{0}-l_{a}c\theta _{+2-1-0}+l_{0}c\theta _{+0-2}-h_{0}s\theta _{+0-2}\\[3pt] 1 \end{array} & \begin{array}{l} -l_{a}s\theta _{+2-1-0}\\[3pt] -l_{a}c\theta _{+2-1-0}\\[3pt] 0 \end{array} & \begin{array}{l} l_{a}s\theta _{+2-1-0}+l_{0}s\theta _{+0-2}+h_{0}c\theta _{+0-2}\\[3pt] l_{a}c\theta _{+2-1-0}-l_{0}c\theta _{+0-2}+h_{0}s\theta _{+0-2}\\[3pt] -1 \end{array} \end{array}\right] \end{equation}
where
 $\theta _{+2-1-0}=\theta _{2}-\theta _{1}-\theta _{0}$
, and the same applies to other instances.
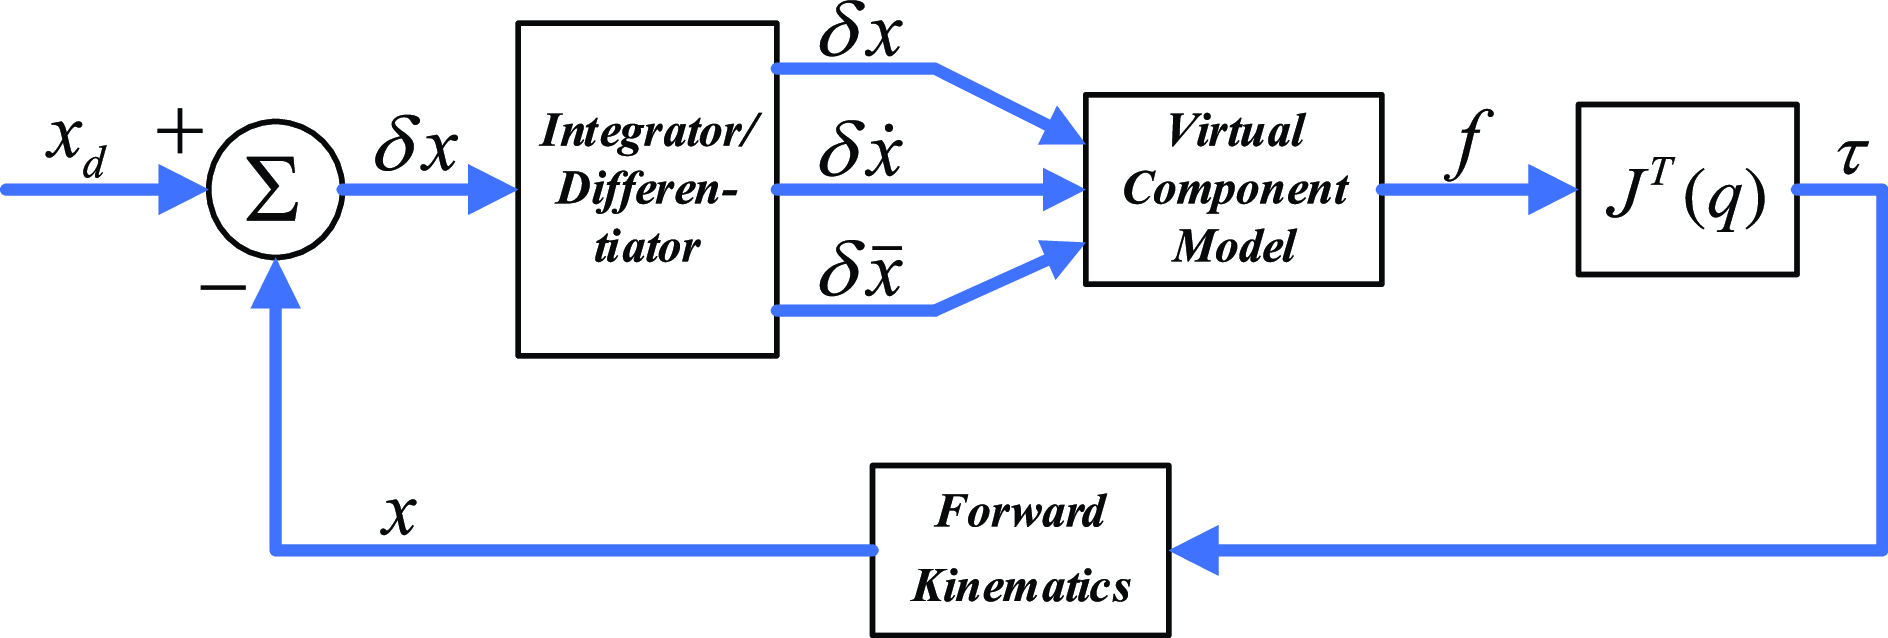
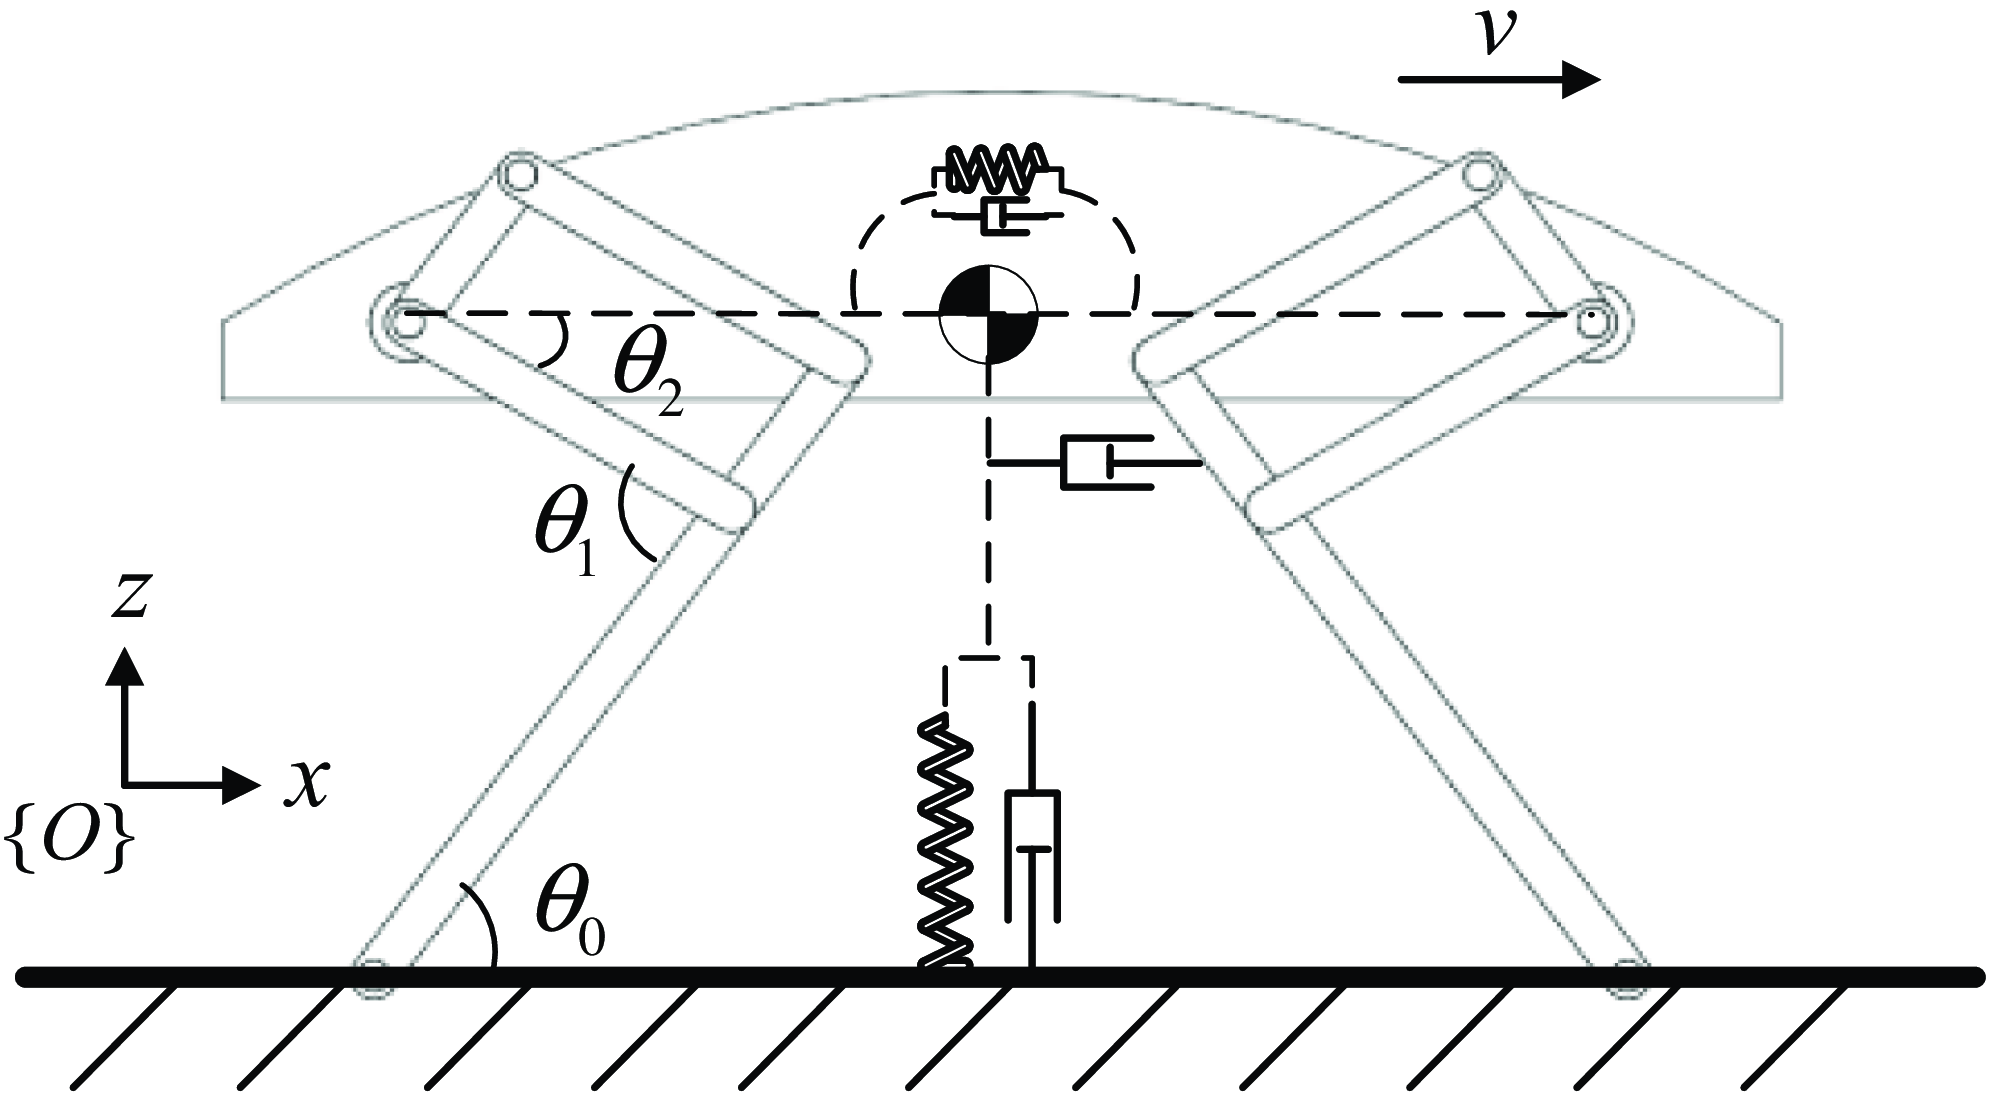
In practical applications, the establishment of an accurate dynamics model is challenging due to the frequent fluctuations in the robot’s motion state and the presence of various external environmental disturbances. As shown in Figure 4, the VMC algorithm ignores the dynamic factors of the robot and constructs a virtual component model. It establishes a correlation model between the control force exerted by the end-effector and the robot’s body utilizing the Jacobian matrix, thereby illustrating superior characteristics in force control. This method fully considers the generalized coordinates of the robot’s body and end-effector, effectively achieving control over the robot’s body motion state.
VMC algorithm framework.

3. Virtual model control
3.1 VMC model
The core idea of VMC is to analyze the main effective force based on the overall motion control objectives of the robot. This approach disregards the specific driving mechanisms of the robot and instead employs appropriate virtual mechanical components to produce an equivalent force, thereby yielding a virtual force. Utilizing the Jacobian matrix, this virtual force is subsequently transformed into actual driving torques, facilitating the simplification of the robot’s motion control model.
The motion control of a robotic system primarily encompasses the regulation of forward velocity along the X direction, the management of the centroid elevation along the Z direction, and the adjustment of the tilt angle about the centroid. Therefore, three sets of virtual component models are constructed accordingly to connect the external action points (environment) with the internal action points (robot body) to achieve control of the three DOFs. The principle structure is shown in Figure 5. The focus in the X direction is on velocity control, so only a virtual damping component is applied. However, accurate control of the centroid position is required for the centroid height in the Z direction and the tilt angle of the robot’s centroid, so both virtual spring and damping components are applied simultaneously.
The VMC principle structure.

Let the desired state of the robot be denoted as
 $\boldsymbol{X}_{\boldsymbol{d}}=[\begin{array}{lll} x_{d} & z_{d} & \theta _{d} \end{array}]^{T}$
and the current state as
 $\boldsymbol{X}=[\begin{array}{lll} x & z & \theta \end{array}]^{T}$
. The virtual forces and torques generated from the transition from the current state to the desired state are
 \begin{equation} \left[\begin{array}{l} F_{x}\\ F_{z}\\ M_{\theta } \end{array}\right]=\left[\begin{array}{l@{\quad}l@{\quad}l} K_{x} & & \\ & K_{z} & \\ & & K_{\theta } \end{array}\right]\left[\begin{array}{l} x_{d}-x\\ z_{d}-z\\ \theta _{d}-\theta \end{array}\right]+\left[\begin{array}{l@{\quad}l@{\quad}l} B_{x} & & \\ & B_{z} & \\ & & B_{\theta } \end{array}\right]\left[\begin{array}{l} \dot{x}_{d}-\dot{x}\\ \dot{z}_{d}-\dot{z}\\ \dot{\theta }_{d}-\dot{\theta } \end{array}\right] \end{equation}
where K x , K z , and K θ represent the virtual spring stiffness in the X, Z, and θ directions, respectively, while B x , B z , and B θ represent the virtual damping coefficients in the X, Z, and θ directions, respectively.
In the horizontal direction, only dampers exist, so
 $K_{x}=0$
. The directions of these virtual components are all referenced from the ground coordinate system (absolute coordinate system)
 $\{O\}$
.
The desired joint torque is denoted as
 $\boldsymbol{\tau }_{\boldsymbol{d}}=[\begin{array}{l@{\quad}l@{\quad}l} \tau _{0} & \tau _{1} & \tau _{2} \end{array}]^{T}$
. Since
 $\theta _{0}$
is a passive joint,
 $\tau _{0}=0$
.
Based on the formula
 $\boldsymbol{\tau }\boldsymbol{=}\boldsymbol{J}^{\boldsymbol{T}}\boldsymbol{F}$
, it yields
 \begin{align} &\left[\begin{array}{l} 0\\ \tau _{1}\\ \tau _{2} \end{array}\right]=\nonumber\\& \left[\begin{array}{l@{\quad}l@{\quad}l} -l_{b}s\theta _{0}-l_{a}s\theta _{+2-1-0}-l_{0}s\theta _{+0-2}-h_{0}c\theta _{+0-2}& -l_{a}s\theta _{+2-1-0}& l_{a}s\theta _{+2-1-0}+l_{0}s\theta _{+0-2}+h_{0}c\theta _{+0-2} \\[3pt] l_{b}c\theta _{0}-l_{a}c\theta _{+2-1-0}+l_{0}c\theta _{+0-2}-h_{0}s\theta _{+0-2}& -l_{a}c\theta _{+2-1-0}& l_{a}c\theta _{+2-1-0}-l_{0}c\theta _{+0-2}+h_{0}s\theta _{+0-2} \\[3pt] 1& 0& -1 \end{array}\right]\left[\begin{array}{l} F_{x}\\ F_{z}\\ M_{\theta } \end{array}\right] \end{align}
It can be derived from the above formula that
 \begin{equation} F_{x}=\frac{1}{l_{b}s\theta _{0}+l_{a}s\theta _{+2-1-0}+l_{0}s\theta _{+0-2}+h_{0}c\theta _{+0-2}}\left[\begin{array}{l@{\quad}l} l_{b}c\theta _{0}-l_{a}c\theta _{+2-1-0}+l_{0}c\theta _{+0-2}-h_{0}s\theta _{+0-2} & 1 \end{array}\right]\left[\begin{array}{l} F_{z}\\ M_{\theta } \end{array}\right] \end{equation}
Substituting into formula (4) yields
 \begin{equation} \left[\begin{array}{l} \tau _{1}\\[3pt] \tau _{2} \end{array}\right]=\left[\begin{array}{l@{\quad}l} \dfrac{l_{a}l_{0}s\theta _{1}-l_{a}h_{0}c\theta _{1}+l_{a}l_{b}s\theta _{+1-2}}{l_{b}s\theta _{0}+l_{a}s\theta _{+2-1-0}+l_{0}s\theta _{+0-2}+h_{0}c\theta _{+0-2}} & \dfrac{-l_{a}s\theta _{+2-1-0}}{l_{b}s\theta _{0}+l_{a}s\theta _{+2-1-0}+l_{0}s\theta _{+0-2}+h_{0}c\theta _{+0-2}}\\ -\dfrac{l_{b}l_{0}s\theta _{2}-l_{b}h_{0}c\theta _{2}+l_{b}l_{a}s\theta _{+1-2}}{l_{b}s\theta _{0}+l_{a}s\theta _{+2-1-0}+l_{0}s\theta _{+0-2}+h_{0}c\theta _{+0-2}} & \dfrac{-l_{b}s\theta _{0}}{l_{b}s\theta _{0}+l_{a}s\theta _{+2-1-0}+l_{0}s\theta _{+0-2}+h_{0}c\theta _{+0-2}} \end{array}\right]\left[\begin{array}{l} F_{z}\\ M_{\theta } \end{array}\right] \end{equation}
where
 $\theta _{0}=\theta +\theta _{1}$
.
The subscripts f and r represent the front and hind legs, respectively, while A f and A r represent the foot-end coordinate systems of the front and hind legs, respectively. The quadruped model can be regarded as the parallel connection of four single-leg models. By combining these single-leg models, it yields
 \begin{equation} \left[\begin{array}{l} \begin{array}{l} \tau _{lf}\\ \tau _{rf} \end{array}\\ \begin{array}{l} \tau _{lr}\\ \tau _{rr} \end{array} \end{array}\right]=\left[\begin{array}{l@{\quad}l@{\quad}l@{\quad}l} ^{A_{lf}}_{\,\,B}{J}{_{}^{T}} & & & \\ & ^{A_{rf}}_{\,\,B}{J}{_{}^{T}} & & \\ & & ^{A_{lr}}_{\,\,B}{J}{_{}^{T}} & \\ & & & ^{A_{rr}}_{\,\,B}{J}{_{}^{T}} \end{array}\right]\left[\begin{array}{l} F_{lf}\\ F_{rf}\\ F_{lr}\\ F_{rr} \end{array}\right] \end{equation}
3.2 Decomposed VMC model
In the global VMC, the overall virtual force
 $F_{all}$
acting on the robot’s body is considered as the final effective force. Consequently, within the developed quadruped model,
 $F_{all}$
is utilized to substitute the vector
 $[\begin{array}{l@{\quad}l@{\quad}l@{\quad}l} F_{lf} & F_{rf} & F_{lr} & F_{rr} \end{array}]^{T}$
in formula (7), yielding an
 $8\times 3$
Jacobian-like matrix. This matrix facilitates the formulation of a mathematical relationship between the total virtual force and the driving joint torques associated with each leg. The resolution of this relationship necessitates operations involving an
 $8\times 8$
matrix, thereby complicating the computational process. To address this complexity, the literature [Reference Xie, Ahmadi, Shang and Luo34] introduces a decomposed VMC methodology, which segments the overarching control objective into distinct components for each leg based on specific principles. For each leg, corresponding models are developed for both the stance and swing phases. Through the coordinated control of each leg, the comprehensive control objective is ultimately realized.
The motion of the robot body primarily involves traction force in the X direction, support force in the Z direction, and the tilting angle
 $\theta$
around the center of mass. By analyzing the motion objectives along the X, Z, and
 $\theta$
directions, it becomes clear that the desired movements of the robot’s body in these directions can be effectively attained through the precise regulation of force exerted by each leg in the X and Z directions.
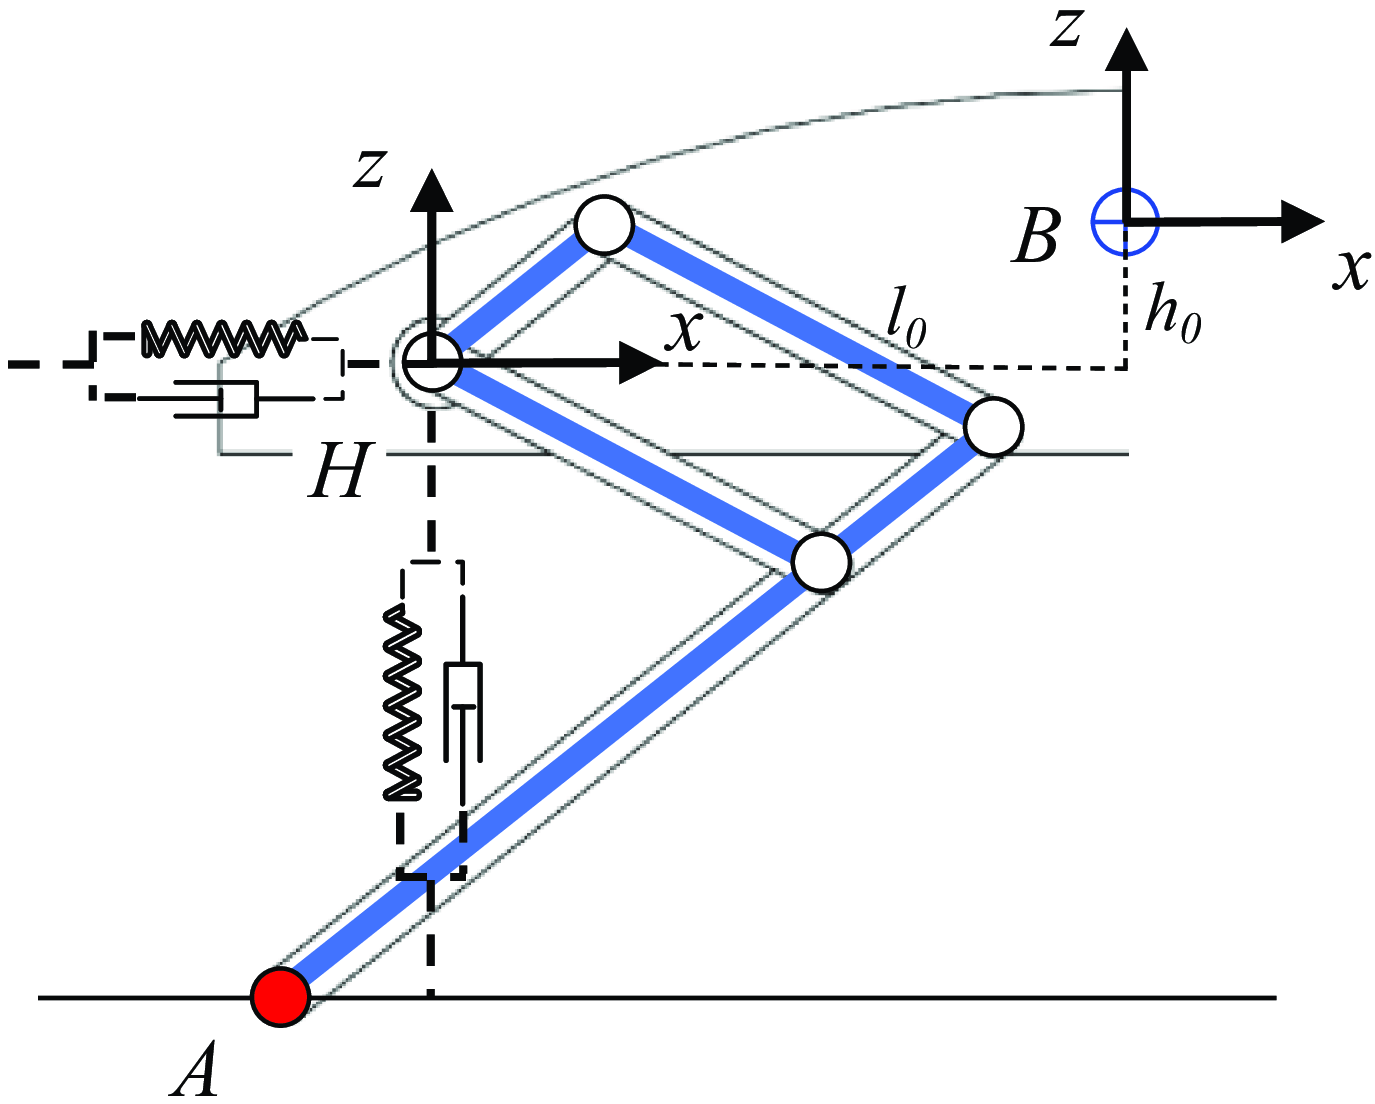
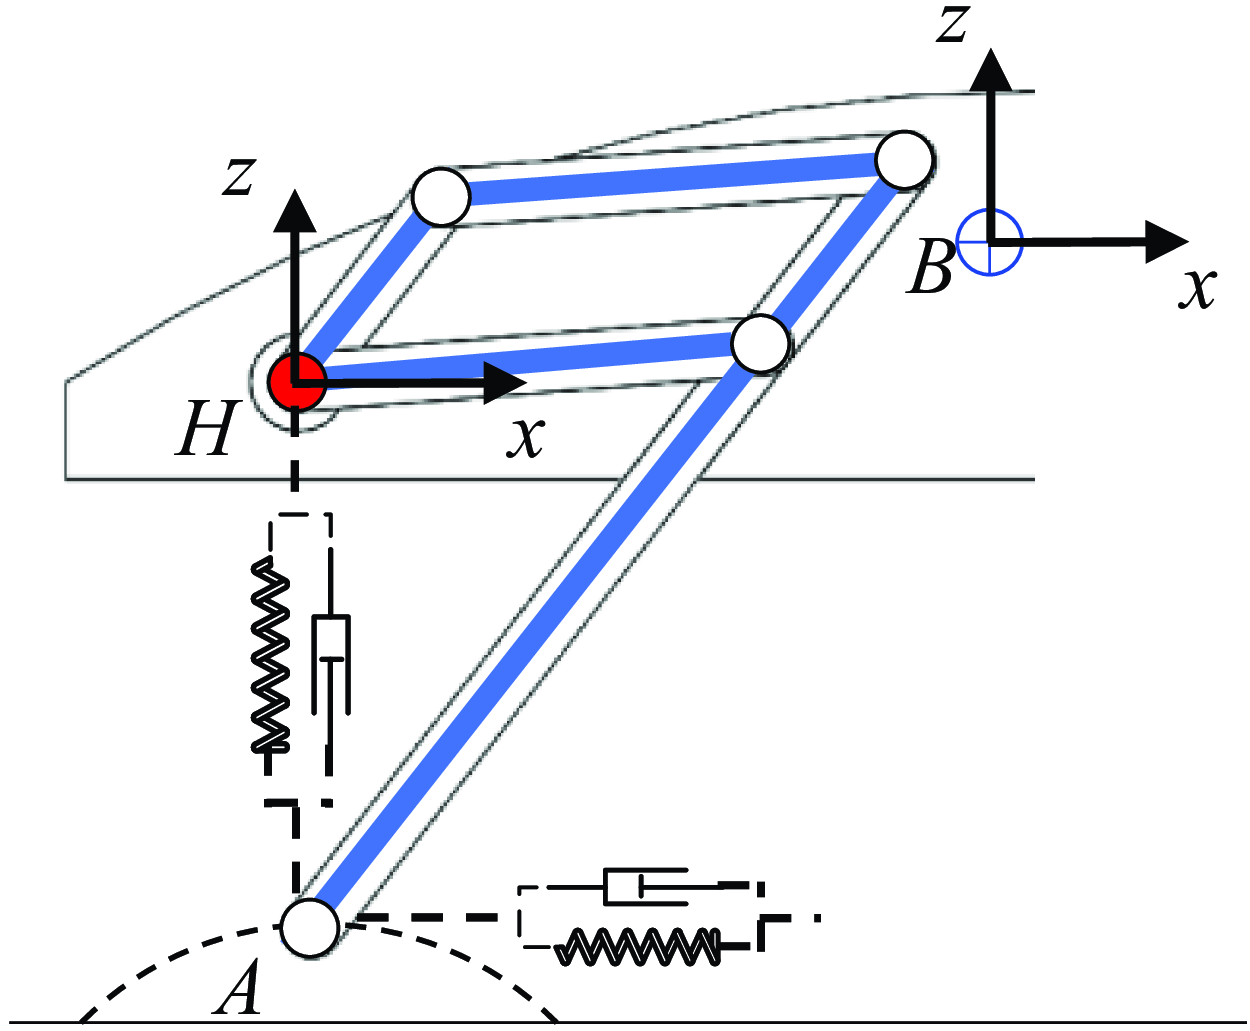
Therefore, under the stance phase and the swing phase, corresponding virtual component models are constructed as shown in Figures 6 and 7. During the stance phase, the motion state of the body is controlled primarily through the interaction between the foot-end and the ground. The foot-end A is the external action point, and the hip H is the internal action point. Therefore, two sets of virtual spring-damping components in the X and Z directions are constructed at H. During the swing phase, the position of the foot-end is controlled mainly through the active joint torque of the hip. The hip H is the external action point, and the foot-end A is the internal action point. Therefore, two sets of virtual spring-damping components in the X and Z directions are constructed at A.
Stance phase VMC.

Swing phase VMC.

3.2.1 Stance phase
After decomposing the virtual forces required for the robot’s motion, the virtual forces applied by each individual leg to the hip joint are obtained as
 \begin{equation} \boldsymbol{f}=\left[\begin{array}{l} f_{x}\\ f_{z} \end{array}\right]=\left[\begin{array}{l@{\quad}l} k_{x} & \\ & k_{z} \end{array}\right]\left[\begin{array}{l} x_{d}-x\\ z_{d}-z \end{array}\right]+\left[\begin{array}{l@{\quad}l} b_{x} & \\ & b_{z} \end{array}\right]\left[\begin{array}{l} \dot{x}_{d}-\dot{x}\\ \dot{z}_{d}-\dot{z} \end{array}\right] \end{equation}
where
 $k_{x}, k_{z}, b_{x}$
and
 $b_{z}$
represent control gains (parameters of the virtual component);
 $x_{d}, z_{d}, \dot{x}_{d}$
and
 $\dot{z}_{d}$
represent the desired position and motion velocities of the robot platform.
To ensure motion stability, it is necessary to avoid fluctuations in the height of the robot body, thus setting
 $\dot{z}_{d}=0$
.
 $z$
and
 $\dot{z}$
represent the real-time position and velocity of the foot-end relative to the hip coordinate system
 $\{H\}$
in the Z direction. x and
 $\dot{x}$
represent the displacement and measured velocity of the robot in the X direction. These values are derived from forward kinematics model.
The forward kinematics model of the foot-end relative to the hip coordinate system
 $\{H\}$
is
 \begin{equation} \left[\begin{array}{l} x\\ z \end{array}\right]=\left[\begin{array}{l} l_{a}\cos \theta _{1}-l_{b}\cos \theta _{2}\\ l_{a}\sin \theta _{1}-l_{b}\sin \theta _{2} \end{array}\right] \end{equation}
By taking the partial derivatives of the joint angles, the Jacobian matrix is obtained as
 \begin{equation} _{A}^{H}{\boldsymbol{J}}{}=\left[\begin{array}{l@{\quad}l} -l_{a}s\theta _{1} & l_{b}s\theta _{2}\\ l_{a}c\theta _{1} & -l_{b}c\theta _{2} \end{array}\right] \end{equation}
When a force is applied at the foot-end, the hip coordinate system serves as the reaction coordinate system. During the stance phase of the leg, a virtual force f needs to be applied at the hip. Consequently, applying f at the foot-end, the following can be derived:
 \begin{equation} \boldsymbol{\tau }=\boldsymbol{-}_{P}^{H}{\boldsymbol{J}}{_{}^{T}}\boldsymbol{f} \end{equation}
Expanding formula (11) yields
 \begin{equation} \left[\begin{array}{l} \tau _{1}\\ \tau _{2} \end{array}\right]=-\left[\begin{array}{l@{\quad}l} -l_{a}s\theta _{1} & l_{a}c\theta _{1}\\ l_{b}s\theta _{2} & -l_{b}c\theta _{2} \end{array}\right]\left(\left[\begin{array}{l@{\quad}l} k_{x} & \\ & k_{z} \end{array}\right]\left[\begin{array}{l} x_{d}-x\\ z_{d}-z \end{array}\right]+\left[\begin{array}{l@{\quad}l} b_{x} & \\ & b_{z} \end{array}\right]\left[\begin{array}{l} \dot{x}_{d}-\dot{x}\\ \dot{z}_{d}-\dot{z} \end{array}\right]\right) \end{equation}
3.2.2 Swing phase
The motion of the foot-end can be decomposed into two sets of spring-damper components along the X direction and Z direction of the hip coordinate system. The virtual force applied at the foot-end can be expressed as
 \begin{equation} \boldsymbol{f}\boldsymbol{'}=\left[\begin{array}{l} f_{x}'\\ f_{z}' \end{array}\right]=\left[\begin{array}{l@{\quad}l} k_{x}' & \\ & k_{z}' \end{array}\right]\left[\begin{array}{l} x_{d}-x\\ z_{d}-z \end{array}\right]+\left[\begin{array}{l@{\quad}l} b_{x}' & \\ & b_{z}' \end{array}\right]\left[\begin{array}{l} 0-\dot{x}\\ 0-\dot{z} \end{array}\right] \end{equation}
In the application of VMC, there are no predetermined constraints regarding the trajectory of the foot’s swing. The primary requirement is that the trajectory must fulfill the control objectives associated with the swing phase, specifically reaching the designated target position within the specified timeframe and elevating the leg sufficiently to avoid ground obstacles.
The virtual force is converted into joint torques through the single-leg Jacobian matrix, as
 \begin{equation} \boldsymbol{\tau }\boldsymbol{'}=^{H}_{P}{\boldsymbol{J}}{_{}^{T}}\boldsymbol{f}\boldsymbol{'} \end{equation}
Expanding formula (14) yields
 \begin{equation} \left[\begin{array}{l} \tau _{1}'\\ \tau _{2}' \end{array}\right]=\left[\begin{array}{l@{\quad}l} -l_{a}s\theta _{1} & l_{a}c\theta _{1}\\ l_{b}s\theta _{2} & -l_{b}c\theta _{2} \end{array}\right]\left(\left[\begin{array}{l@{\quad}l} k_{x}' & \\ & k_{z}' \end{array}\right]\left[\begin{array}{l} x_{d}-x\\ z_{d}-z \end{array}\right]+\left[\begin{array}{l@{\quad}l} b_{x}' & \\ & b_{z}' \end{array}\right]\left[\begin{array}{l} 0-\dot{x}\\ 0-\dot{z} \end{array}\right]\right) \end{equation}
Observing the established decomposed VMC models for the stance phase and swing phase, it becomes evident that the overall control effectiveness of these models is contingent upon the virtual parameter matrices K and B. In conventional VMC algorithms, the values assigned to the parameters within the K and B matrices are typically derived through empirical trial-and-error approaches. Once these values are established, they remain static and are not subject to modification. However, during the execution of motion, various factors, including alterations in the motion state and variations in terrain conditions, can significantly influence the performance of the controller. The rigidity of these parameters consequently limits the adaptability and robustness of the controller, making it challenging to ensure optimal control outcomes. To mitigate this limitation, this paper proposes the integration of a BPNN to facilitate the adaptive adjustment of the parameters within the K and B matrices. This approach aims to enhance the adaptive capabilities of the controller, thereby improving both the control accuracy and dynamic performance of the VMC controller across diverse motion conditions.
4. BP-VMC system
4.1 BP neural network
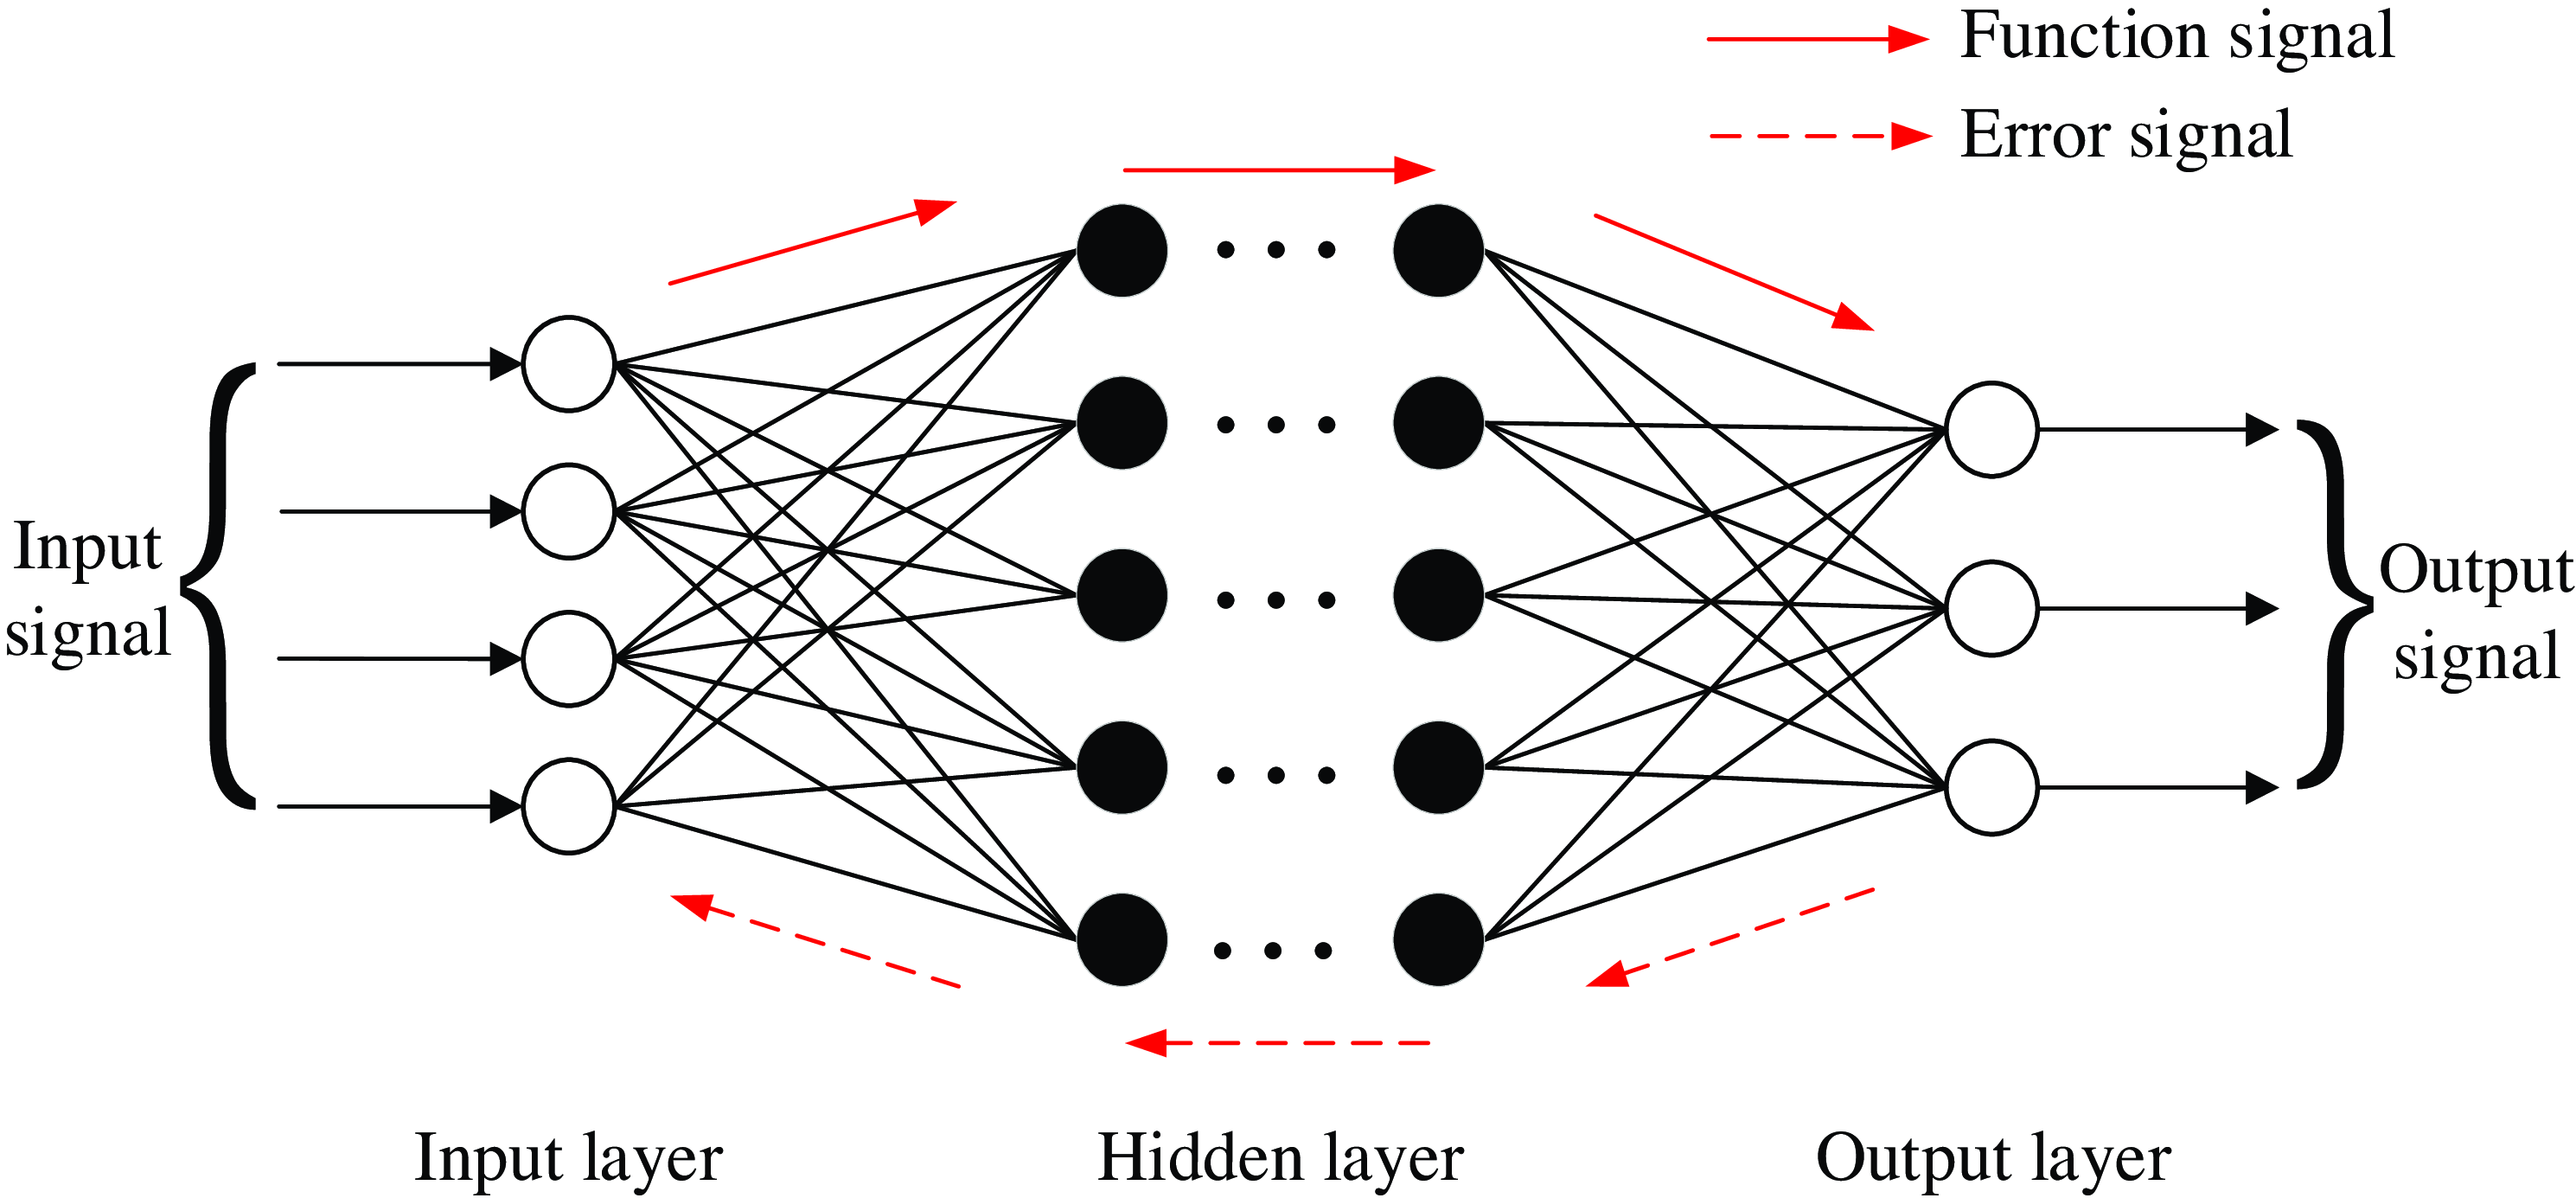
The BPNN [Reference Bhaskar, Manish and Nandi35], as illustrated in Figure 8, comprises an input layer, one or more hidden layers, and an output layer. Each neuron within the network is interconnected with all neurons in the preceding layer. The process of signal transmission occurs in two primary phases: forward propagation and backward propagation. During forward propagation, function signals traverse through the layers until they arrive at the output layer, where the output value is determined based on the synaptic weights that exist between the neurons. An error signal is produced by evaluating the discrepancy between the network’s output value and the intended output value. This error signal is subsequently propagated backward through the layers until it reaches the input layer. By modifying the weight matrices between each layer, the network aims to minimize the error, progressively aligning with the training objective.
Structure of BP neural network.

4.1.1 Transmission and calculation of signals
The input and output of the BPNN’s input layer in this paper are
 \begin{equation} \left\{ \begin{array}{l} \boldsymbol{I}_{\boldsymbol{i}}^{\boldsymbol{0}}(\boldsymbol{n})=\boldsymbol{x}_{\boldsymbol{i}}(\boldsymbol{n})\\ \boldsymbol{O}_{\boldsymbol{i}}^{\boldsymbol{0}}(\boldsymbol{n})=\boldsymbol{I}_{\boldsymbol{i}}^{\boldsymbol{0}}(\boldsymbol{n}) \end{array}\right. \begin{array}{l@{\quad}l} & i=1,2,\cdots, M \end{array} \end{equation}
where the superscript represents the network layer corresponding to the signal, with 0, 1, and 2 referring to the input layer, hidden layer, and output layer, respectively. The subscript i denotes the node number in the input layer, and M represents the total number of nodes in the input layer.
The input variables for the VMC controller are
 \begin{equation} \begin{array}{l} \boldsymbol{x}_{\boldsymbol{1}}=\boldsymbol{e}(\boldsymbol{n})\\ \boldsymbol{x}_{\boldsymbol{2}}=\boldsymbol{e}(\boldsymbol{n})\boldsymbol{-}\boldsymbol{e}(\boldsymbol{n}\boldsymbol{-}\boldsymbol{1}) \end{array} \end{equation}
where e(n) represents the control system error
 \begin{equation} \boldsymbol{e}(\boldsymbol{n})=\boldsymbol{x}_{\boldsymbol{in}}(\boldsymbol{n})-\boldsymbol{y}_{\boldsymbol{out}}(\boldsymbol{n}) \end{equation}
The induced local field and output of the hidden layer in the neural network are, respectively
 \begin{equation} \left\{\begin{array}{l} \boldsymbol{I}_{\boldsymbol{j}}^{\boldsymbol{1}}=\sum _{i=0}^{M}\boldsymbol{O}_{\boldsymbol{i}}^{\boldsymbol{0}}(\boldsymbol{n})\boldsymbol{w}_{\boldsymbol{ij}}^{\boldsymbol{1}}(\boldsymbol{n})\\ \boldsymbol{O}_{\boldsymbol{j}}^{\boldsymbol{1}}=\boldsymbol{h}(\boldsymbol{I}_{\boldsymbol{j}}^{\boldsymbol{1}}) \end{array}\right.\begin{array}{l@{\quad}l} & j=1,2,\cdots, Q \end{array} \end{equation}
where
 $\boldsymbol{w}_{\boldsymbol{ij}}^{\boldsymbol{1}}$
represents the synaptic weights of the hidden neurons and Q is the number of nodes in the hidden layer. The activation function for the hidden neurons is chosen as the hyperbolic tangent function.
 \begin{equation} h\left(x\right)=\frac{e^{x}-e^{-x}}{e^{x}+e^{-x}} \end{equation}
The induced local field and output of the output layer in the neural network are, respectively
 \begin{equation} \left\{\begin{array}{l} \boldsymbol{I}_{\boldsymbol{l}}^{\boldsymbol{2}}=\sum _{j=0}^{Q}\boldsymbol{O}_{\boldsymbol{j}}^{\boldsymbol{1}}(\boldsymbol{n})\boldsymbol{w}_{\boldsymbol{jl}}^{\boldsymbol{2}}(\boldsymbol{n})\\ \boldsymbol{O}_{\boldsymbol{l}}^{\boldsymbol{2}}=\boldsymbol{g}(\boldsymbol{I}_{\boldsymbol{l}}^{\boldsymbol{2}}) \end{array}\right.\begin{array}{l@{\quad}l} & l=1,2,\cdots, T \end{array} \end{equation}
where
 $\boldsymbol{w}_{\boldsymbol{jl}}^{\boldsymbol{2}}$
represents the synaptic weights of the output neurons and T is the number of nodes in the output layer. The output of each node in the output layer corresponds to the target training parameter. Since the parameter values
K
and
B
in this paper are non-negative, the activation function of the output layer is chosen as a non-negative sigmoid function.
 \begin{equation} g\left(x\right)=\frac{e^{x}}{e^{x}+e^{-x}} \end{equation}
Simultaneously, due to the output range of the activation function being [0, 1], the weight matrix P for the VMC parameters is defined and incorporated into the control law of the VMC controller, resulting in
 \begin{equation} \boldsymbol{u}(\boldsymbol{n})=\sum _{l=1}^{T}\boldsymbol{P}_{\boldsymbol{l}}\boldsymbol{O}_{\boldsymbol{l}}^{\boldsymbol{2}}(\boldsymbol{n})\boldsymbol{x}_{\boldsymbol{l}}(\boldsymbol{n}) \end{equation}
Substitute into the quadruped robot model to obtain the final output value.
 \begin{equation} \boldsymbol{y}_{\boldsymbol{out}}(\boldsymbol{n})=\boldsymbol{F}_{\boldsymbol{VMC}}\left(\boldsymbol{u}(\boldsymbol{n})\right) \end{equation}
4.1.2 Neural network training algorithm
Using the BP learning algorithm, the synaptic weights of the neural network are iteratively corrected. The cost function of the system is defined as
 \begin{equation} \boldsymbol{\varepsilon }(\boldsymbol{n})=\frac{1}{2}\boldsymbol{e}^{\boldsymbol{2}}(\boldsymbol{n})=\frac{1}{2}\left(\boldsymbol{x}_{\boldsymbol{in}}(\boldsymbol{n})-\boldsymbol{y}_{\boldsymbol{out}}(\boldsymbol{n})\right)^{2} \end{equation}
To adjust the synaptic weights of the network according to the gradient descent method, the adjustment is performed by searching in the direction of the negative gradient of the synaptic weight coefficients with respect to
 $\boldsymbol{\varepsilon }\boldsymbol{(}\boldsymbol{n}\boldsymbol{)}$
, and an inertia term is added to enable faster convergence of the search. It yields
 \begin{equation} \boldsymbol{\Delta }\boldsymbol{w}_{\boldsymbol{jl}}^{\boldsymbol{2}}(\boldsymbol{n})=-\eta \frac{\partial \boldsymbol{\varepsilon }(\boldsymbol{n})}{\partial \boldsymbol{w}_{\boldsymbol{jl}}^{\boldsymbol{2}}(\boldsymbol{n})}+\alpha \boldsymbol{\Delta }\boldsymbol{w}_{\boldsymbol{jl}}^{\boldsymbol{2}}(\boldsymbol{n}\boldsymbol{-}\boldsymbol{1})=\eta \boldsymbol{\delta }_{\boldsymbol{l}}^{\boldsymbol{2}}(\boldsymbol{n})\boldsymbol{O}_{\boldsymbol{j}}^{\boldsymbol{1}}(\boldsymbol{n})+\alpha \boldsymbol{\Delta }\boldsymbol{w}_{\boldsymbol{jl}}^{\boldsymbol{2}}(\boldsymbol{n}\boldsymbol{-}\boldsymbol{1}) \end{equation}
where
 $\eta$
is learning rate and
 $\alpha$
is momentum factor.
According to the chain rule of differentiation, the local gradient
 $\boldsymbol{\delta }_{\boldsymbol{l}}^{\boldsymbol{2}}\boldsymbol{(}\boldsymbol{n}\boldsymbol{)}$
can be expressed as
 \begin{equation} \boldsymbol{\delta }_{\boldsymbol{l}}^{\boldsymbol{2}}(\boldsymbol{n})=-\frac{\partial \boldsymbol{\varepsilon }(\boldsymbol{n})}{\partial \boldsymbol{I}_{\boldsymbol{l}}^{\boldsymbol{2}}(\boldsymbol{n})}=-\frac{\partial \boldsymbol{\varepsilon }(\boldsymbol{n})}{\partial \boldsymbol{y}_{\boldsymbol{out}}(\boldsymbol{n})}\frac{\partial \boldsymbol{y}_{\boldsymbol{out}}(\boldsymbol{n})}{\partial \boldsymbol{u}(\boldsymbol{n})}\frac{\partial \boldsymbol{u}(\boldsymbol{n})}{\partial \boldsymbol{O}_{\boldsymbol{l}}^{\boldsymbol{2}}(\boldsymbol{n})}\frac{\partial \boldsymbol{O}_{\boldsymbol{l}}^{\boldsymbol{2}}(\boldsymbol{n})}{\partial \boldsymbol{I}_{\boldsymbol{l}}^{\boldsymbol{2}}(\boldsymbol{n})} \end{equation}
As shown in formula (24),
 $\frac{\partial \boldsymbol{y}_{\boldsymbol{out}}(\boldsymbol{n})}{\partial \boldsymbol{u}(\boldsymbol{n})}$
is associated with the specific model of the control system. If accurately calculated during each iteration of optimization, it will significantly increase the computational complexity and potentially affect the response speed of the controller. Therefore,
 $\frac{\partial \boldsymbol{y}_{\boldsymbol{out}}(\boldsymbol{n})}{\partial \boldsymbol{u}(\boldsymbol{n})}$
is approximated as a sign function
 $\mathrm{sgn}\left(\frac{\partial \boldsymbol{y}_{\boldsymbol{out}}(\boldsymbol{n})}{\partial \boldsymbol{u}(\boldsymbol{n})}\right)$
, and the errors resulting from this simplified calculation can be compensated for by adjusting the learning rate appropriately.
Substituting formulas (21) and (23) into (27), it yields
 \begin{equation} \boldsymbol{\delta }_{\boldsymbol{l}}^{\boldsymbol{2}}(\boldsymbol{n})=\boldsymbol{e}(\boldsymbol{n})\mathrm{sgn}\left(\frac{\partial \boldsymbol{y}_{\boldsymbol{out}}(\boldsymbol{n})}{\partial \boldsymbol{u}(\boldsymbol{n})}\right)\boldsymbol{x}_{\boldsymbol{l}}(\boldsymbol{n})\boldsymbol{g}\boldsymbol{'}\left(\boldsymbol{I}_{\boldsymbol{l}}^{\boldsymbol{2}}(\boldsymbol{n})\right) \end{equation}
Therefore, the synaptic weight adjustment formula for the neurons in the output layer of the network is
 \begin{equation} \boldsymbol{\Delta }\boldsymbol{w}_{\boldsymbol{jl}}^{\boldsymbol{2}}(\boldsymbol{n})=\eta \boldsymbol{\delta }_{\boldsymbol{l}}^{\boldsymbol{2}}(\boldsymbol{n})\boldsymbol{O}_{\boldsymbol{j}}^{\boldsymbol{1}}(\boldsymbol{n})+\alpha \boldsymbol{\Delta }\boldsymbol{w}_{\boldsymbol{jl}}^{\boldsymbol{2}}(\boldsymbol{n}\boldsymbol{-}\boldsymbol{1}) \end{equation}
Similarly, the synaptic weight adjustment formula for the neurons in the hidden layer is
 \begin{equation} \boldsymbol{\Delta }\boldsymbol{w}_{\boldsymbol{ij}}^{\boldsymbol{1}}(\boldsymbol{n})=\eta \boldsymbol{\delta }_{\boldsymbol{j}}^{\boldsymbol{1}}(\boldsymbol{n})\boldsymbol{O}_{\boldsymbol{i}}^{\boldsymbol{0}}(\boldsymbol{n})+\alpha \boldsymbol{\Delta }\boldsymbol{w}_{\boldsymbol{ij}}^{\boldsymbol{1}}(\boldsymbol{n}\boldsymbol{-}\boldsymbol{1}) \end{equation}
where
 $\boldsymbol{\delta }_{\boldsymbol{j}}^{\boldsymbol{1}}\boldsymbol{(}\boldsymbol{n}\boldsymbol{)}$
represents the local gradient for the neurons in the hidden layer, as
 \begin{equation} \boldsymbol{\delta }_{\boldsymbol{j}}^{\boldsymbol{1}}(\boldsymbol{n})=\boldsymbol{h}\boldsymbol{'}\left(\boldsymbol{I}_{\boldsymbol{j}}^{\boldsymbol{1}}(\boldsymbol{n})\right)\sum _{l=1}^{T}\boldsymbol{\delta }_{\boldsymbol{l}}^{\boldsymbol{2}}(\boldsymbol{n})\boldsymbol{\Delta }\boldsymbol{w}_{\boldsymbol{jl}}^{\boldsymbol{2}}(\boldsymbol{n}) \end{equation}
4.1.3 BPNN structure parameters
As indicated in Sections 4.1.1 and 4.1.2, the performance of the BPNN is notably influenced by the number of hidden layers and neurons utilized. The VMC control system of the quadruped robot, where the BPNN is applied in this paper, is a complex continuous system with multiple inputs and multiple outputs. To achieve optimal real-time performance of the control system during operation, it is imperative that the BPNN not only provides effective function approximation but also minimizes structural complexity and improves learning efficiency.
Robert Hecht-Nielsen has proven that any continuous function within a closed interval can be approximated by a BP network with one hidden layer [Reference Robert36]. Consequently, the number of hidden layers is selected as 1.
The quantity of hidden neurons influences the performance of the neural network in terms of fitting. Having too few neurons may cause “underfitting,” whereas having too many can lead to “overfitting” and a higher computational burden [Reference Basheer and Hajmeer37]. In this paper, the BPNN is designed with four input nodes (comprising three input variables and one bias) and two output nodes (representing the output values). To reduce the likelihood of “overfitting,” the guideline for choosing the number of hidden neurons is to keep it below twice the size of the input layer. After thorough analysis and simulation, the final decision is made to set the number of hidden neurons at 5.
Therefore, the final BPNN structure is established as “4 × 5 × 2.”
4.2. BP-VMC controller structure
Neural networks represent a category of machine learning techniques that emulate the operational principles of biological neural systems, demonstrating capabilities for self-learning, self-organization, and adaptability. In the context of control systems, these networks facilitate adaptive control for complex systems characterized by uncertainties, significant nonlinearities, temporal variations, and delays.
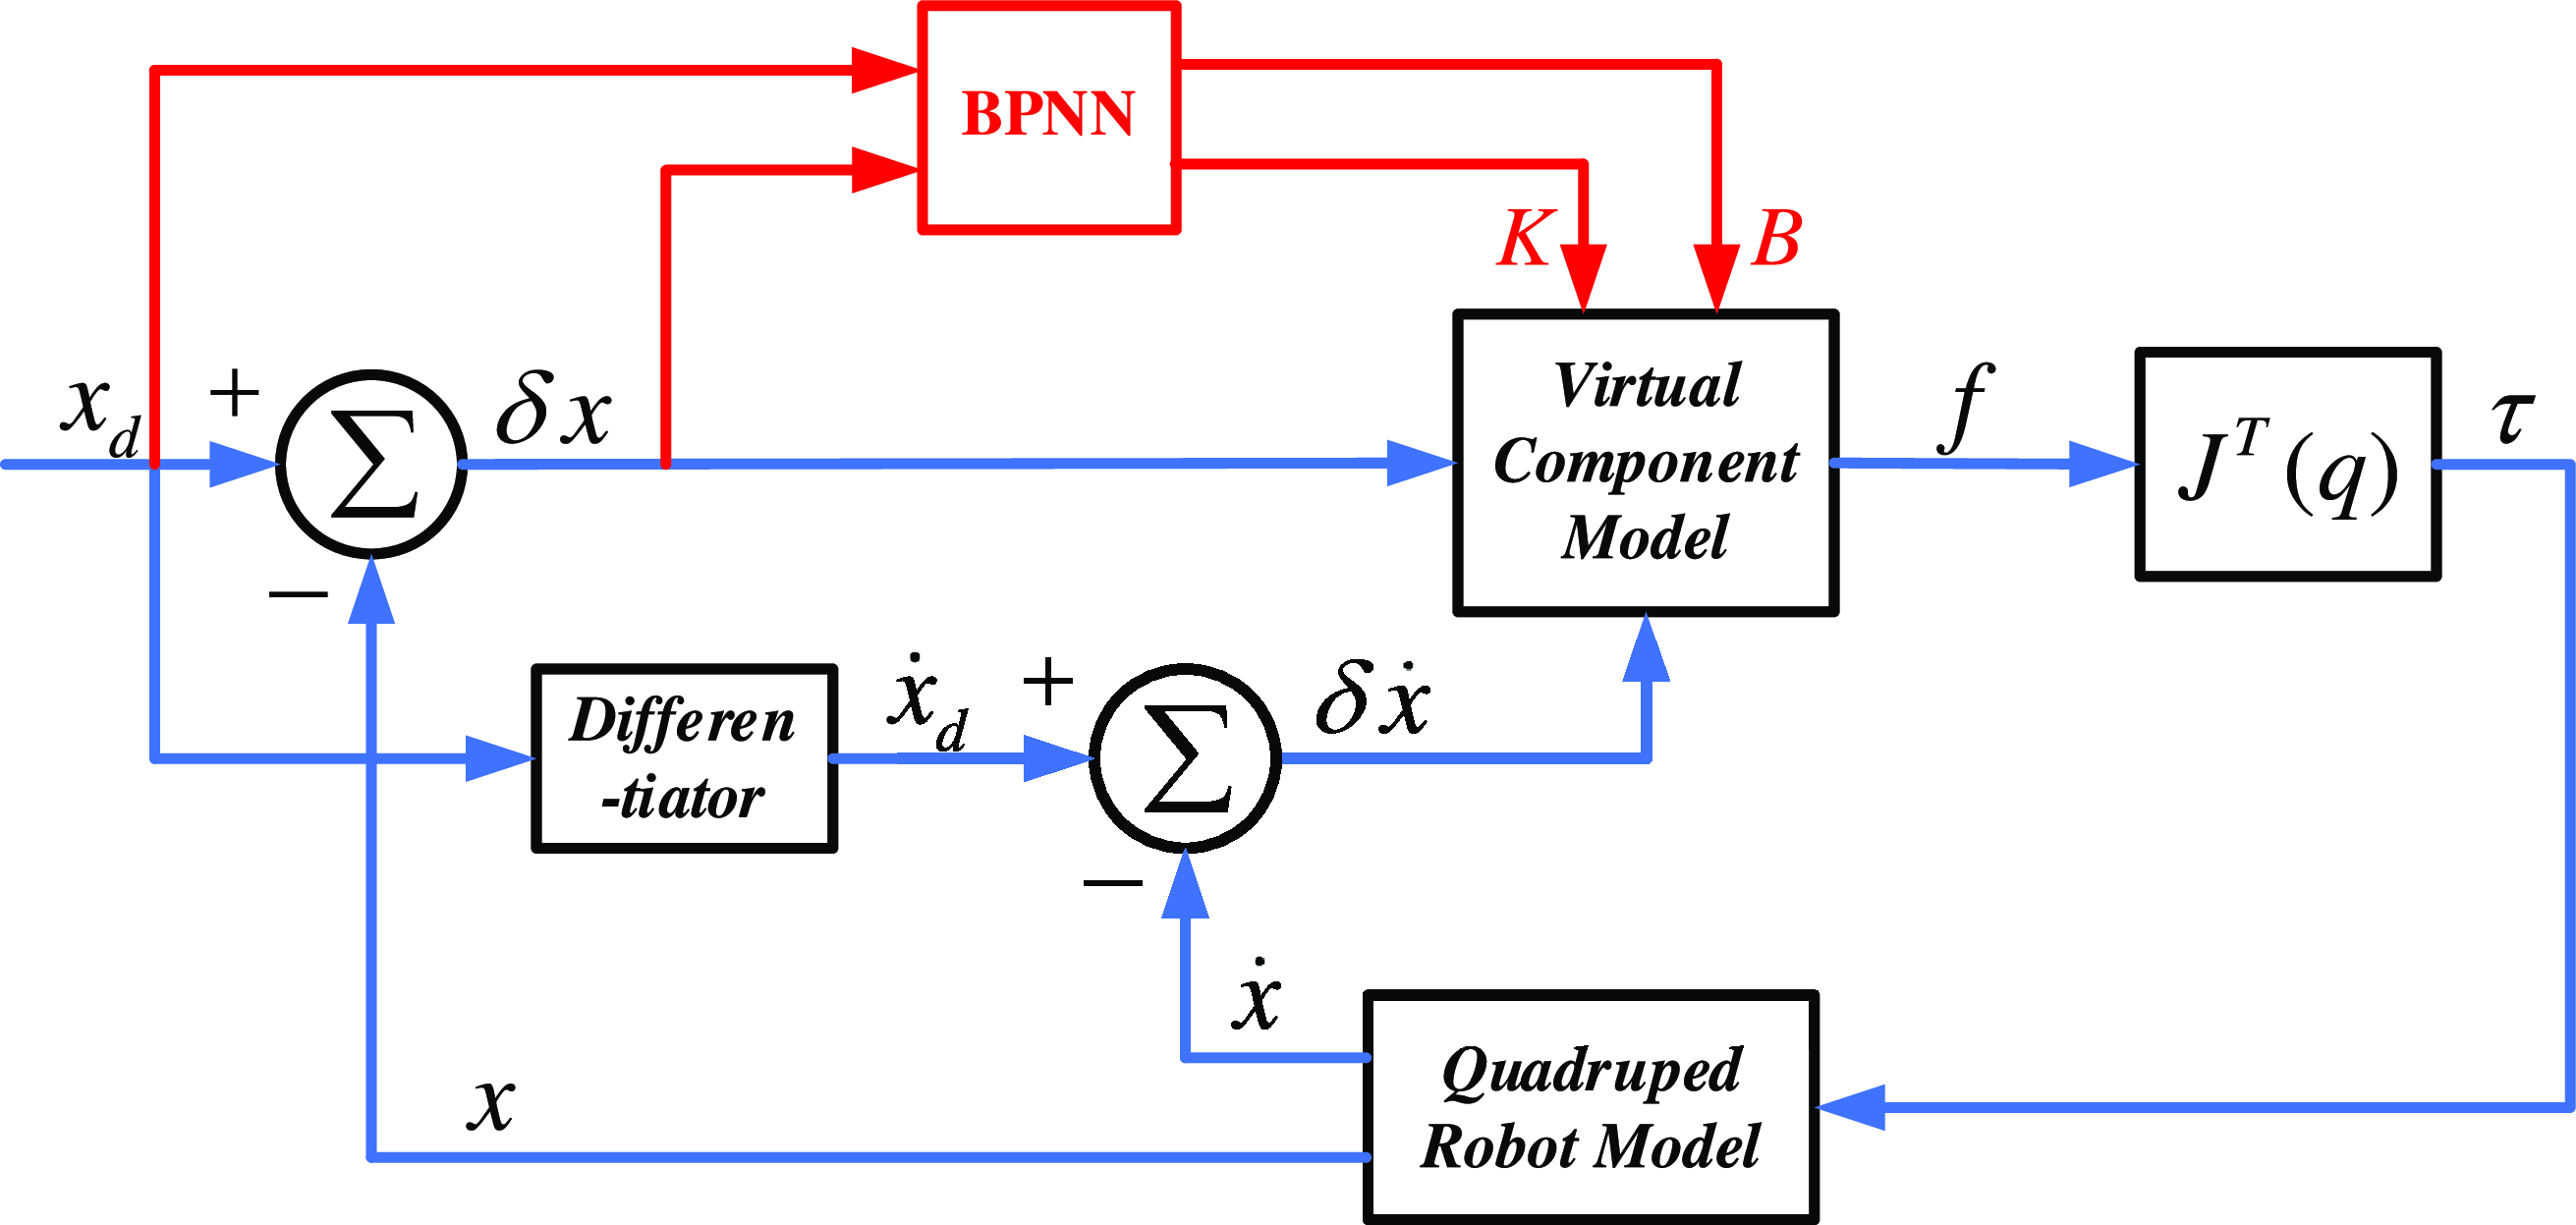
Since the essence of the VMC algorithm is to adjust the control input based on the error between the desired state and the actual state. Similarly, the BPNN employs error signals to inform the adjustment of weights and biases within neuron nodes, utilizing the backward propagation of these error signals to minimize output error. Therefore, combining VMC with BPNN and training the virtual parameter matrices K and B through the backpropagation algorithm enables adaptive adjustment of the VMC controller, allowing it to accommodate various systems and environments. The schematic diagram of the BP-VMC control system proposed in this paper is shown in Figure 9.
Schematic diagram of BP-VMC control principle.

The control law of the BP-VMC controller can be expressed as
 \begin{equation} \begin{array}{l} \boldsymbol{\tau }=\boldsymbol{J}^{\boldsymbol{T}}\boldsymbol{f}=\boldsymbol{J}^{\boldsymbol{T}}\left(\boldsymbol{K}(\boldsymbol{n})\boldsymbol{\delta }\boldsymbol{x}\boldsymbol{+}\boldsymbol{B}(\boldsymbol{n})\boldsymbol{\delta }\dot{\boldsymbol{x}}\right)\\ \left[\begin{array}{l} \boldsymbol{K}(\boldsymbol{n})\\ \boldsymbol{B}(\boldsymbol{n}) \end{array}\right]=\boldsymbol{BPNN}\left(\boldsymbol{x}_{\boldsymbol{d}}\boldsymbol{,}\boldsymbol{\delta }\boldsymbol{x}\right) \end{array} \end{equation}
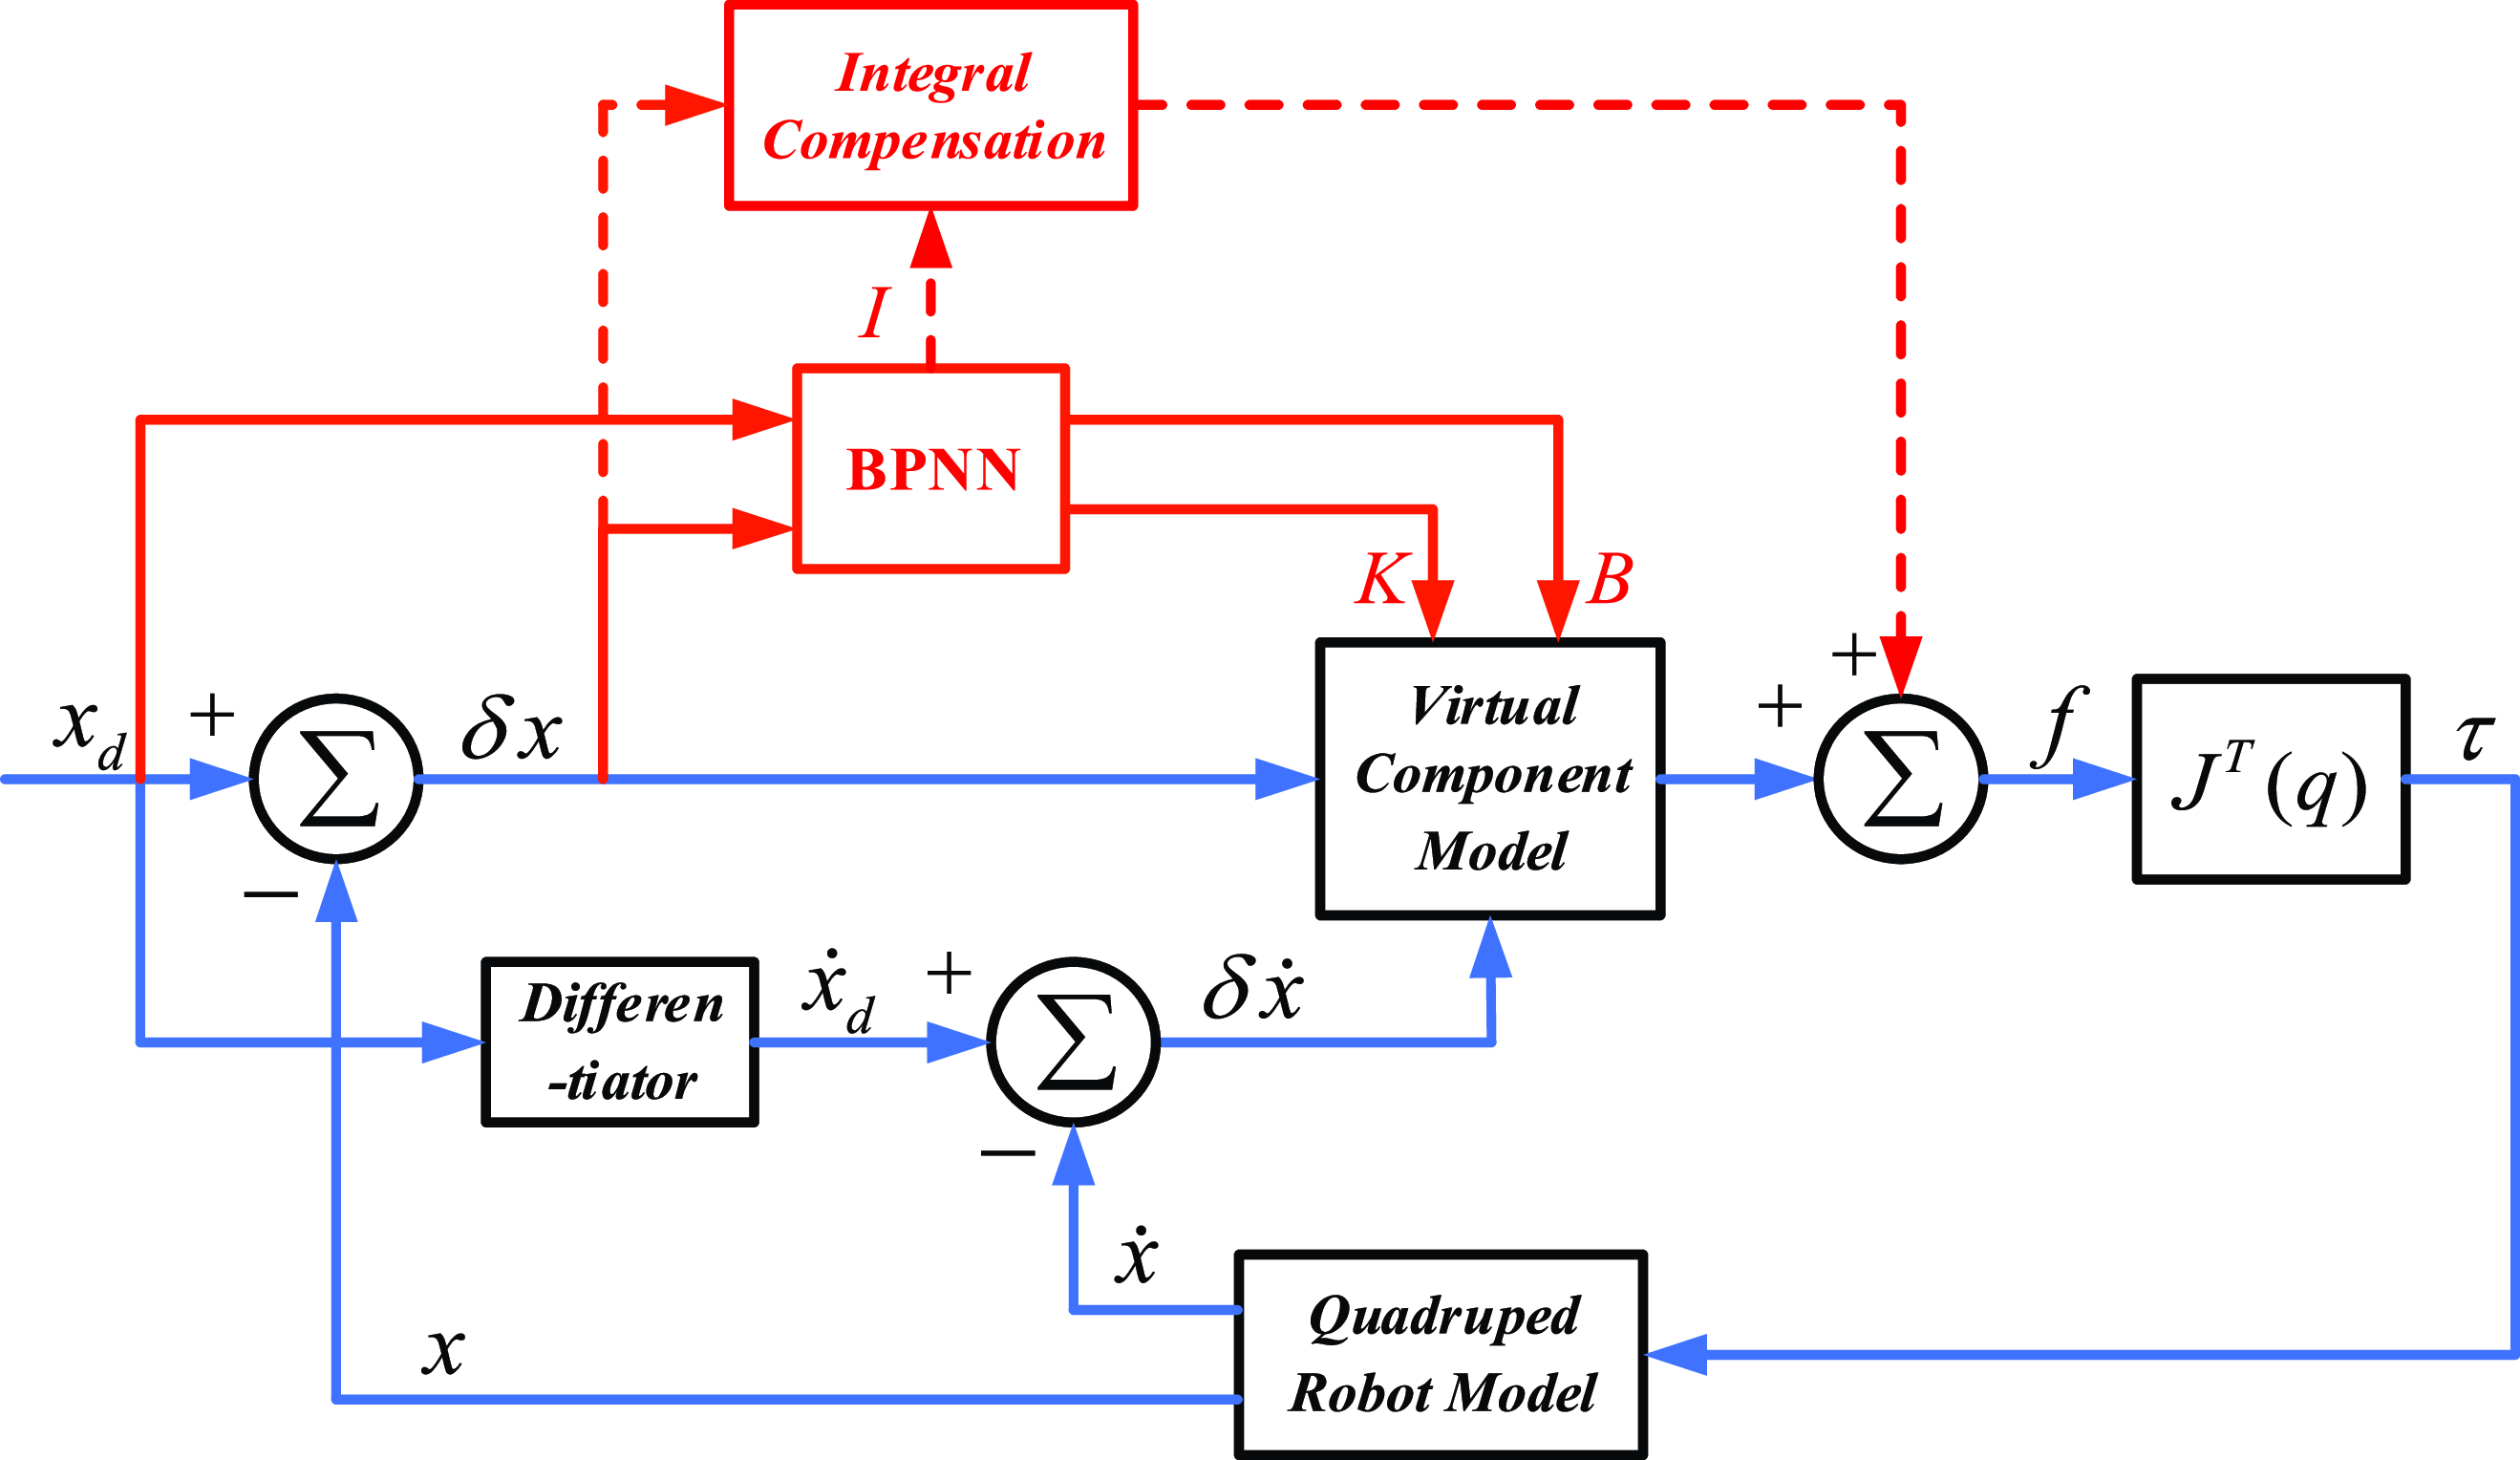
During the development of the motion controller, the inherent mass characteristics of the robot are often neglected, leading to notable deviations in z-axis height control. A thorough analysis of the control law reveals that the VMC resembles to a PD controller, posing challenges in mitigating these deviations. To address this issue, the integration of an error compensation term into the z-axis controller is proposed to counterbalance the robot’s self-weight. However, given the variations in compensation requirements caused by differing motion states and external disturbances, the integral compensation (IC) method is adopted. This methodology accumulates errors and adjusts the control output accordingly, thereby eliminating steady-state errors and enhancing the precision of motion control. Additionally, the integral coefficient within the integral compensator can be autonomously tuned using the BPNN, negating the need for manual parameter adjustments. Therefore, based on the block diagram in Figure 9, the BP-VMC control block diagram with IC is obtained as shown in Figure 10.
Schematic diagram of BP-VMC with IC.

The control law of the BP-VMC with IC controller is
 \begin{equation} \begin{array}{l} \boldsymbol{\tau }\boldsymbol{=}\boldsymbol{J}^{\boldsymbol{T}}\boldsymbol{f}\boldsymbol{=}\boldsymbol{J}^{\boldsymbol{T}}\left(\boldsymbol{K}(\boldsymbol{n})\boldsymbol{\delta }\boldsymbol{x}\boldsymbol{+}\boldsymbol{B}(\boldsymbol{n})\boldsymbol{\delta }\dot{\boldsymbol{x}}\boldsymbol{+}\boldsymbol{I}(\boldsymbol{n})\int \boldsymbol{\delta }\boldsymbol{xdt}\right)\\ \left[\begin{array}{l} \boldsymbol{K}(\boldsymbol{n})\\ \boldsymbol{B}(\boldsymbol{n})\\ \boldsymbol{I}(\boldsymbol{n}) \end{array}\right]\boldsymbol{=}\boldsymbol{BPNN}\left(\boldsymbol{x}_{\boldsymbol{d}}\boldsymbol{,}\boldsymbol{\delta }\boldsymbol{x}\right) \end{array} \end{equation}
5. BP-VMC controller scheme
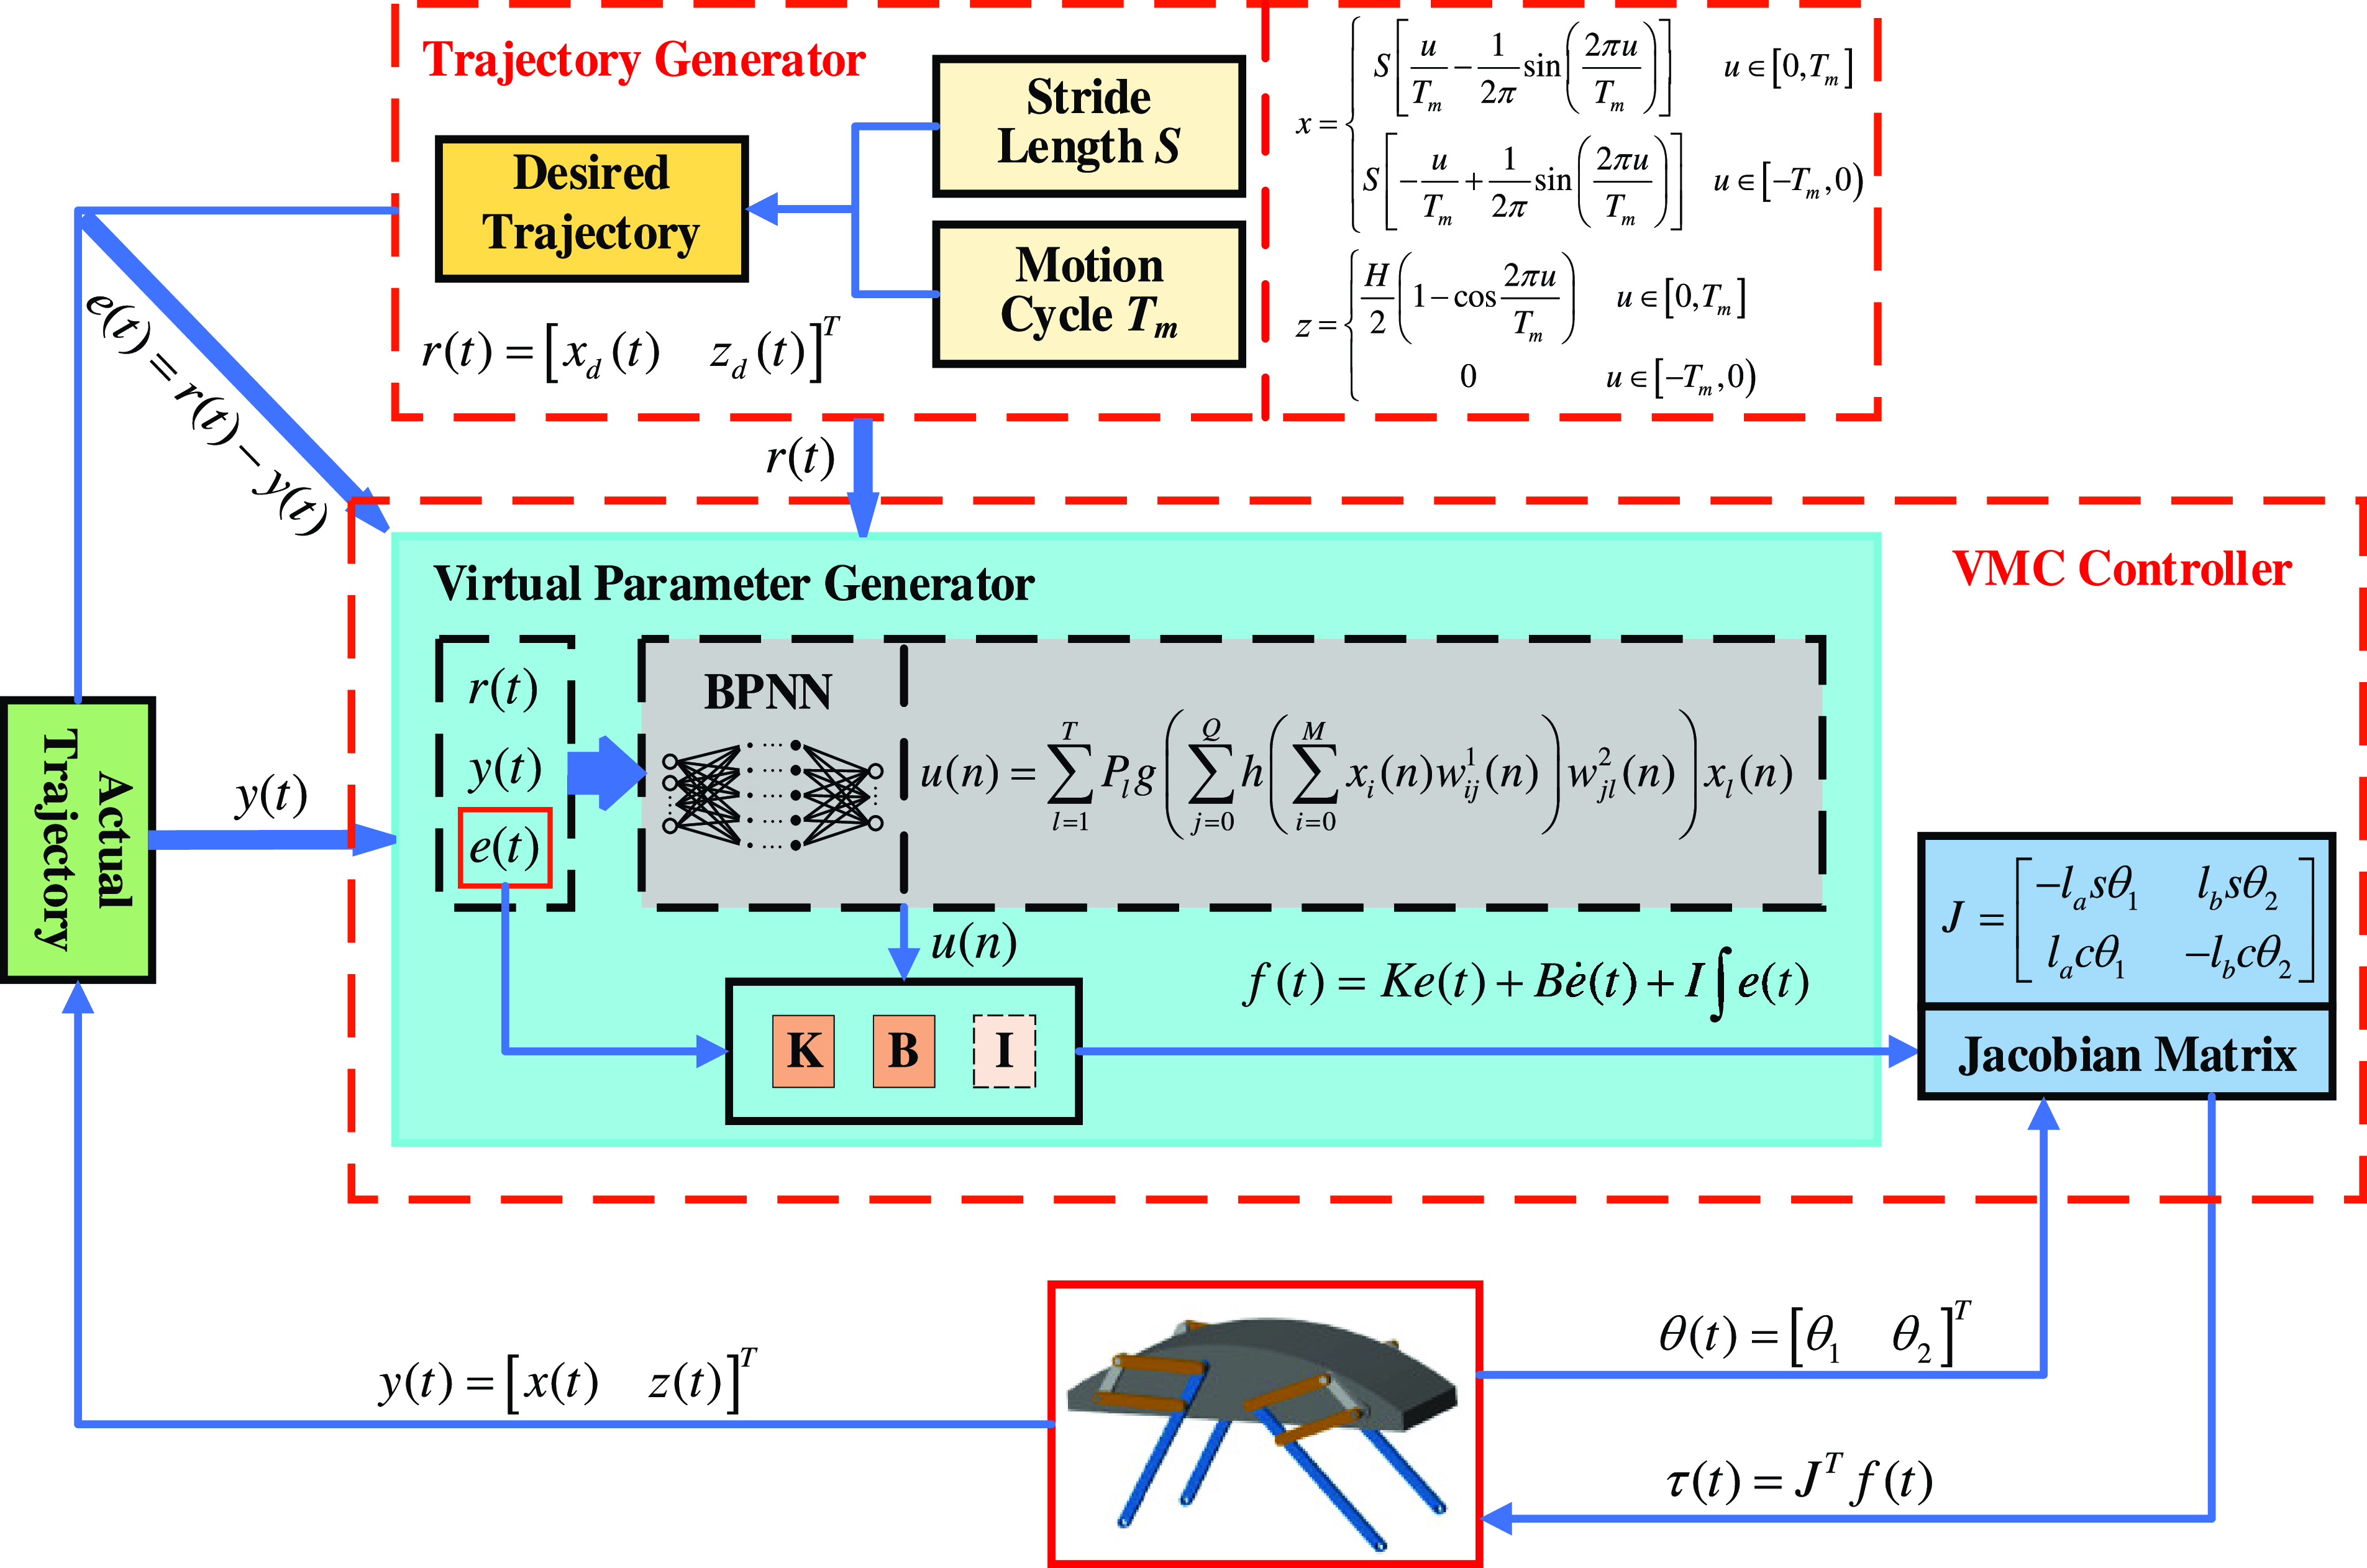
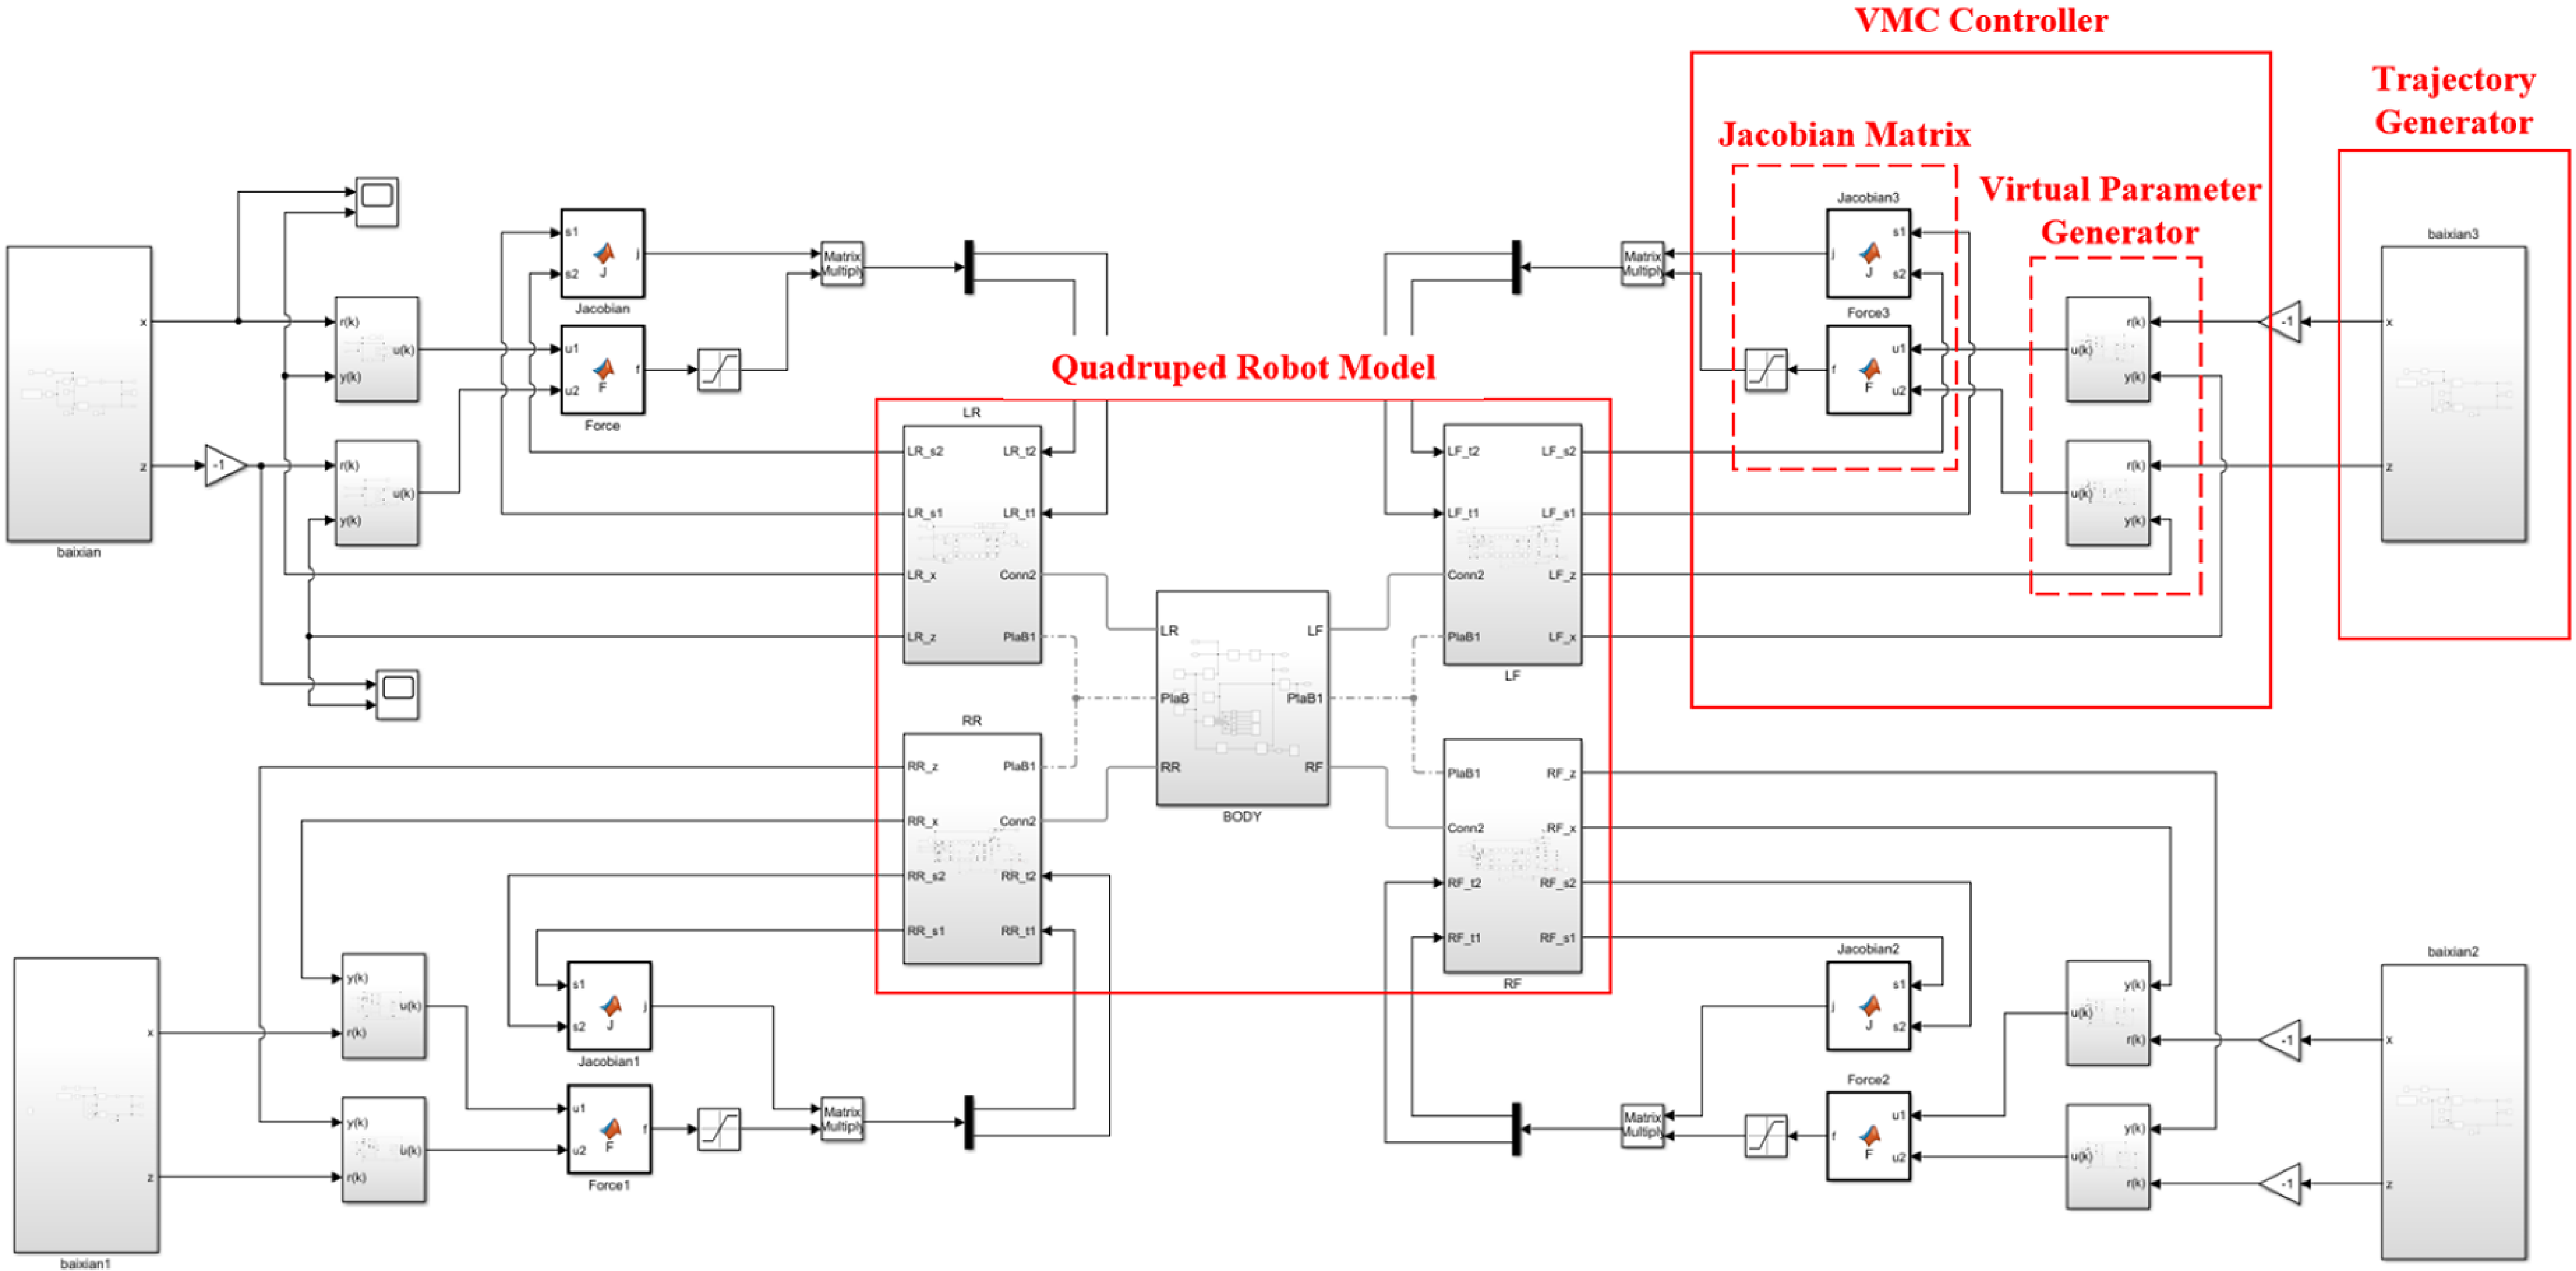
The quadruped robot controller scheme is shown in Figure 11, which mainly includes a trajectory generator, VMC controller, and quadruped robot model. Initially, the trajectory generator generates the desired trajectory curve based on the preset velocity and periodicity conditions, outputting the corresponding desired position of the foot-end in real time. Subsequently, the actual current position of the foot-end obtained from the quadruped robot model is compared with the desired position of the foot-end, and the resulting error signal is transmitted to the virtual parameter generator. In the virtual parameter generator, the BPNN modifies and optimizes the virtual parameters based on the error signal and calculates the corresponding virtual force to be passed to the Jacobian matrix. Ultimately, the Jacobian matrix combines the driving joint angle signal obtained from the quadruped robot model and the received virtual force signal to calculate the corresponding joint driving torque, which drives the quadruped robot model to achieve the corresponding movement, resulting in a new foot-end position signal. This new signal is then compared with the desired foot-end position to obtain a new error signal, initiating the next control cycle.
BP-VMC controller scheme.

The trajectory generator generates corresponding foot trajectory curves based on the desired velocity and motion cycle, guiding the quadruped robot to move according to the desired motion state. The velocity of the quadruped robot is closely related to its gait cycle and stride length. Therefore, controlling the stride length and stride frequency of the quadruped robot in the direction of travel can achieve the purpose of velocity control. As a result, the trajectory planning formulas for the trot gait at the foot-ends are shown in formulas (34) and (35).
 \begin{equation} x=\left\{\begin{array}{l@{\quad}l} S\left[\frac{u}{T_{m}}-\frac{1}{2\pi }\sin \left(\frac{2\pi u}{T_{m}}\right)\right] & u\in \left[0,T_{m}\right]\\ S\left[-\frac{u}{T_{m}}+\frac{1}{2\pi }\sin \left(\frac{2\pi u}{T_{m}}\right)\right] & u\in \left[-T_{m},0\right) \end{array}\right. \end{equation}
 \begin{equation} z=\left\{\begin{array}{l@{\quad}l} \frac{H}{2}\left(1-\cos \frac{2\pi u}{T_{m}}\right) & u\in \left[0,T_{m}\right]\\ 0 & u\in \left[-T_{m},0\right) \end{array}\right. \end{equation}
where
 $T_{m}$
represents the swing phase period, and in the trot gait,
 $T_{m}=1/2T$
. u is the given periodic time signal,
 $u\in [-T_{m},T_{m}]$
. The stride length S is determined by the tracking velocity,
 $S=v_{xd}T_{m}$
. H represents the desired leg lift height, usually
 $H=\textit{constant}$
.
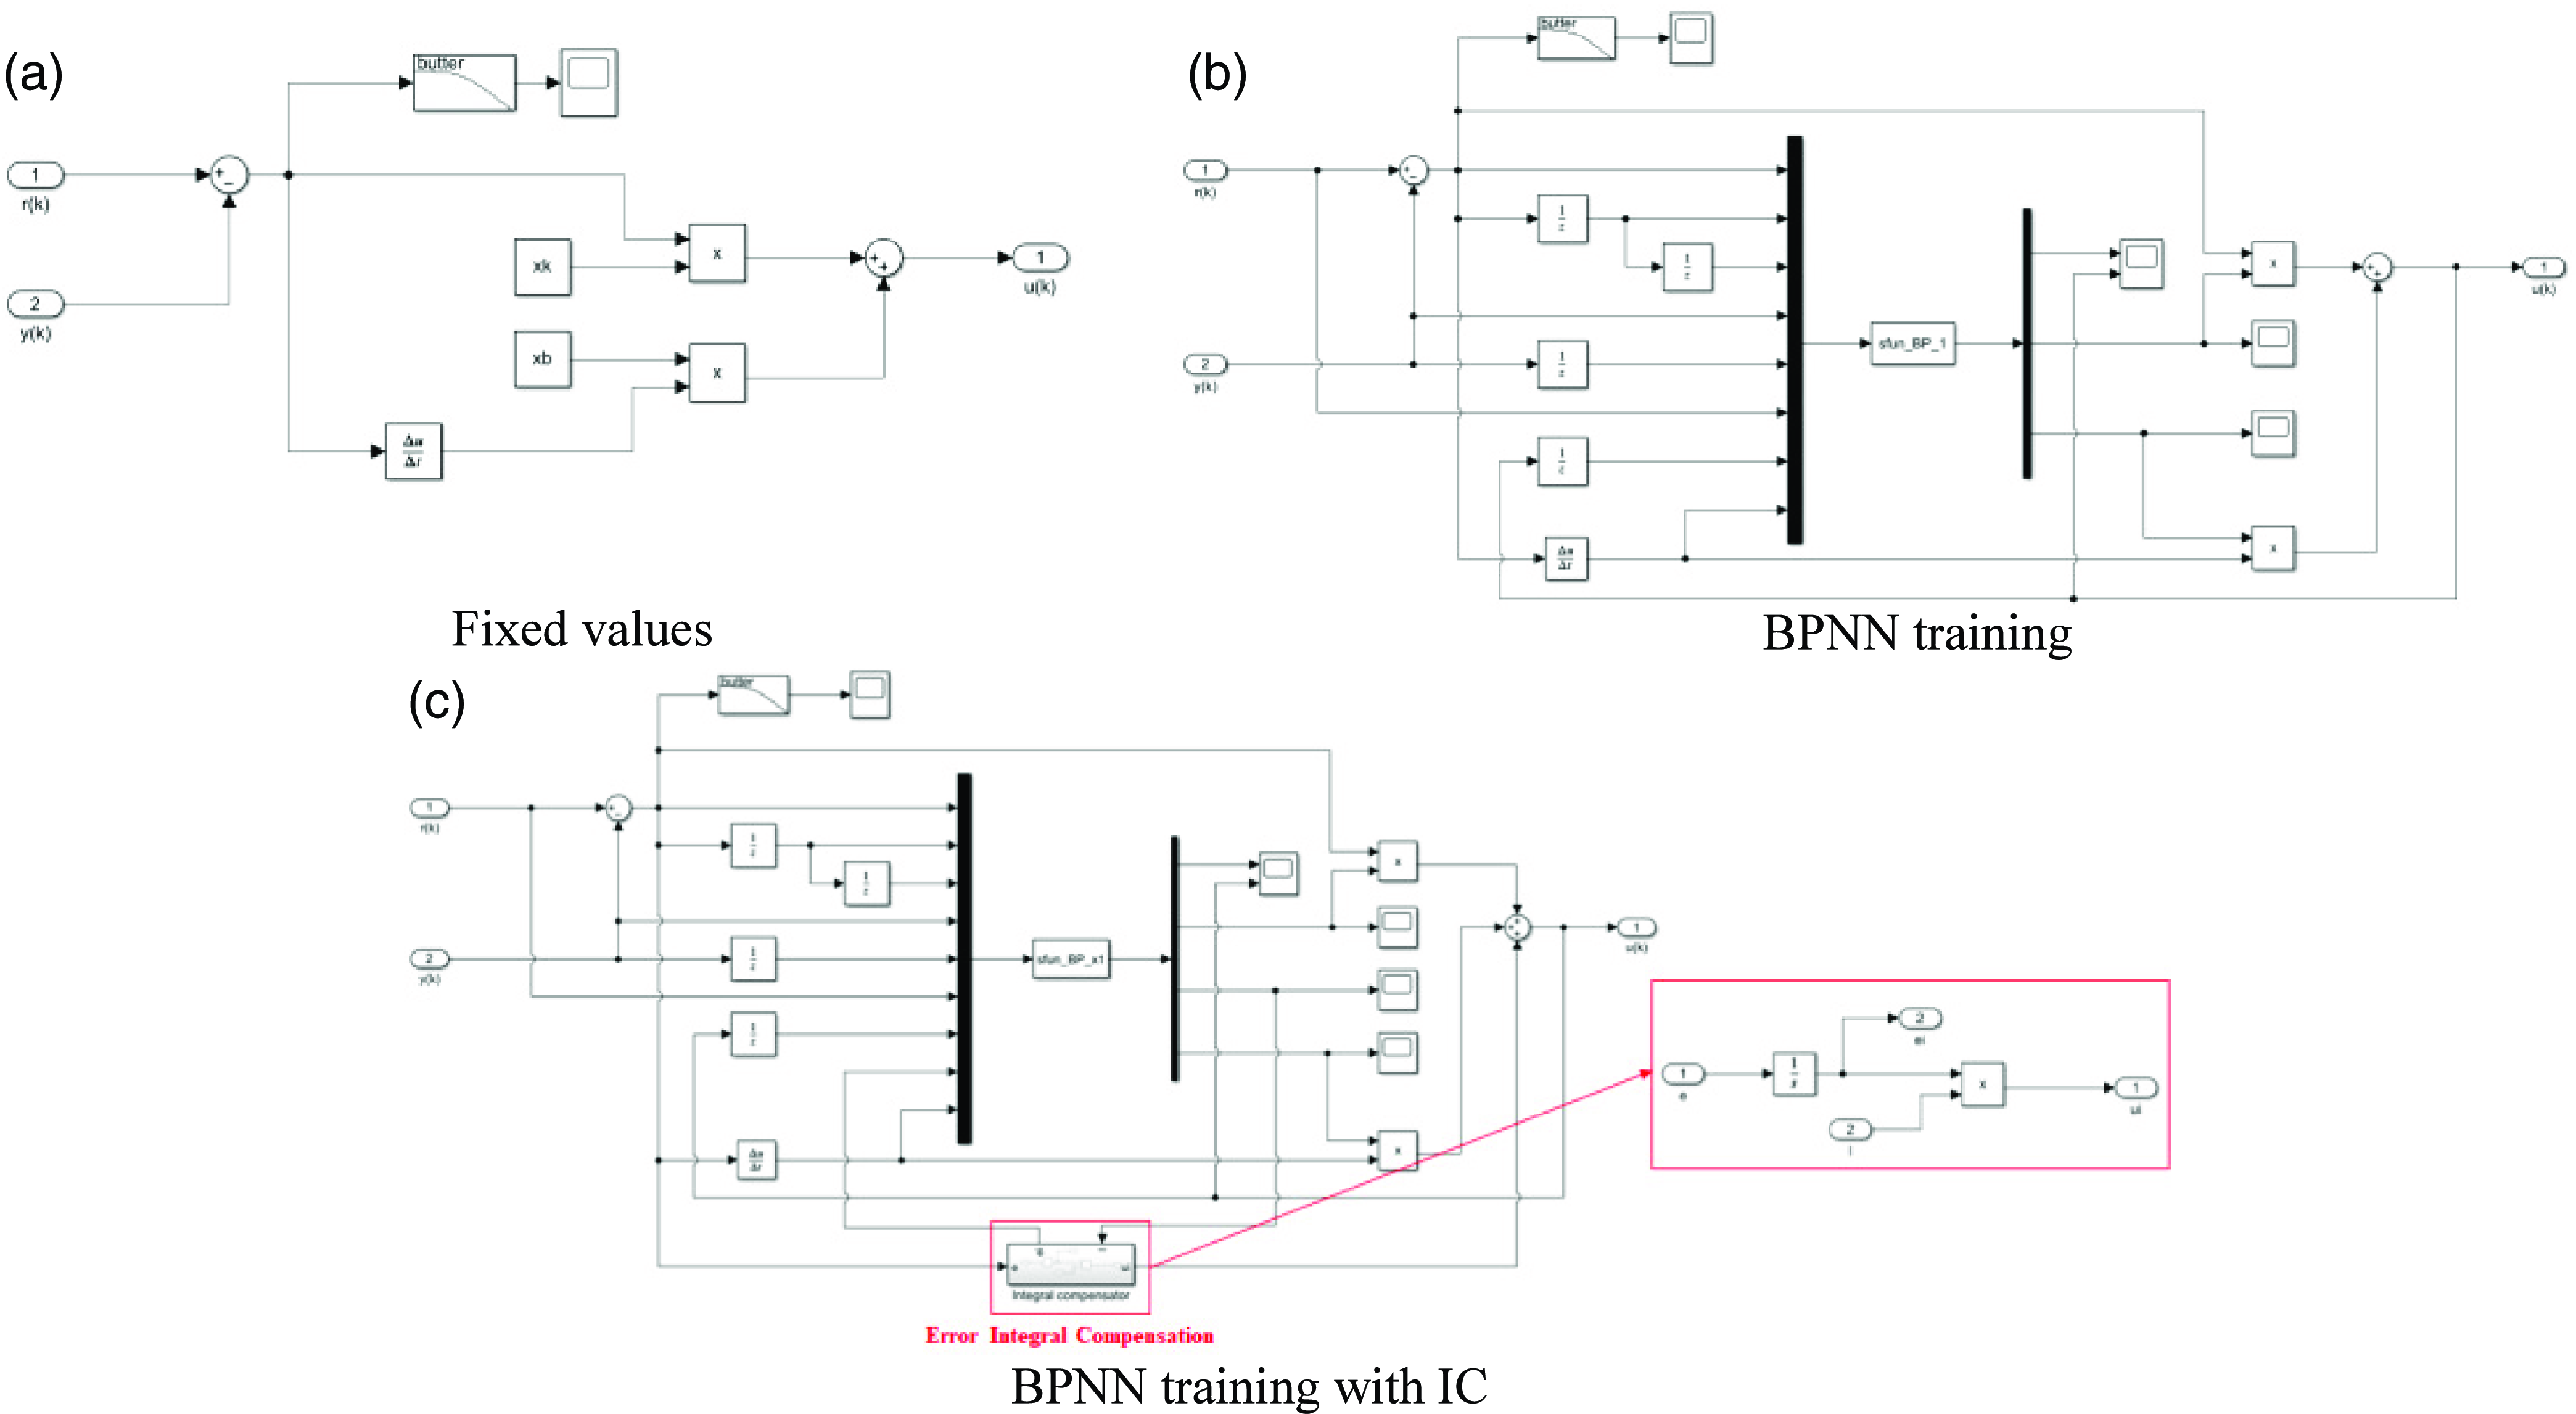
The VMC controller is mainly composed of a Jacobian matrix and a virtual parameter generator. The Jacobian matrix reflects the mapping relationship between the joint actuators and the end-effectors, which is determined by the specific structure of the quadruped robot. The main role of the virtual parameter generator is to determine the parameter values of the virtual components and calculate the output virtual force at the foot-end. Three types of virtual parameter generators are designed (Figure 12), which, respectively, achieve the output of virtual parameters in the form of fixed values, BPNN training, and BPNN training with IC.
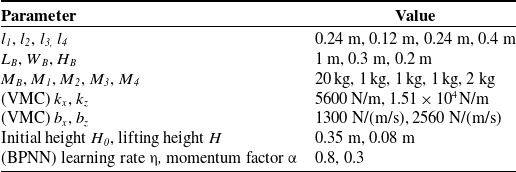
Simulation parameter settings.

Virtual parameter generator.

6. Simulations
6.1 Building of simulation system
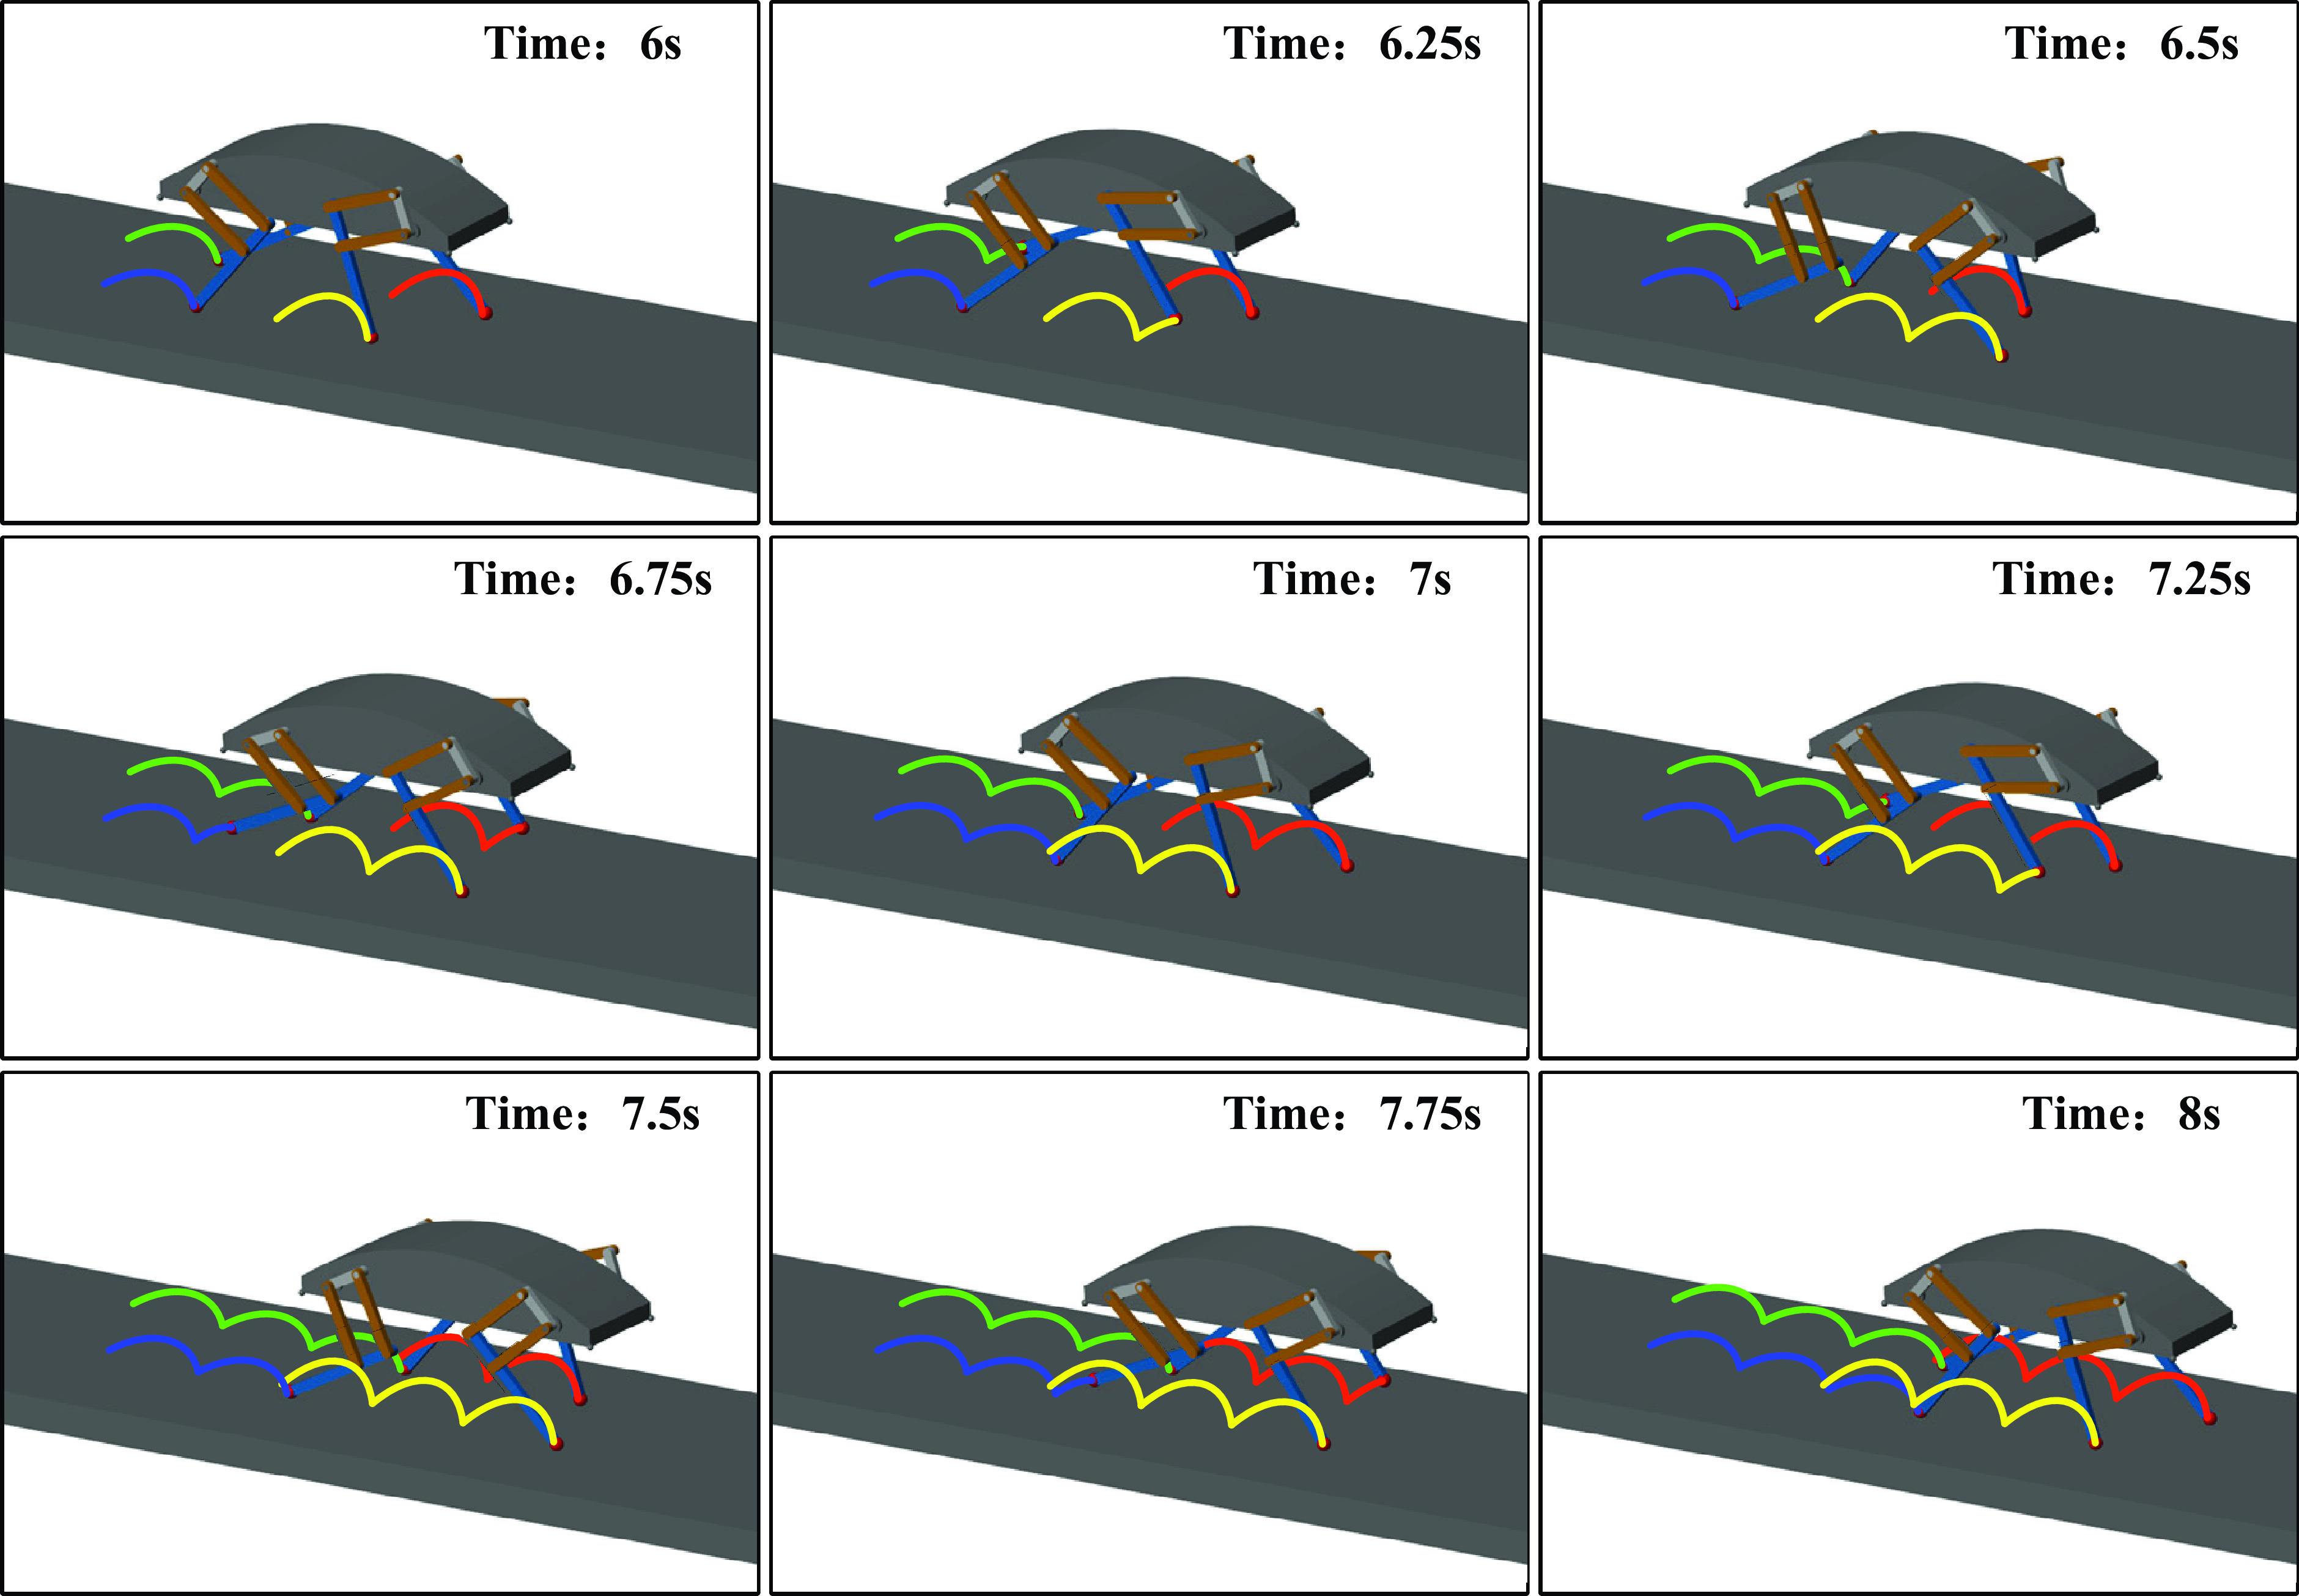
In order to assess the control accuracy and stability of the BP-VMC algorithm, a simulation control system was developed based on the control framework diagram (refer to Figure 11) for conducting simulation experiments. The models of the quadruped robot and the ground were created utilizing the Simscape Multibody module, wherein the kinematic joints and physical interactions were specified. The controller module was implemented in Simulink. The simulation environment and control system for the quadruped robot, as illustrated in Figures 13 and 14, comprise a trajectory generator, a VMC controller, a single-leg model, and a body model. The VMC controller is further categorized into a Jacobian matrix and a virtual parameter generator. The virtual parameter generator was configured in three distinct forms: fixed value (Figure 15(a)), BP network training generation (Figure 15(b)), and BP training with IC (Figure 15(c)) for comparative simulation experiments. The simulation parameters are detailed in Table I. The fixed parameter values of the VMC are established as the self-tuning parameter values of the BP-VMC during the initial 4 s of the simulation, thereby ensuring a consistent initial performance of the controller.
Quadruped robot simulation environment.

Simulation model of control system.

Simulation model of virtual.

6.2 Trajectory tracking
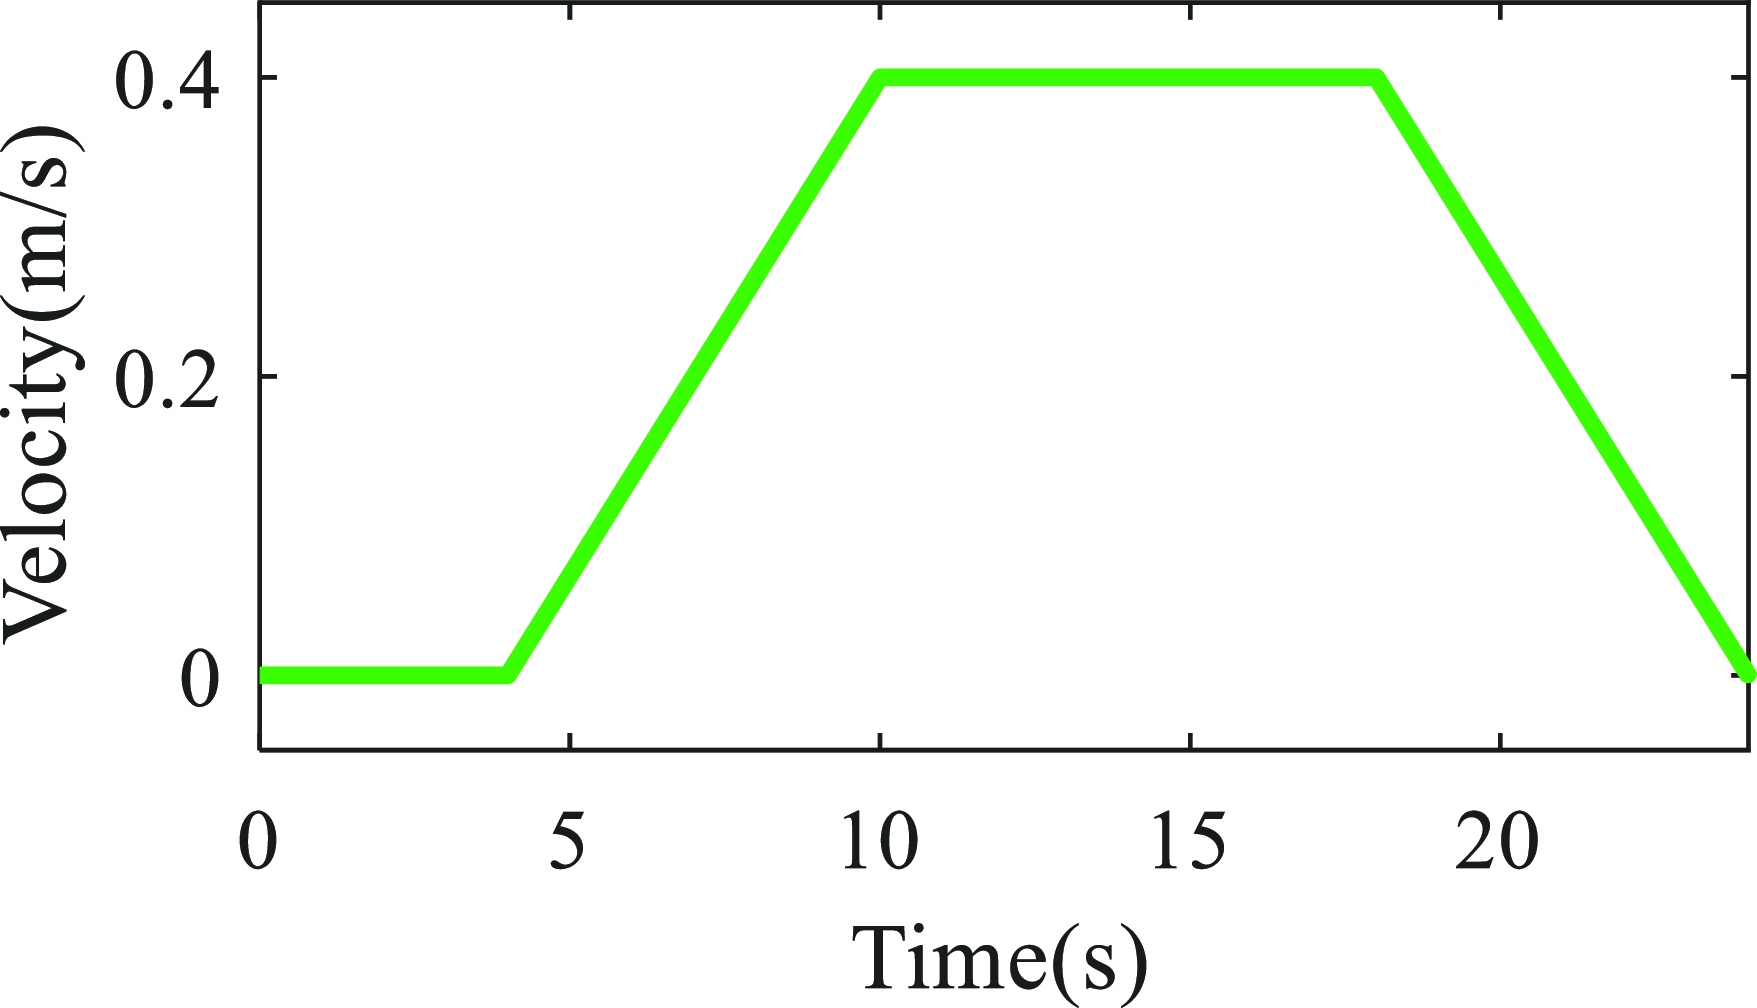
The simulation analysis was conducted using the trot gait as the primary motion gait for the quadruped robot. The complete gait cycle time was set to T = 1 s, with the swing phase and support phase each accounting for 50% of the motion cycle [Reference Yue, Yue and Sun38], that is, T sw =T st = 0.5 s. The desired tracked motion velocity curve and foot-end trajectory are shown in Figures 16 and 17. The main motion process is as follows: the robot remains stationary in the quadrupedal stance for the first 4 s to enter an initial equilibrium state, ensuring consistency in the initial state; from 4 to 10 s, the robot gradually accelerates from 0 to 0.4 m/s; from 10 to 18 s, the robot maintains a constant velocity of 0.4 m/s; and from 18 to 24 s, the robot gradually decelerates from 0.4 m/s to 0.
Desired velocity.

Desired foot trajectory.

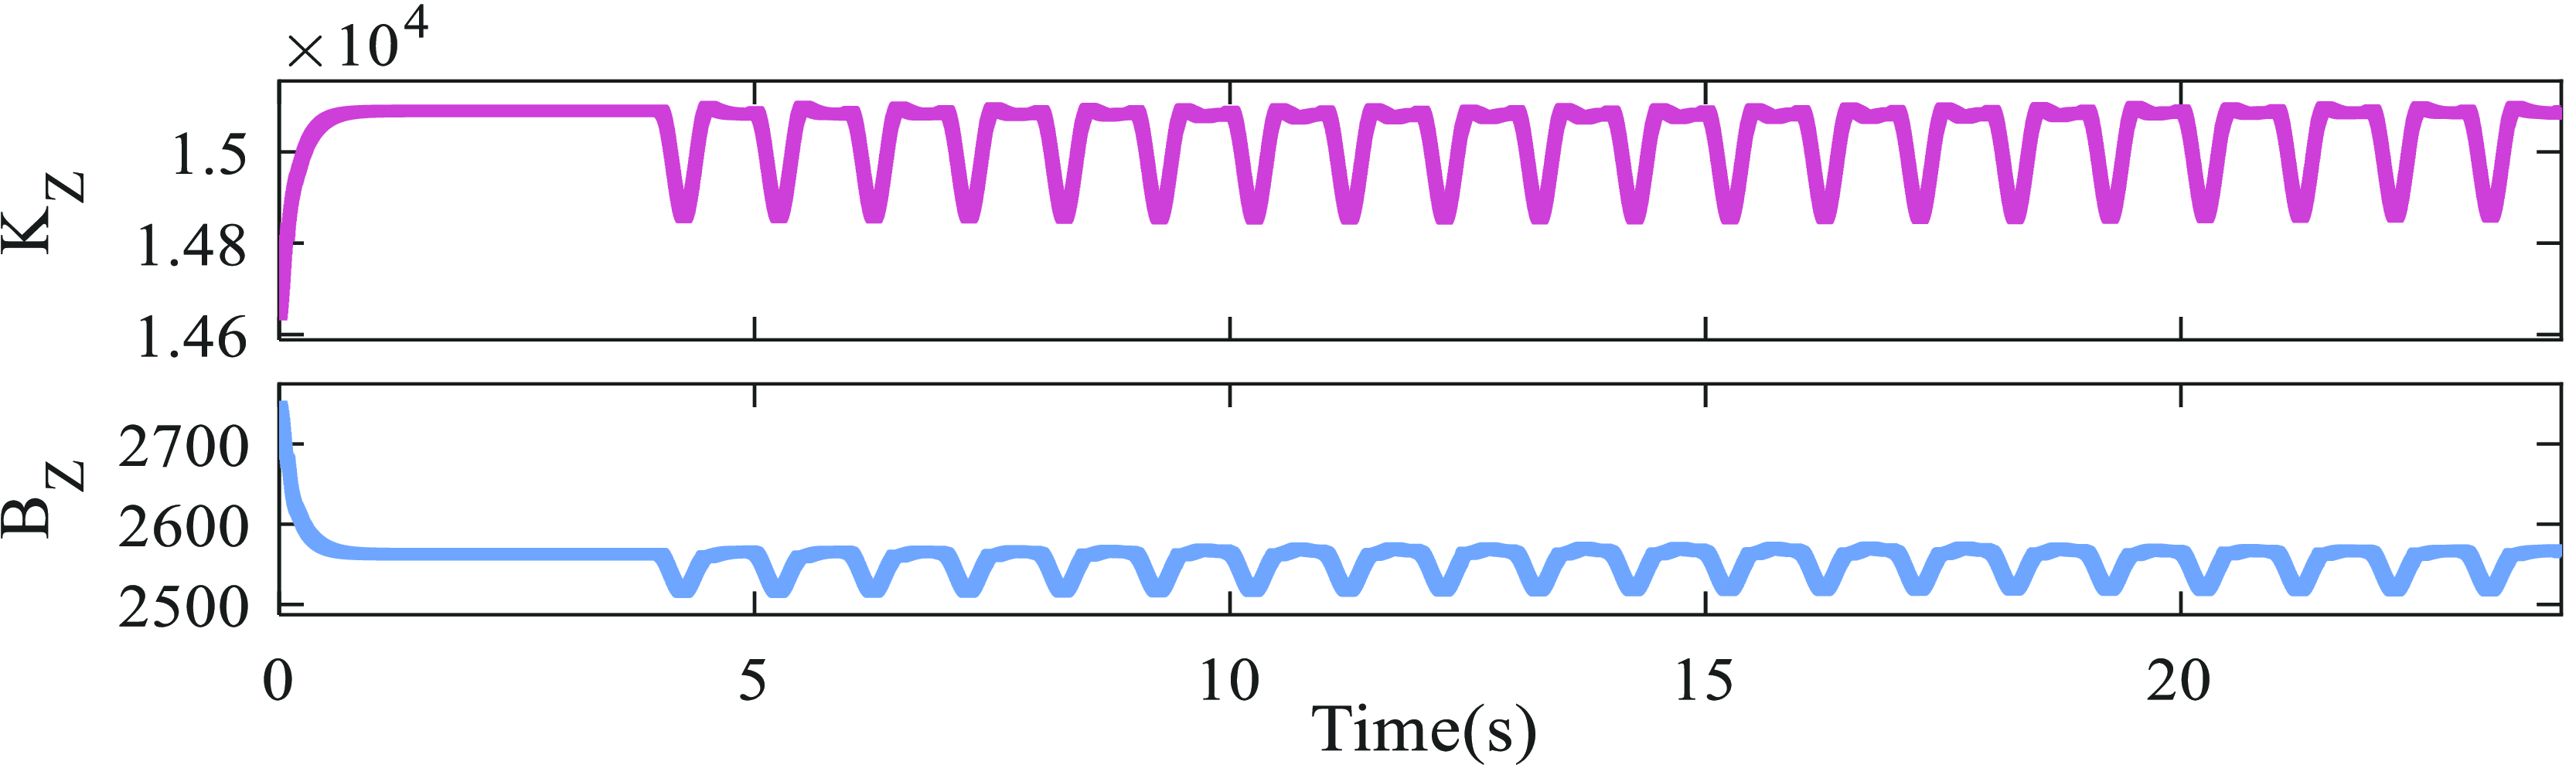
Simulations and comparative experiments were conducted using both VMC and BP-VMC methods. The parameter settings for traditional VMC are shown in Table I, and the parameter values for BP-VMC are presented in Figures 20 and 23. According to formulas (8) and (13), the virtual forces and virtual parameters in the X and Z directions are independent. Therefore, the simulation results in the X and Z directions were analyzed separately, and the final comparison was made based on the foot-end trajectories throughout the entire simulation process. Since the first 4 s are for adjusting the robot’s initial equilibrium state, the subsequent error analysis uses data obtained after this 4-s simulation.
6.2.1 X direction
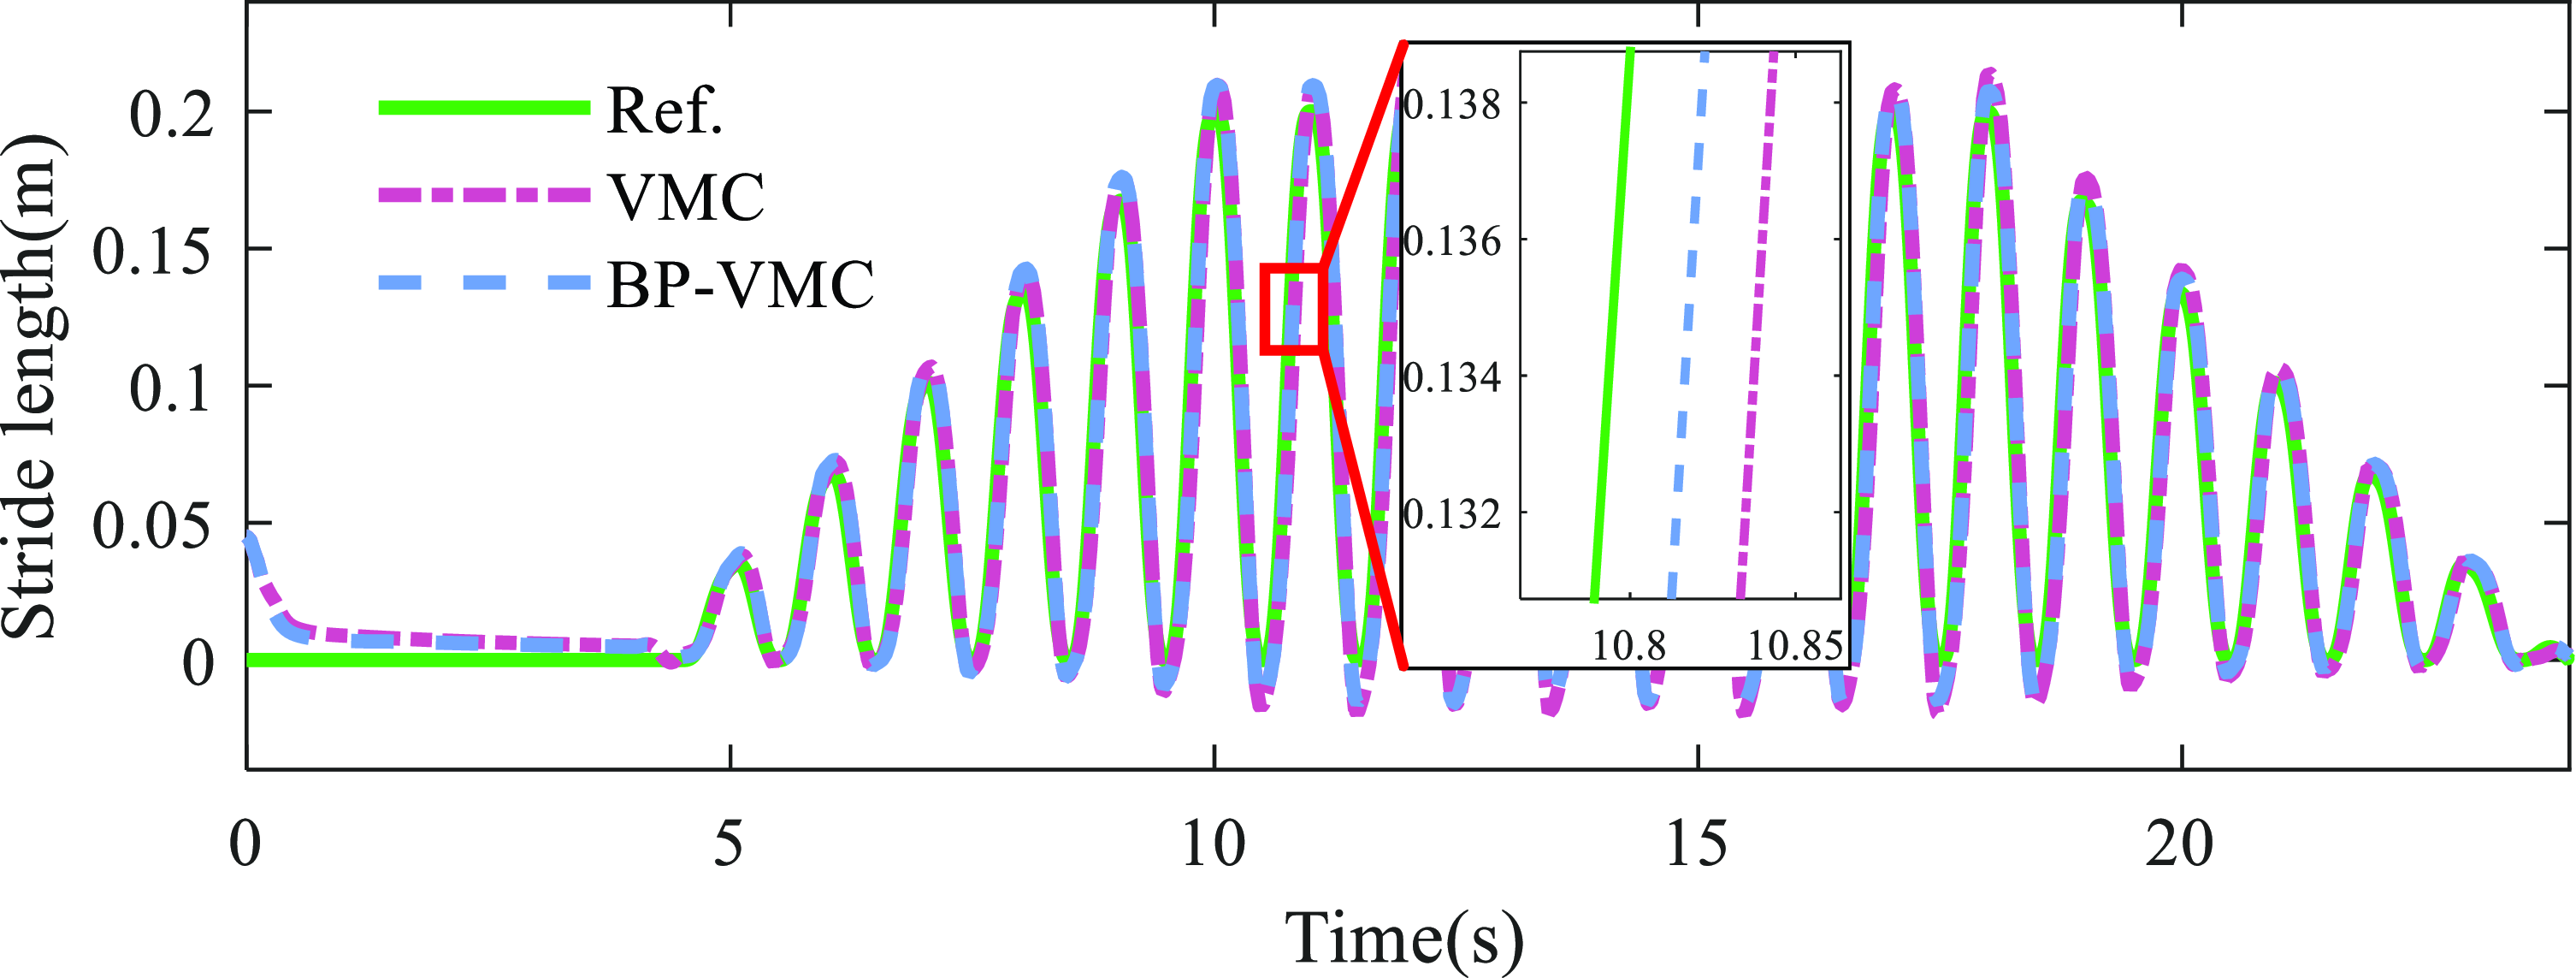
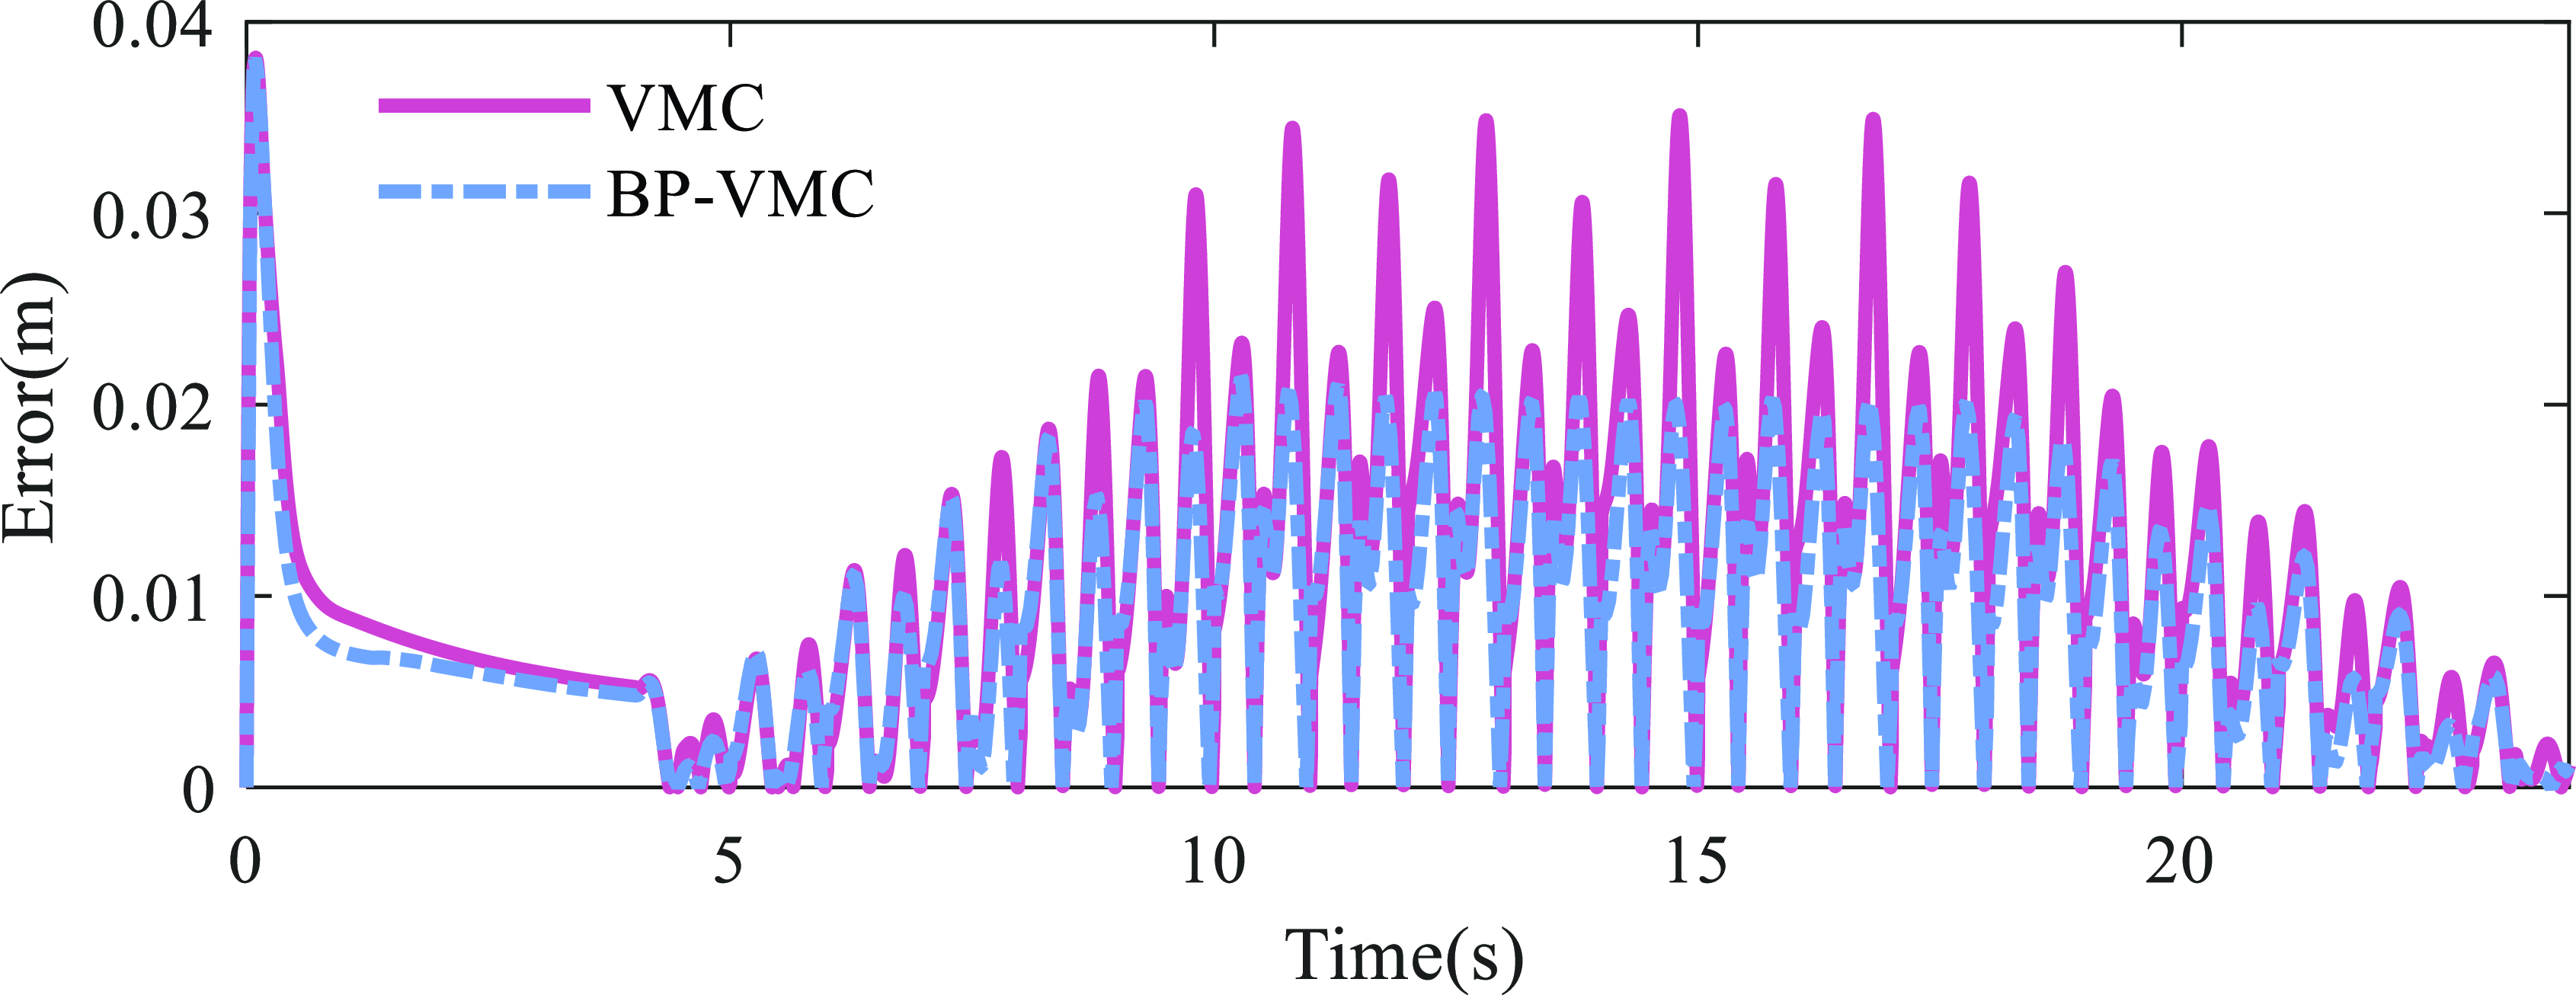
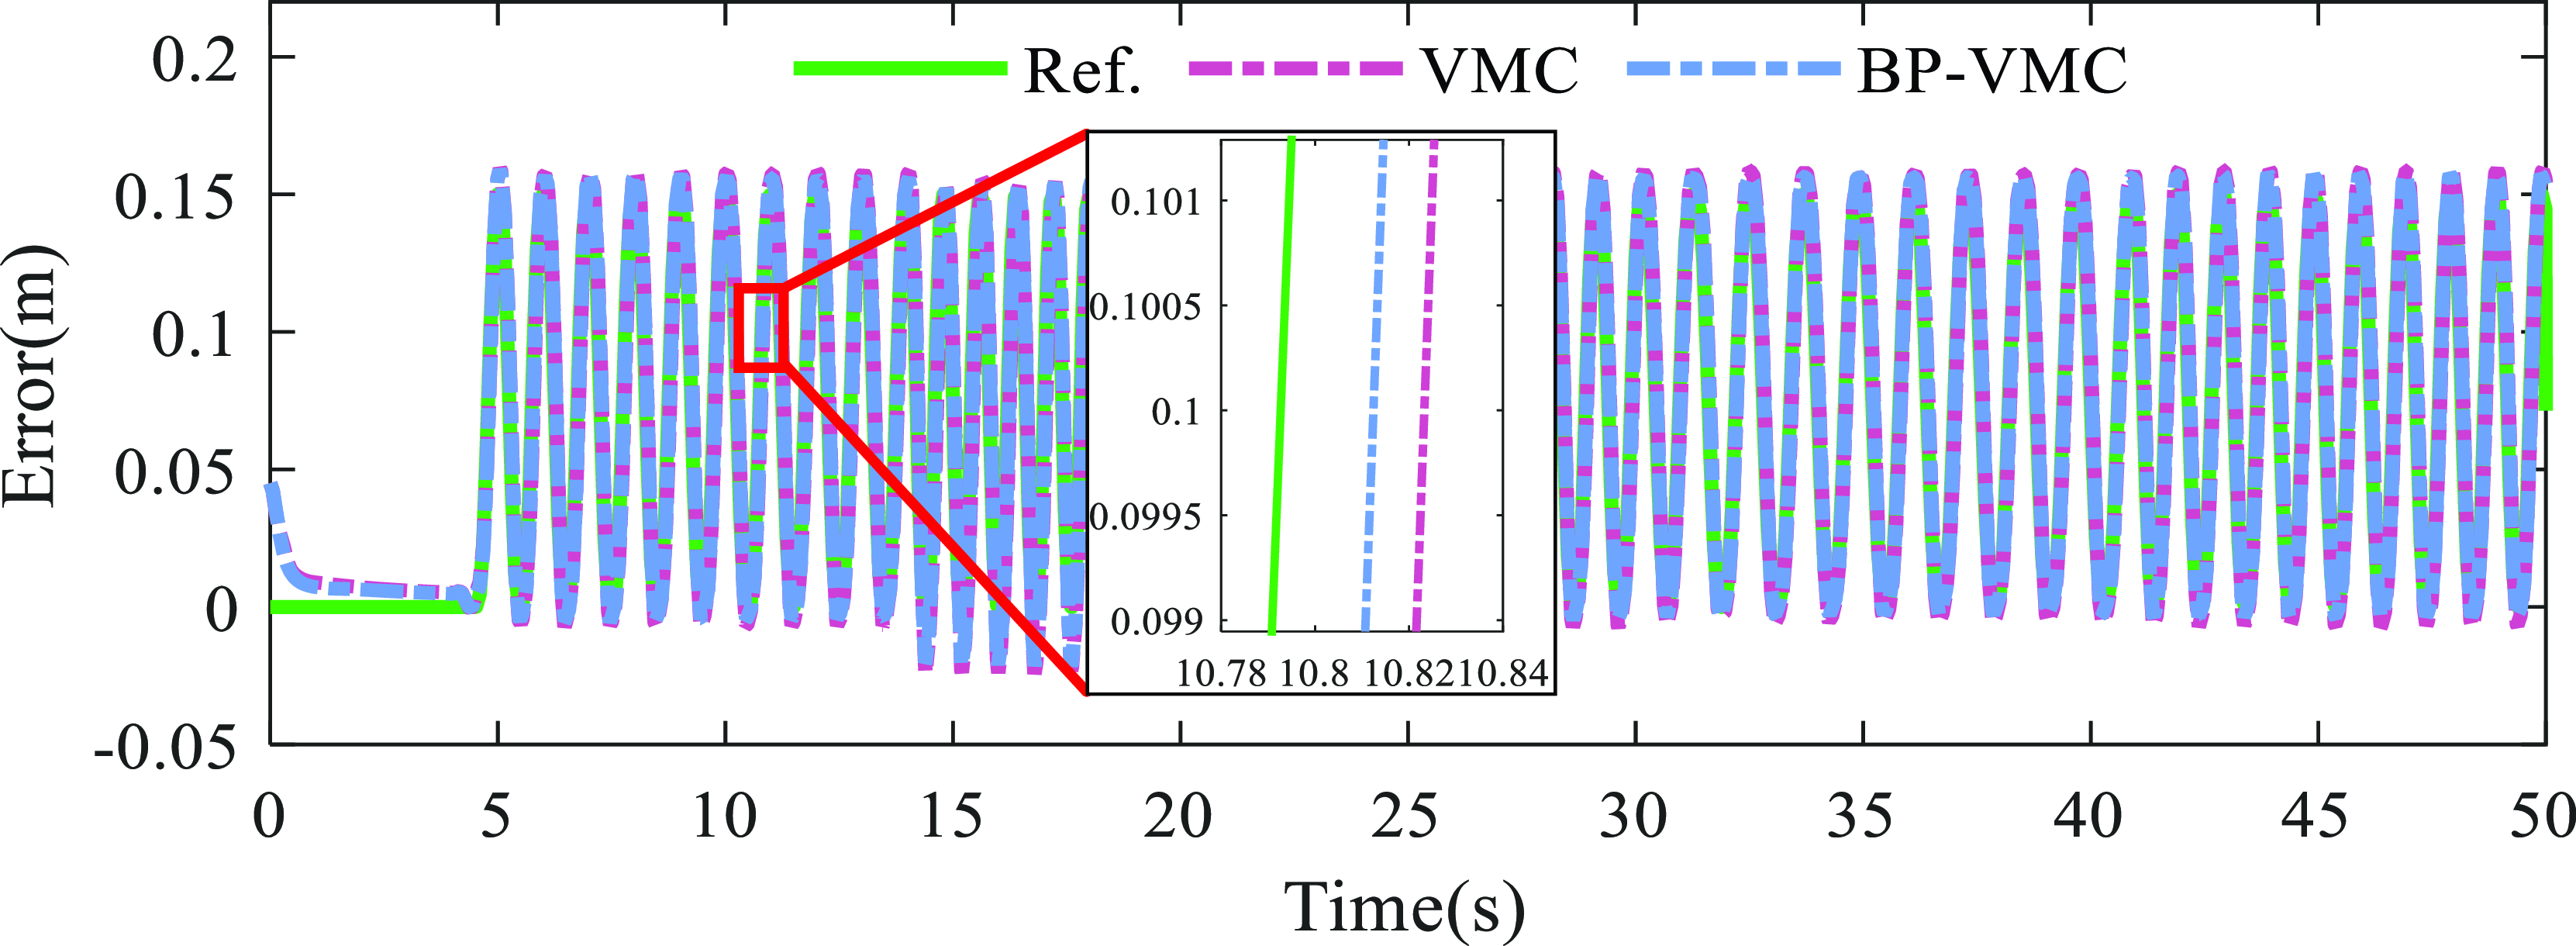
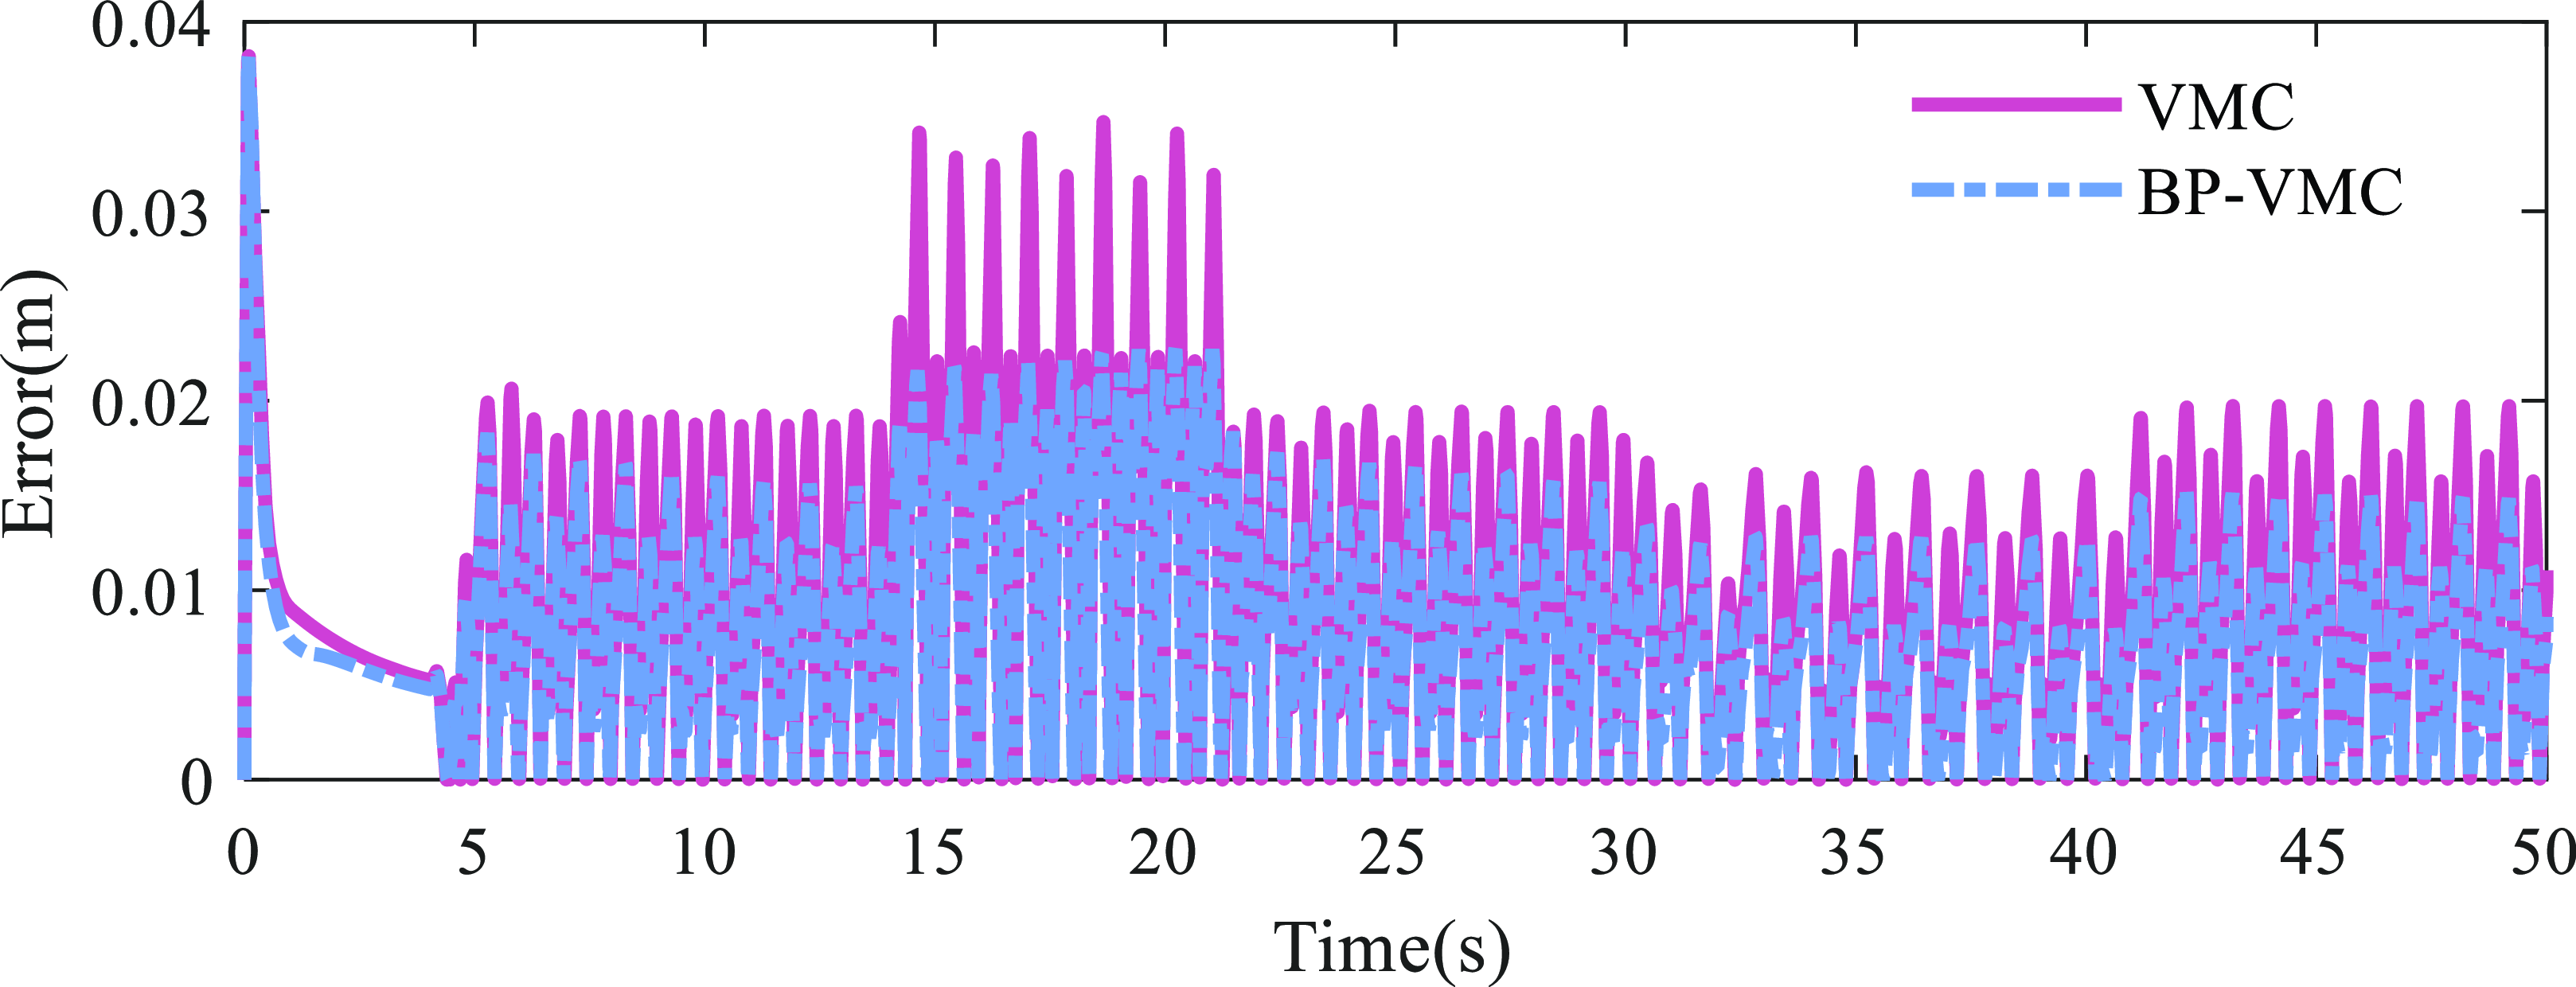
An examination of Figure 18 reveals that the BP-VMC exhibits superior real-time tracking performance compared to the VMC, aligning more closely with the desired trajectory. To quantitatively assess the tracking efficacy, the error curve presented in Figure 19 has been generated. At lower velocities, the tracking errors for both controllers are comparable, with BP-VMC demonstrating a marginally reduced error relative to VMC. However, as the velocity escalates, the error values for both controllers increase, with a notable abrupt change in the error curve for VMC, which reaches a maximum error of
 $3.470\times 10^{-2}$
m. In contrast, BP-VMC maintains a maximum error of only
 $1.997\times 10^{-2}$
m. Throughout the entire evaluation period, the root mean square error (RMSE) for VMC tracking is recorded at
 $1.356\times 10^{-2}$
, whereas the RMSE for BP-VMC tracking is
 $1.019\times 10^{-2}$
, representing 75.15% of the RMSE associated with VMC.
Stride length in the X direction.

Absolute error in the X direction.

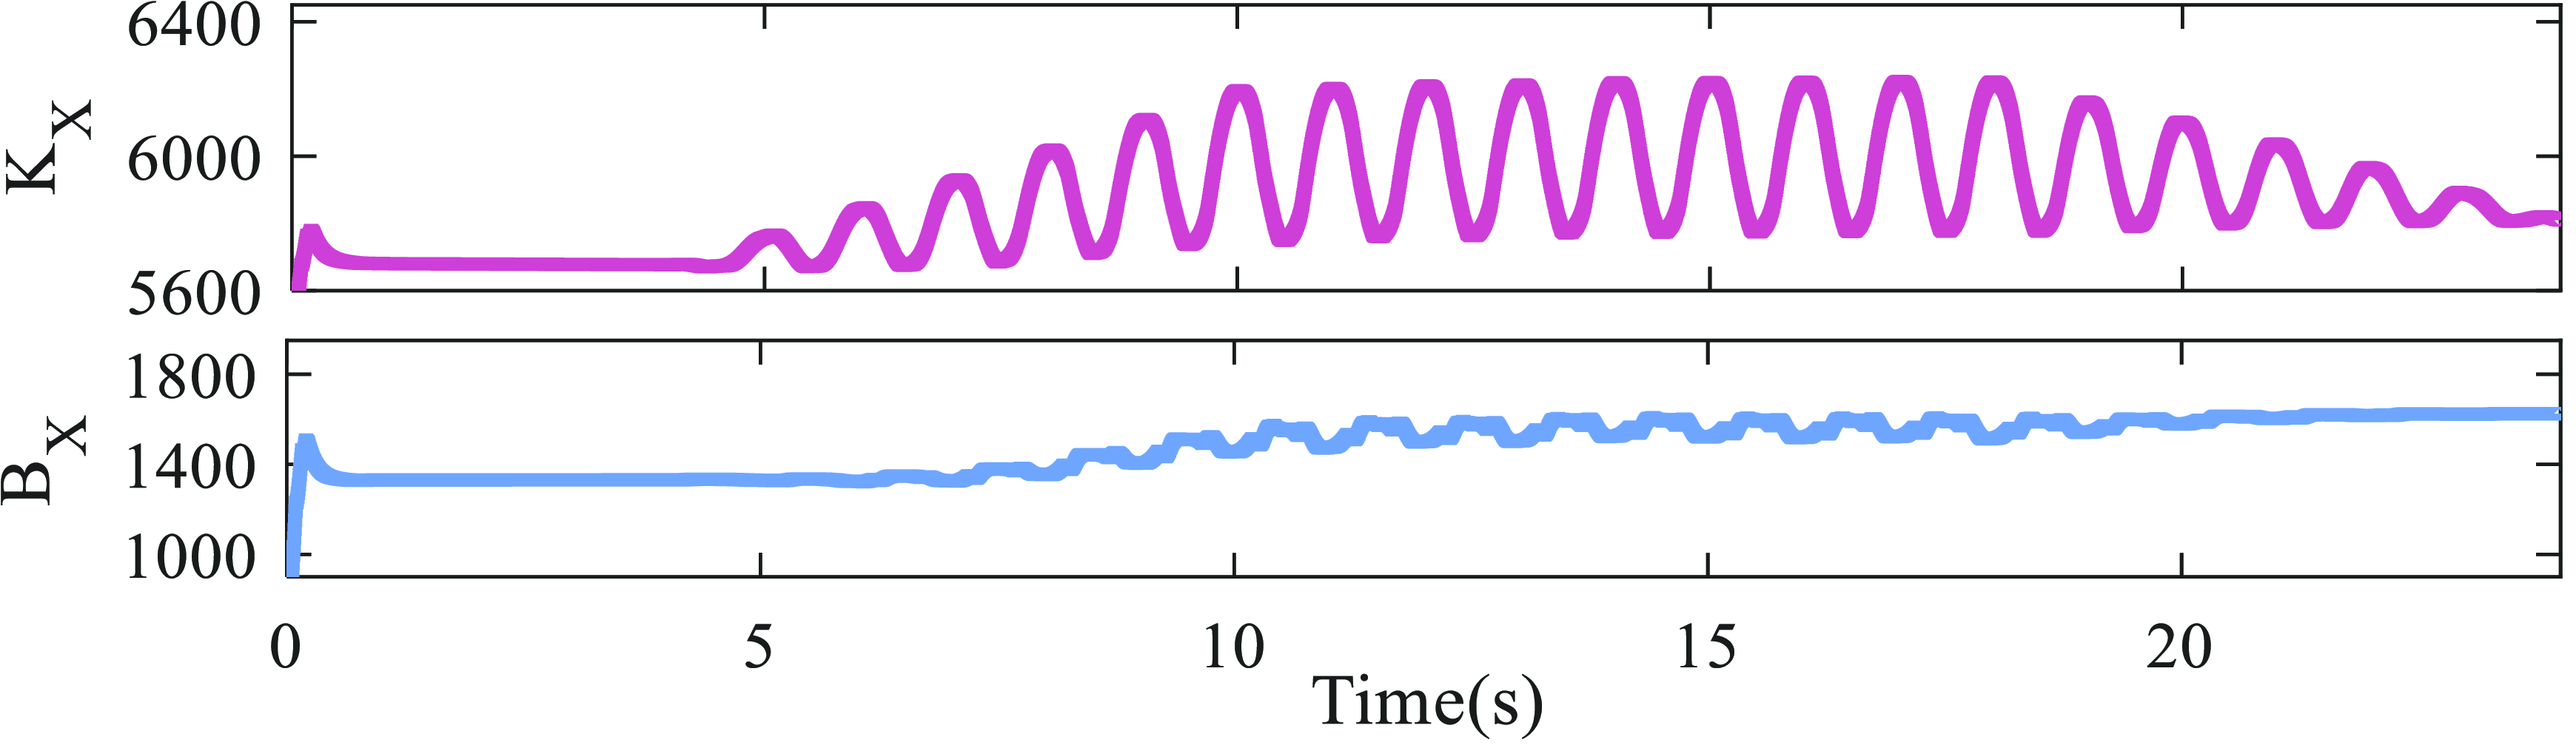
Based on the simulation results in Figures 18 and 19, along with the K X parameter variation curve of BP-VMC in Figure 20, it can be observed that during the swing phase, the K X value increases, leading to an increase in the controller’s stiffness. This results in faster tracking response and smaller tracking errors for BP-VMC. Furthermore, by analyzing the B X parameter variation curve of BP-VMC in Figure 19, it is found that at the moment when there is a sudden error change in VMC, the B X parameter of BP-VMC increases, which increases the damping coefficient of the controller. This effectively suppresses the occurrence of sudden error changes and enhances the control stability.
BP-VMC parameters in the X direction.

6.2.2 Z direction
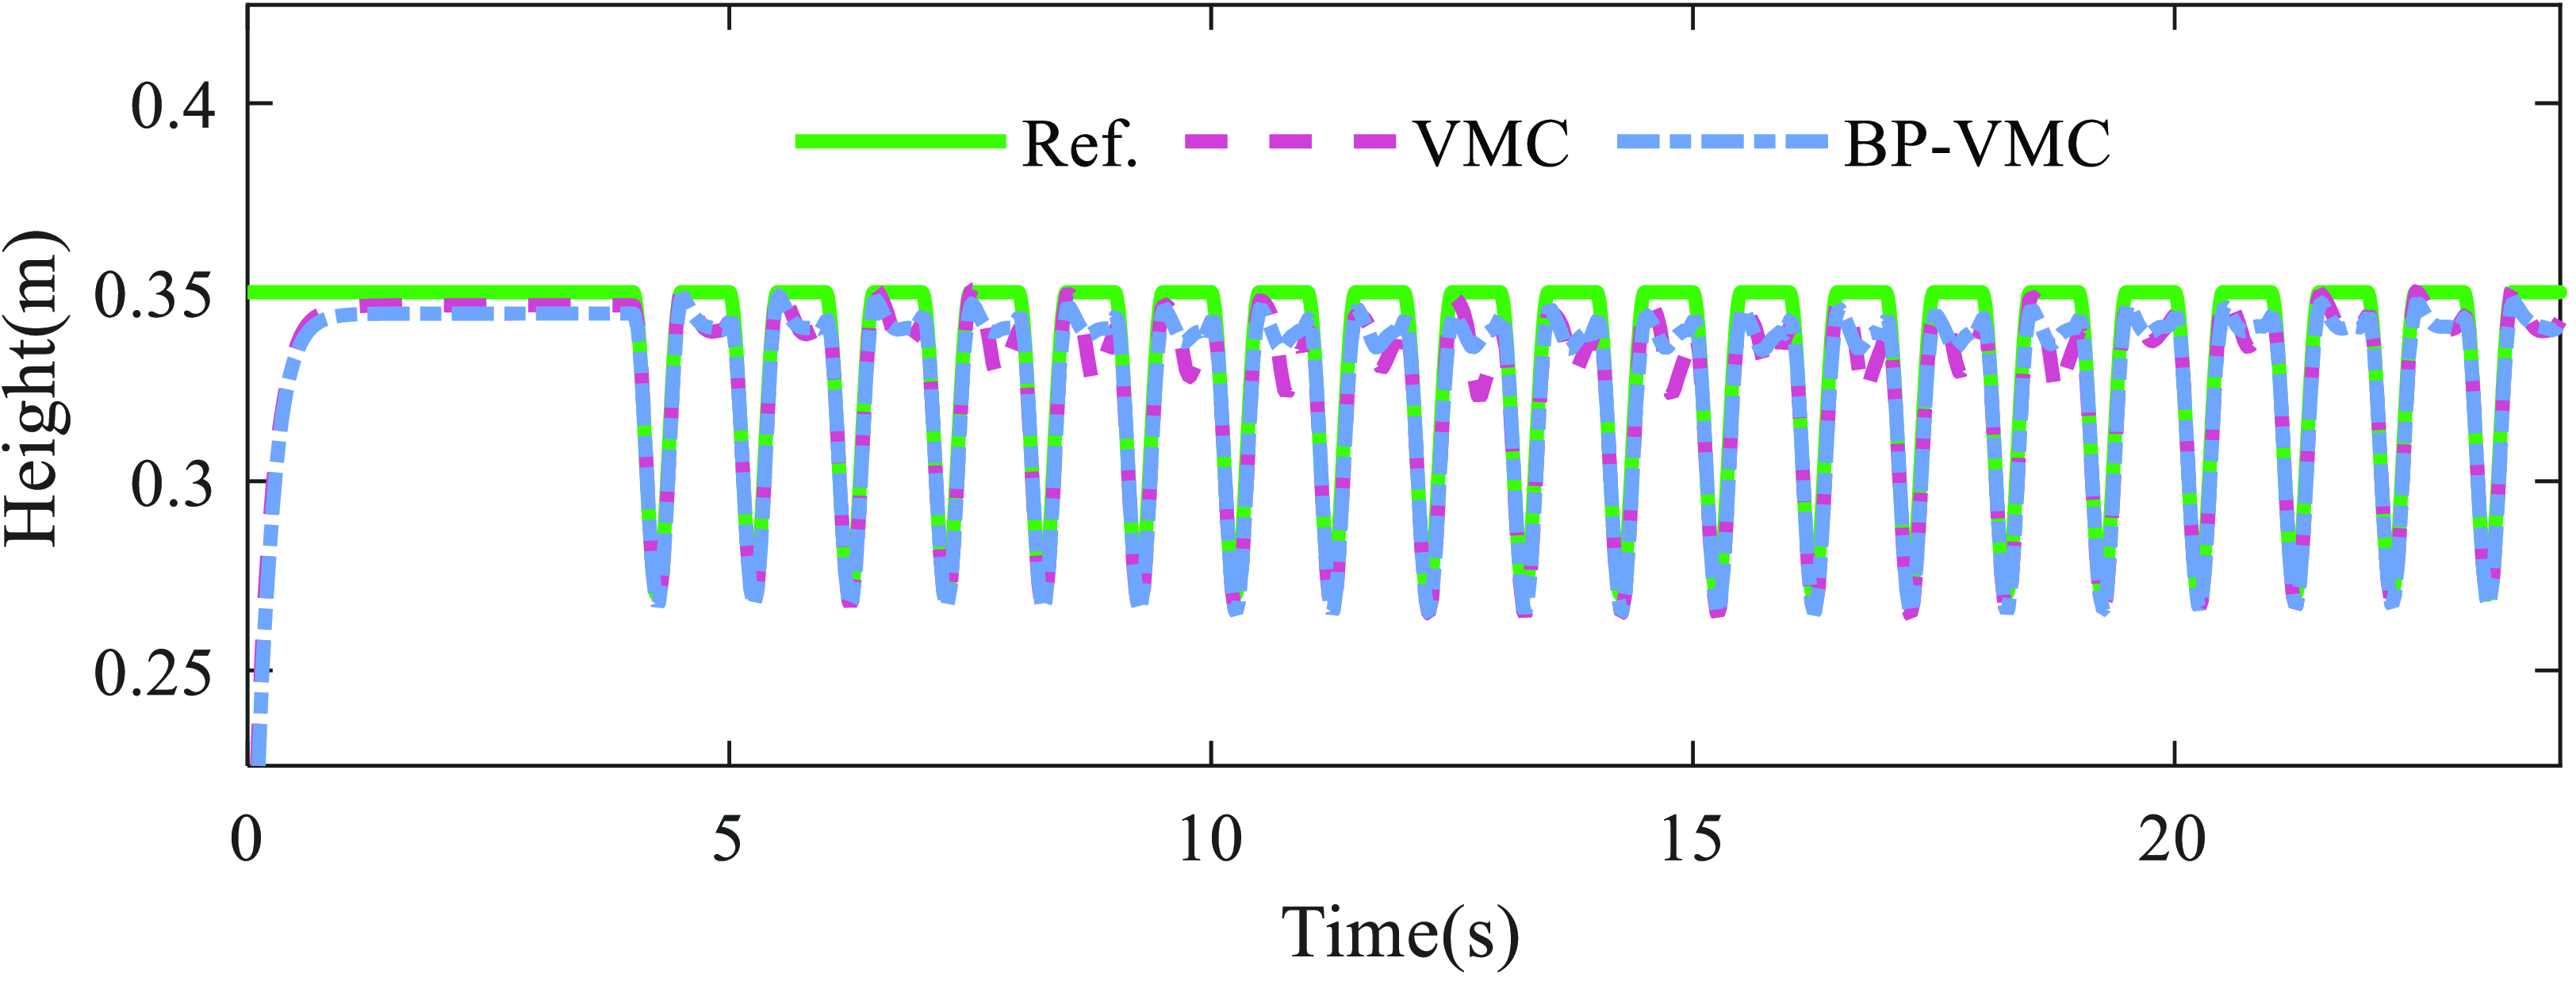
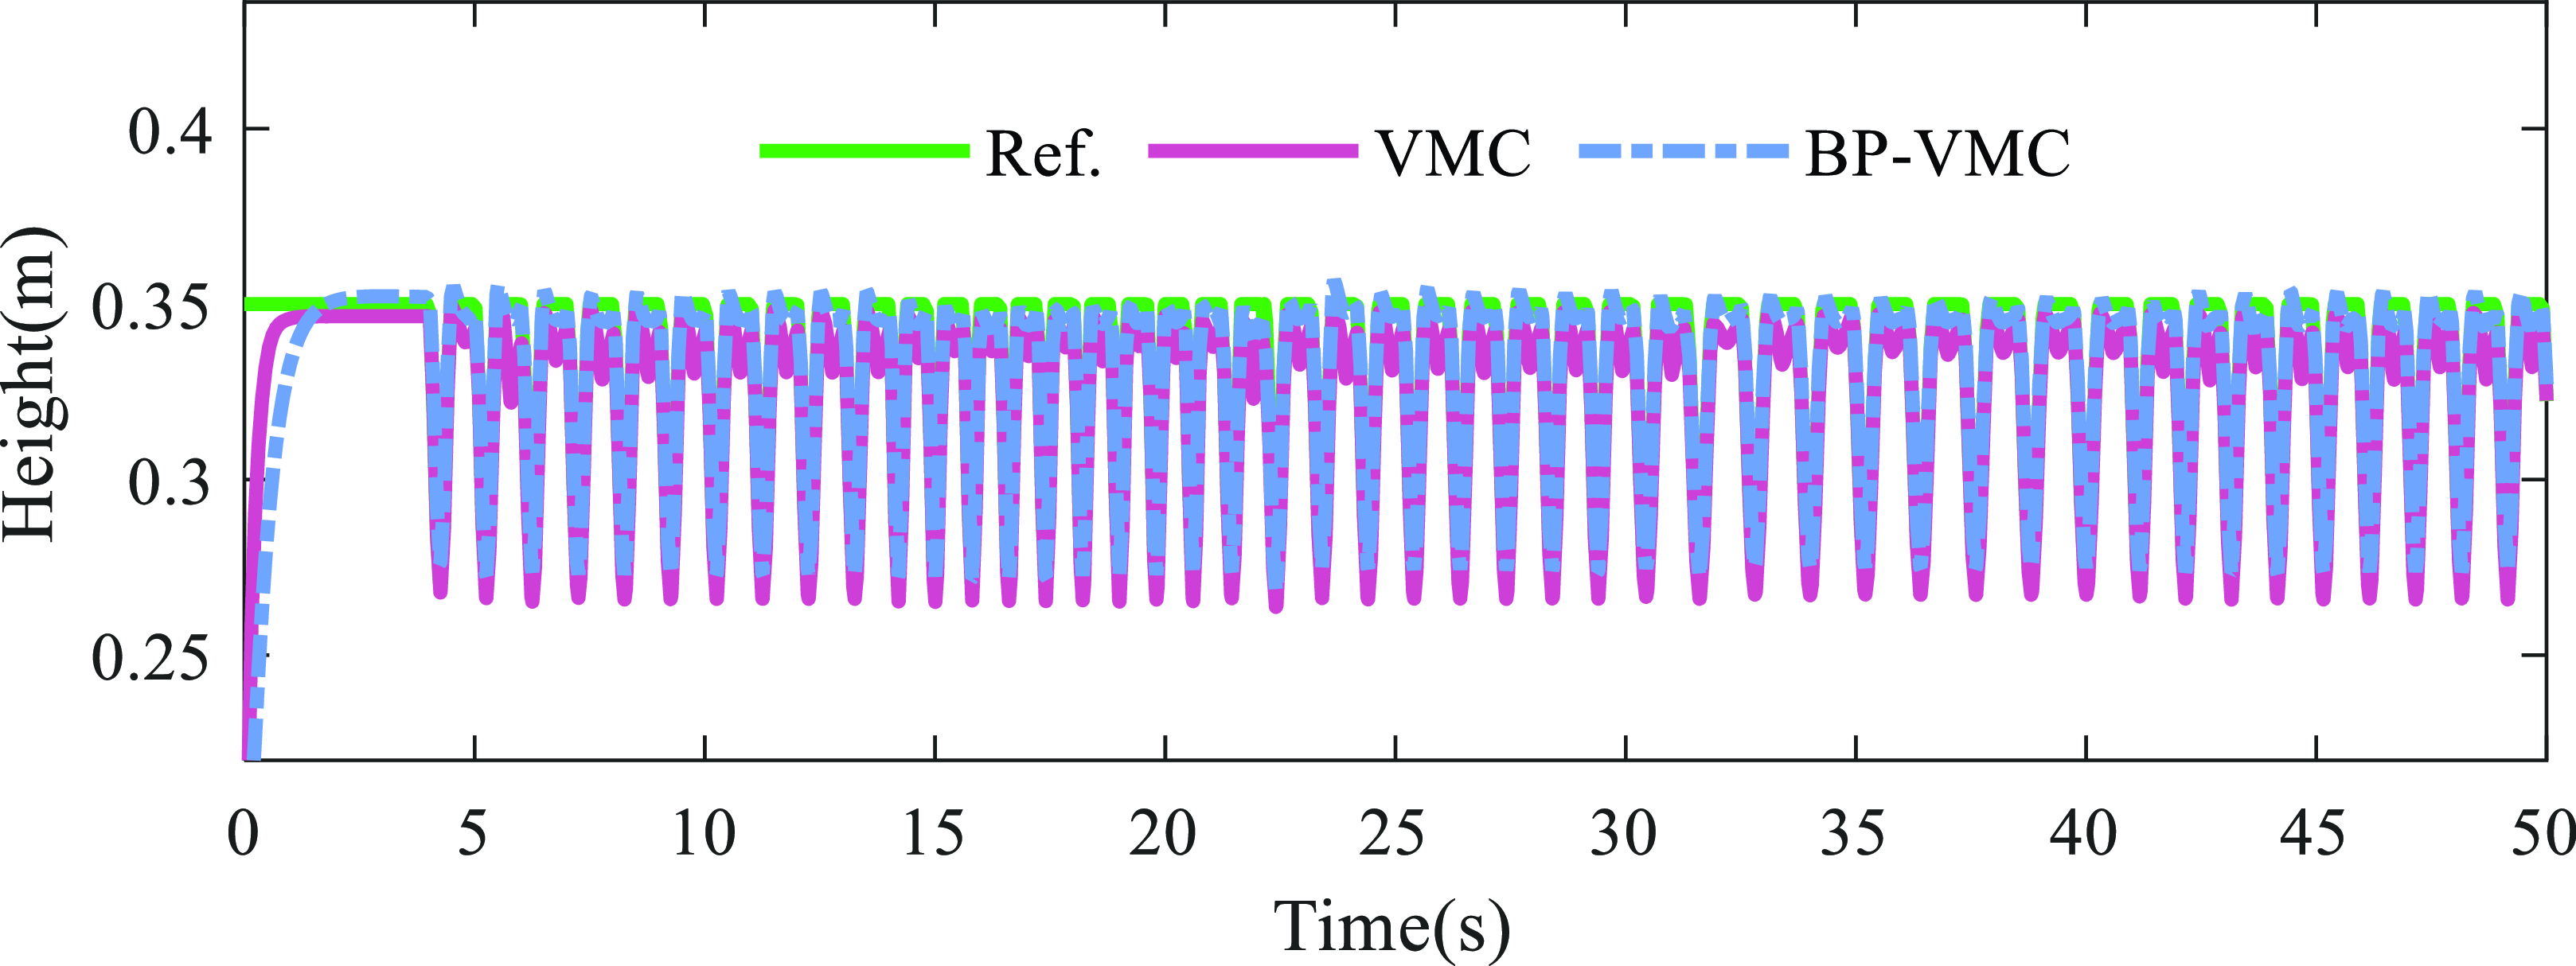
The results of height control in the Z direction are presented in Figure 21. Overall, both the VMC and the BP-VMC demonstrate the capability to accurately track the reference values. During the swing phase, the control performance of both VMC and BP-VMC is comparable, as they closely align with the reference curve, indicating effective tracking capabilities. However, during the support phase, notable discrepancies arise in the control performance of the two methods. The transition between phases – specifically from bipedal to quadrupedal and back to bipedal support – induces fluctuations in the height of the robot’s center of mass. This phenomenon is clearly illustrated in the curve depicted in Figure 21.
Height between the foot-end and the center of mass.

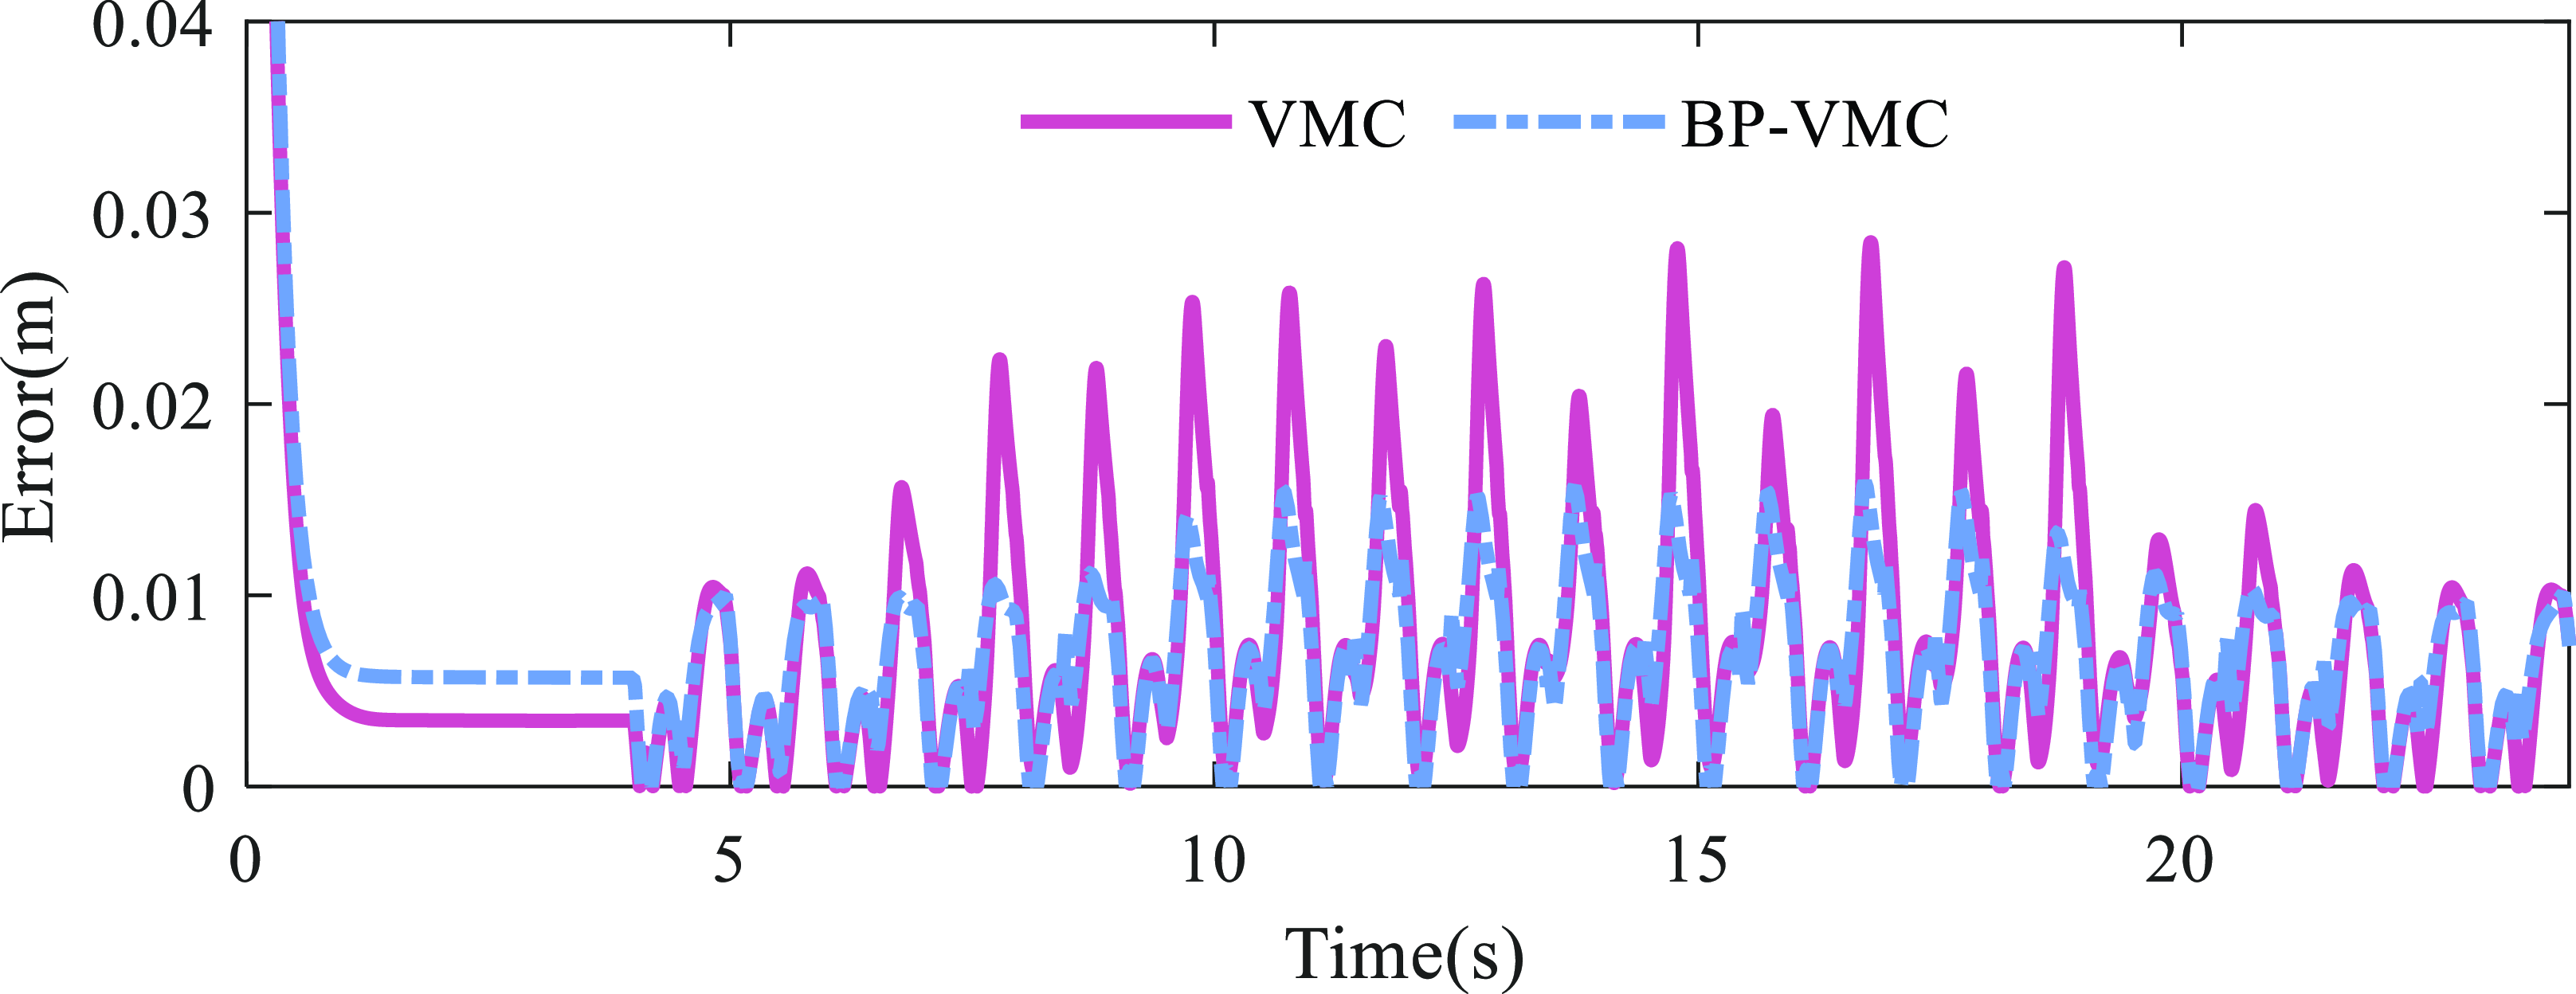
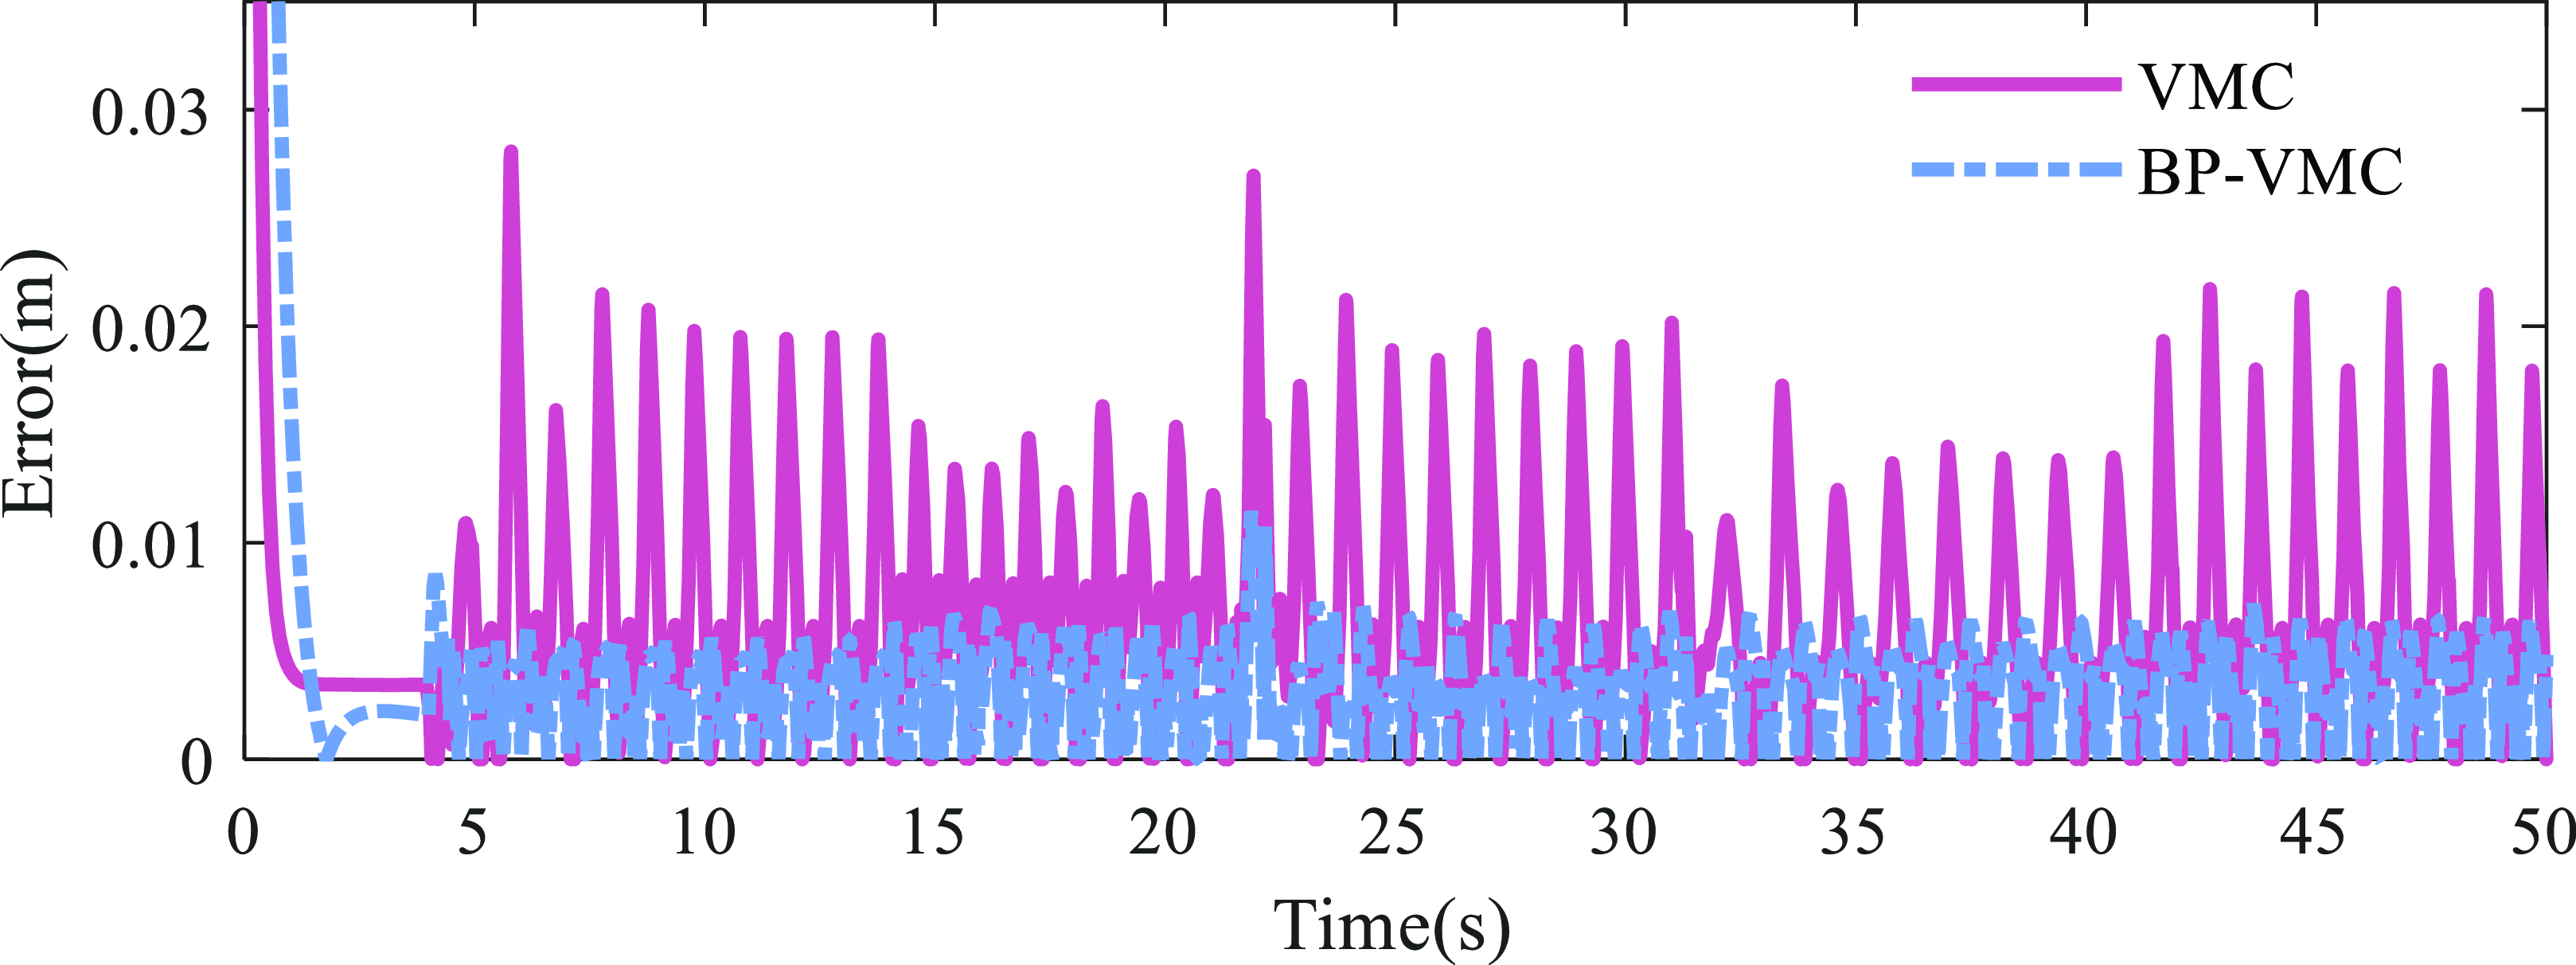
To further quantify the tracking performance, the error curve illustrated in Figure 22 is obtained. The maximum error value of VMC is
 $2.852\times 10^{-2}$
m, with RMSE of
 $9.848\times 10^{-3}$
. The maximum error value of BP-VMC is
 $1.595\times 10^{-2}$
m, with RMSE of
 $7.584\times 10^{-3}$
. The RMSE of BP-VMC is 77.01% of VMC’s RMSE, and its maximum error value is significantly smaller than VMC’s, indicating that BP-VMC has higher tracking accuracy.
Absolute error in the Z direction.

BP-VMC parameters in the Z direction.

Analysis of the fluctuation trends in the respective curves indicates that, at lower velocities, the height fluctuations of VMC and BP-VMC exhibit a high degree of consistency. However, as the velocity escalates, the height fluctuations associated with VMC experience a marked increase, characterized by pronounced peaks. Conversely, the height fluctuations of BP-VMC remain relatively stable, showing minimal variation from low-velocity conditions and lacking abrupt changes in response to alterations in the motion state. Consequently, the comparative results suggest that BP-VMC exhibits superior control stability and adaptability in contrast to VMC, thereby facilitating consistent motion state control across varying motion conditions.
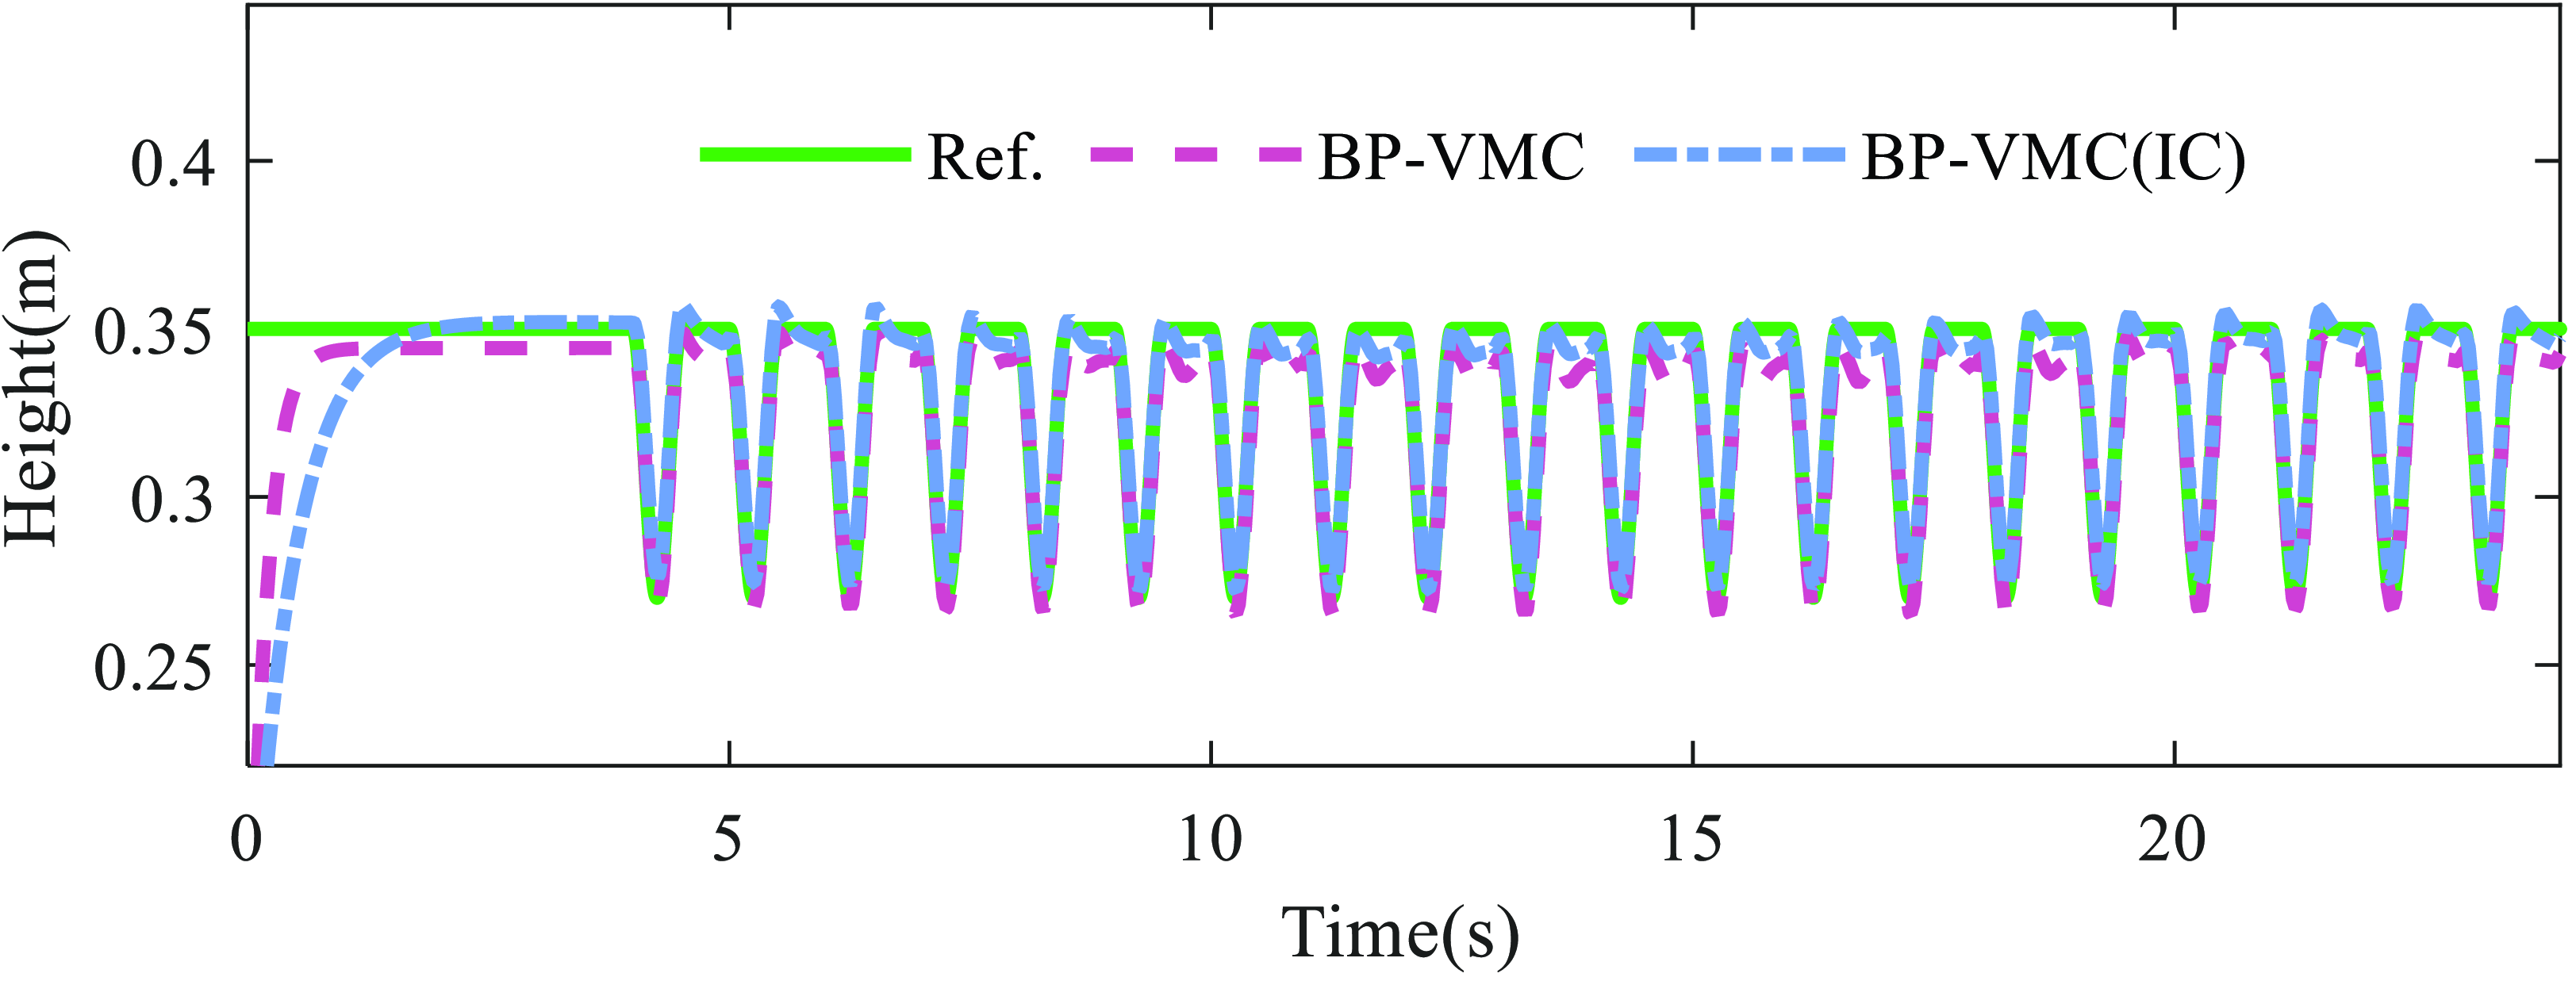
Furthermore, it is evident that a significant steady-state error exists in the height control within the Z direction. This is due to the neglect of the robot’s self-weight in the process of virtual model construction, and there is no integral term to compensate for the steady-state error. Consequently, an integral compensator has been incorporated into the Z direction controller to rectify the steady-state error attributable to the robot’s self-weight. The simulation outcomes following the implementation of this compensation are illustrated in Figure 24. While the introduction of the error integral compensator does influence the response speed of the controller, it effectively mitigates the steady-state error, thereby significantly enhancing the precision of height tracking control in the Z direction.
Height of BP-VMC with IC.

6.2.3 Foot trajectory
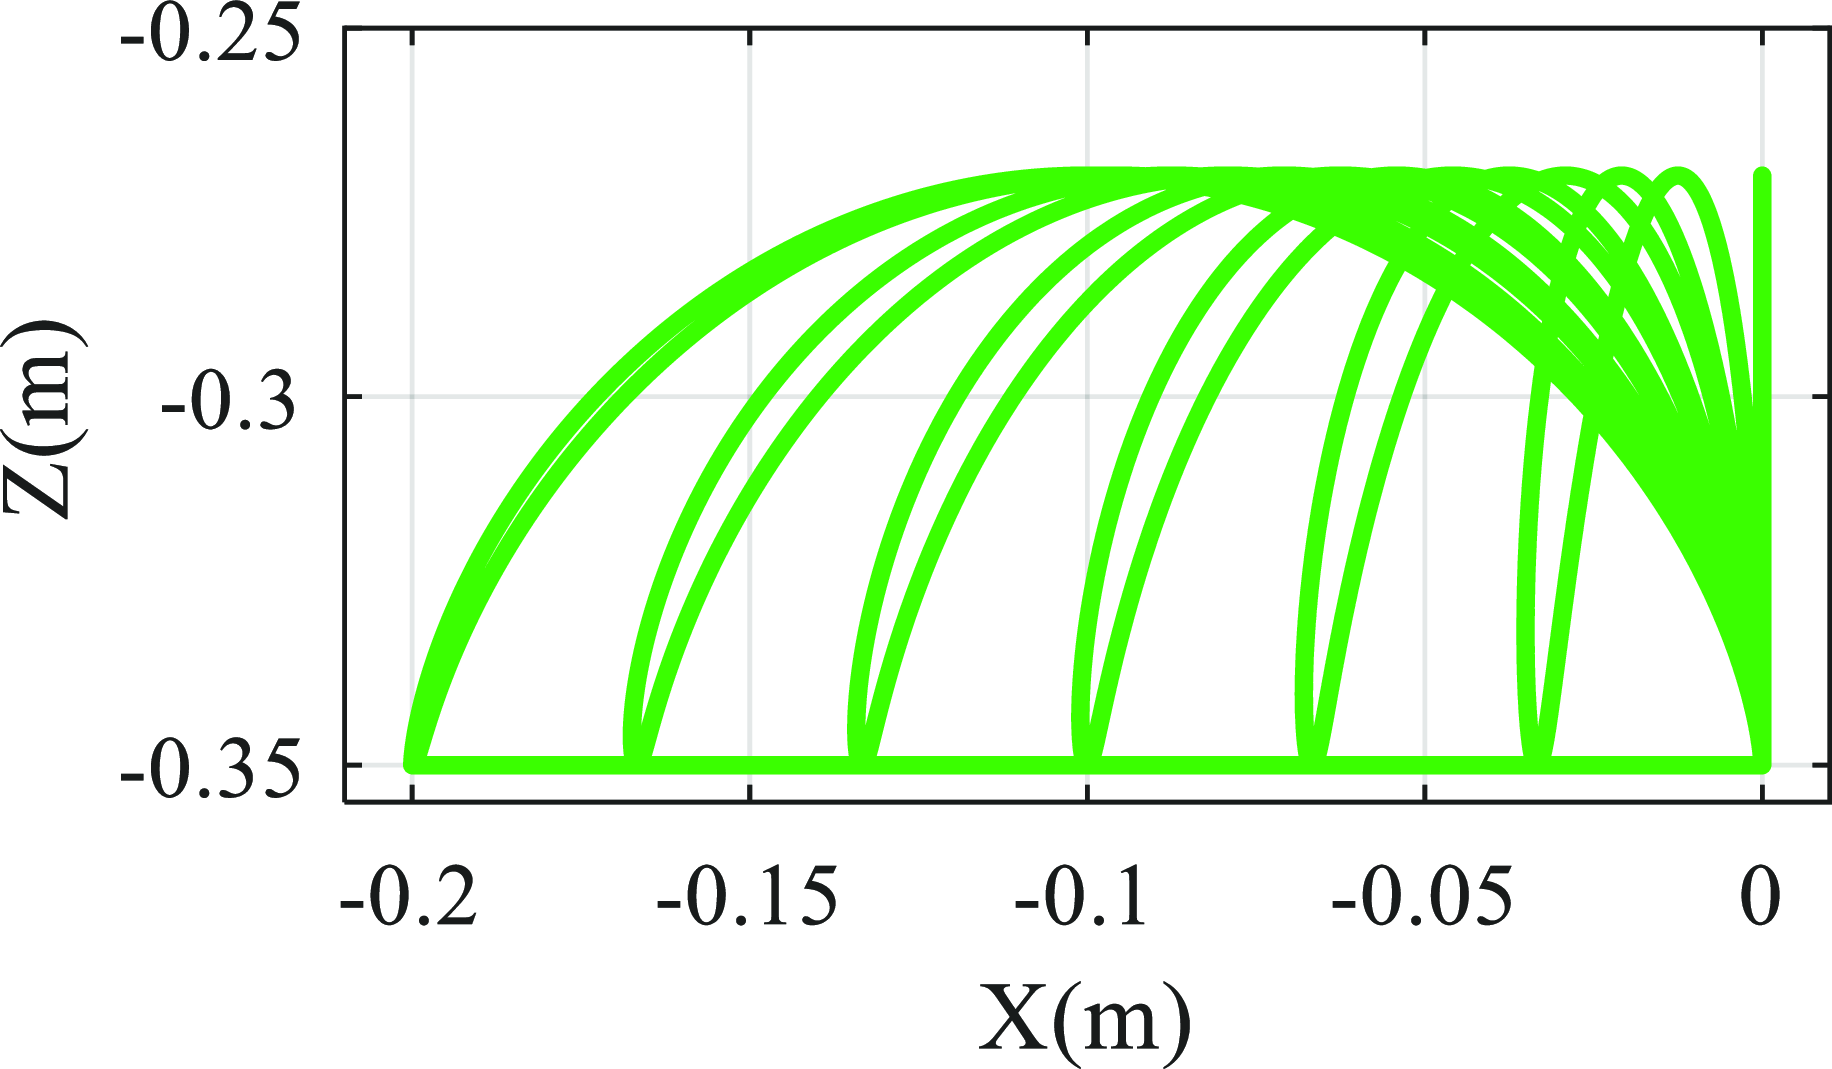
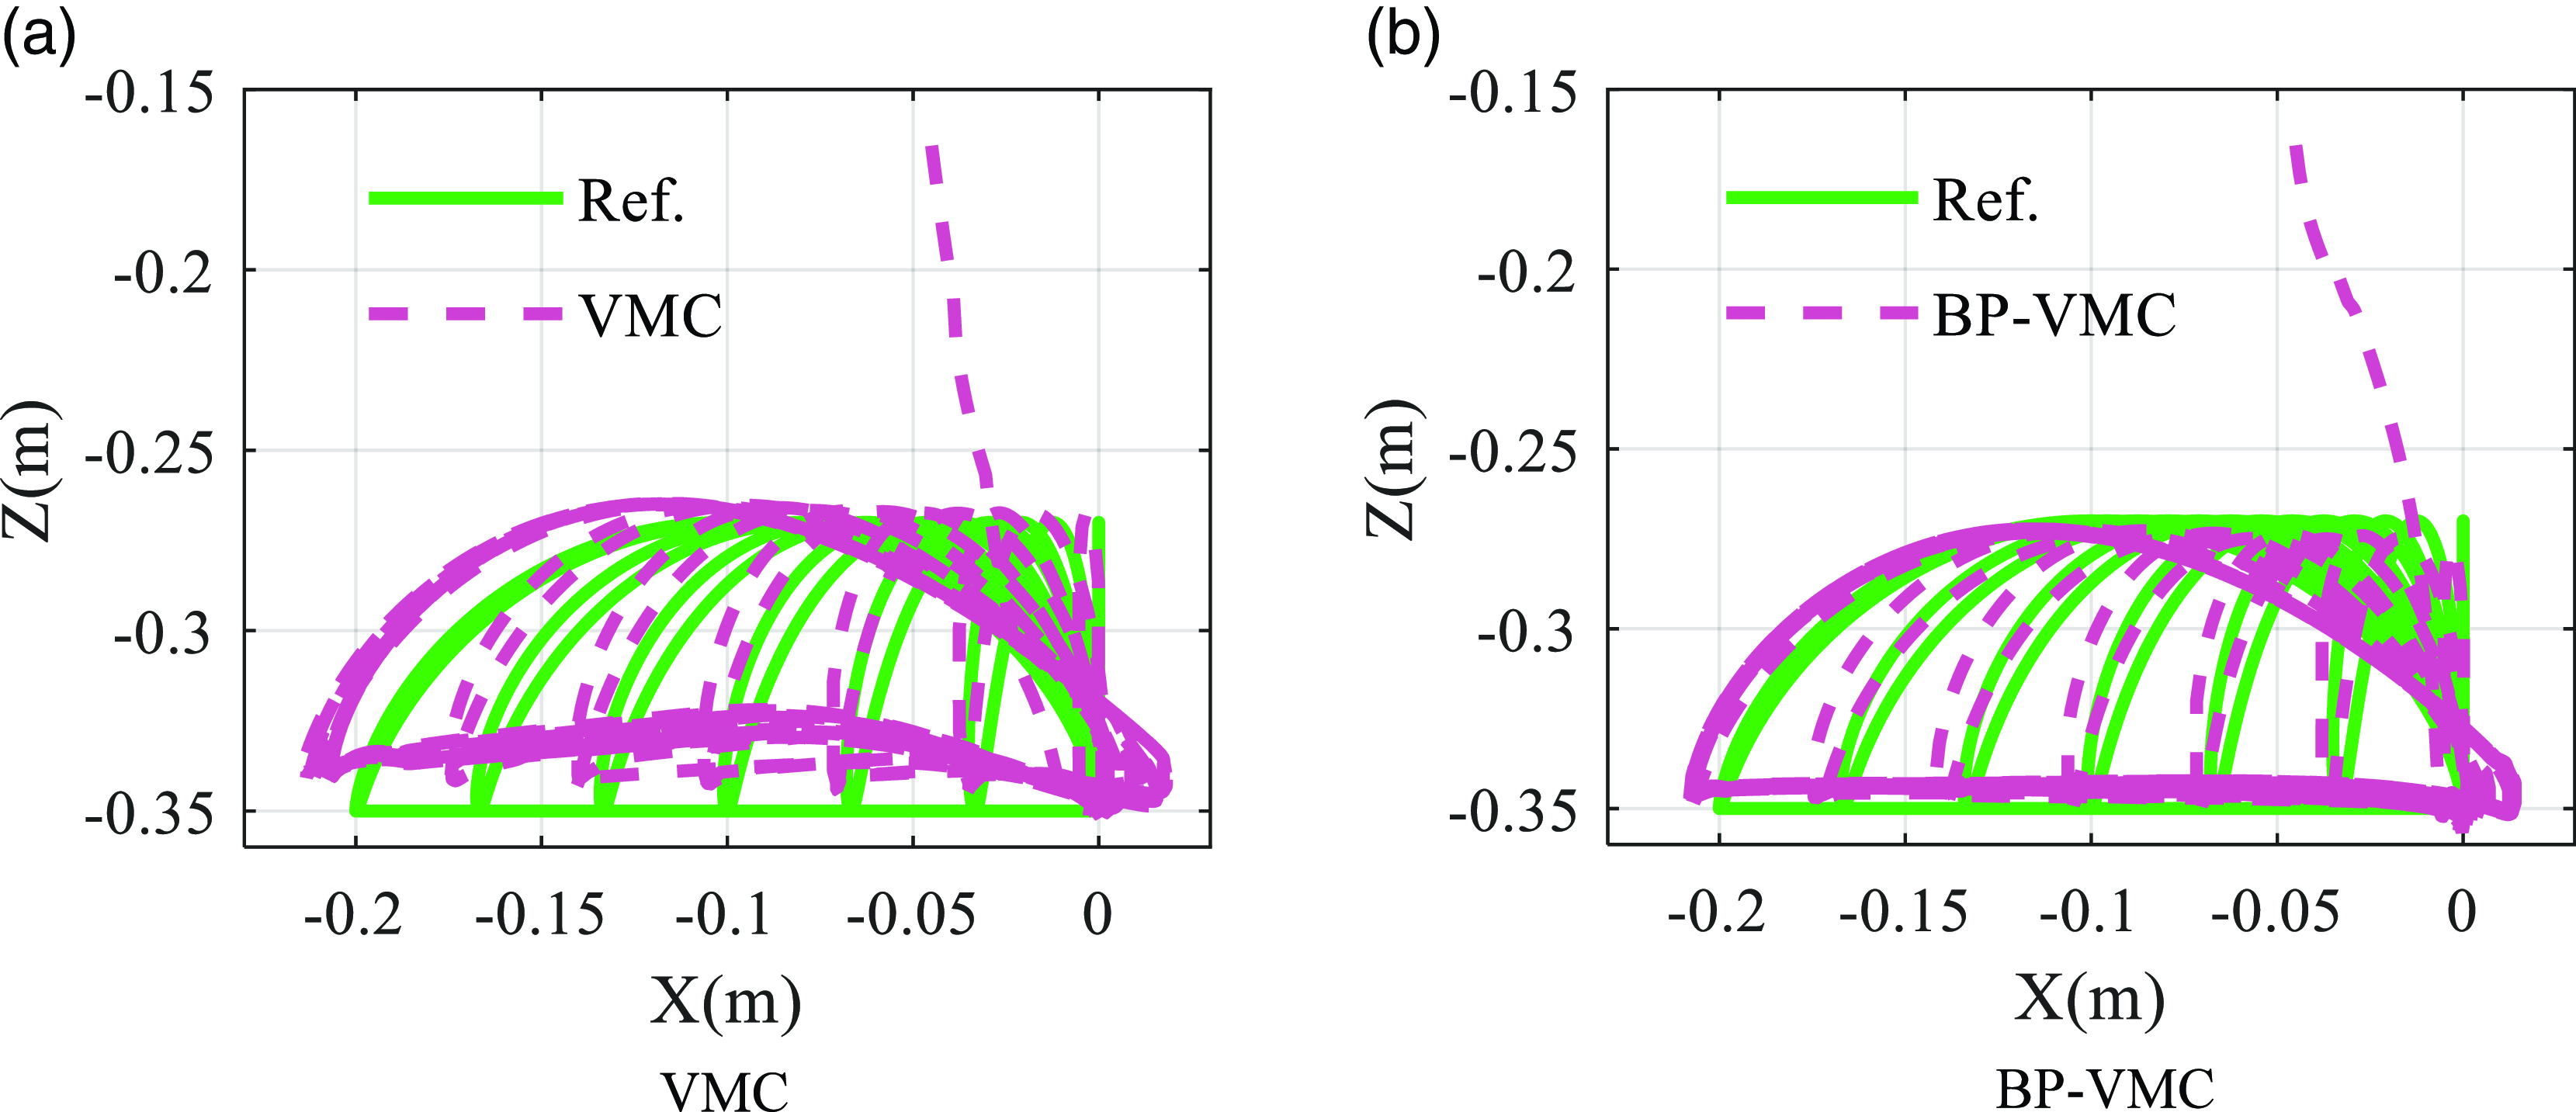
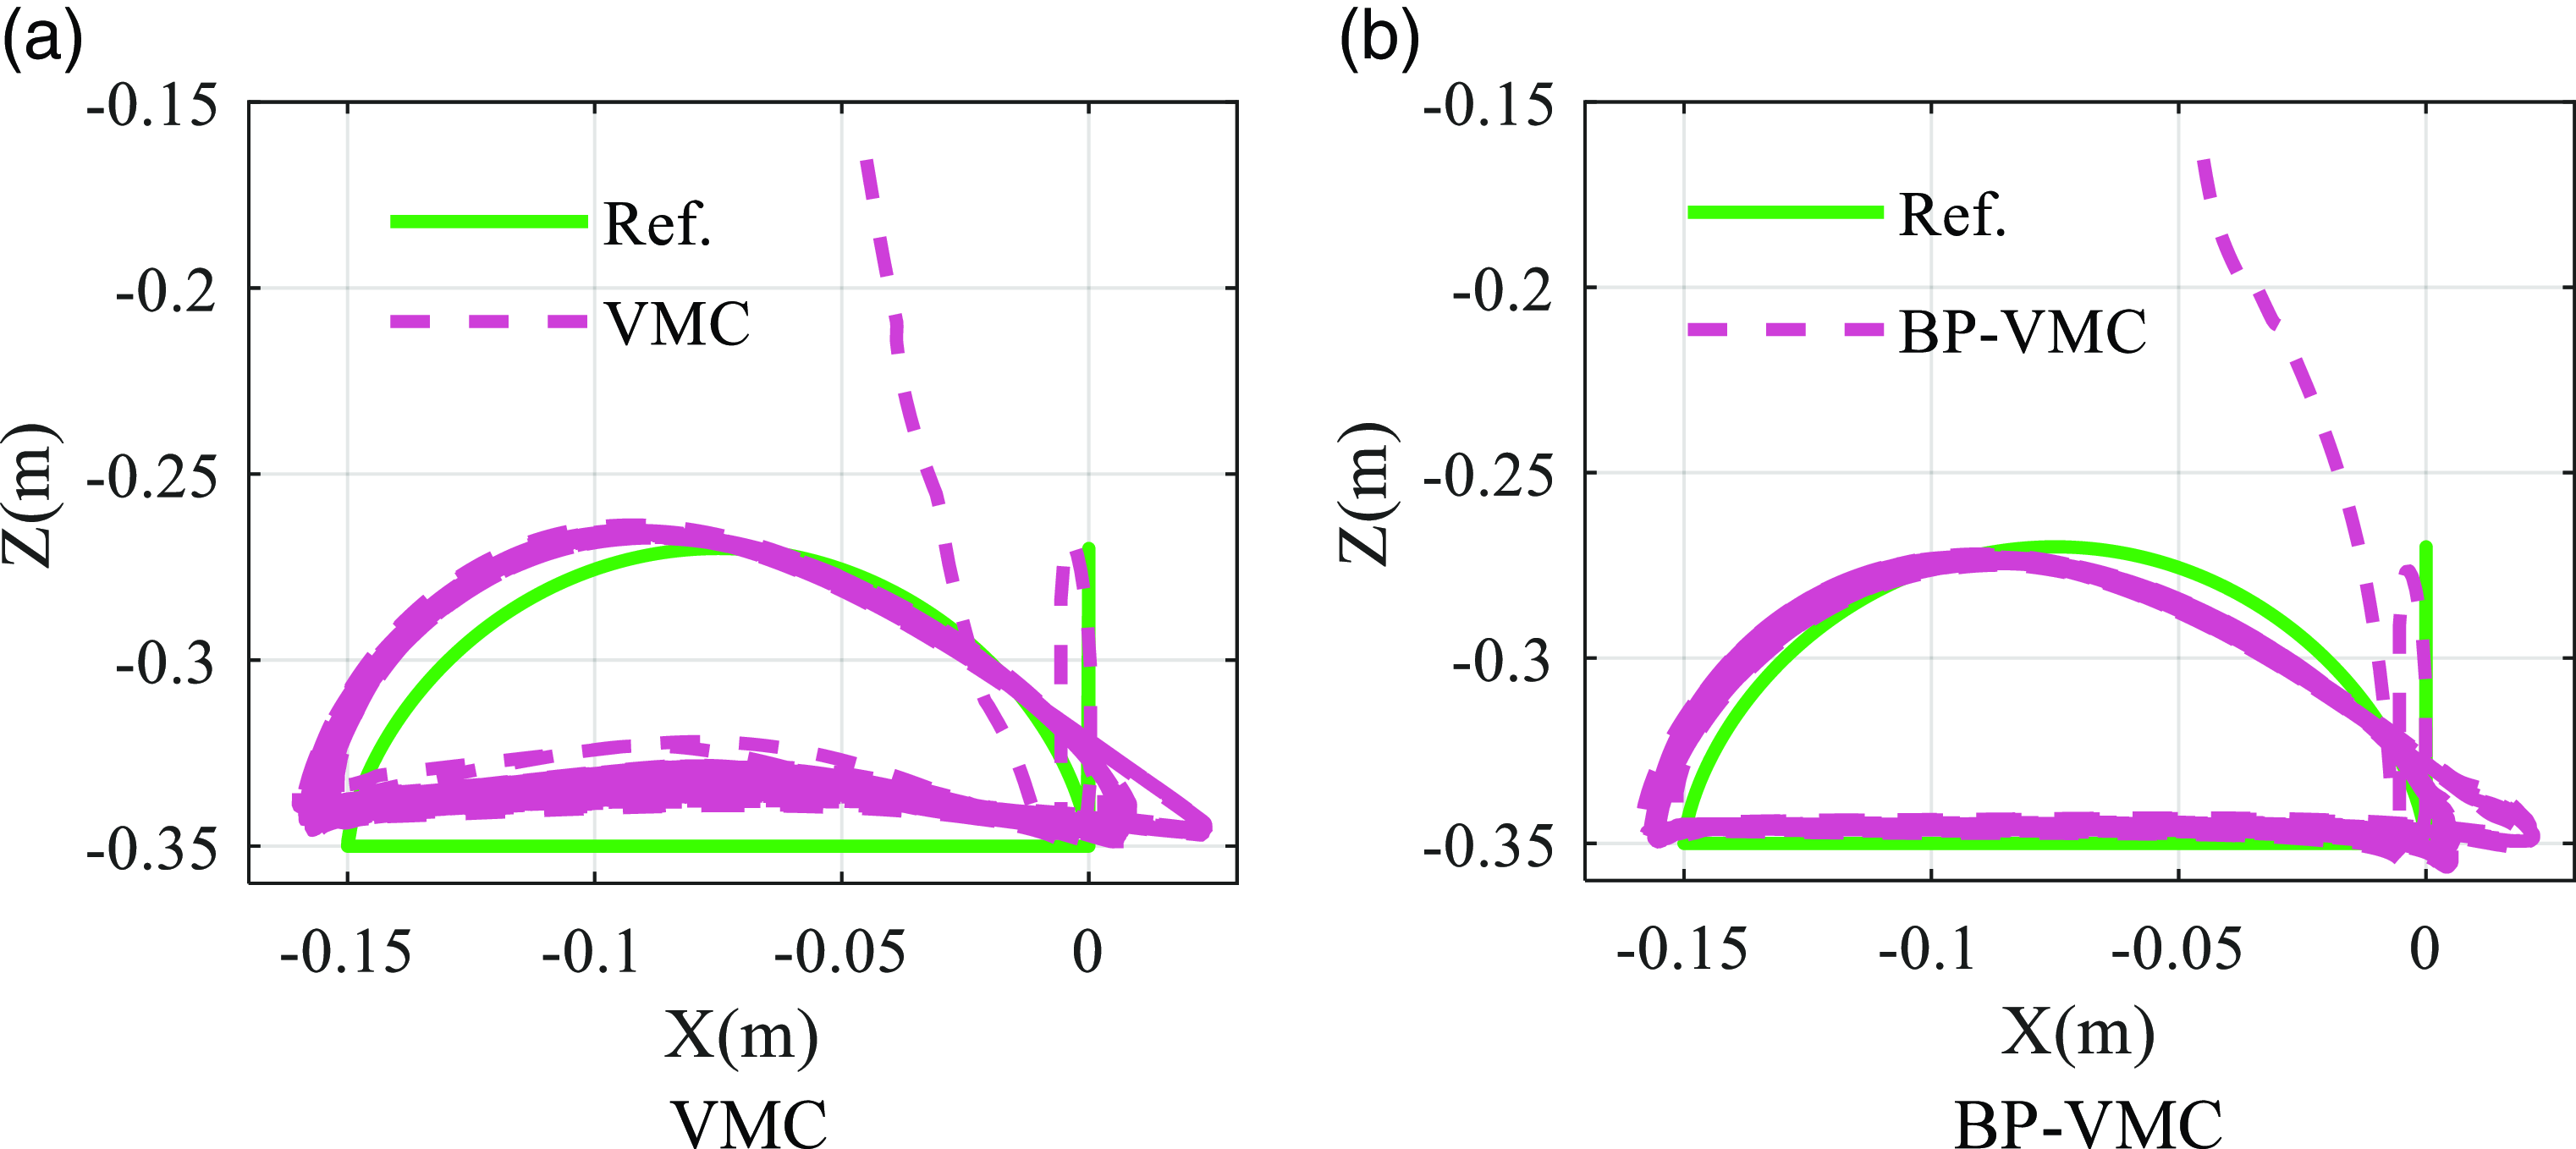
During the simulation process, the stride length of the robot’s foot movement varies with the change in tracking velocity, achieving velocity tracking. Based on the above simulation results, the foot trajectory curves of VMC and BP-VMC are plotted separately, as shown in Figure 25.
Foot-end movement trajectory.

Observing the foot trajectory curve of VMC, while its overall shape resembles the desired trajectory curve, there are significant discrepancies in the precise numerical tracking. The curve overall has a noticeable offset compared to the reference curve, indicating a relatively obvious control error in the motion control. Additionally, during the support phase, there are pronounced fluctuations in the height of the foot-end, which leads to significant differences in the lower part of the VMC foot trajectory curve compared to the reference curve.
The foot trajectory curve of BP-VMC demonstrates a substantial degree of alignment with the desired trajectory curve. Throughout both the swing and support phases, the curve exhibits minimal deviation from the desired trajectory curve. In comparison to the foot trajectory curve of VMC, BP-VMC maintains a more stable foot height during the support phase, without obvious height fluctuations, and shows a greater consistency with the desired trajectory curve.
To more intuitively compare the trajectory tracking accuracy of the two controllers, the average geometric distance between the corresponding points on the simulation result curve and the reference trajectory curve is taken as the average tracking error.
 \begin{equation} \overline{D}=\frac{\sum _{i=0}^{n}\sqrt{\left(x_{i}-X_{i}\right)^{2}+\left(y_{i}-Y_{i}\right)^{2}}}{n} \end{equation}
where (x i , y i ) represents the point on the simulation result curve and (X i , Y i ) represents the point on the reference trajectory curve.
Based on this, the average tracking errors for VMC and BP-VMC are, respectively, obtained as follows:
 $\overline{D}_{VMC}=1.448\times 10^{-2}, \overline{D}_{BP-VMC}=0.974\times 10^{-2}$
(m)
The tracking error of BP-VMC is 67.27% of VMC’s. Combining the comparison of the curve results in Figure 25, it can be seen that the control accuracy and stability of BP-VMC are significantly better than VMC, achieving more precise foot trajectory tracking control.
6.3 Velocity tracking
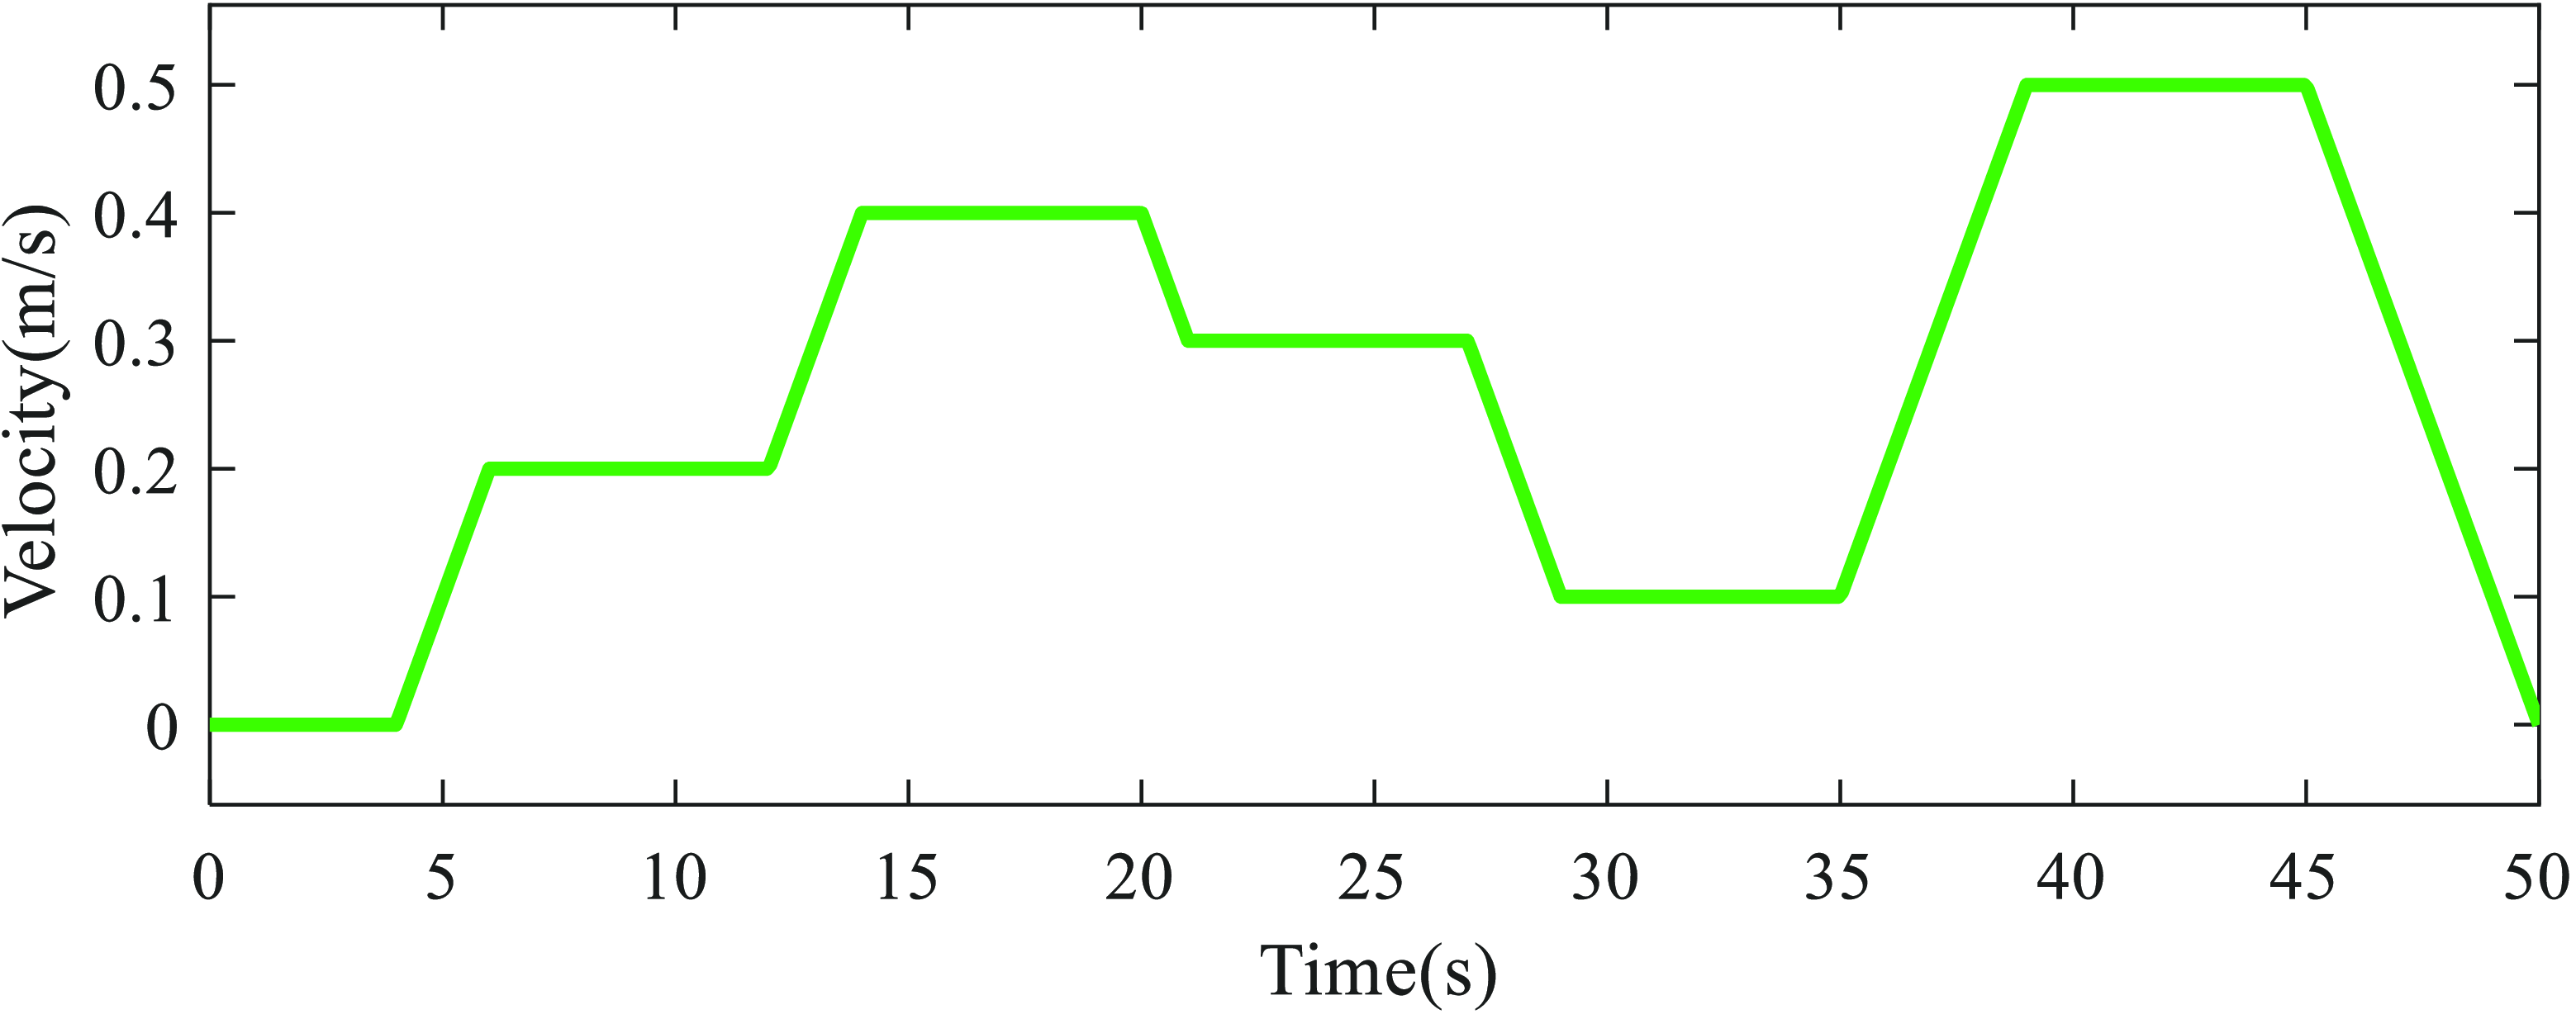
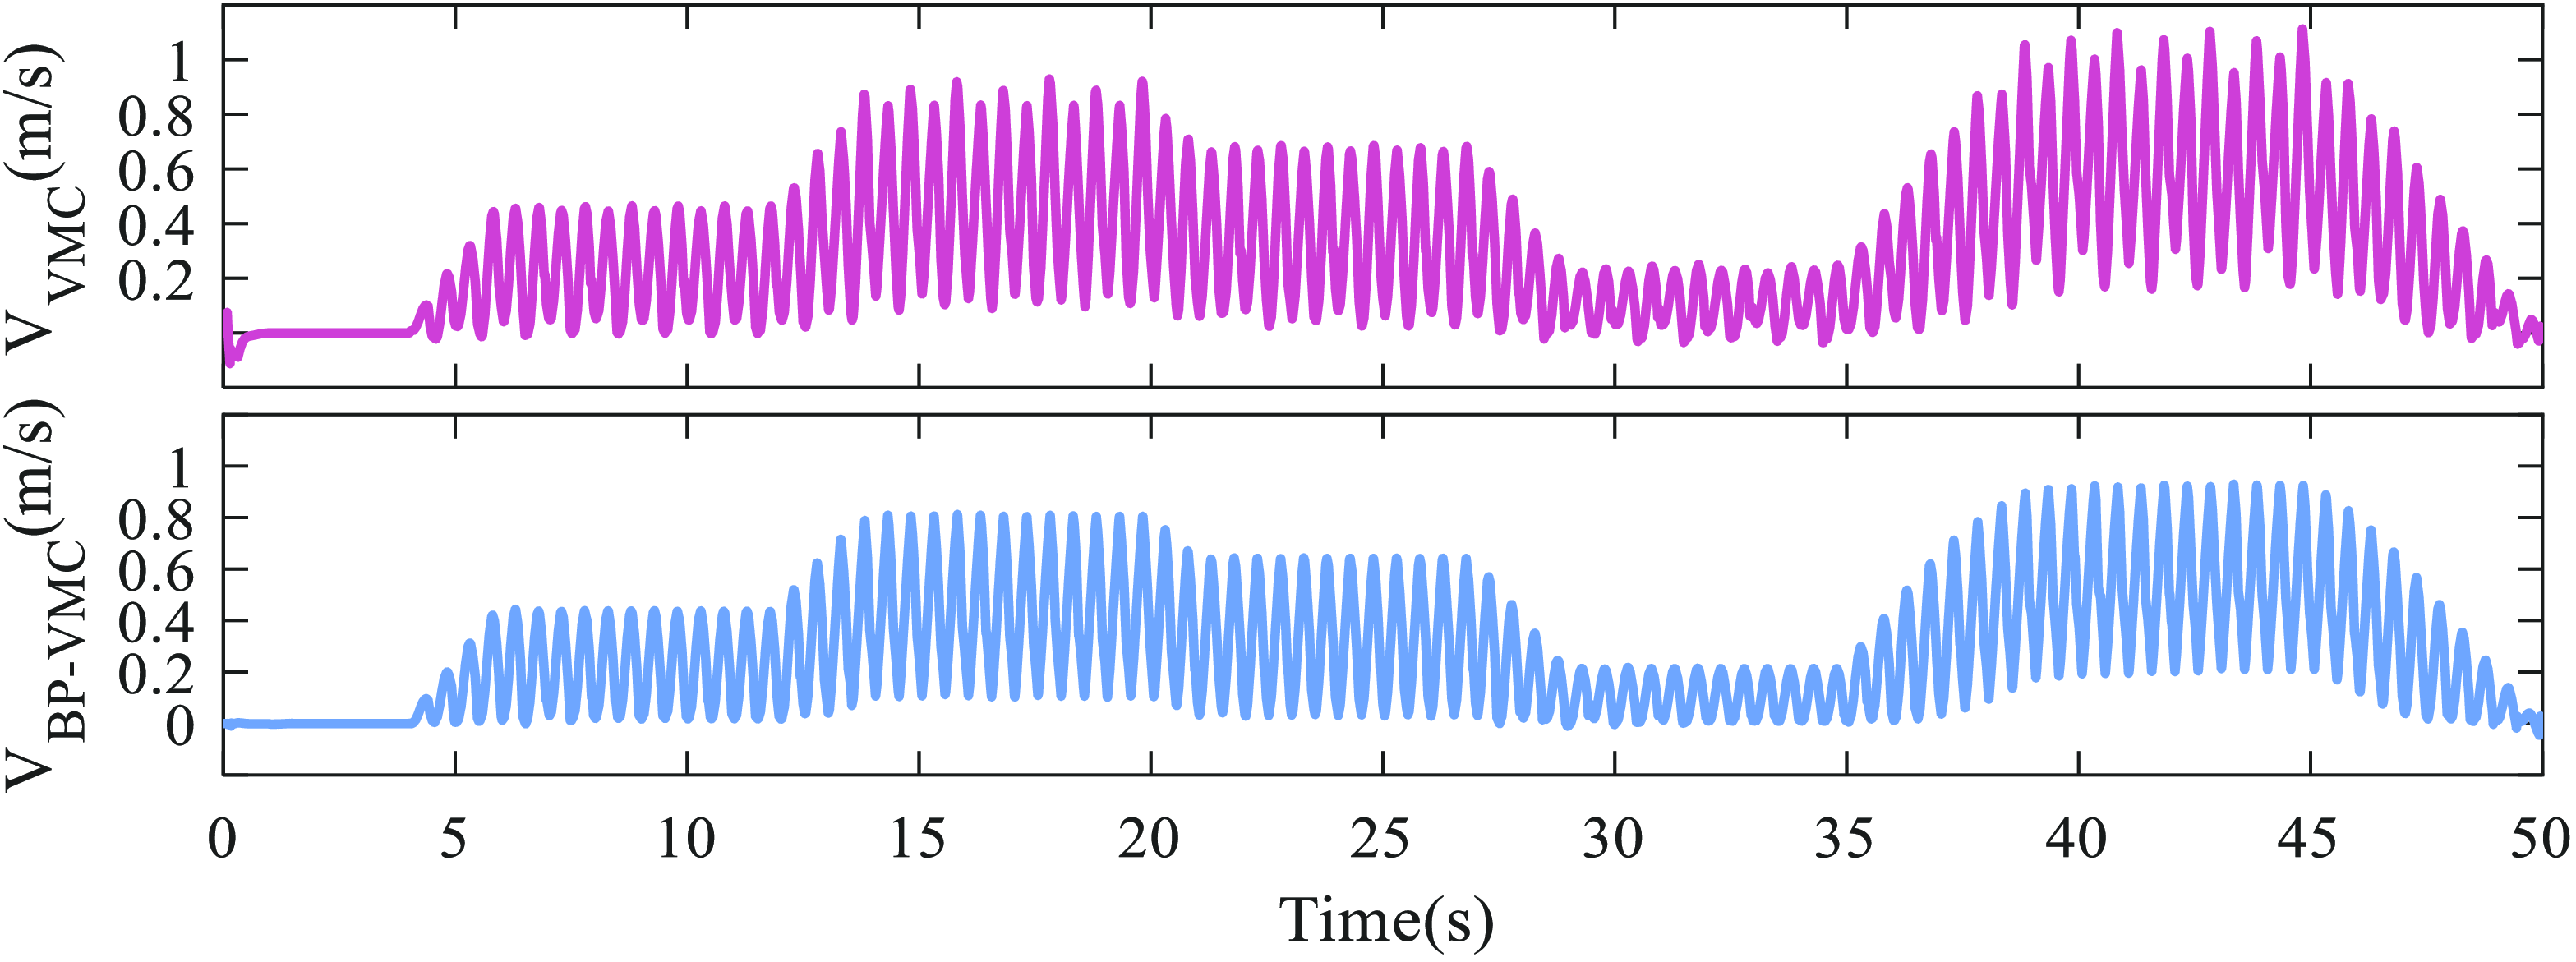
In addition to trajectory tracking, velocity tracking constitutes a vital aspect of motion control in quadruped robots. In the velocity tracking simulation experiment, the velocity curve depicted in Figure 26 represents the desired tracking velocity, which incorporates various velocity values and working conditions during both the acceleration and deceleration phases. The resultant centroid velocity curve is depicted in Figure 27. During the trotting gait, the two diagonal pairs of legs alternate between supporting and swinging phases. This transition between legs results in fluctuations in the centroid velocity, due to the reaction force generated when the swinging leg makes contact with the ground.
The desired velocity curve for velocity tracking.

Centroid forward velocity in the direction of motion.

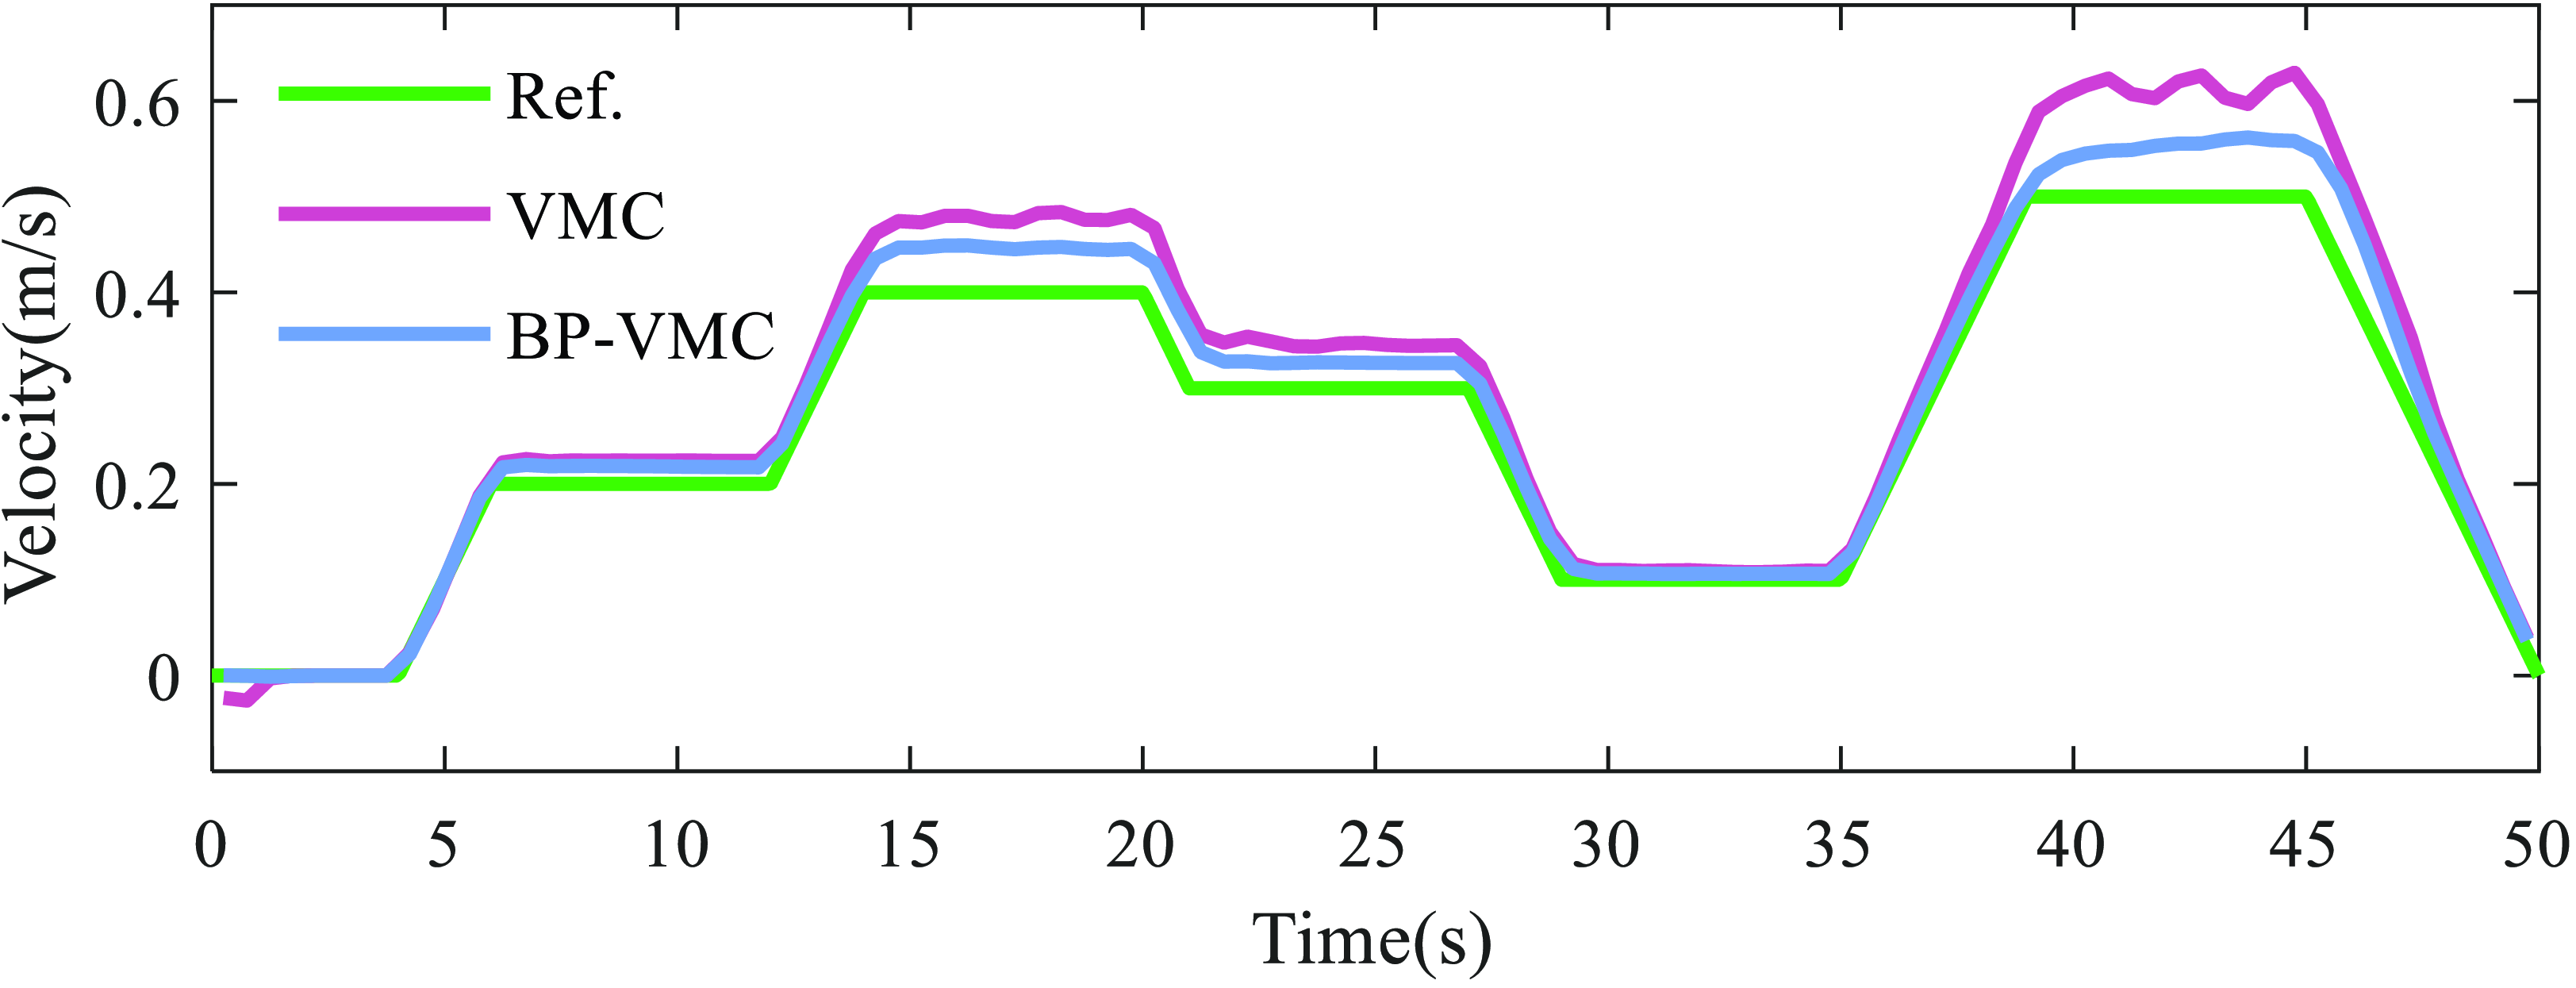
To facilitate a more intuitive comparison between the velocity curve from the robot and the desired motion velocity curve, the centroid velocity curve is subjected to smoothing. By designating one swing phase cycle as the sampling period, the simulation time is partitioned into n cycles, during which the displacement of the robot is documented for each cycle. This methodology enables the calculation of the average velocity for each cycle, yielding a sequence of discrete velocity points arranged in chronological order. Subsequently, these points are interconnected with a smooth curve to effectively illustrate the velocity curve throughout the robot simulation process.
 \begin{equation*} \begin{array}{l@{\quad}l@{\quad}l} t=T_{SW} &, & n=\frac{T}{t} \end{array} \end{equation*}
 \begin{equation} \left\{\begin{array}{l} \Delta x_{i}=X\left(i\right)-X\left(i-1\right)\\ \overline{v}_{i}=\frac{\Delta x_{i}}{t} \end{array}\right.\begin{array}{l@{\quad}l} & i=1,2,\ldots, n \end{array} \end{equation}
where T is the total simulation time and X(i) is the position of the robot recorded during the ith cycle.
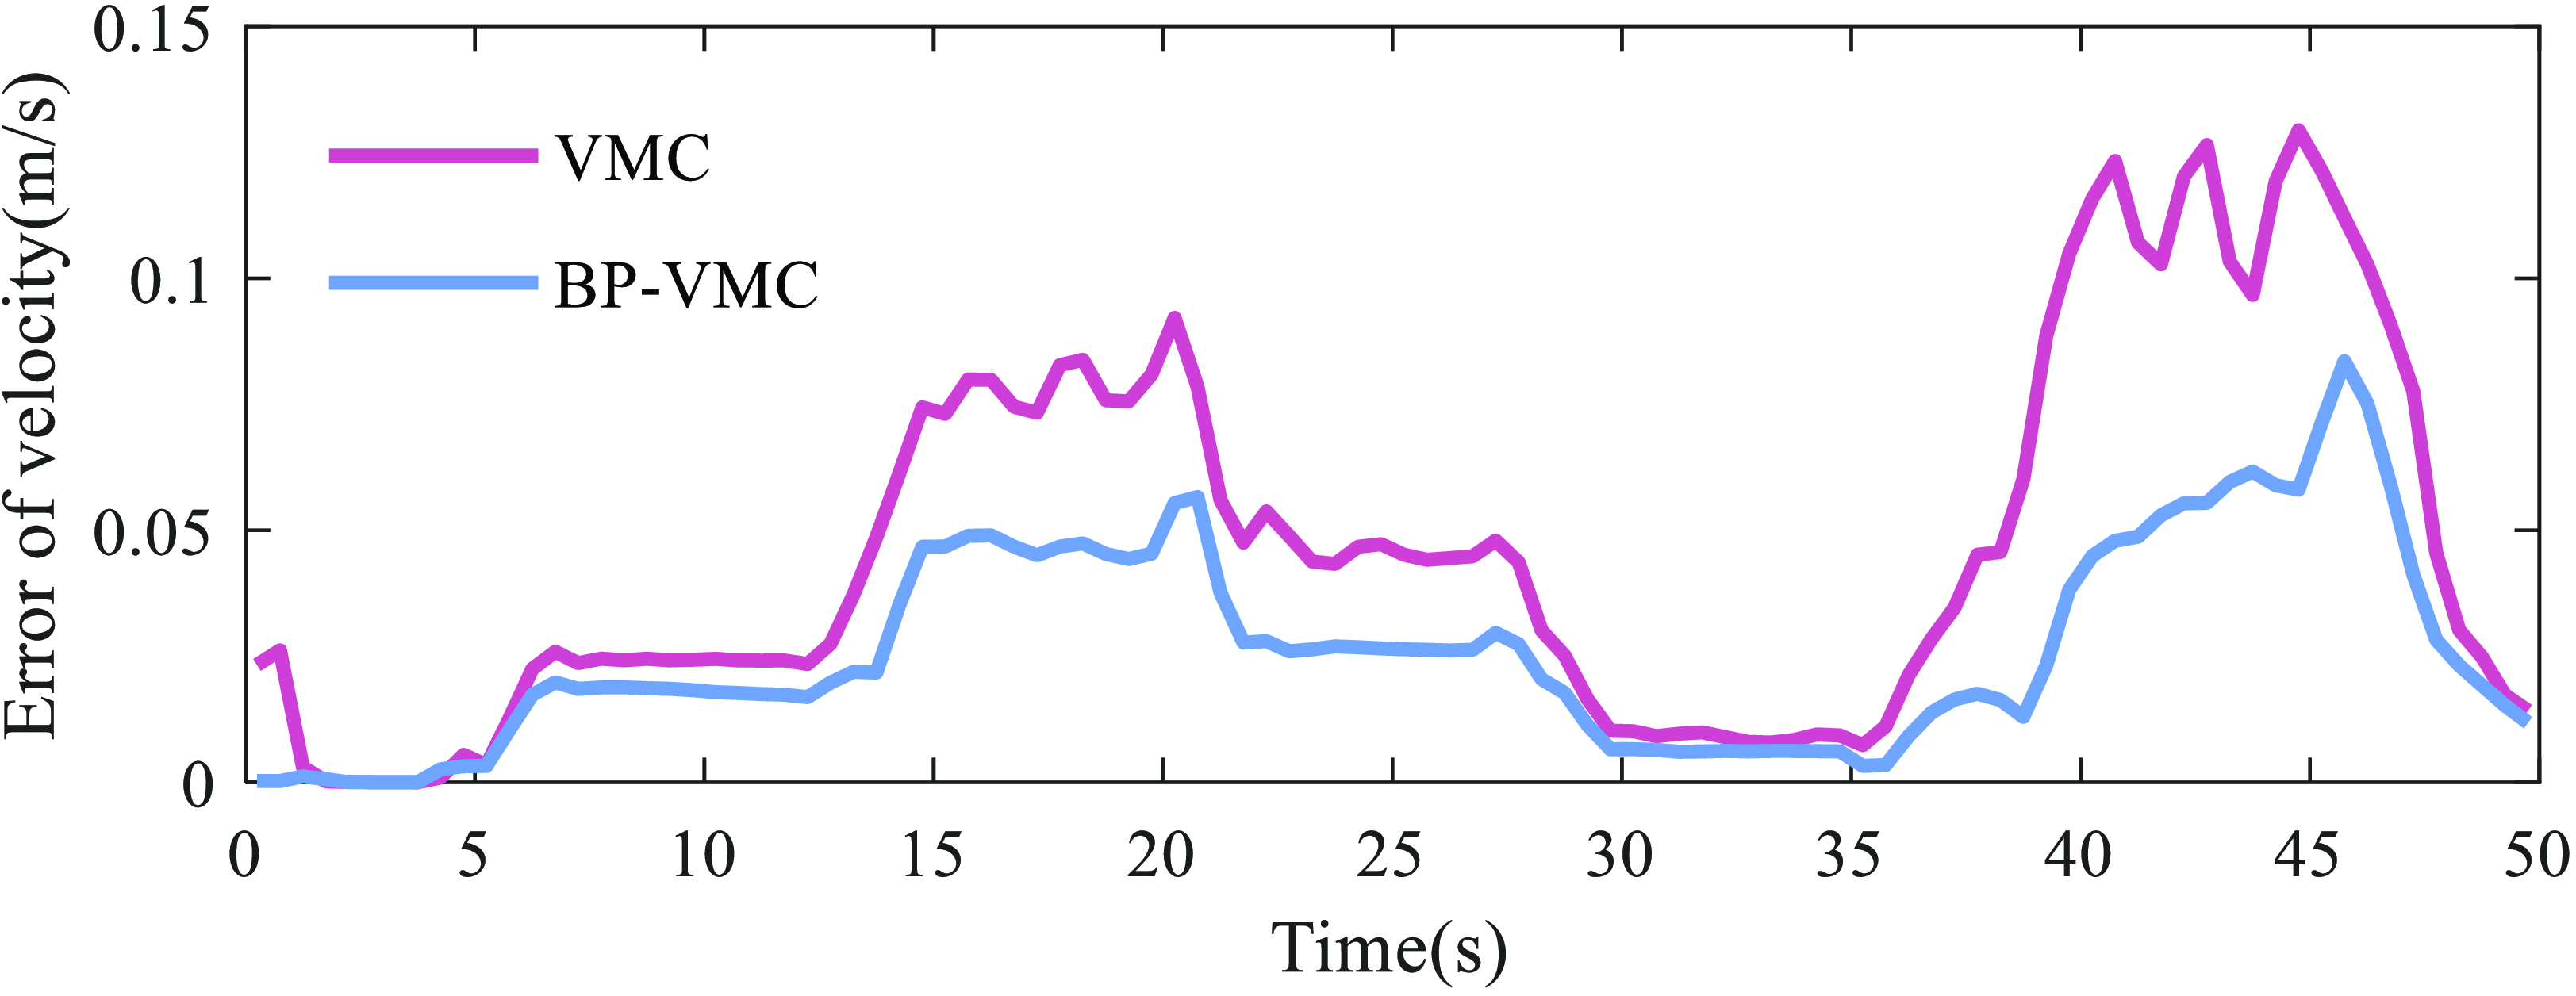
Consequently, the centroid velocity curves and error curves presented in Figures 28 and 29 have been derived. At tracking velocities of 0.1 and 0.2 m/s, both VMC and BP-VMC demonstrate the capability to sustain velocity tracking with tiny errors and stable outputs. However, as the tracking velocity exceeds 0.3 m/s, there is a noticeable increase in tracking error values, accompanied by significant fluctuations in the velocity curve of VMC. In contrast, BP-VMC continues to exhibit a relatively stable velocity output, thereby indicating its superior control stability in comparison to VMC. This suggests that BP-VMC is more effective in maintaining a consistent velocity output across varying tracking conditions.
Average centroidal velocity within cycle.

Velocity tracking absolute error.

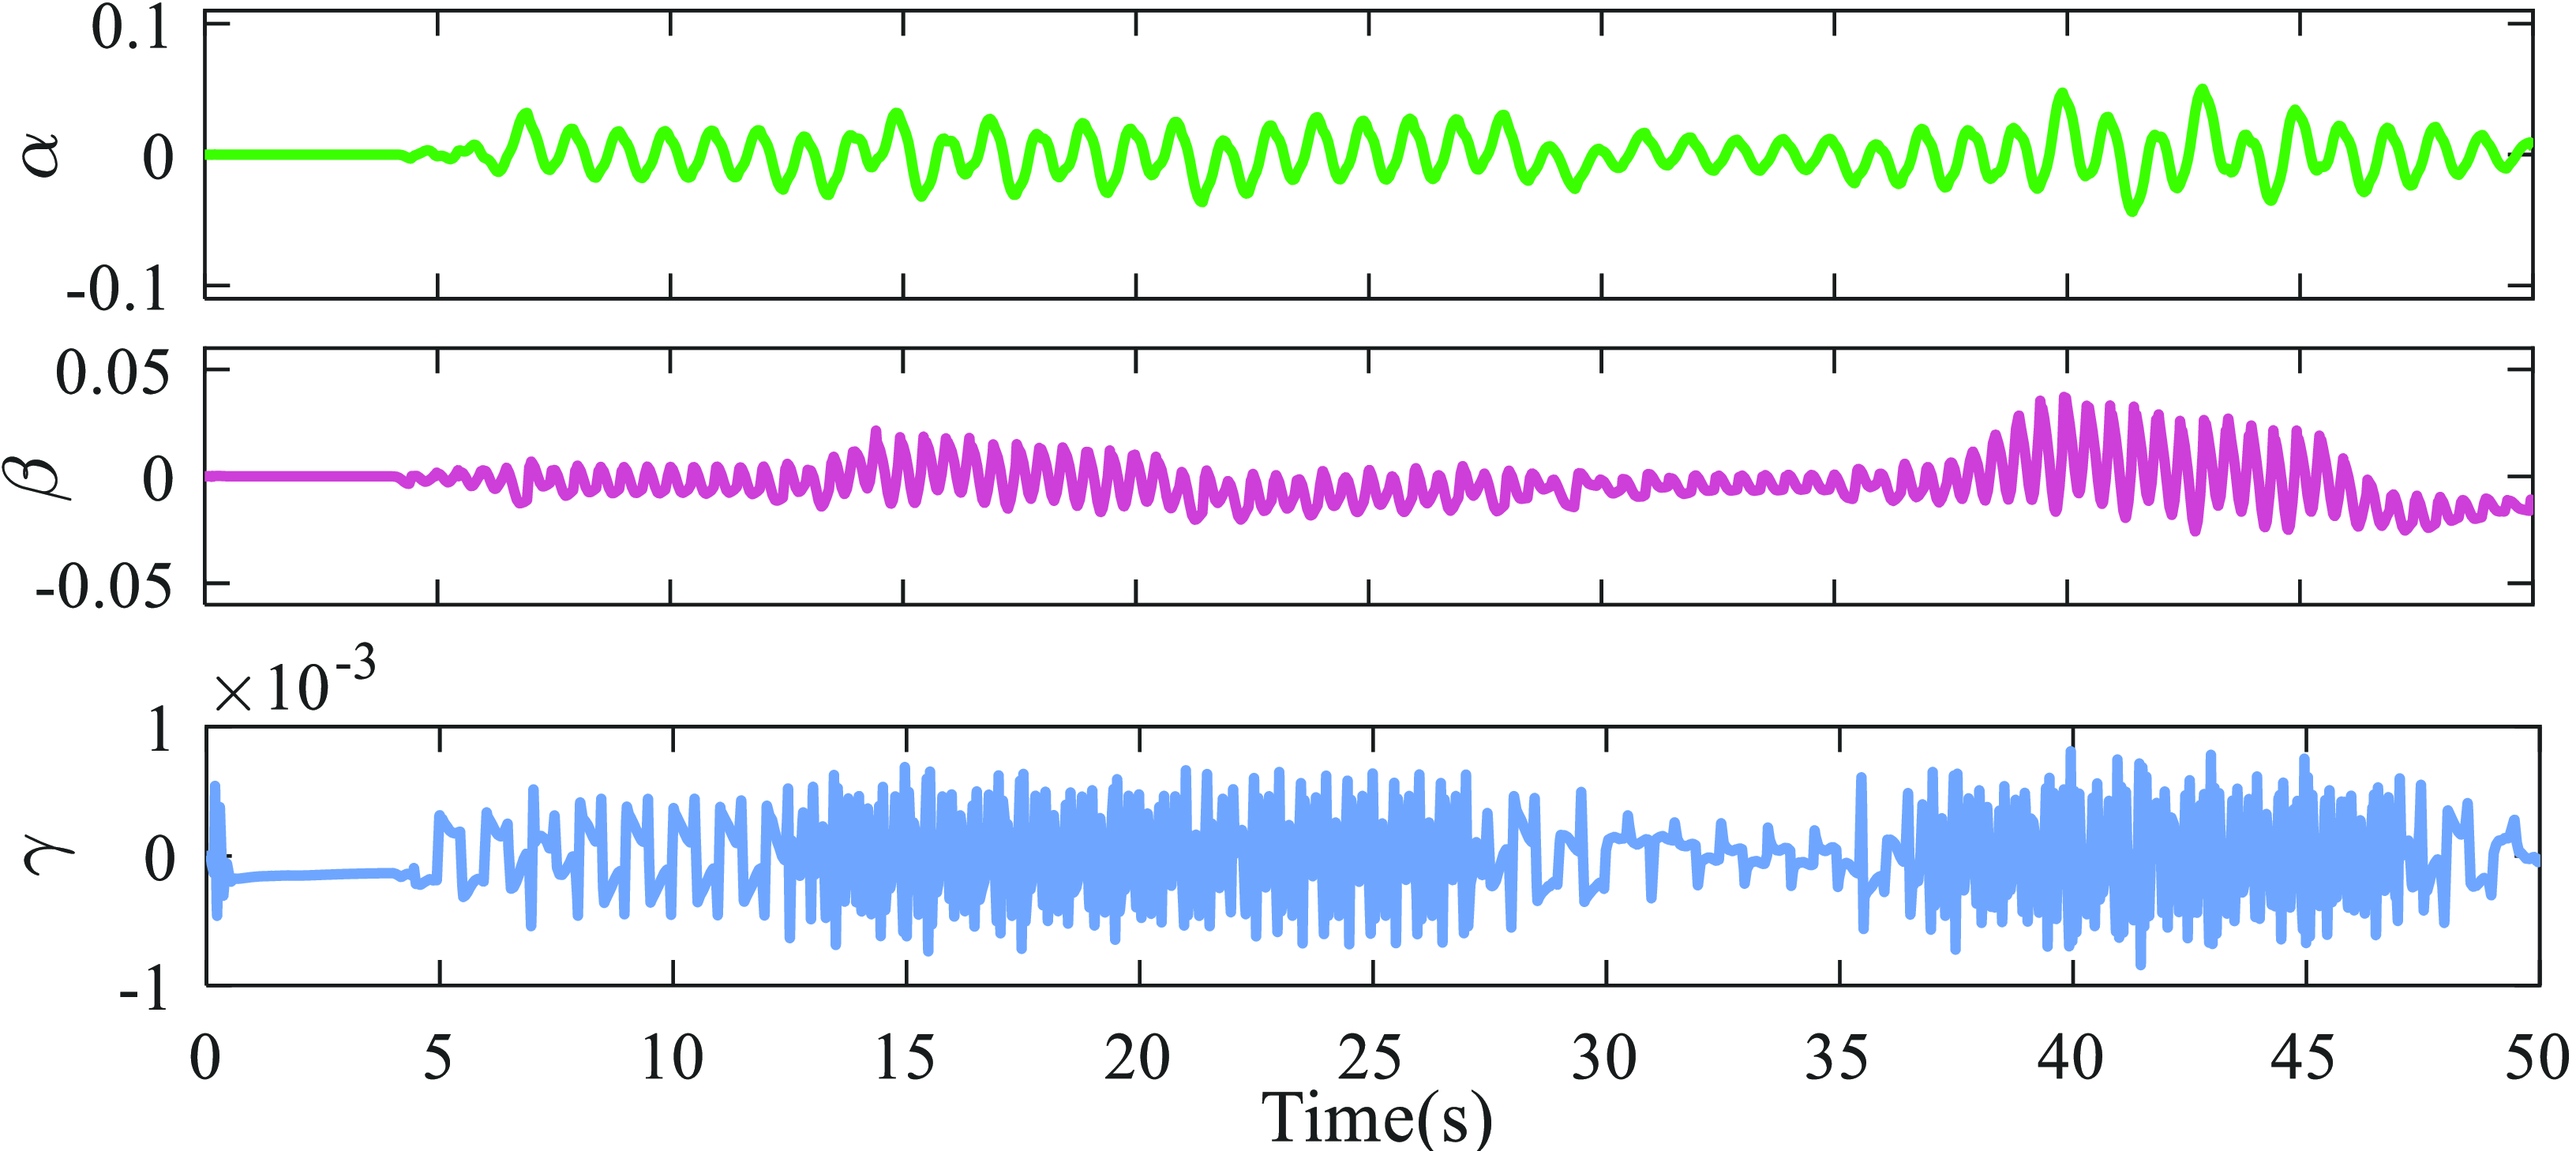
VMC attitude angle.

To more intuitively compare the accuracy of velocity tracking errors between VMC and BP-VMC, the RMSE is used to quantify their velocity tracking errors.
 \begin{equation} \begin{array}{l@{\quad}l} R=\sqrt{\frac{\sum _{i=1}^{n}{e_{i}}^{2}}{n}} & i=1,2,\ldots, n \end{array} \end{equation}
The calculated RMSE for VMC and BP-VMC are, respectively:
 \begin{equation*} R_{VMC}=5.914\times 10^{-2}, R_{BP-VMC}=3.278\times 10^{-2} \end{equation*}
The error value of BP-VMC is 55.43% of VMC’s, indicating that BP-VMC’s velocity tracking accuracy is optimized by 44.57% compared to VMC.
6.4 Stability analysis
The stability margin serves as a metric for evaluating a robot’s stability in a static condition; however, it is inadequate for assessing stability during locomotion. The stability of the robot’s body while in motion is linked to its attitude angles (
 $\alpha, \beta, \gamma$
) [Reference Guangrong, Sheng, Bowen and Junzheng39]. Consequently, the instability vector
 $\boldsymbol{\Delta }$
can be defined as the absolute deviation between the actual attitude angles of the robot’s body and the target angles. The instability associated with the robot’s movement can subsequently be quantified by computing the L2 norm of
 $\boldsymbol{\Delta }$
.
 \begin{equation} \boldsymbol{\Delta }=\left(\begin{array}{l@{\quad}l@{\quad}l} \left| \alpha _{i}-\alpha _{d}\right|, & \left| \beta _{i}-\beta _{d}\right|, & \left| \gamma _{i}-\gamma _{d}\right| \end{array}\right) \end{equation}
 \begin{equation} \left\| \boldsymbol{\Delta }\right\| _{2}=\sqrt{\left| \alpha _{i}-\alpha _{d}\right| ^{2}+\left| \beta _{i}-\beta _{d}\right| ^{2}+\left| \gamma _{i}-\gamma _{d}\right| ^{2}} \end{equation}
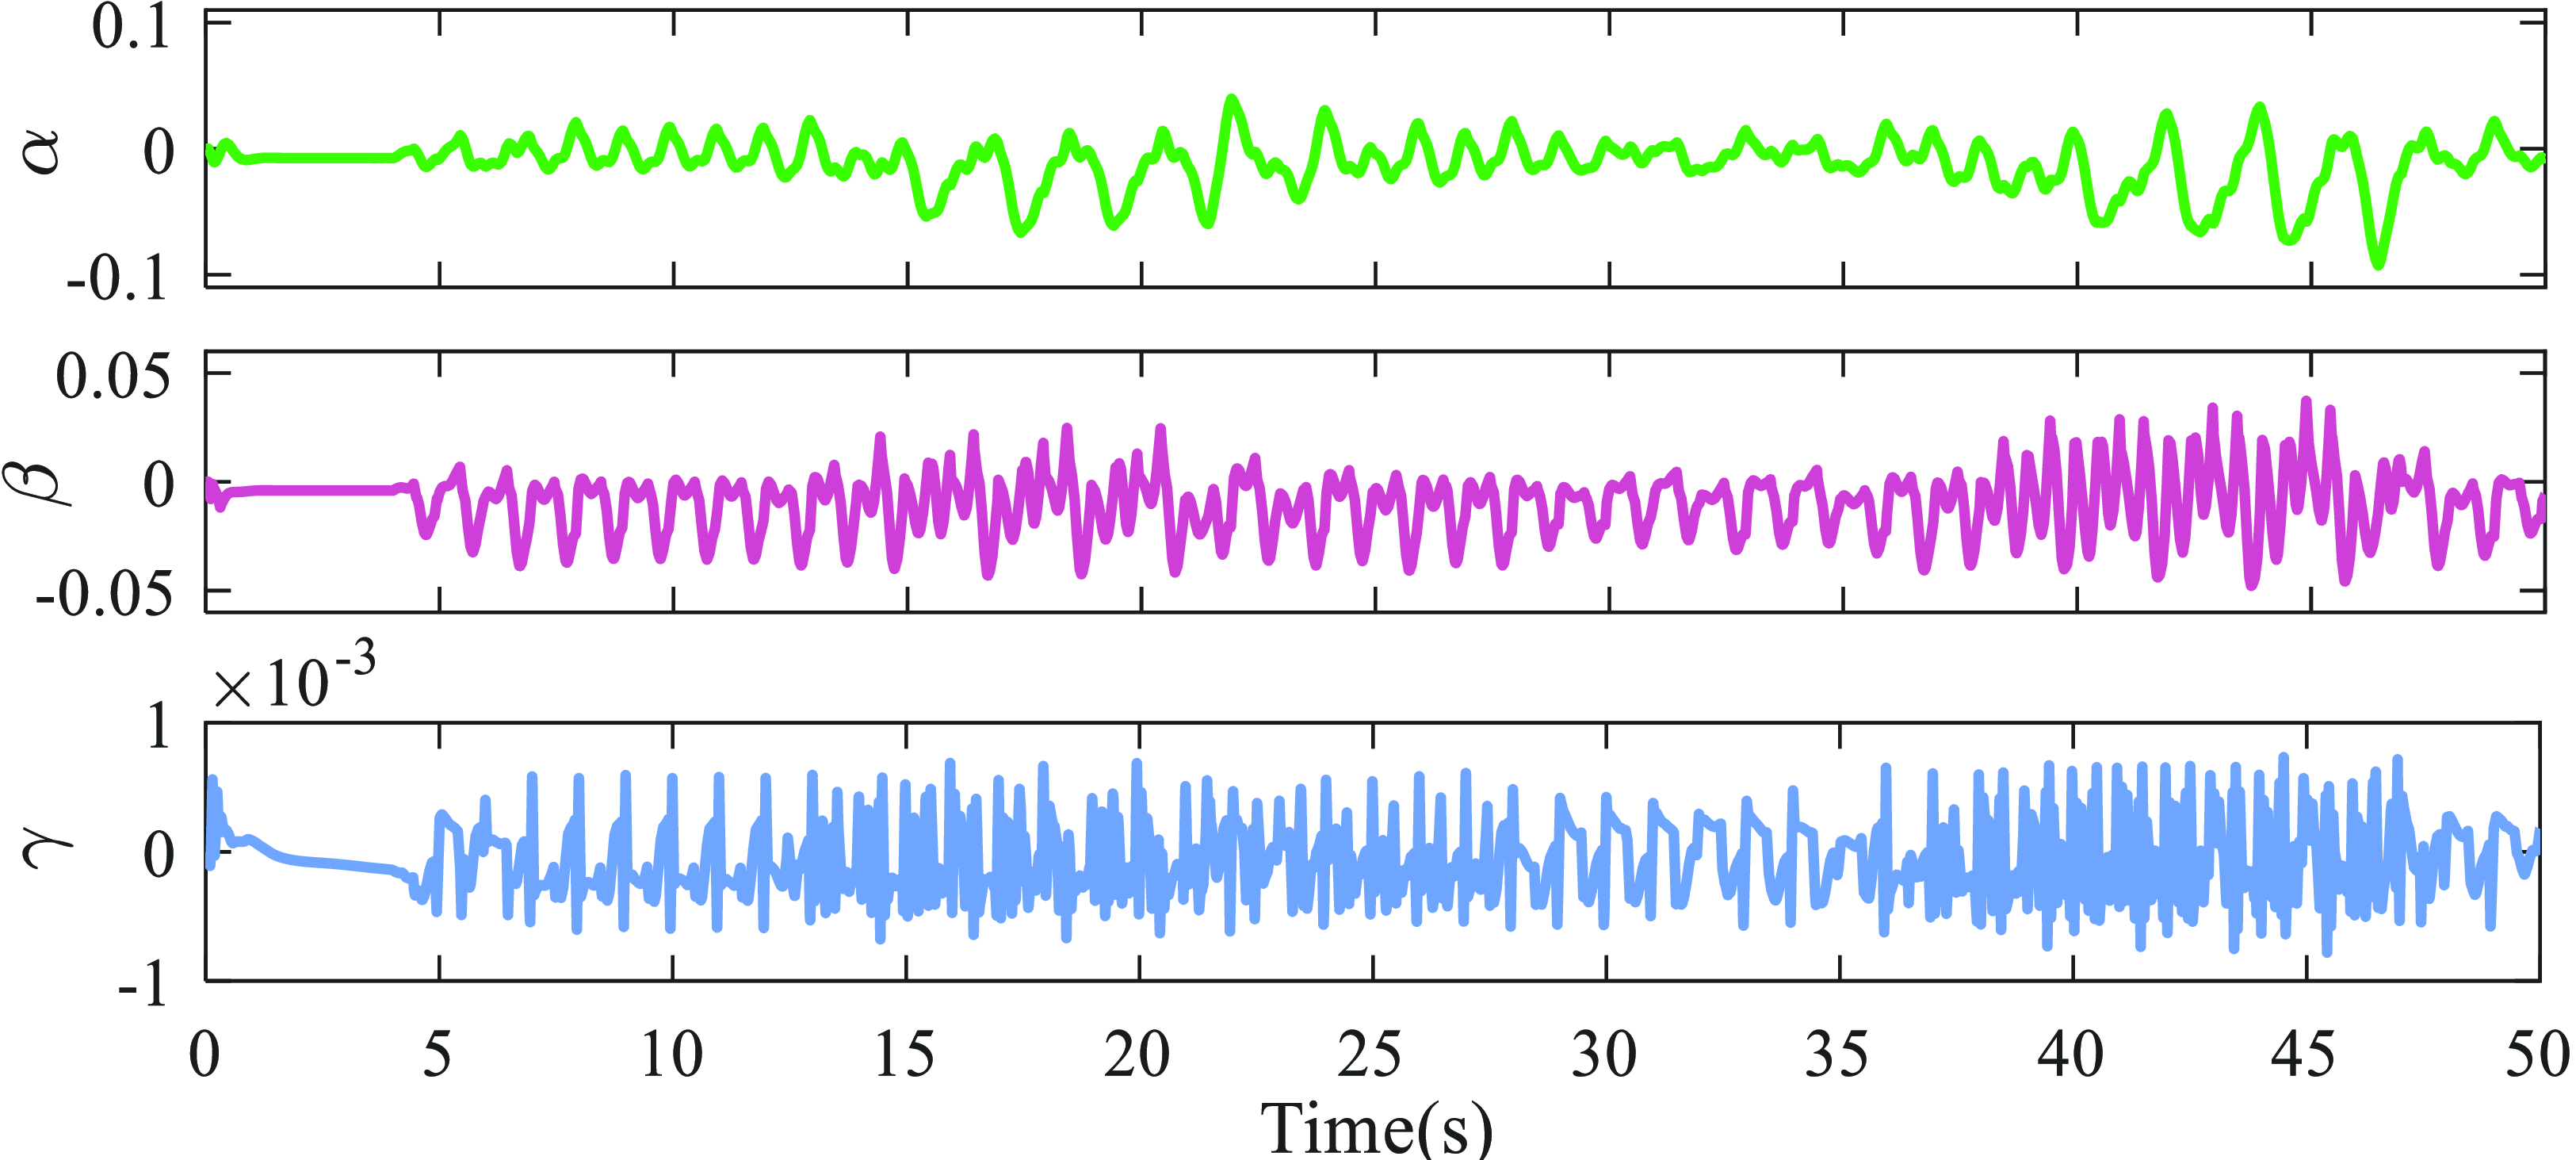
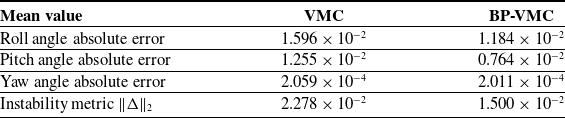
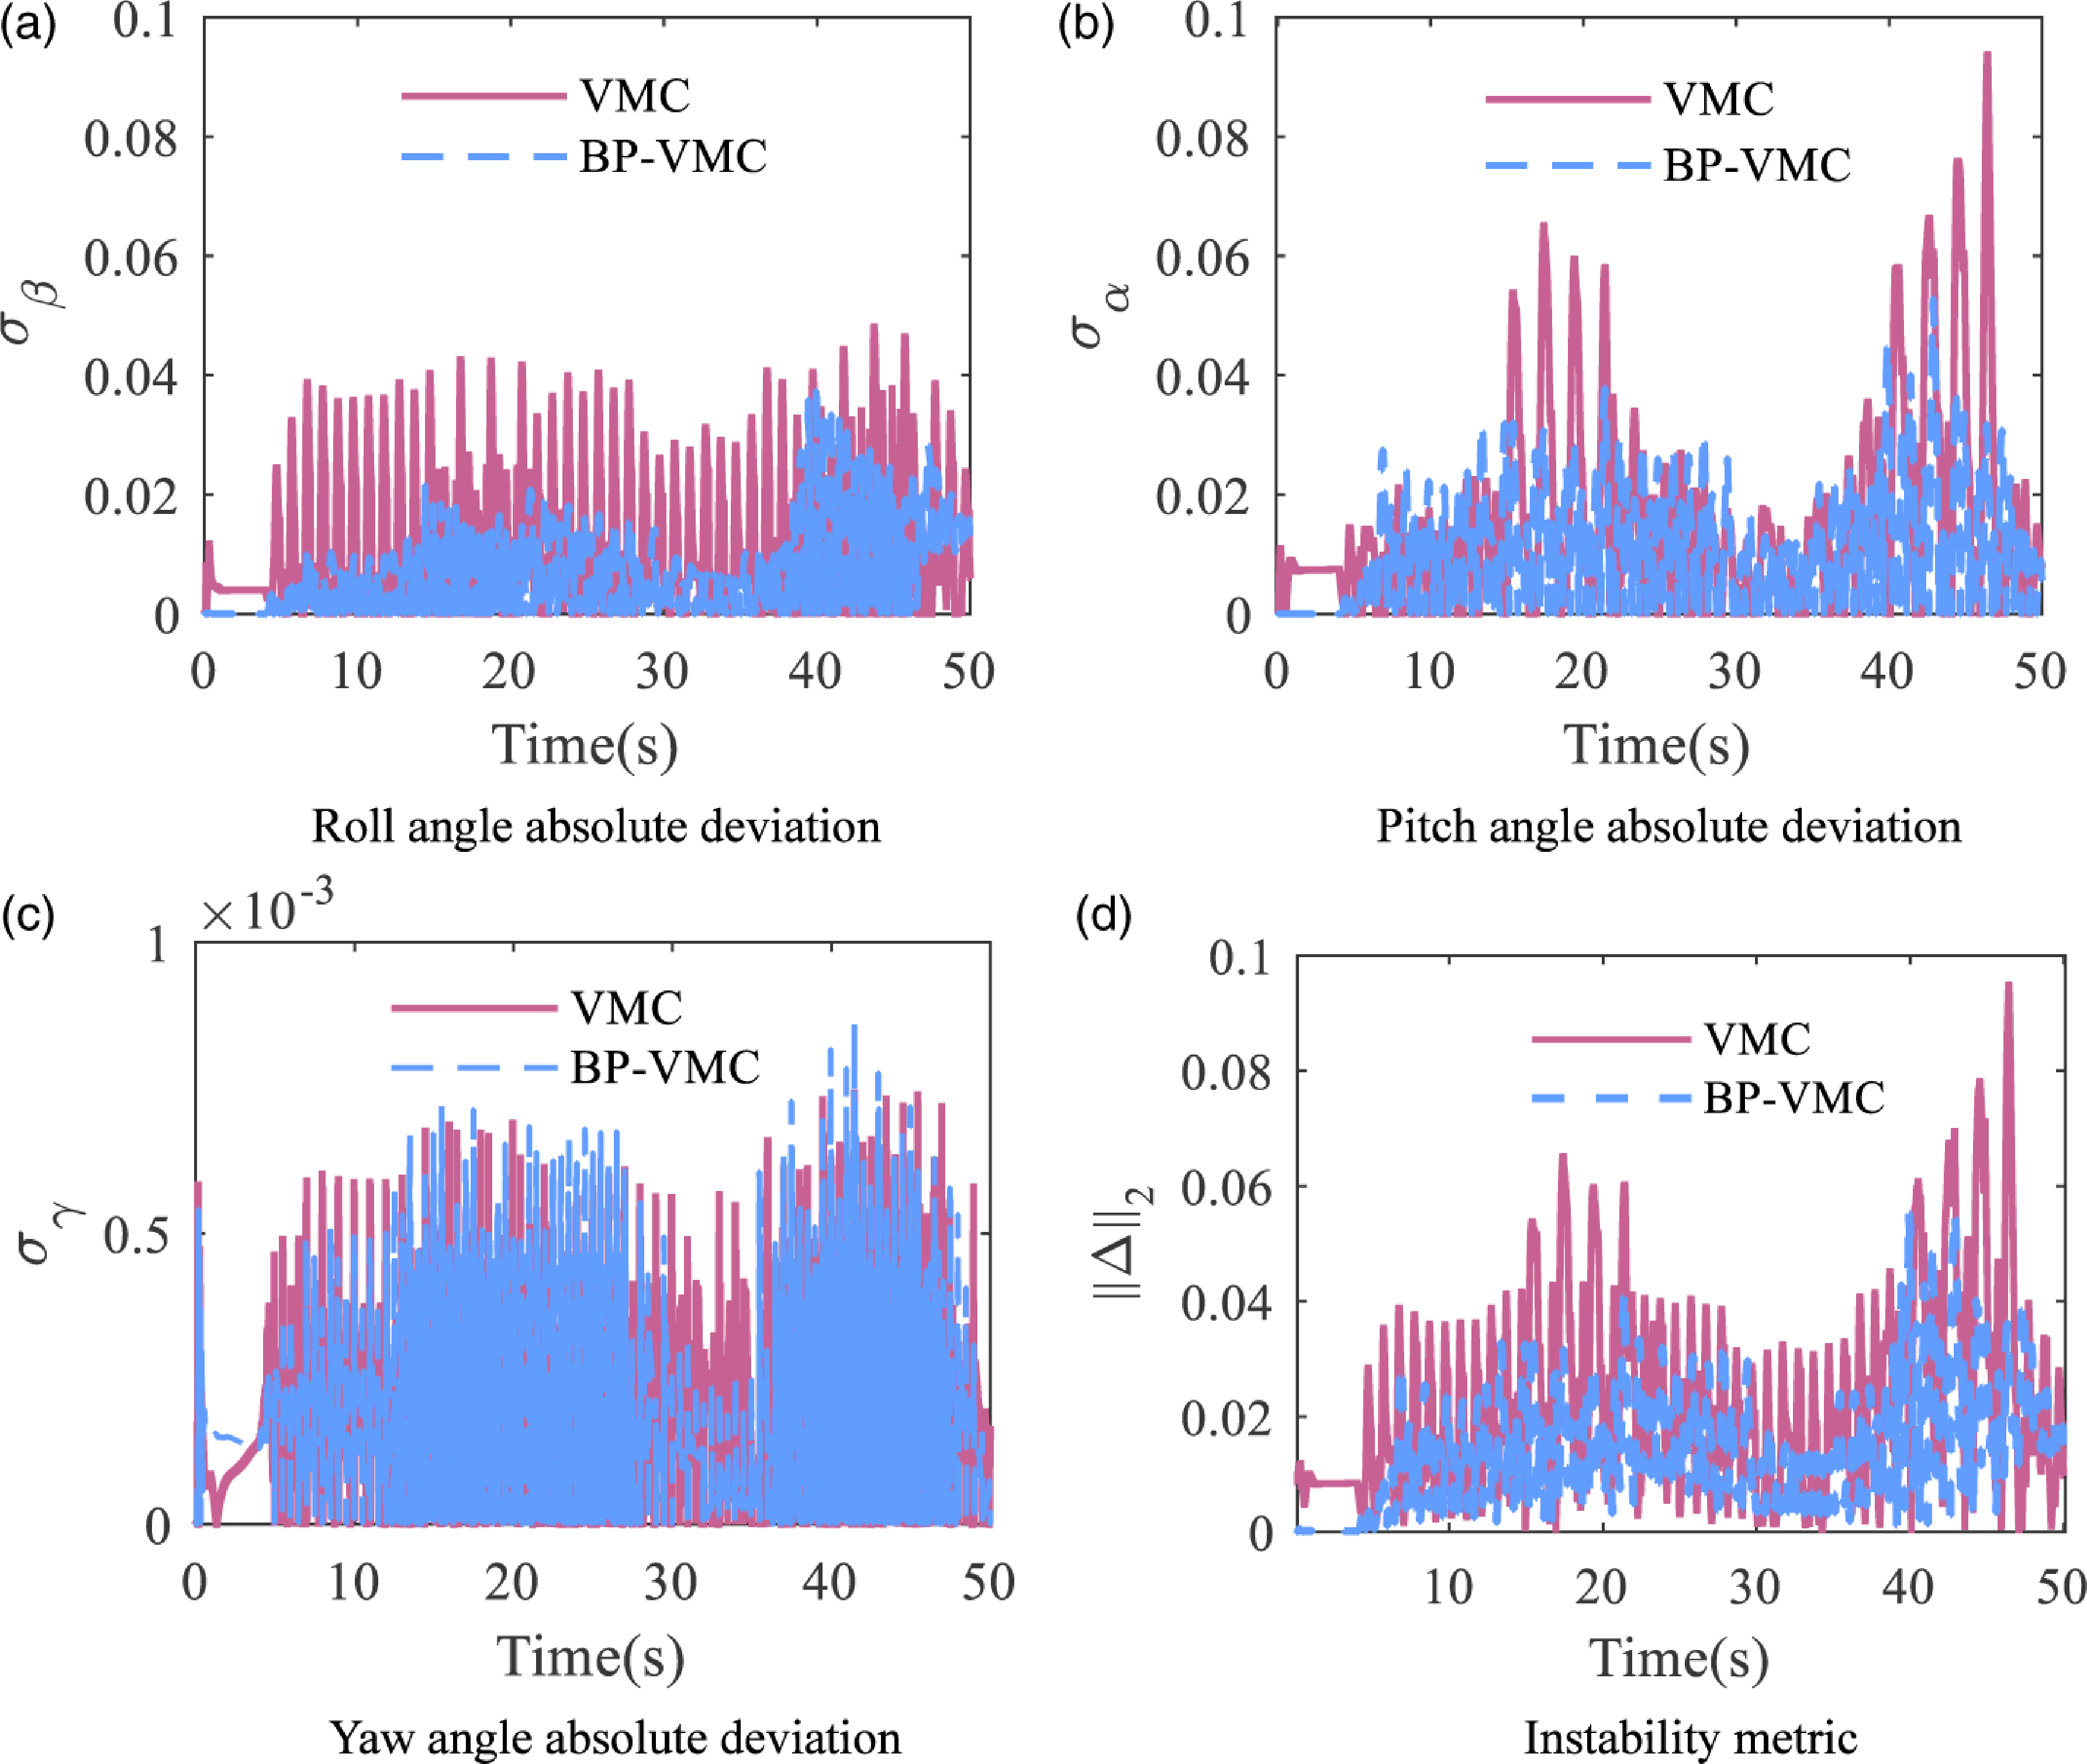
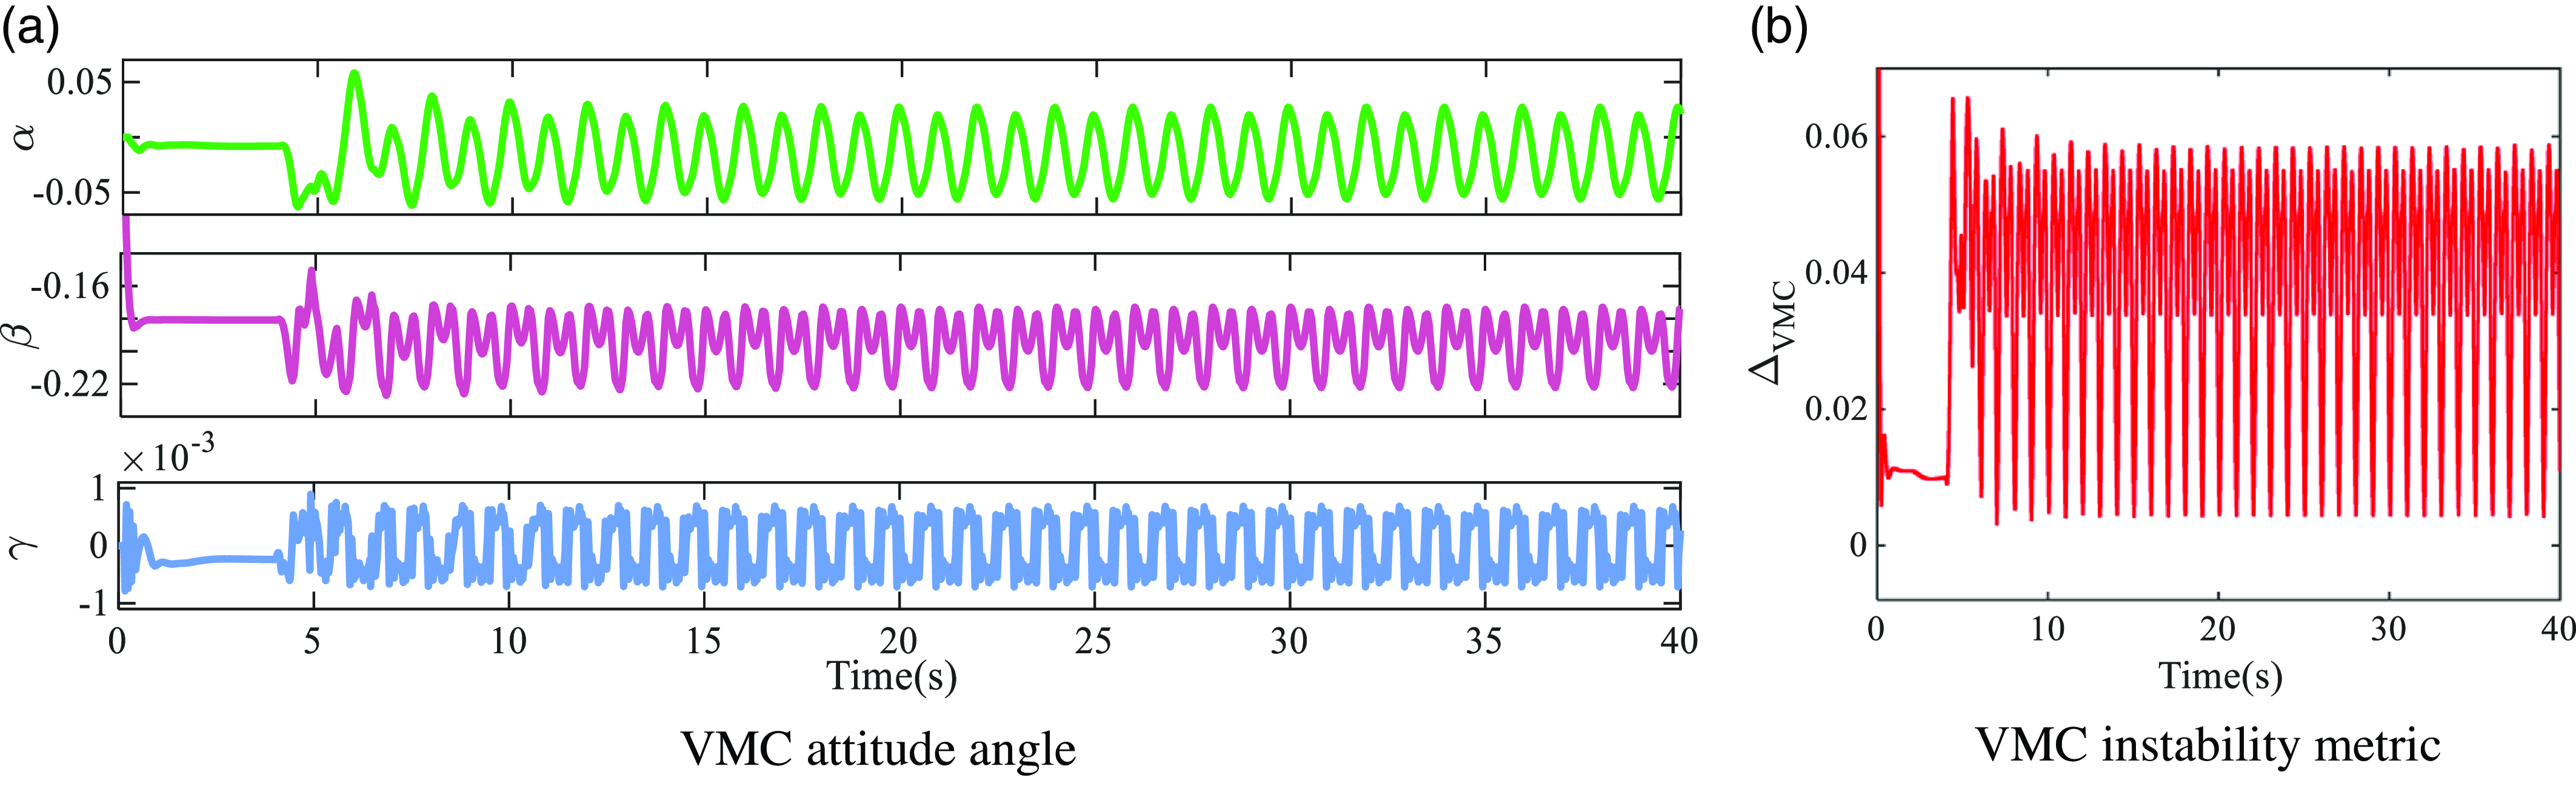
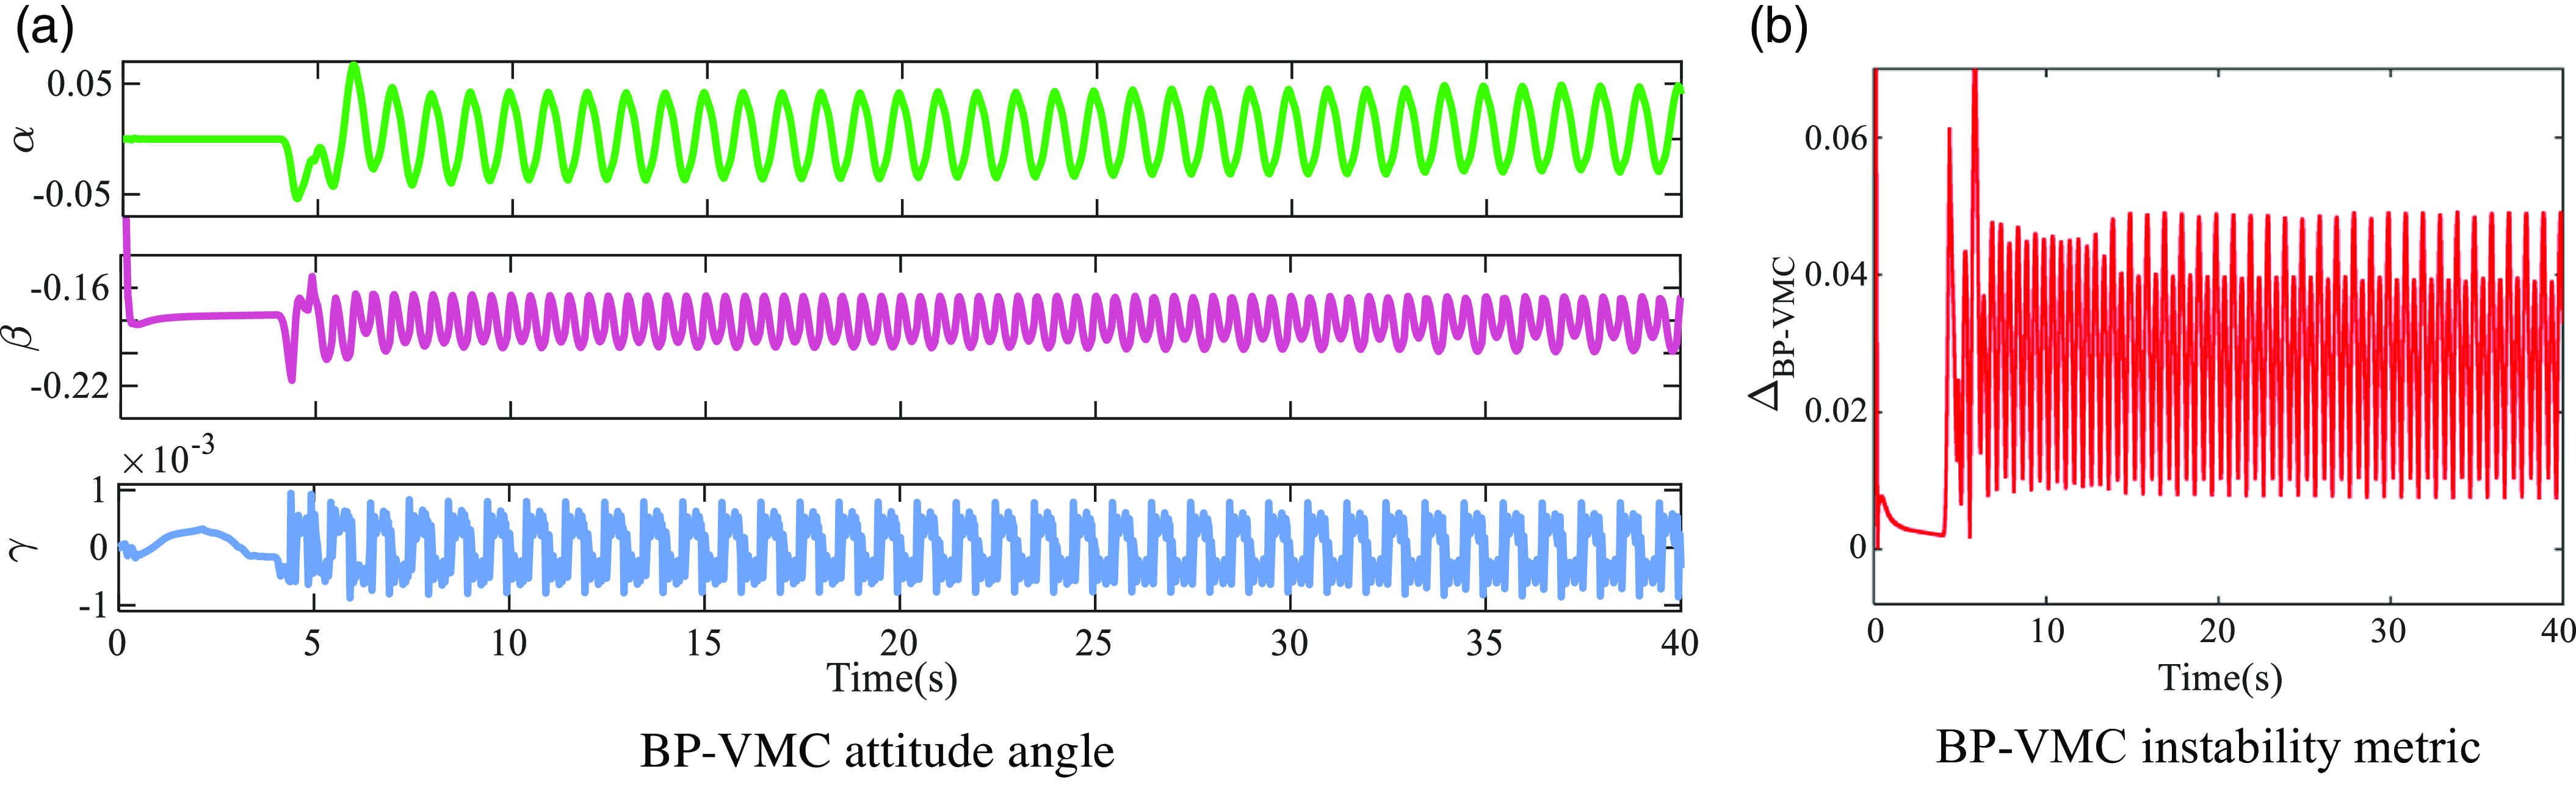
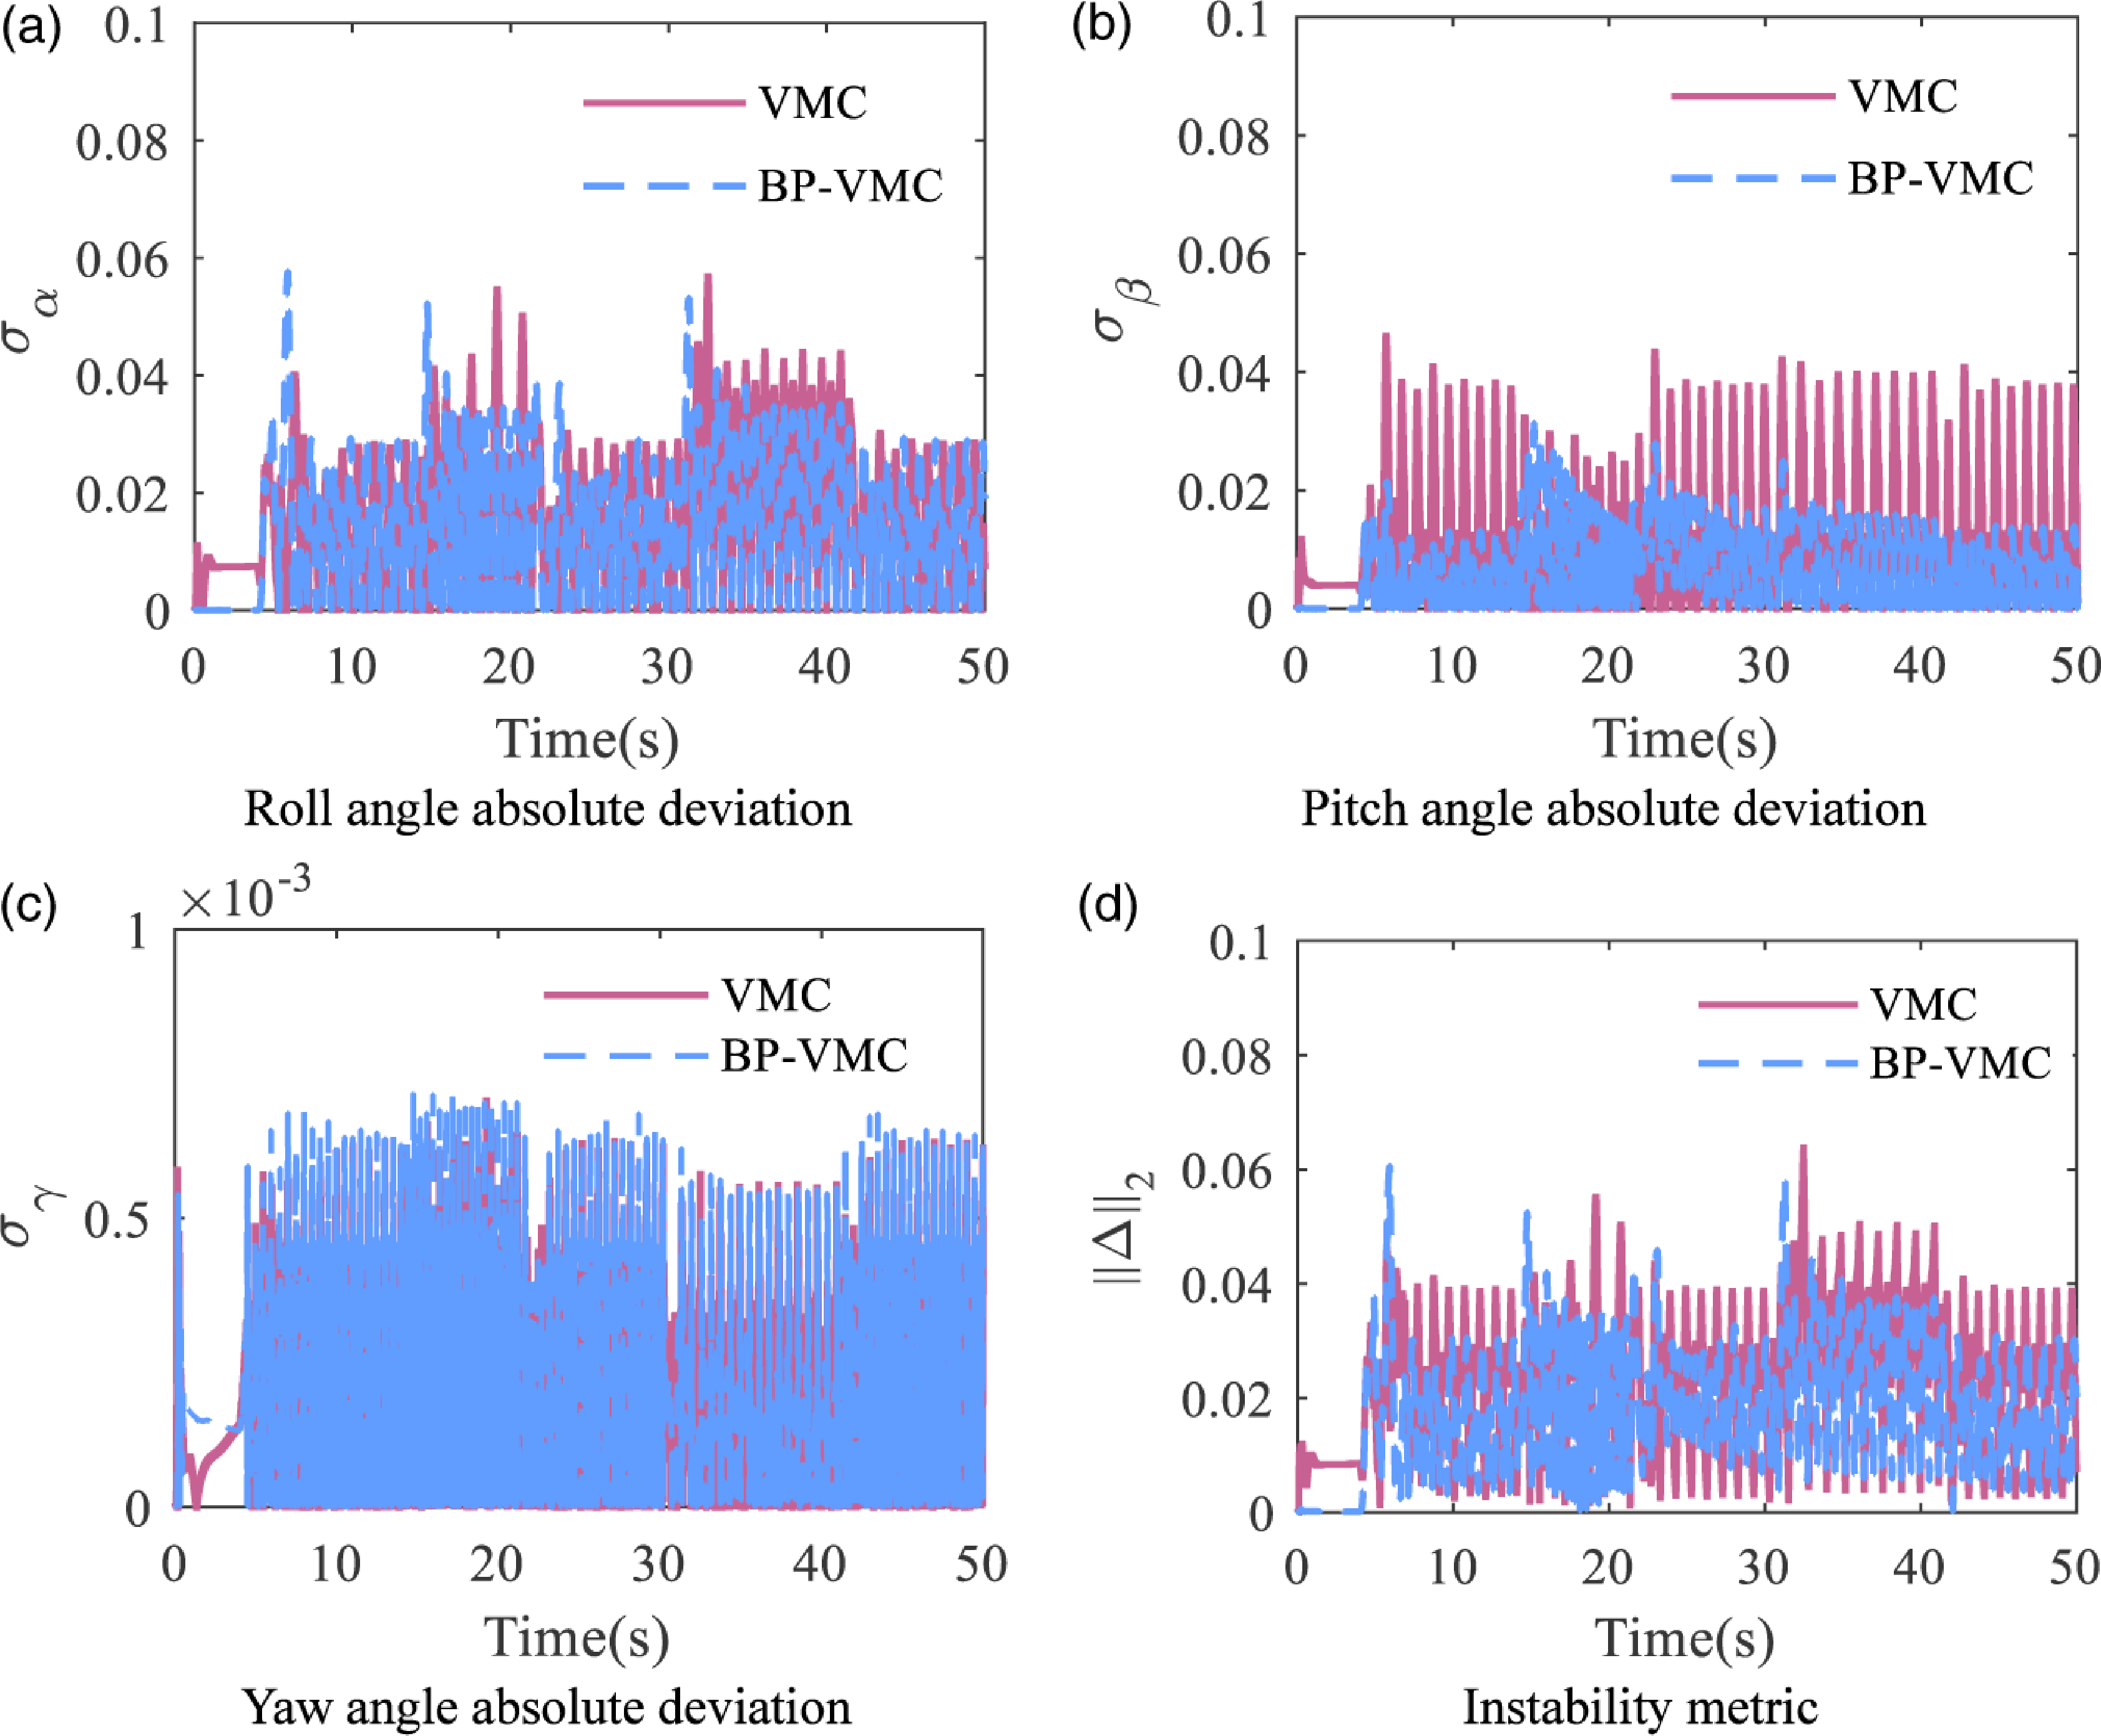
Utilizing the velocity curve presented in Figure 26 for simulation purposes, the attitude angle curves for the VMC and BP-VMC control simulations are obtained as shown in Figures 30 and 31. The fluctuation ranges of the attitude angles are also listed in a table format (Table II).
Based on the observed trend in the curve, it is evident that as velocity increases, the fluctuation range of the VMC also expands, exhibiting pronounced asymmetric fluctuations. This suggests that there is a certain difference in the control of the four legs, which leads to instability in the motion state. In contrast, the attitude angle fluctuations of the BP-VMC during variable-velocity movement remain largely confined within a consistent range, and the curve demonstrates a high degree of symmetry. This indicates that the BP-VMC sustains a stable motion state through adaptive parameter adjustments, while also ensuring a high level of consistency in the motion control across the four legs.
Range of attitude angle fluctuations.

Mean value of attitude angle absolute deviation and instability metric.

BP-VMC attitude angle.

Attitude angle absolute deviation and instability metric.

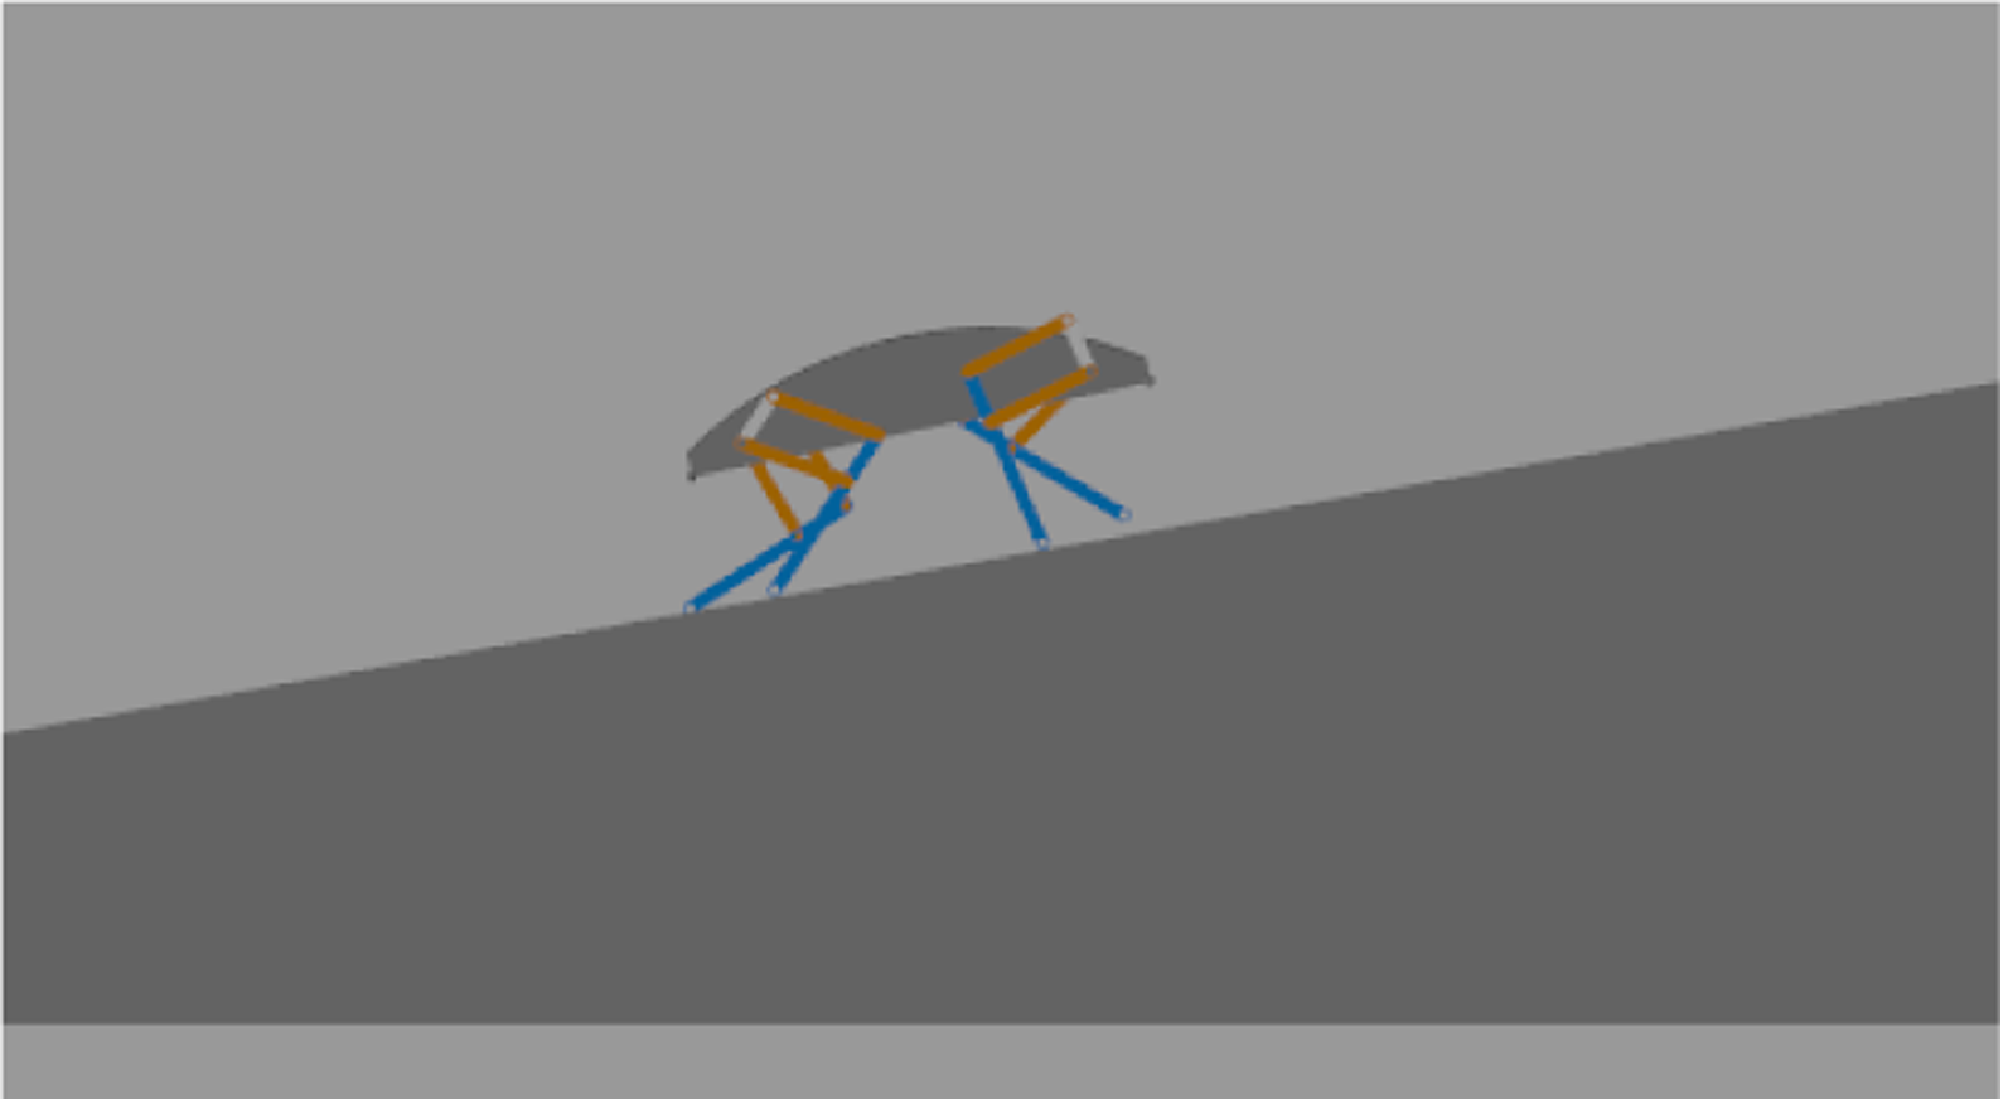
10° slope.

In order to facilitate a more intuitive comparison of the motion stability between VMC and BP-VMC, we calculated the absolute deviations of each attitude angle as well as the instability indices, based on the relevant formulas (39) and (40) (refer to Figure 32 and Table III). The comparative analysis indicates that the mean standard deviation of BP-VMC across the three primary attitude angles is less than that of VMC. Especially in the roll and pitch angles, the standard deviation of BP-VMC is 74.18% and 60.88% of VMC, respectively, indicating a smaller angle deviation and a more stable attitude. The mean value of the instability metric for VMC is
 $2.278\times 10^{-2}$
, while the mean value for BP-VMC is
 $1.500\times 10^{-2}$
, representing a 34.15% improvement. Additionally, both controllers’ maximum instability indices occur during the transition between high and low velocities. The maximum instability metric for VMC reaches
 $9.488\times 10^{-2}$
, while BP-VMC only reaches
 $5.595\times 10^{-2}$
. This suggests that under varying velocity conditions, BP-VMC can maintain good control stability and suppress significant changes in the body’s attitude angle to a certain extent. Overall, whether analyzing the entire simulation period or any specific time point, the stability of the BP-VMC controller is superior to VMC.
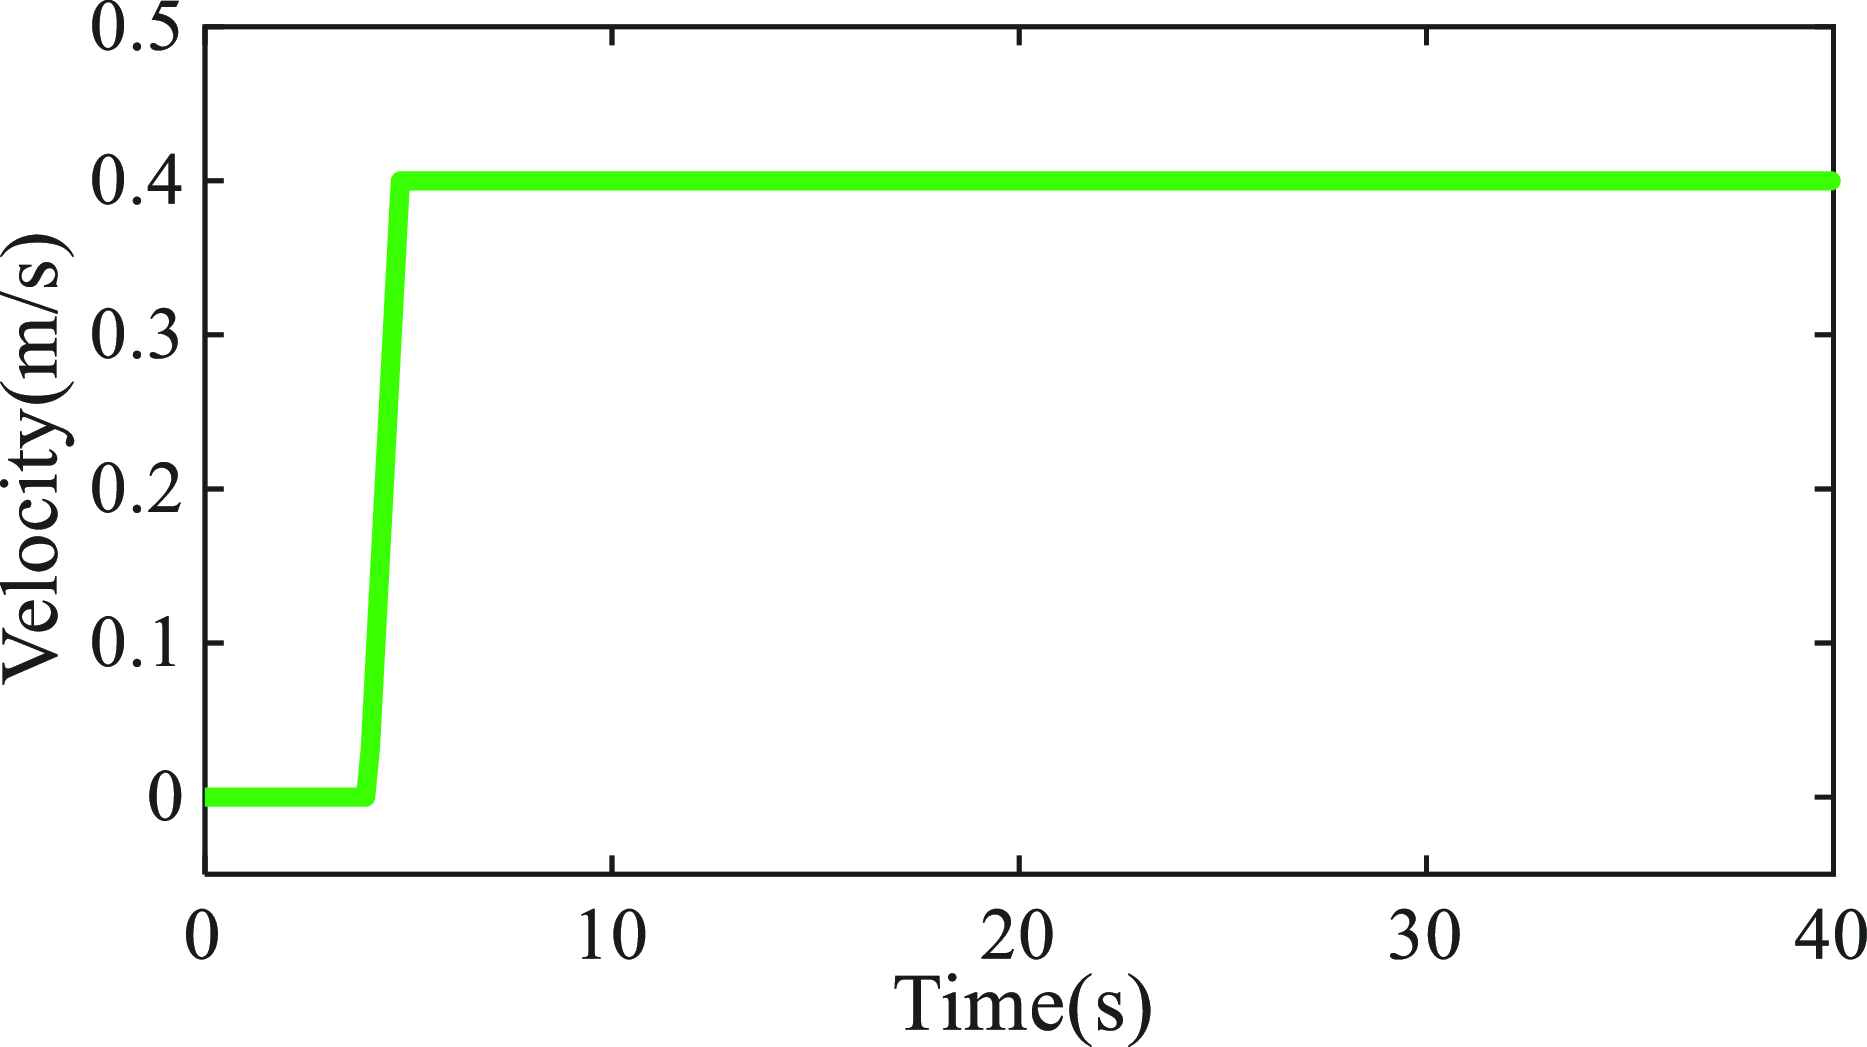
To facilitate the subsequent research on control in complex terrain environments, we further verify the stability of BP-VMC under sloped terrain conditions. The slope gradient is set to 10°, and the walking velocity is 0.4 m/s, as shown in Figures 33 and 34.
The curve results in Figures 35–36 are listed in Table IV. Under sloped conditions, the instability metrics for VMC and BP-VMC are
 $4.140\times 10^{-2}$
and
 $3.063\times 10^{-2}$
, respectively, with BP-VMC showing a 26.01% improvement in stability. Therefore, using the BP-VMC control strategy in complex environmental conditions will provide the quadruped robot with better stability.
Range of attitude angle fluctuations and instability metric mean value.

Walking velocity curve.

VMC attitude angle and instability metric.

BP-VMC attitude angle and instability metric.

6.5 Variable stride frequency (VSF) working condition
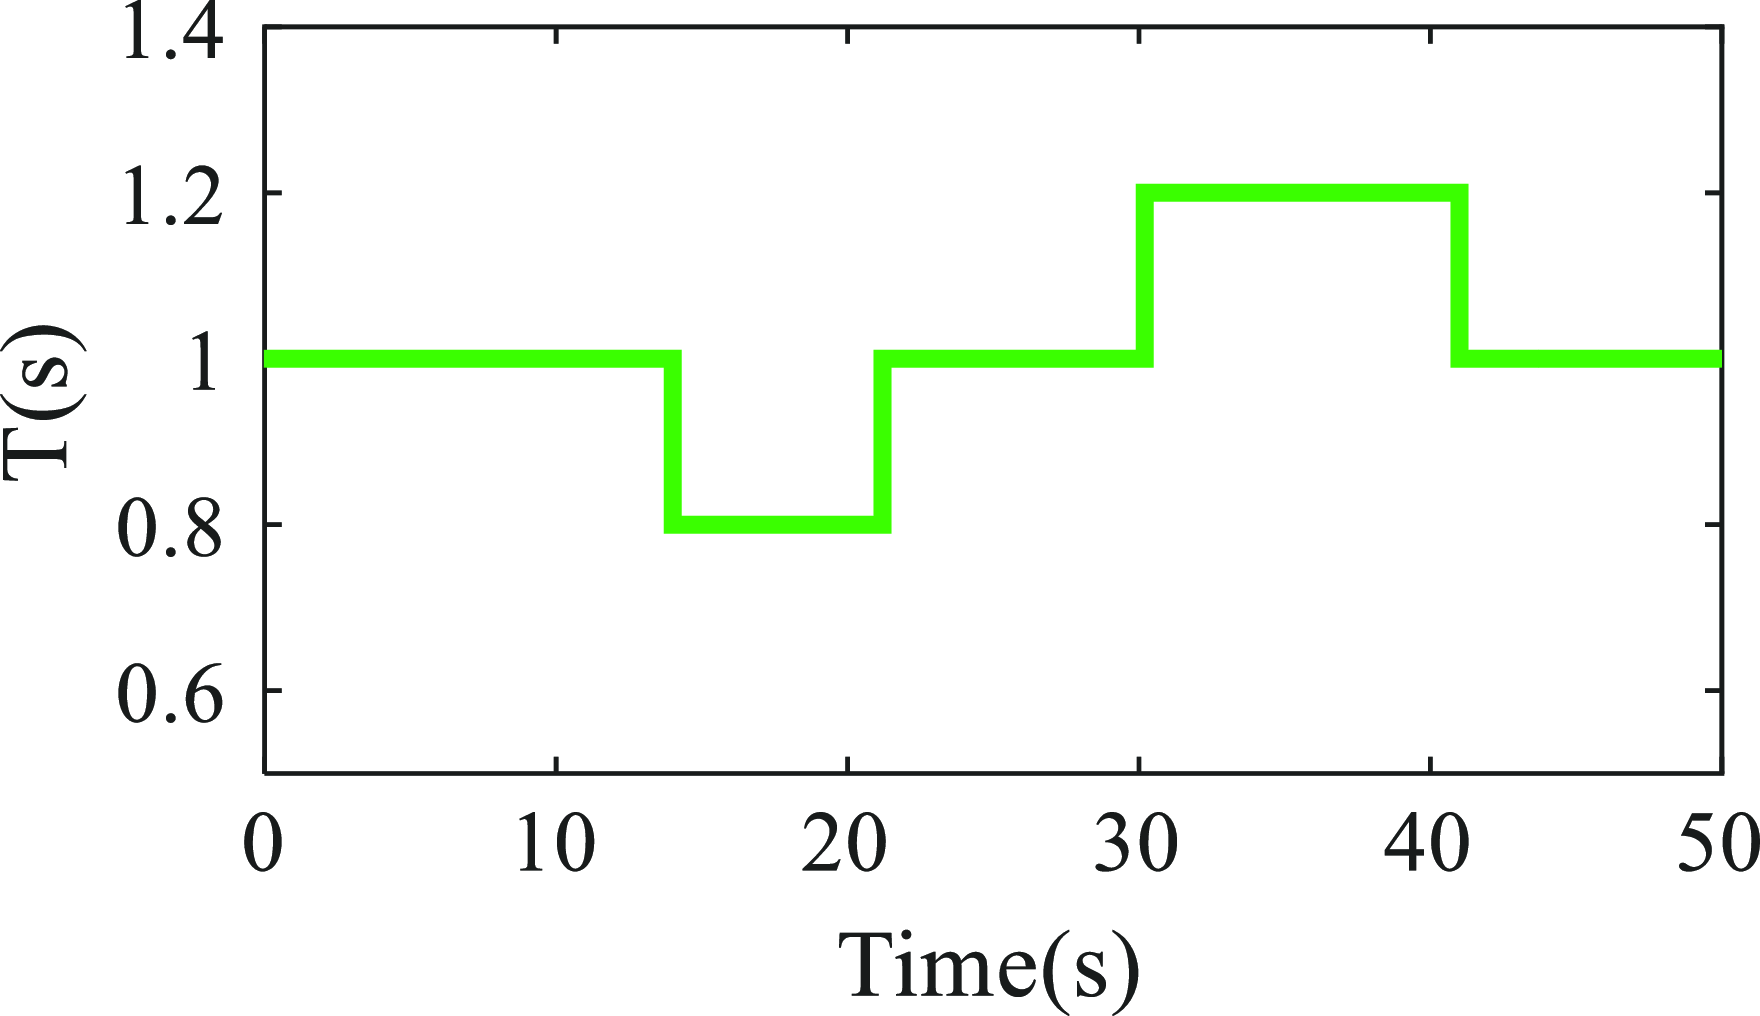
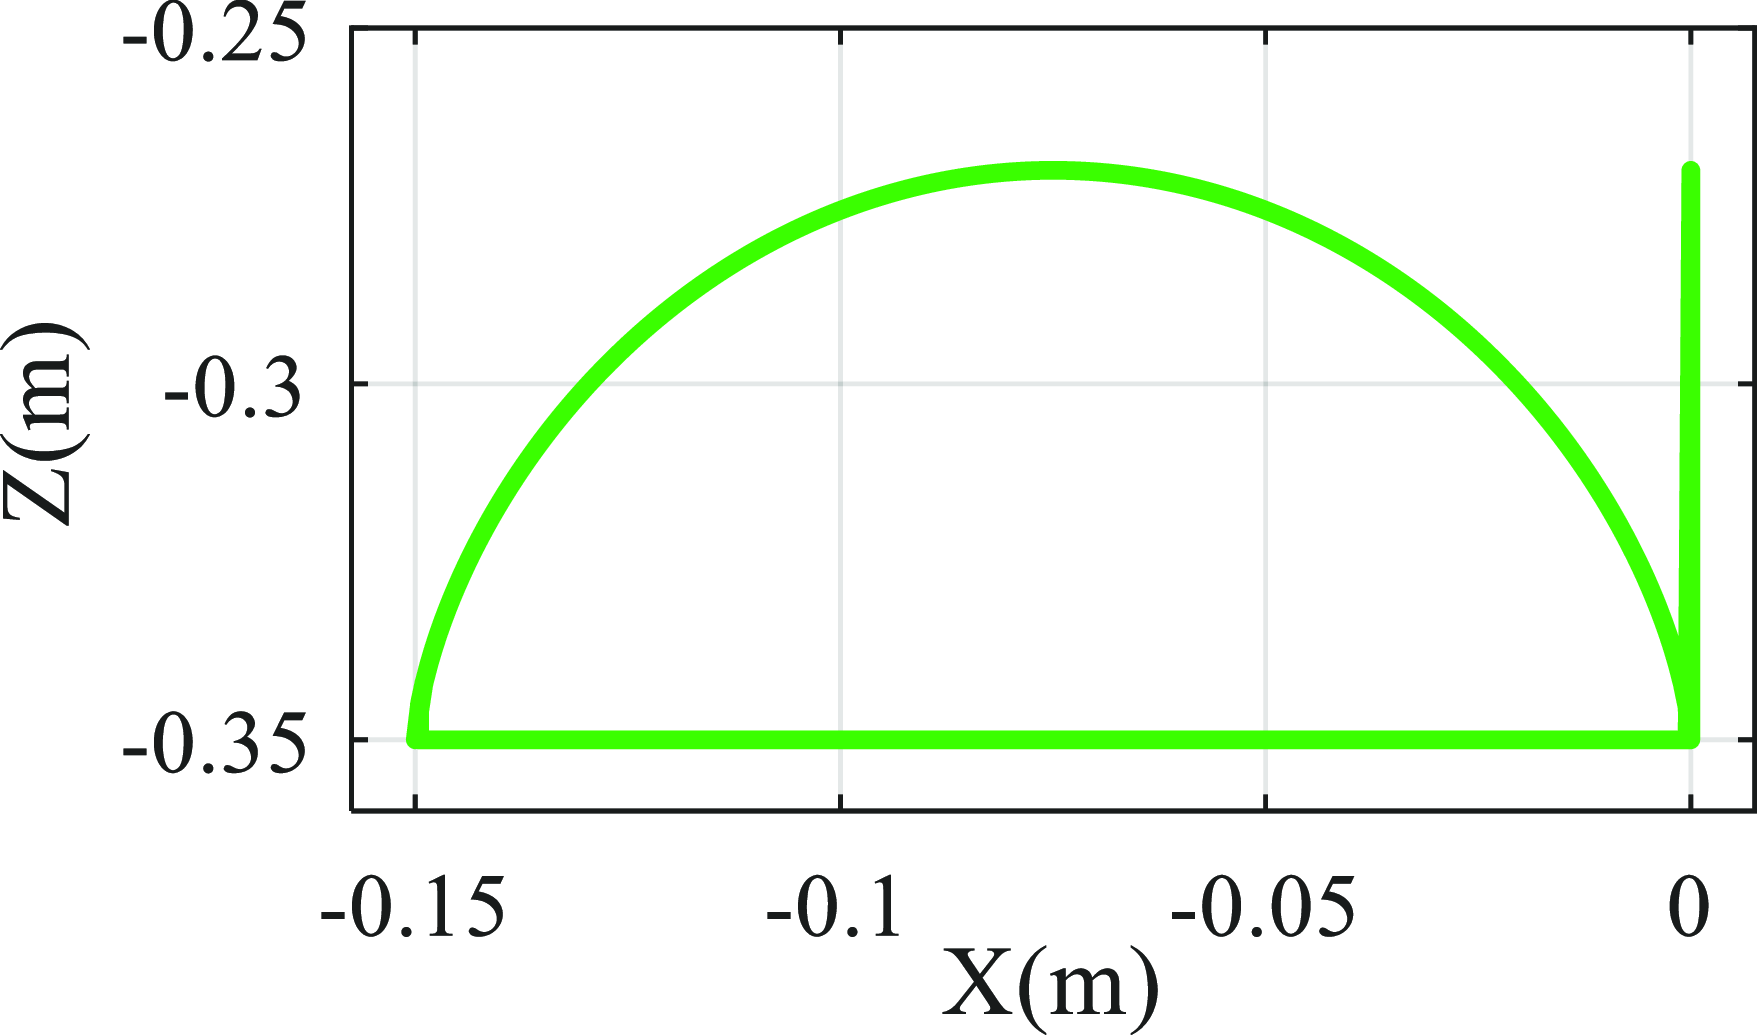
In previous simulation experiments, the robot worked under conditions where the stride frequency remained constant and the stride length varied according to the tracking velocity. To further verify the performance optimization effect of the BP-VMC controller, additional simulations were conducted under conditions where the stride length remained constant and the stride frequency varied. The constant stride length was set at S = 0.15 m, and the variation curve of the motion period T is shown in Figure 37, which forms the desired foot trajectory as depicted in Figure 38. Other parameters remain consistent with those in Table I.
Relevant error data under VSF working condition.

Motion cycle curve.

Desired foot trajectory.

Since this working condition mainly involves tracking a fixed stride length under different movement cycle conditions, the analysis focuses primarily on trajectory tracking and motion stability. The resulting curves are presented in Figures 39–44.
Stride length in the X direction under VSF working condition.

Absolute error in the X direction under VSF working condition.

Height between the foot-end and the center of mass under VSF working condition.

Absolute error in the Z direction under VSF working condition.

Foot-end movement trajectory under VSF working condition.

Attitude angle absolute deviation and instability metric under VSF working condition.

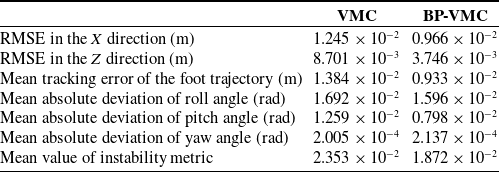
The relevant error data for trajectory tracking and stability assessment are presented in Table V. The RMSE in the X direction, the RMSE in the Z direction, and the mean tracking error of the foot trajectory characterize the accuracy of trajectory tracking. These above values of BP-VMC are 77.59%, 43.05%, and 67.41% of VMC, respectively, suggesting that BP-VMC achieves enhanced control accuracy and reduced tracking errors. Furthermore, the mean absolute deviations of the roll angle, pitch angle, and yaw angle, along with the mean value of the instability metric, characterize the motion stability throughout the control process. BP-VMC exhibits comparable mean absolute errors in the roll and yaw angles relative to VMC; however, the mean absolute error in the pitch angle and the mean value of the instability metric for BP-VMC are 63.38% and 79.56% of those for VMC, respectively. Consequently, BP-VMC demonstrates superior control stability.
6.6 Comparison between BPNN optimization and fuzzy optimization
Several researchers have suggested the application of fuzzy algorithms to enhance VMC by adaptively modifying the virtual parameter matrices K and B [Reference Sabri32, Reference Zhong and Yulong40]. In light of this, a Fuzzy VMC controller was developed, as referenced in the literature [Reference Zhong and Yulong40], to evaluate the control performance of BP-VMC in comparison to Fuzzy VMC under equivalent control conditions.
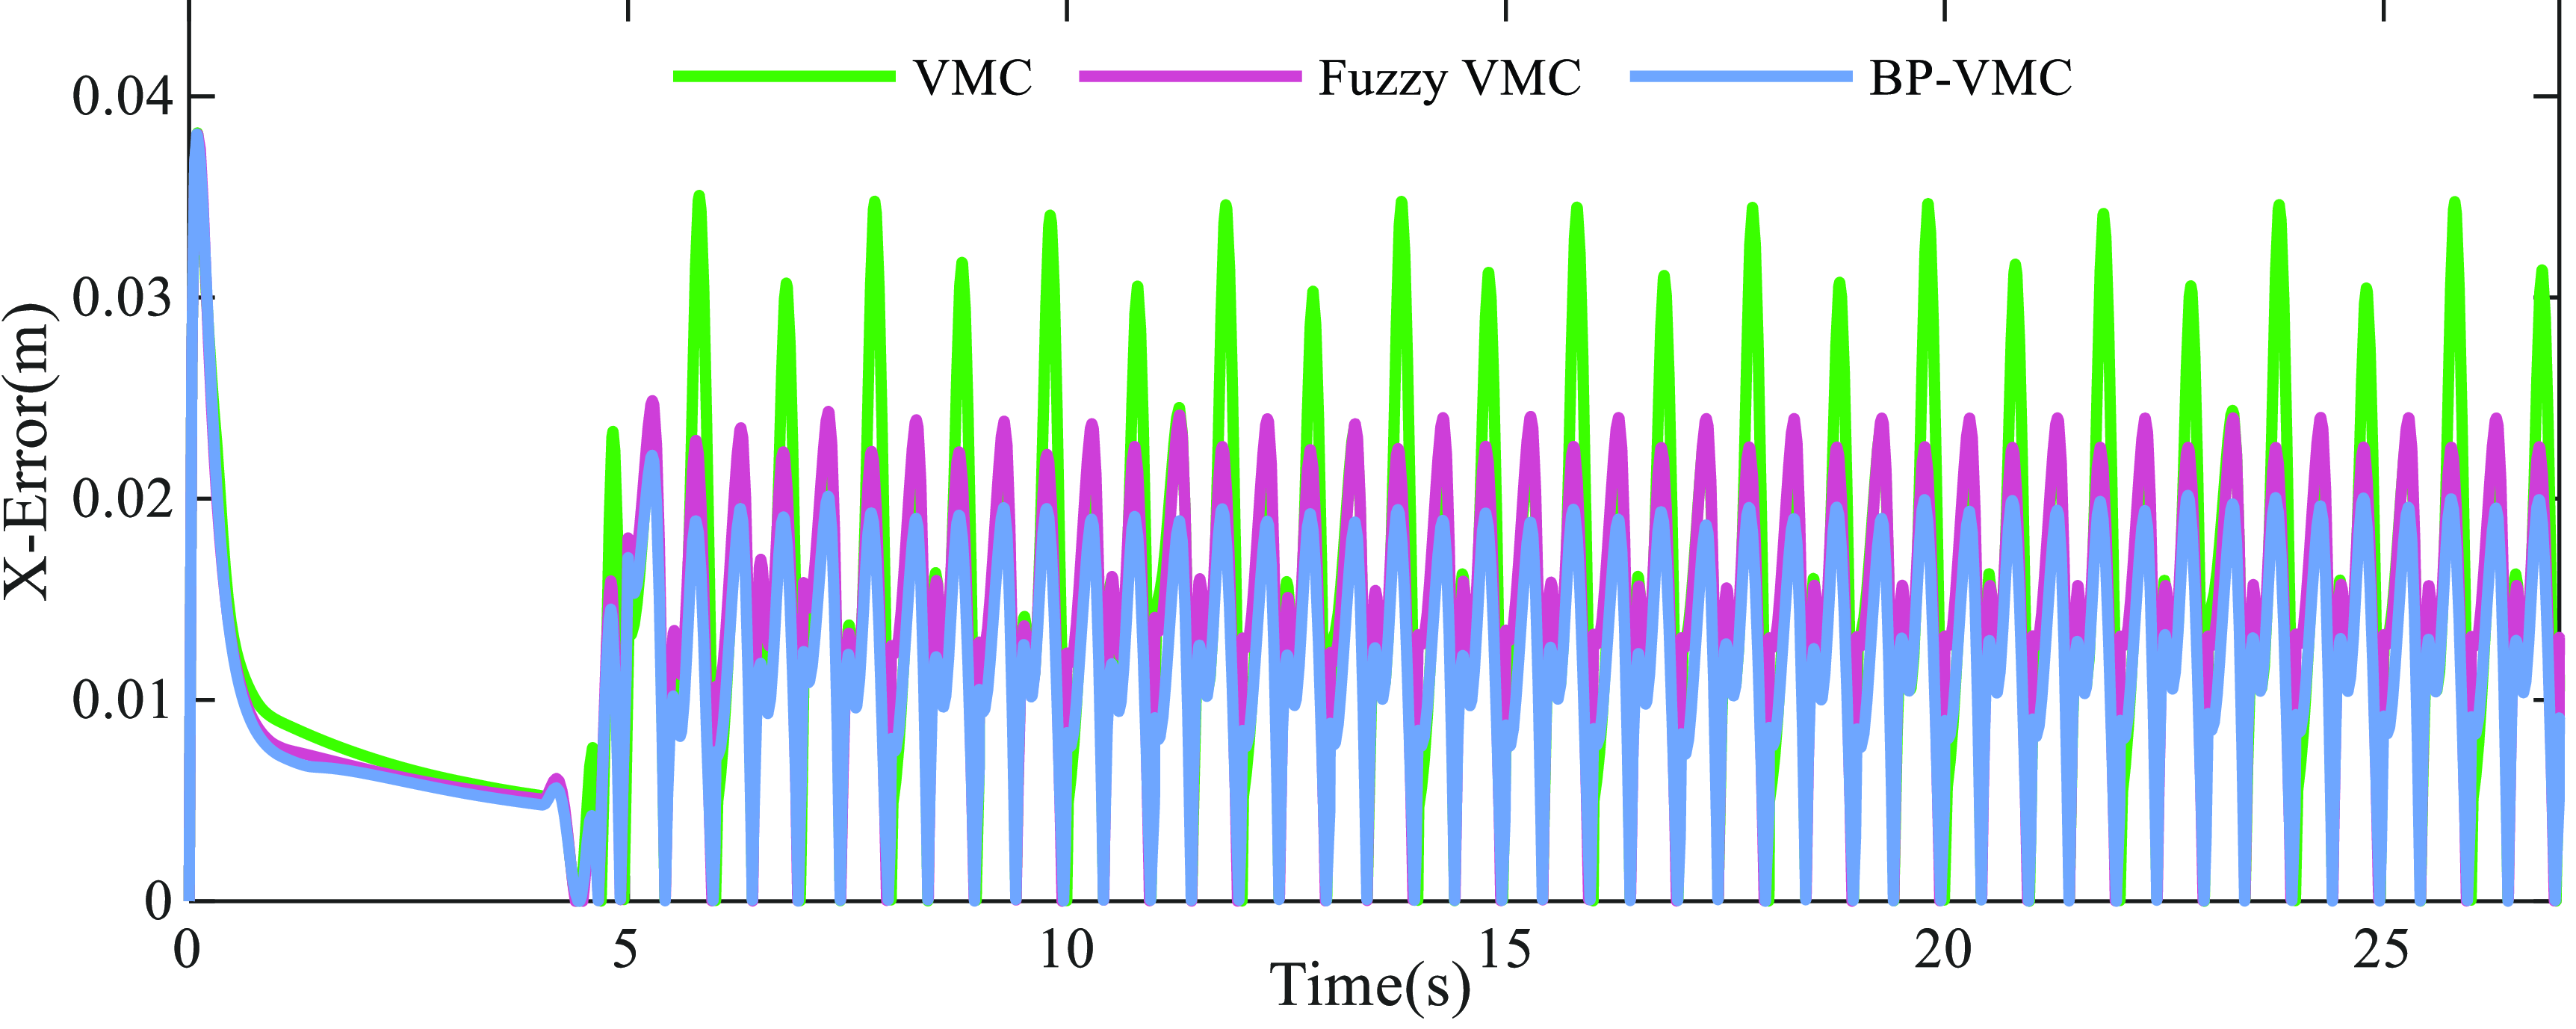
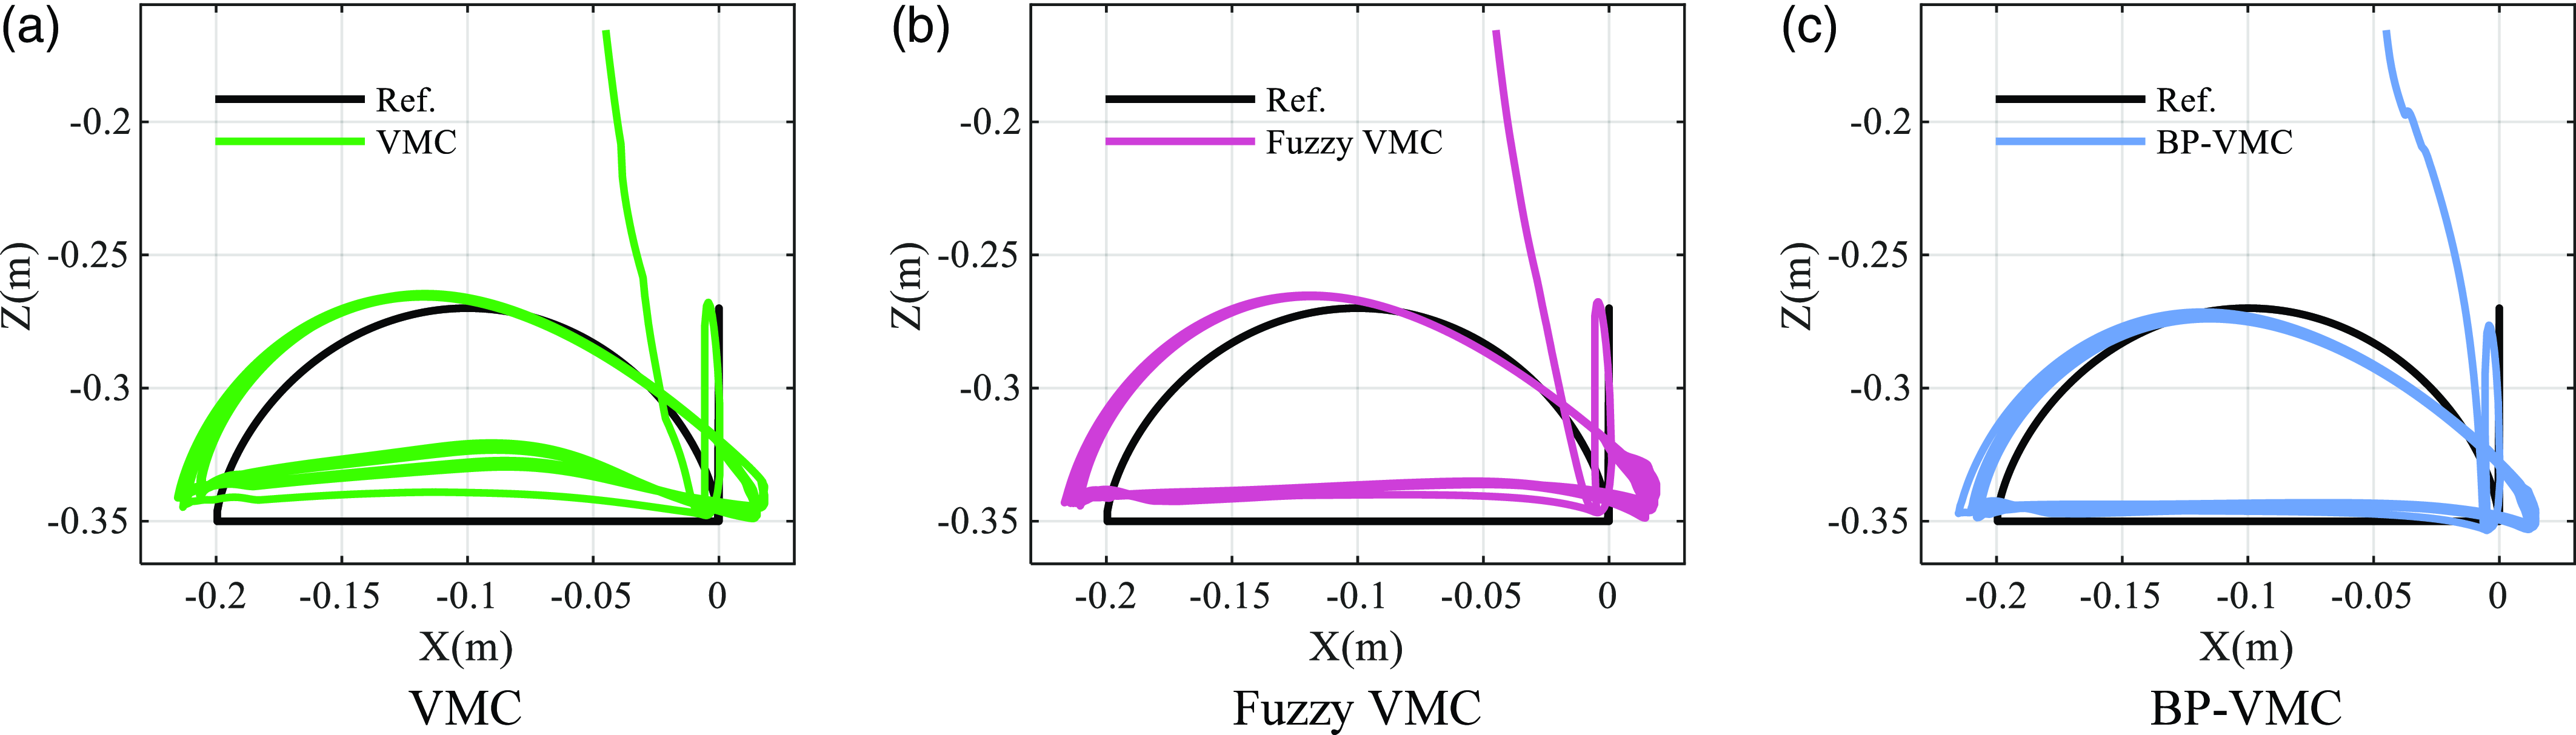
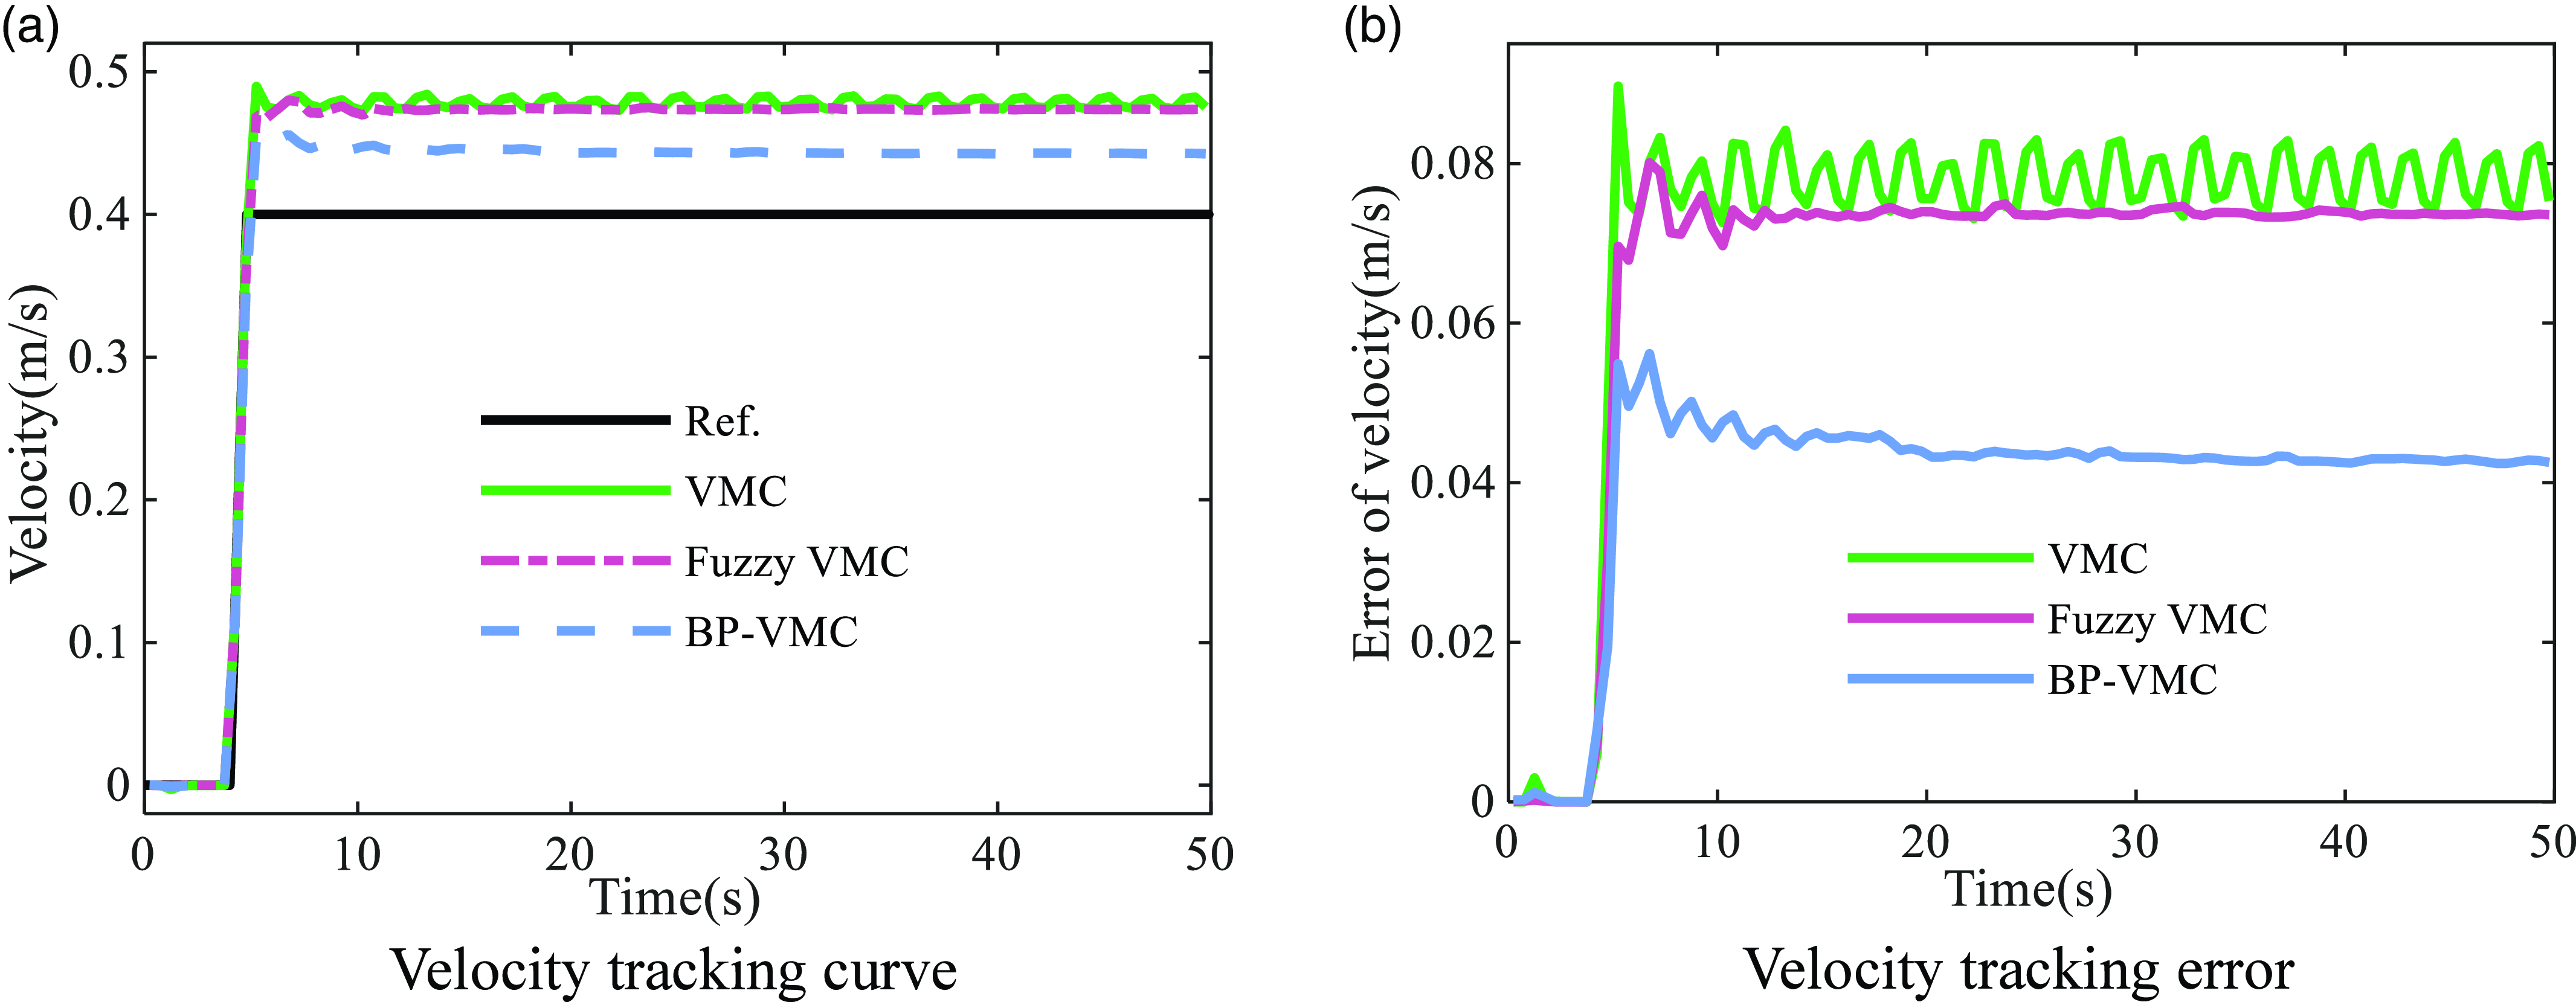
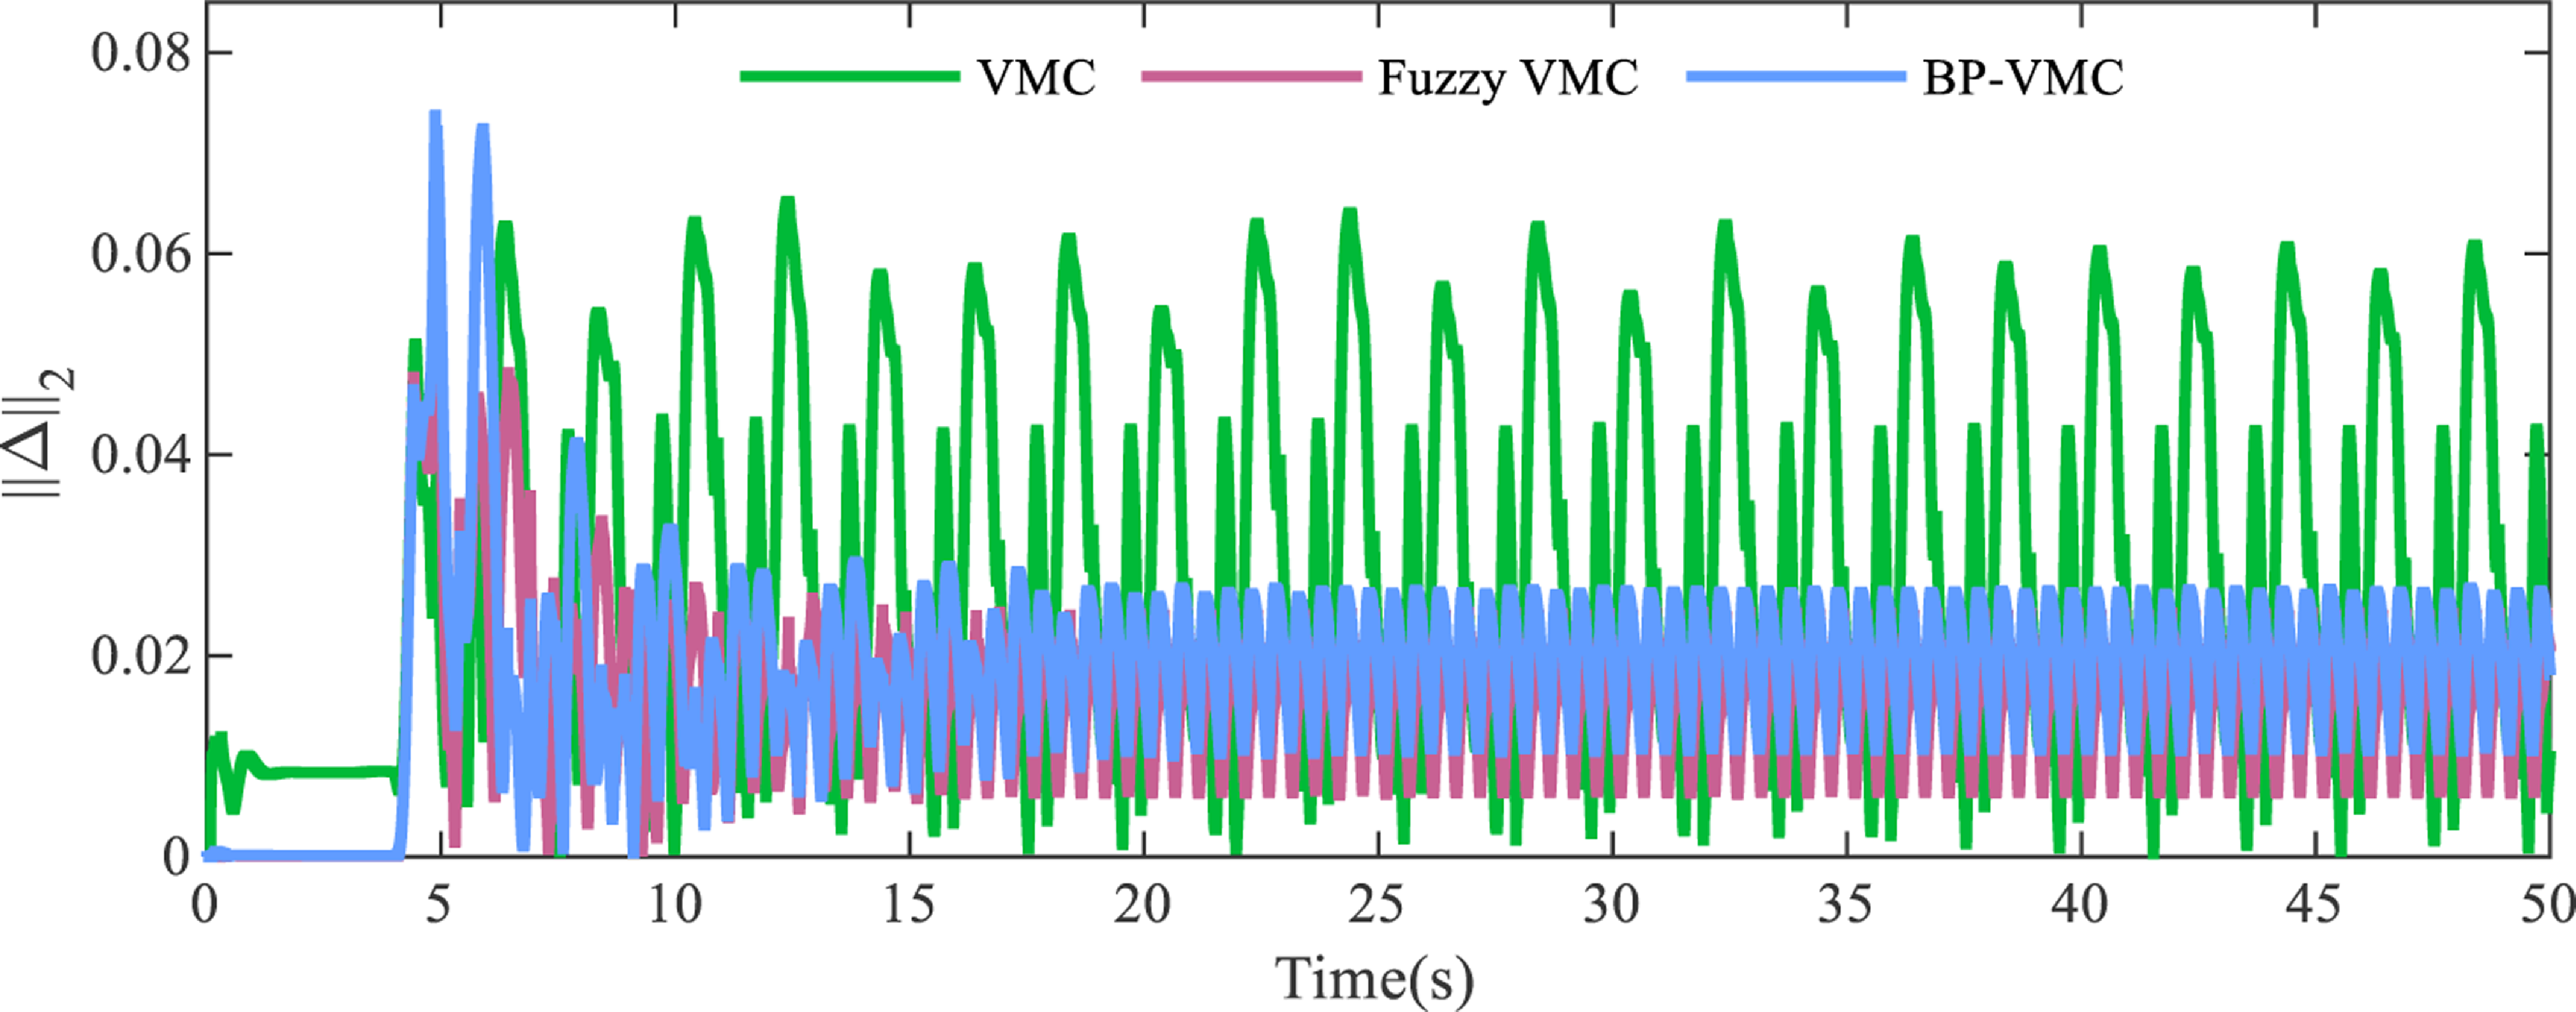
The performance of the BP-VMC and Fuzzy VMC controllers is compared from the aspects of stride length tracking error, velocity tracking error, foot trajectory tracking error, and motion stability, resulting in the curves shown in Figures 45– 48. And these comparisons are also summarized in Table VI.
Relevant error data under VSF working condition.

Tracking error of the stride length in the X direction for different controllers.

Foot-end movement trajectories of different controllers.

Velocity tracking results of different controllers.

Instability metrics of different controllers.

From the simulation results, both BP-VMC and Fuzzy VMC show significant improvements in control performance compared to traditional VMC. BP-VMC outperforms Fuzzy VMC in terms of control accuracy and velocity tracking accuracy, while Fuzzy VMC is superior to BP-VMC in terms of motion control stability.
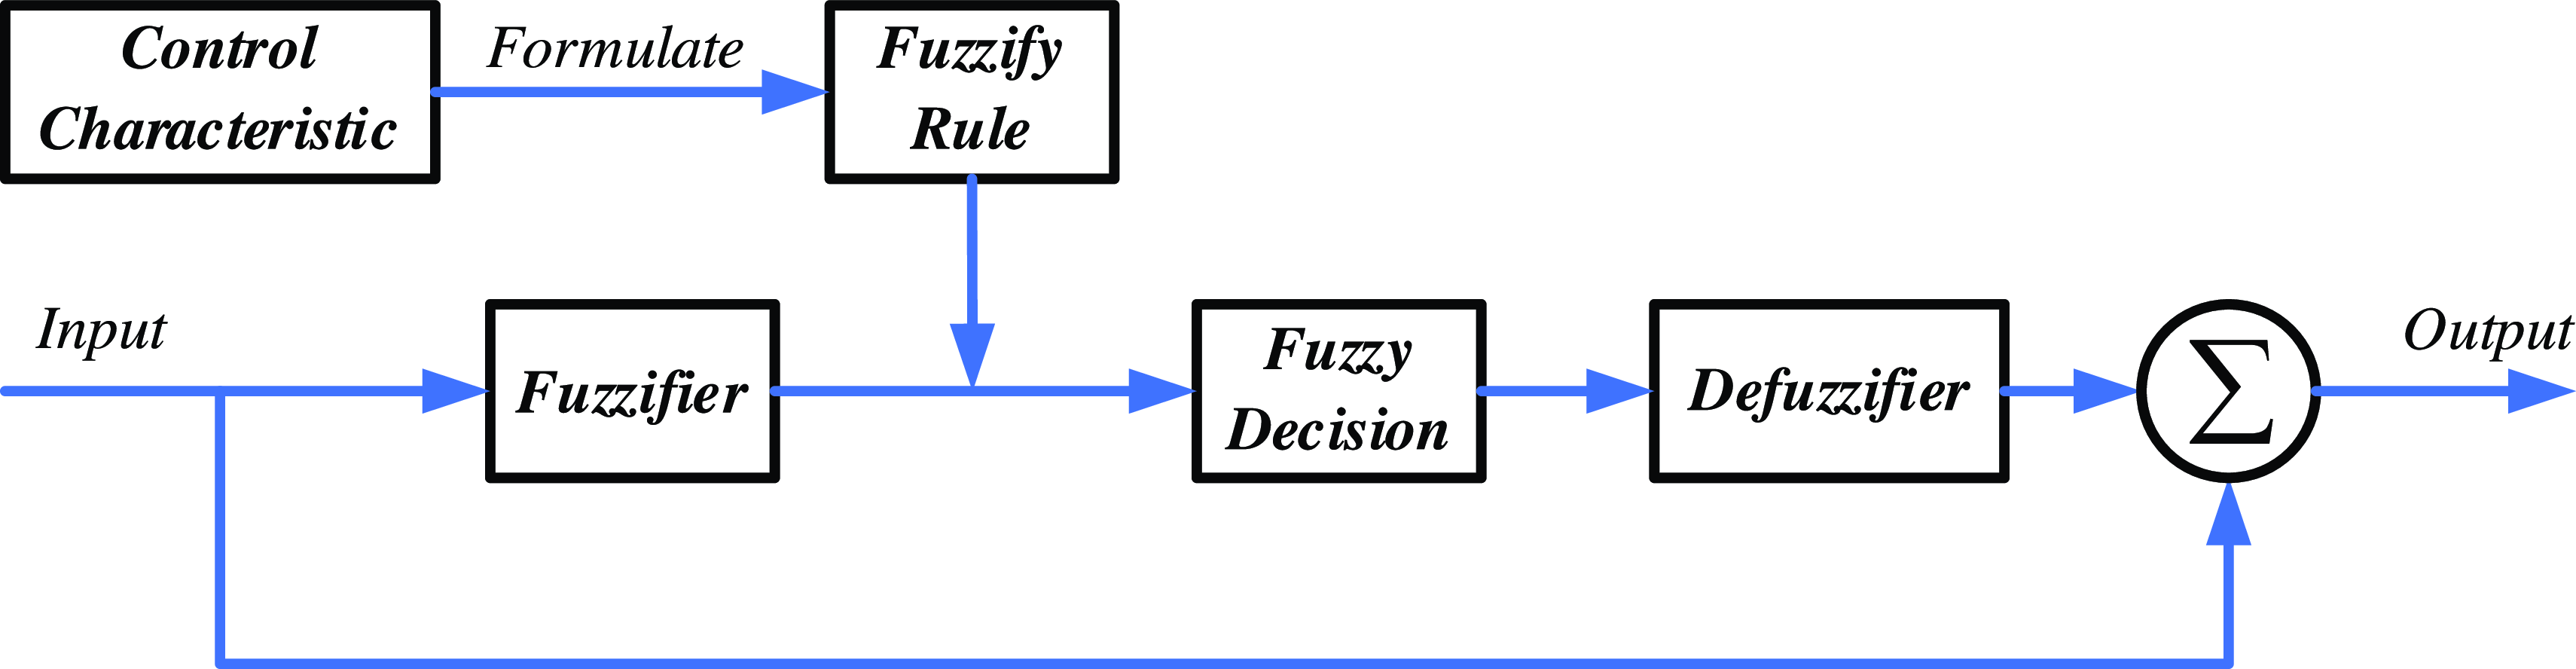
The optimization principle of BPNN has been discussed in Section 4.1, and the principle of fuzzy optimization is illustrated in Figure 49.
Fuzzy optimization principle block diagram.

From the perspective of optimization principles, fuzzy algorithms are based on experience, where fuzzy rule tables are artificially formulated according to the characteristics of the system to correct and improve parameters. The rationality of rule formulation has a decisive impact on the final control performance [Reference Deme, Manavaalan and Halder41, Reference Ming, Haigang and Feng42]. However, it is difficult to qualitatively determine the rationality of fuzzy rule formulation. And during use, fuzzy rules are also hard to adjust autonomously. The results obtained are merely the optimal results under the established rule conditions, which can easily lead to local optimal issues.
BPNN builds a neural network structure and autonomously learns and trains based on sample data, making adaptive adjustments to parameters according to error conditions [Reference Zhijun43–Reference Yunkang, Xiaohui, Faming and Xiangpo45]. During the learning and training process of the BPNN algorithm, the core weight matrix is continuously optimized and adjusted, while also introducing inertia factors and learning rates, which can effectively avoid local optimal problems and achieve global optimal results.
Therefore, from the analysis of optimization principles, BP-VMC can achieve global optimal control better than Fuzzy VMC, and it also has broader applicability.
7. Conclusion
This paper focuses on the motion control necessities of quadruped robots and employs an intuitive and effective control framework known as VMC, to simplify the dynamics modeling process of quadruped robots. To address the insufficient dynamic performance and control accuracy caused by the simplified dynamics in VMC, an adaptive VMC method optimized by a BPNN is proposed. This approach facilitates the adaptive modification of the virtual component model, thereby compensating for modeling inaccuracies. Additionally, an error integral compensator (IC) is introduced into the height controller in the Z direction, with the BPNN autonomously calibrating the integral coefficient to achieve compensation for system inertia and external errors, further improving control accuracy.
In the simulation experiments, the parameter values of VMC were adaptively tuned by BPNN. The simulation results of VMC showed that the tuned parameters achieved good control performance, demonstrating the reliability of BPNN parameter tuning. Subsequently, the control performance of BP-VMC was analyzed with VMC as the control group. The experimental results showed that under the conditions of fixed stride frequency and varying stride length, the BP-VMC method optimized the errors in trajectory tracking and velocity tracking by 32.73% and 44.57%, respectively, compared to VMC, while also improving the instability metric by 34.15%. Under the conditions of varying stride frequency and fixed stride length, BP-VMC optimized the trajectory tracking and instability metric by 32.59% and 20.44%, respectively, compared to VMC, verifying the optimized effects of BP-VMC in terms of accuracy in trajectory tracking, velocity tracking, and stability of motion control under different working conditions. Simultaneously, simulation comparison experiments between BP-VMC and Fuzzy VMC were conducted. Through a comparative analysis of the simulation results and optimization principles, the findings indicate that BP-VMC exhibits superior control accuracy and achieves better global optimization compared to Fuzzy VMC.
Through the research presented in this paper, the VMC method has been optimized and improved, enhancing its control adaptability, stability, and accuracy. This serves as an exploration and expansion of the motion control methods for quadruped robots in complex environments, further promoting the application of quadruped robots in military, rescue, agricultural, and other fields. Further research on the motion control of BP-VMC under complex terrain conditions will be conducted in the future.
Author contributions
Liu Jianwen conceived and designed the study. Xu Xiaojun and Wang Wenhao provided relevant theoretical guidance and financial support. Liu Jianwen, Tang Yuanjiang, and Lu Shengyang carried out relevant simulation experiments. Liu Jianwen primarily wrote the article, and Xu Xiaojun, Wang Wenhao, Tang Yuanjiang, and Lu Shengyang revised and polished it.
Financial support
This work was financially supported by the National Natural Science Foundation of China Youth Fund (grant no. 52202485) and the National University of Defense Technology Research Program (grant no. ZK24-22).
Competing interests
The authors declare no conflicts of interest exist.
Ethical approval
Not applicable.