Introduction
The need for improved materials for various technological applications has generated considerable interest in obtaining information about the factors responsible for improving strength in ordered intermetallic alloys. Because of the excellent properties of Ti–Al intermetallic compounds, including low density and high strength at elevated temperatures [Reference Hong, Watsonyang, Freeman, Oguchi and Xu1, Reference Chubb, Papaconstantopoulos and Klein2, Reference Mishin and Herzig3, Reference Asta, De Fontaine and Van Schilfgaarde4], they have attracted widespread attention. However, Ti–Al intermetallic compounds have found only limited use as high-temperature structural materials, primarily due to their brittleness at room temperature. As a consequence, substantial research has been devoted to improving the ductility of Ti–Al intermetallic compounds. In particular, the effect of stoichiometry, ternary additions, and novel alloying techniques on the stability and mechanical properties of intermetallic phases in the Ti–Al system is being explored [Reference Fleischer, Dimiduk and Lipsitt5, Reference Yamaguchi and Umakoshi6]. Clearly, an understanding of the relative stabilities and properties can help to guide research on Ti–Al intermetallic compounds.
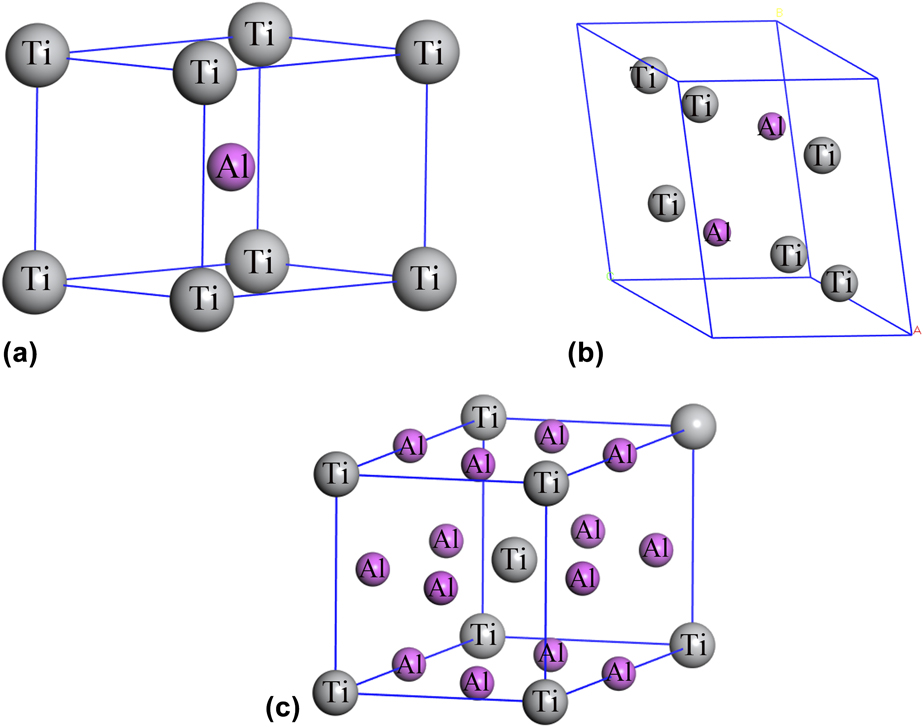
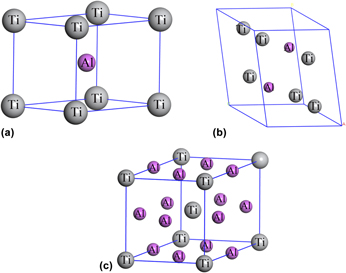
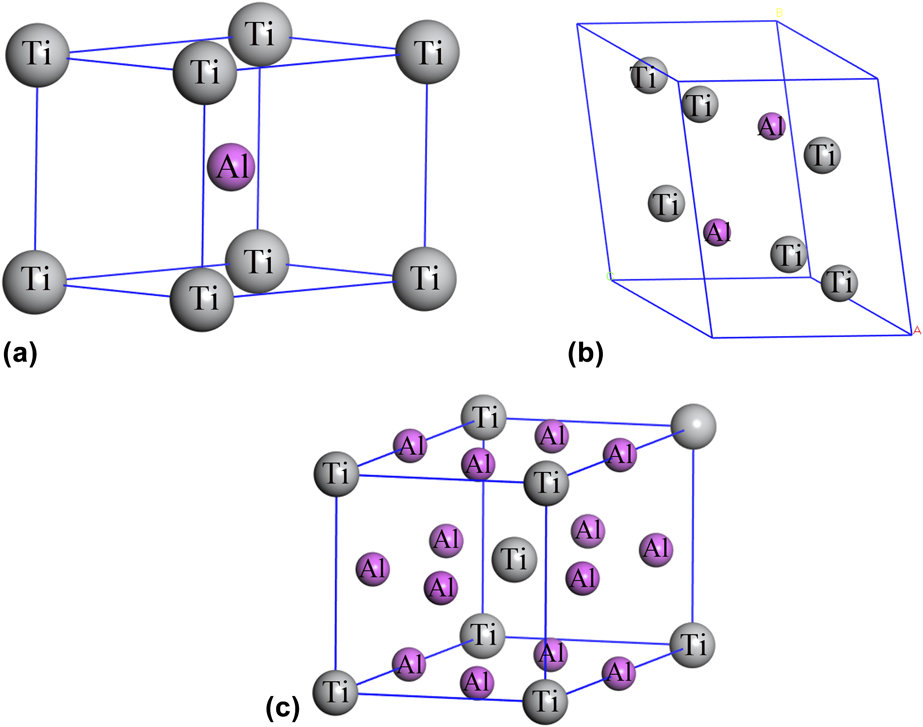
In recent years, a number of Ti–Al intermetallic compounds have been studied both experimentally and theoretically. Kattner et al. [Reference Kattner, Lin and Chang7] investigated thermodynamic assessment and calculated the phases of the Ti–Al system and used three different analytical descriptions to describe the three different types of phases (the stoichiometric compounds, the disordered solution phases, and the ordered intermetallic compounds) occurring in the Ti–Al system. Ren et al. [Reference Ren, Li and Feng8] estimated the microstructure at the interface zone during Ti/Al diffusion bonding and found that the interface zone included a transition zone on the Ti substrate, an aluminized coating, and a transition zone on the Al substrate. In addition, the authors determined that the intermetallics TiAl and TiAl3 were formed in the transition zone on Ti substrate and aluminized coating. Further, the formation of intermetallics in the interface zone of Ti/Al had a delay time, and controlling the technology parameters (temperature, 640 °C; holding time, 90 min; pressure, 24 MPa; vacuum degree, 1.12–2.66 × 10⁻³ Pa) of diffusion bonding reduced the formation of intermetallics. Asta et al. [Reference Asta, De Fontaine, Van Schilfgaarde, Sluiter and Methfessel9] studied the phase stability of face-centered cubic (or fcc) alloys in the Ti–Al system using first-principles calculations. The results showed that the composition had a nontrivial effect on the phase stability of the Ti–Al system. Wróbel et al. [Reference Wróbel, Hector, Wolf, Shang, Liu and Kurzydłowski10] investigated the thermodynamic and mechanical properties of the lanthanum–magnesium phase using first-principles calculations. Hector et al. [Reference Hector, Herbst, Wolf, Saxe and Kresse11] also investigated the elastic properties of alkaline earth metals. Song et al. [Reference Song, Guo and Yang12] studied the TiAl-based alloys using first-principles calculations, and the results revealed that alloying with elements Cr, V, and Mn was likely to benefit the ductility of TiAl. To the best of our knowledge, as yet, there has been no systematic discussion in the literature of the mechanical properties, electronic structures, Debye temperatures, and the elastic anisotropy indexes of Ti–Al intermetallic compounds. The use of computer simulations in this investigation provided a theoretical basis for experimentation, while avoiding unnecessary experiments and waste of material resources. To systematically investigate the elastic constants, moduli, hardness, elastic anisotropies, electronic structures, and Debye temperatures of Ti–Al intermetallic compounds, we used first-principles calculations. Figure 1 shows the crystal structure of the Ti–Al intermetallic compounds. The outline of this paper is as follows: In “Results and discussion” section, we present our results with respect to mechanical properties, electronic structure, and Debye temperature; in “Conclusions” section, we draw some general conclusions; and in “Methods and details” section, we discuss our calculation methods and provide details about our computational approach.
Crystal structure of the Ti–Al intermetallic compounds: (a) TiAl, (b) Ti3Al, and (c) TiAl3.
Results and discussion
Lattice parameter and stability
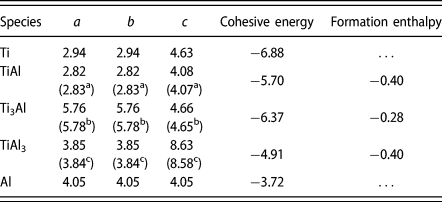
Table I lists the lattice parameters, cohesive energies, and formation enthalpies of TiAl, Ti3Al, and TiAl3, respectively, along with other available experimental and theoretical data. In Table I, we can see that the deviation of our results from the experimental data was less than 1%. Generalized gradient approximations (GGAs) are known to overestimate lattice parameters [Reference Qi, Jiang, Liu and Zhou13, Reference Duan, Ma, Li and Cao14, Reference Wen, Hou, Tian, Zhao, Li and Han15], but in this work, we observed the opposite trend. This may have been due to the experimental conditions, because the experimental data were obtained twenty years ago. If we were taking into account the influences of the crystal structure, our calculated results would have been in good agreement with the experimental findings [Reference Hong, Watsonyang, Freeman, Oguchi and Xu1, Reference Duwez and Taylor16, Reference Penaloza and Houska17]. Therefore, we can conclude that our adopted parameters are reliable in this context. Chemical stability is an important parameter in practical application. In this work, the chemical stability of a compound was described by its cohesive energy and formation enthalpy. The cohesive energy refers to the stability of a combination of two atoms. As shown in Table I, the maximum and minimum cohesive energy values were −4.91 eV/atom and −6.37 eV/atom for TiAl3 and Ti3Al, respectively. Therefore, Ti3Al is more thermodynamically stable than other compounds with respect to its cohesive energy. However, the stability of a compound is also determined by its formation enthalpy, where a negative formation enthalpy value indicates a stable crystal structure. The lower is the formation enthalpy, the more stable is the compound. The formation enthalpy values were −0.402 eV/atom, −0.282 eV/atom, and −0.401 eV/atom for TiAl, Ti3Al, and TiAl3, respectively. Therefore, the examined compounds may all be thermodynamically stable in their structures, with the stability sequence of Ti–Al intermetallic compounds having the following order: TiAl > TiAl3 > Ti3Al.
The calculated lattice parameters (a, b, and c in Å), cohesive energy (eV/atom), and formation enthalpy (eV/atom) of Ti–Al intermetallic compounds.

a Reference [Reference Duwez and Taylor16].
b Reference [Reference Penaloza and Houska17].
c Reference [Reference Hong, Watsonyang, Freeman, Oguchi and Xu1].
Mechanical properties
The elastic constants (C ij) indicate the relationship between the dynamical and mechanical behavior of crystals and also provide important information about the nature of the forces exerted on solids. In this work, we calculated the elastic constants of the Ti–Al intermetallic compounds, the results of which are shown in Table II.
The elastic constants (GPa) of the Ti–Al intermetallic compounds.

a Reference [Reference Tanaka25].
c Reference [Reference Nakamura and Kimura27].
Next, we discuss the mechanical stability criteria of these compounds. The equations for the elastic stability conditions in various crystal structure systems are as follows [Reference Patil, Khare, Tuttle, Bording and Kodambaka18, Reference Liu, Jiang, Zhou and Feng19]:
Tetragonal system
 $$\eqalign{\left( {{C_{11}} - {C_{12}}} \right) > 0, \cdots \left( {{C_{11}} + {C_{33}} - 2{C_{13}}} \right) > 0, \cdots \cr\left( {2{C_{11}} + {C_{33}} + 2{C_{12}} + 4{C_{13}}} \right) > 0 ,$$
 $${C_{11}} > 0, \cdots {C_{33}} > 0, \cdots {C_{44}} > 0, \cdots {C_{66}} > 0\quad .$$
Hexagonal system
 $$\eqalign{{C_{11}} > 0, \cdots {C_{44}} > 0, \cdots {C_{11}} - {C_{12}} > 0, \cr\cdots \left( {{C_{11}} + {C_{12}}} \right){C_{33}} - 2C_{13}^2 > 0\quad .$$
If the elastic constants of these compounds satisfy Eqs. (1) and (2), they are mechanically stable in their structures. From Table II, we can see that the calculated elastic constants of the Ti–Al intermetallic compounds satisfy Eqs. (1) and (2), which illustrates that the structures of these compounds are mechanically stable. For the Ti–Al intermetallic compounds, the calculated C 33 values were larger than other elastic constants, which indicated that they are strongly incompressible under uniaxial stress along z(ε33) axis. C 44 represents the shear modulus on the (100) crystal plane, and the C 44 value of TiAl is 110.2 GPa, Ti3Al is 71.4 GPa, and TiAl3 is 94.7 GPa. As such, we see that the calculated average elastic property of Ti3Al was lower than those of the other two.
The bulk modulus (B) indicates a solid’s compressibility under hydrostatic pressure. The Young’s modulus (E) and shear modulus (G) refer to a solid’s stiffness and resistance to transverse deformation, respectively [Reference Liu, Xing, Fu, Li, Sun and Lv20]. In this work, we obtained the bulk modulus (B), Young’s modulus (E), shear modulus (G), and Poisson’s ratio (σ) of polycrystalline crystal from the elastic constants using the Voigt–Reuss–Hill (VRH) approximation, which is the average of the Reuss and Voigt approximations, where the Reuss and Voigt approximations are the lower and upper bounds of the elastic modulus, respectively. The VRH approximation is known to be one of the best methods for evaluating the mechanical properties of polycrystalline materials, the equations of which are as follows [Reference Liu, Xing, Li, Tan, Sun and Yan21, Reference Liu, Chong, Jiang, Zhou and Feng22, Reference Liu, Jiang, Zhou and Feng23, Reference Wu, Zhao, Xiang, Hao, Liu and Meng24]:
Tetragonal system
 $${B_{\rm{V}}} = {1 \over 9}\left[ {2\left( {{C_{11}} + {C_{12}}} \right) + {C_{33}} + 4{C_{13}}} \right]\quad ,$$
 $$\eqalign{{B_{\rm{R}}} = {{{C^2}} \over M},\;M = {C_{11}} + {C_{12}} + 2{C_{33}} - 4{C_{13}},\;\cr{C^2} = \left( {{C_{11}} + {C_{12}}} \right){C_{33}} - 2C_{13}^2\quad ,$$
 $${G_{\rm{V}}} = {1 \over {30}}\left( {M + 3{C_{11}} - 3{C_{12}} + 12{C_{44}} + 6{C_{66}}} \right)\quad ,$$
 $${G_{\rm{R}}} \!= {{15} \over {\left\{ {\left( {{{18{B_{\rm{V}}}} / {{C^2}}}} \right) \!+ \!\left[ {{6 / {\left( {{C_{11}} - {C_{12}}} \right)}}} \right] \!+ \!\left( {{6 / {{C_{44}}}}} \right) \!+ \!\left( {{3 / {{C_{66}}}}} \right)} \right\}}}\quad ,$$
Hexagonal system
 $${B_{\rm{V}}} = {2 \over 9}\left( {{C_{11}} + {C_{12}} + {{{C_{33}}} \over 2} + 2{C_{13}}} \right)\quad ,$$
 $${B_{\rm{R}}} = {{\left( {{C_{11}} + {C_{12}}} \right){C_{33}} - 2C_{13}^2} \over {{C_{11}} + {C_{12}} + 2{C_{33}} - 4{C_{13}}}}\quad ,$$
 $${G_{\rm{V}}} = {1 \over {30}}\left( {7{C_{11}} - 5{C_{12}} + 12{C_{44}} + 2{C_{33}} - 4{C_{13}}} \right)\quad ,$$
 $${G_{\rm{R}}} = {5 \over 2}\left\{ {{{\left[ {\left( {{C_{11}} + {C_{12}}} \right){C_{33}} - 2C_{13}^2} \right]{C_{44}}\left( {{{{C_{11}} - {C_{12}}} \over 2}} \right)} \over {3{B_{\rm{V}}}{C_{44}}\left( {{{{C_{11}} - {C_{12}}} \over 2}} \right) + \left[ {\left( {{C_{11}} + {C_{12}}} \right){C_{33}} - 2C_{13}^2} \right]\left( {{C_{44}} + {{{C_{11}} - {C_{12}}} \over 2}} \right)}}} \right\}\quad ,$$
 $${B_{{\rm{VRH}}}} = {1 \over 2}\left( {{B_{\rm{V}}} + {B_{\rm{R}}}} \right)\quad ,$$
 $${G_{{\rm{VRH}}}} = {1 \over 2}\left( {{G_{\rm{V}}} + {G_{\rm{R}}}} \right)\quad ,$$
 $$E = {{9{B_{{\rm{VRH}}}}{G_{{\rm{VRH}}}}} \over {\left( {3{B_{{\rm{VRH}}}} + {G_{{\rm{VRH}}}}} \right)}}\quad ,$$
 $$\sigma = {{\left( {3{B_{{\rm{VRH}}}} - 2{G_{{\rm{VRH}}}}} \right)} \over {\left[ {2\left( {3{B_{{\rm{VRH}}}} + {G_{{\rm{VRH}}}}} \right)} \right]}}\quad ,$$
where the subscript R and V show the Reuss and Voigt, respectively. B VRH, B V, and B R are the bulk modulus calculated by VRH, Voigt, and Reuss approximation method, respectively. G VRH, G V, and G R are the shear modulus calculated by VRH, Voigt, and Reuss approximation method, respectively. As depicted in Table II, these results were in agreement with other experimental and theoretical data [Reference Tanaka25, Reference Tanaka, Okamoto, Inui, Minonishi, Yamaguchi and Koiwa26, Reference Nakamura and Kimura27]. The bulk modulus values were 112.3 GPa, 113.4 GPa, and 104.4 GPa for TiAl, Ti3Al, and TiAl3, respectively. Moreover, the shear modulus values were 61.2 GPa, 75.7 GPa, and 87.6 GPa, and the Young’s modulus values were 117.9 GPa, 192.4 GPa, and 165.8 GPa for TiAl, Ti3Al, and TiAl3, respectively. Jiang and coworkers [Reference Jiang, Zhao and Jiang28] proposed that the hardness of materials may be more sensitive to the shear modulus than to the bulk modulus. The larger is the shear modulus (G), the greater is the hardness of the compound. In this work, the hardness of these compounds decreased in the sequence of TiAl3 > Ti3Al > TiAl. The calculated Poisson’s ratios of these compounds varied from 0.218 (Ti3Al) to 0.325 (TiAl), which were close to 0.3 and clearly indicated their strong metallic bonding. The observed deviations from 0.3 were mainly due to the covalent nature of Ti–Al bonds in these compounds. Details of the chemical bonding characteristics of these compounds are presented in the electronic properties section. The B/G ratio is generally applied to indicate whether a compound is characterized by ductility or brittleness. If the B/G ratio is larger than 1.75, this indicates that a compound is ductile, whereas if the B/G ratio is lower than 1.75, the compound is brittle [Reference Pugh29]. In our case, the calculated B/G ratios of TiAl, Ti3Al, and TiAl3 were 1.83, 1.50, and 1.19, respectively, which indicated that, apart from TiAl, the other two compounds were brittle. However, a brittle compound is usually characterized by high hardness. Therefore, these values were consistent with the known relationship between hardness and brittleness.
Anisotropic materials are characterized by property values that differ in different directions, which may lead to cracks that degrade these material properties [Reference Ravindran, Fast, Korzhavyi, Johansson, Wills and Eriksson30]. Ti–Al intermetallic compounds are potential high-temperature structural materials, so any mechanical anisotropy of these compounds must be identified. To improve durability, it is essential to investigate the elastic anisotropy of Ti–Al intermetallic compounds. In this work, we calculated a number of metrics, including the anisotropy index (A B and A G), the shear anisotropic factors (A 1 and A 2), and universal anisotropic index (A U) using the following equations [Reference Xiao, Feng, Zhou, Jiang and Zhou31, Reference Feng, Xiao, Zhou, Pan and Clarke32, Reference Liu, Jiang, Zhou and Feng33]:
 $${A^{\rm{U}}} = 5{{{G_{\rm{V}}}} \over {{G_{\rm{R}}}}} + {{{B_{\rm{V}}}} \over {{B_{\rm{R}}}}} - 6 \ge 0\quad ,$$
 $${A_{\rm{B}}} = {{{B_{\rm{V}}} - {B_{\rm{R}}}} \over {{B_{\rm{V}}} + {B_{\rm{R}}}}}\quad ,$$
 $${A_{\rm{G}}} = {{{G_{\rm{V}}} - {G_{\rm{R}}}} \over {{G_{\rm{V}}} + {G_{\rm{R}}}}}\quad ,$$
 $${A_1} = {{4{C_{44}}} \over {{C_{11}} + {C_{33}} - 2{C_{13}}}}\quad ,$$
 $${A_2} = {{4{C_{44}}} \over {{C_{22}} + {C_{33}} - 2{C_{23}}}}\quad ,$$
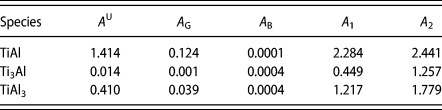
where B V, G V, B R, and G R are the bulk modulus and shear modulus estimation within Voigt and Reuss methods, respectively. If all the indices in above equations are equal to zero, the compound may have an isotropic structure. Large discrepancies from zero indicate highly anisotropic mechanical properties. As shown in Table III, the A B value of Ti–Al intermetallic compounds is very low, which indicated that these compounds have the weakest anisotropy with respect to the bulk modulus, but the index A B is inadequate to confirm the anisotropy. The universal anisotropic index A U is considered to be a better indicator of the anisotropic mechanical properties of Ti–Al intermetallic compounds. From the data of Table III, we find that TiAl has the largest A U value of the Ti–Al intermetallic compounds. In general, the larger is the A U value, the stronger is the anisotropy. Therefore, in this study, the descending order of anisotropy for Ti–Al compounds was TiAl > TiAl3 > Ti3Al. Although the A G, A 1, and A 2 values determine the anisotropy of the shear modulus, they have different functions. A 1 and A 2 indicate the anisotropies of the shear modulus in different crystal plane. From Table III, we can see that TiAl had the strongest anisotropic shear modulus in the (100) plane and (010) planes, with A 1 and A 2 values of 2.284 and 2.441, respectively. In the (100) and (010) planes, Ti3Al had the weakest anisotropic shear modulus of the Ti–Al compounds, with A 1 and A 2 values of 0.449 and 1.257, respectively.
The calculated universal anisotropic index (A U), percent anisotropy (A G and A B), and shear anisotropic factors (A 1, A 2, and A 3) of Ti–Al intermetallic compounds.

Hardness is one of the most important properties of a material and greatly influences its application value [Reference Richardson34]. Therefore, it is necessary to estimate the hardness of Ti–Al intermetallic compounds. In this work, we used a relatively simple semi-empirical equation for hardness, which follows [Reference Tian, Xu and Zhao35]:
 $${H_{\rm{V}}} = 0.92{K^{1.137}}{G^{0.708}},\;K = {G / B}\quad ,$$
where B is the bulk modulus and G refers to the shear modulus. Table II shows the predicted hardness of Ti–Al intermetallic compounds. We can see that the results are in good agreement with respect to the relationship between hardness and brittleness. Therefore, we concluded that our calculated hardness values in this work were reliable.
Electronic properties
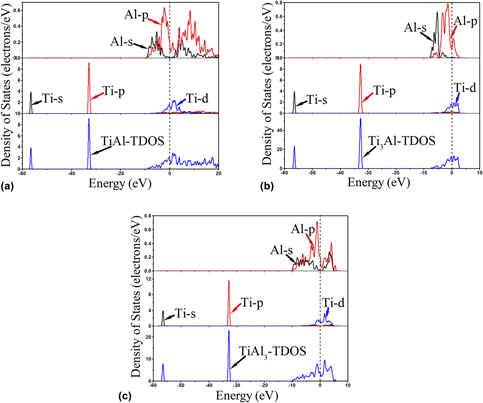
It is well known that the properties of materials are associated with their electronic states. We calculated the total density of states (DOS) and partial density of states (PDOS) of TiAl, Ti3Al, and TiAl3 at their equilibrium geometries at the GGA level using the Perdew–Burke–Ernzerhof (PBE) functional, and plotted the results in Figs. 2(a)–2(c). The total DOS of TiAl, Ti3Al, and TiAl3 were non-zero at the Fermi level, which indicated the metallic nature of these Ti–Al intermetallic compounds. In general, the larger is the DOS at the Fermi energy, the more unstable is the structure. The total density of states (TDOS) values at the Fermi level for TiAl, Ti3Al, and TiAl3 were 1.989 eV, 8.735 eV, and 4.236 eV, respectively, at the absolute temperature. Therefore, we can conclude that Ti3Al may be the most unstable compound of the Ti–Al intermetallic compounds, whereas TiAl may be the most stable. These results were in good agreement with our analyses of formation enthalpy. For TiAl, the band from −58 to −56 eV was contributed by the Ti-s bands, whereas the band from −33 to −31 eV was contributed by the Ti-p bands. For Ti3Al, the band from −57 to −56 eV was contributed by the Ti-s bands, whereas the band from −34 to −32 eV was contributed by the Ti-p bands. For TiAl3, the band from −57 to −56 eV was contributed by the Ti-s bands, whereas the band from −34 to −32 eV was contributed by the Ti-p bands. Near the Fermi level, the TDOS values of these Ti–Al intermetallic compounds mainly comprised the small Al-p states hybridized with the Ti-d states, which revealed the covalent interactions between the Ti–Al bonds. Moreover, the PDOS curves of these Ti–Al intermetallic compounds revealed that the contribution of the Fermi surface was primarily from the Ti-d states but also slightly involved the Al-p states. According to the aforementioned analysis, the bond characteristics of these Ti–Al intermetallic compounds are a combination of covalent and metallic bonds, which may lead to good electronic conductivity and relative high hardness and melting points.
The calculated TDOS and partial density of states (PDOS) of Ti–Al intermetallic compounds: (a) TiAl, (b) Ti3Al, and (c) TiAl3. Dashed lines represent the Fermi level.

Debye temperature
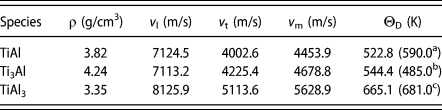
Debye temperature is a fundamental parameter related to a number of physical properties of materials, including their specific heat, elastic constants, and melting point [Reference Liu, Chong, Jiang, Zhou and Feng22]. The Debye temperature and sound velocity can be used to estimate the chemical thermal properties and chemical bond behavior of compounds. The average sound velocity (v m) and Debye temperature (ΘD) can be calculated as follows [Reference Feng, Xiao, Chen, Du, Yu and Zhou36, Reference Sun, Gao, Yoshida, Yano, Li and Liu37, Reference He, Jiang, Zhou and Feng38]:
 $${\Theta _{\rm{D}}} = {h \over k}{\left[ {{{3n} \over {4\pi }}\left( {{{{N_{\rm{A}}}\rho } \over M}} \right)} \right]^{{1 / 3}}}{v_{\rm{m}}}\quad ,$$
 $${v_{\rm{m}}} = {\left[ {{1 \over 3}\left( {{2 \over {v_{\rm{t}}^{\rm{3}}}} + {1 \over {v_{\rm{l}}^{\rm{3}}}}} \right)} \right]^{ - \left( {{1 / 3}} \right)}}\quad ,$$
 $${v_{\rm{l}}} = \sqrt {{{\left( {B + \left( {{4 / 3}} \right)G} \right)} \over \rho }} \quad ,$$
 $${v_{\rm{t}}} = \sqrt {{G \over \rho }} \quad ,$$
where ΘD is the Debye temperature, h is the Planck’s constant, k is the Boltzmann constant, N A is the Avogadro’s constant, n is the number of atoms in the molecule, M is the molecular weight, ρ is the theoretical density of the compound, v m is average sound velocity, v l is the longitudinal sound velocity, v t is the transverse sound velocity, B is the bulk modulus, and G is the shear modulus. Table IV lists the sound velocities and Debye temperatures of Ti–Al intermetallic compounds, from which we can see that our calculated Debye temperature was in agreement with other experimental and theoretical data [Reference Tanaka25, Reference Tanaka, Okamoto, Inui, Minonishi, Yamaguchi and Koiwa26, Reference Nakamura and Kimura27]. In general, the Debye temperature can indicate the thermal properties and chemical bonding characteristics of compounds. For a crystal structure, the Debye temperature reflects the strength of its covalent bonding. From Table IV, we can see that TiAl3 had the largest ΘD value of 665.1 K. Therefore, we can conclude that TiAl3 has stronger covalent bonds than other Ti–Al compounds. TiAl had the highest B/G ratio and lowest ΘD value of 522.8 K, which shows it has the strongest metallic character. In addition, the calculated average sound velocities of these Ti–Al compounds are relatively large, because they have larger elastic moduli and smaller densities. The v l and v t values are concerned with the density, shear modulus, and bulk modulus, respectively.
Sound velocities and Debye temperature of Ti–Al intermetallic compounds.

a Reference [Reference Tanaka25].
c Reference [Reference Nakamura and Kimura27].
Conclusions
In this work, we systematically investigated the phase stability, equilibrium lattice parameters, mechanical properties, electronic structures, and Debye temperatures of Ti–Al intermetallic compounds (TiAl, Ti3Al, and TiAl3) at 0 K using first-principles calculations. Based on our results, our main conclusions are as follows:
(1) The equilibrium lattice parameters were consistent with other available experimental and theoretical data, given that the deviation of our results from the experimental data was less than 1%. Moreover, based on both thermodynamic and mechanical criteria, all Ti–Al intermetallic compounds were thermodynamically stable.
(2) Ti3Al had the largest bulk modulus and Young’s modulus, with the values of 113.4 GPa and 192.4 GPa, respectively, whereas TiAl3 had the largest shear modulus of the Ti–Al intermetallic compounds. The B/G ratios revealed that these compounds were brittle, except for TiAl. The order of elastic anisotropy for these Ti–Al intermetallic compounds was TiAl > TiAl3 > Ti3Al.
(3) According to their electronic structures, the bonding behavior of all Ti–Al intermetallic compounds is a mixture of metallic and covalent bonds.
(4) The descending order of Debye temperatures for these Ti–Al intermetallic compounds was TiAl3 > Ti3Al > TiAl. The deviation of our calculated Debye temperatures from those in the experimental data was about 10%.
Methods and details
Based on the density functional theory, as implemented in the Cambridge Serial Total Energy Package (CASTEP) code, we used first-principles calculations to investigate the thermodynamic stability, elastic moduli, anisotropy indexes, chemical bonding characteristics, and Debye temperature of Ti–Al intermetallic compounds. For this work, the main Ti–Al intermetallic compounds were TiAl, Ti3Al, and TiAl3. Moreover, the space group symmetry of TiAl is P4/mmm (tetragonal), a = b = 2.832 Å, c = 4.070 Å. The space group symmetry of Ti3Al is P63/mmc (hexagonal), a = b = 5.780 Å, c = 4.647 Å. The space group symmetry of TiAl3 is I4/mmm (tetragonal), a = b = 3.854 Å, c = 8.584 Å. The interactions between the ionic cores and valence electrons are indicated by their ultrasoft pseudopotentials. For Ti and Al, the valence electron configurations considered were 3s23p 63d 24s 2 and 3s23p 1, respectively. We calculated the exchange-correlation energy by the GGA of the PBE scheme [Reference Perdew, Burke and Ernzerhof39]. We used the Monkhorst–Pack scheme for the k-point sampling in the first irreducible Brillouin zone, i.e., 10 × 10 × 10, for all structures. We adopted the Broyden–Fletcher–Goldfarb–Shanno [Reference Pfrommer, Côté, Louie and Cohen40] optimization method to obtain the equilibrium crystal structures of Ti–Al intermetallic compounds. The other convergence parameters were as follows: (i) the energy convergence per atom was reduced to 1.0 × 10⁻⁶ eV and (ii) the Hellmann–Feynman forces acting on distinct atoms converged to less than 0.05 eV/Å. We applied the Pulay density mixing scheme for the electron energy minimization process, and selected 450 eV as the kinetic energy cutoff value for the plane wave expansions.
To evaluate the elastic constants of these compounds, we used the stress–strain method in which we imposed several different strain modes on the crystal structure. The stress–strain curve is described by Hooker’s law.
 $${\sigma _{ij}} = {C_{ijkl}}{\varepsilon _{kl}}\quad ,$$
where σij is the stress tensor, εkl is the Lagrangian strain tensor, and C ijkl is the elastic constant tensor. We evaluated the Cauchy stress tensor for each strain mode and then identified the related elastic constants as the coefficients of the strain–stress relations, as shown in Eq. (26).
 $$\left( \matrix{ {\sigma _1} \hfill \cr {\sigma _2} \hfill \cr {\sigma _3} \hfill \cr {\tau _4} \hfill \cr {\tau _5} \hfill \cr {\tau _6} \hfill \cr} \right) = \left( {\matrix{ {{C_{11}}} & {{C_{12}}} & {{C_{13}}} & {{C_{14}}} & {{C_{15}}} & {{C_{16}}} \cr {} & {{C_{22}}} & {{C_{23}}} & {{C_{24}}} & {{C_{25}}} & {{C_{26}}} \cr {} & {} & {{C_{33}}} & {{C_{34}}} & {{C_{35}}} & {{C_{36}}} \cr {} & {} & {} & {{C_{44}}} & {{C_{45}}} & {{C_{46}}} \cr {} & {} & {} & {} & {{C_{55}}} & {{C_{56}}} \cr {} & {} & {} & {} & {} & {{C_{66}}} \cr} } \right)\left( {\matrix{ {{\varepsilon _1}} \cr {{\varepsilon _2}} \cr {{\varepsilon _3}} \cr {{\gamma _4}} \cr {{\gamma _5}} \cr {{\gamma _6}} \cr} } \right)\quad ,$$
where C ij is the elastic constant and τi and σi are the shear stress and normal stress, respectively. The independent elements of the elastic constant tensor are determined by the crystal symmetry, and in the high-symmetry point group, the required strain tensors for the C ij calculations can be greatly reduced. For example, a full set of elastic constants can be obtained using one strain tensor.
In order to investigate the thermodynamic stability of these compounds, the cohesive energy and formation enthalpy were calculated by the following formulas [Reference Liu, Jiang, Xing, Zhou and Feng41, Reference Li, Gao, Fan, Xiao, Yue, Min and Ma42]:
 $${E_{{\rm{coh}}}}\left( {{\rm{T}}{{\rm{i}}_x}{\rm{A}}{{\rm{l}}_y}} \right) = {{{E_{{\rm{total}}}}\left( {{\rm{T}}{{\rm{i}}_x}{\rm{A}}{{\rm{l}}_y}} \right) - x{E_{{\rm{iso}}}}\left( {{\rm{Ti}}} \right) - y{E_{{\rm{iso}}}}\left( {{\rm{Al}}} \right)} \over {x + y}}\quad ,$$
 $${\Delta _{\rm{r}}}H\left( {{\rm{T}}{{\rm{i}}_x}{\rm{A}}{{\rm{l}}_y}} \right) = {{{E_{{\rm{total}}}}\left( {{\rm{T}}{{\rm{i}}_x}{\rm{A}}{{\rm{l}}_y}} \right) - x{E_{{\rm{bulk}}}}\left( {{\rm{Ti}}} \right) - y{E_{{\rm{bulk}}}}\left( {{\rm{Al}}} \right)} \over {x + y}}\quad ,$$
where E coh(TixAly) and ΔrH(TixAly) are the cohesive energy and formation enthalpy of TixAly compounds, respectively; E total(TixAly) is the total energy of TixAly and E iso(X) refers to the total energy of a single X atom. E bulk(X) is the chemical potential of X atom in the bulk state.