I. INTRODUCTION
In recent years, rare earth sensitized nanomaterials have attracted great research interest in the areas of photocatalysis and luminescence as a result of their unique optoelectronic and photocatalytic features. It has been demonstrated that rare earth elements can be successfully incorporated into the host materials like CeO2, Reference Wang, Li, Ou, Feng, Qu and Tong1 ZnO, Reference Sin, Lam, Satoshib, Lee and Mohamed2 SnO2, Reference Al-Hamdi, Sillanpaa and Dutta3 TiO2, Reference Liu and Yu4 and so on. Moreover, the luminescent intensity of rare earth ions is invariably influenced by the nature of the host matrix. Reference Wang, Guo, Wang and Wang5 Among various metal oxides, TiO2 is regarded as one of the best photocatalysts because of its nontoxic nature, low cost, good thermal, chemical, and mechanical properties. In particular, TiO2 can be used as the ideal host material mainly owing to its high transparency in visible light region and high luminescence response ability. TiO2 doped with various rare earth elements has been investigated to efficiently enhance the photocatalytic activity, the phase stability of pure TiO2, and the intensity of luminescence emission. Reference Choi, Park and Hoffmann6
Rare earth metals, especially europium (Eu), have the incompletely occupied 4f and empty 5d orbitals, which can improve the photocatalytic activity of TiO2 due to their electron trap effects. Reference Chen, Zhu, Lv, Deng, Zhou and Deng7 The substitution of the Ti site of TiO2 with Eu, Reference Hsiao, Arul, Mangalaraj and Juang8 N and Eu, Reference Shi, Cui, Zong, Chen, Chen, Xu, Yang, Wang and Fu9 S and Eu, Reference Puskelova, Michal, Caplovicova, Antoniadou, Caplovic, Plesch and Lianos10 Nb and Eu, Reference Hirano and Sato11 etc., has been realized. It has been confirmed that the increased photodegradation efficiency of Eu-doped TiO2 can be attributed to the introduction of Eu3+ doping states, which help inhibiting e–h pair recombination while enhancing interfacial charge transfer reaction. Reference Paul and Mohanta12 Up to now, many different synthesis techniques have been utilized to prepare Eu-doped TiO2 nanomaterials, such as electrosping, Reference Bianco, Cacciotti, Fragala, Lamastra, Speghini, Piccinelli, Malandrino and Gusmano13 template, Reference Yao, Sui and Shi14 precipitation, Reference Zhang, Huo, Shen, Jia and Sun15 sol–gel, Reference Tang, Chen, Liu, Gong, Peng, Cai, Jin and Deng16 micro-arc oxidation Reference Chi, Choi, Jeong, Lee and Oh17 solvothermal, Reference Ding, Huang, Mou, Wu and Lu18 and hydrothermal Reference Hirano and Sato19 methods. Compared with other methods, it is well known that the hydrothermal method as one of the wet chemical routes is capable of synthesizing nanoscaled materials with uniform sizes by using the aqueous precursor solutions. Reference Wei and Chen20
Cenosphere, as a lightweight and hollow microsphere, is mainly made of silica and alumina and filled with air or inert gas. Thus the cenosphere has been photocatalytically fabricated because it can float on the surface of water and absorb more solar light. Reference Wang, Li, Wang, Li and Zhai21 However, the deposition of multilayer Fe3O4/SiO2/Eu-doped TiO2 onto cenospheres and its photocatalytic activities have rarely been reported so far. As mentioned above, even though the Eu-doped TiO2 has been successfully prepared, the practical applications are restricted in some extent mainly because of its difficulties in separation, recovery, and recycle. So it is very essential to investigate it. In the present study, for the purpose of obtaining a floating and magnetically recyclable TiO2 photocatalyst, we employ hydrothermal and precipitation methods to prepare the multilayer core/shell structured nanocomposites using cenospheres as the supporter. Herein, the magnetite Fe3O4 coating is used as the core layer due to its intrinsic properties like superparamagnetism. The inert SiO2 intermediate layer acts as a barrier for the separation of Fe3O4 and TiO2 coatings. Moreover, the globular-flower-like SiO2 coating can significantly increases the specific surface area of cenosphere. The outer Eu-doped TiO2 shell plays a key role in the environmental photocatalysis. The photocatalytic activities were evaluated by the photocatalytic decoloration of methylene blue (MB) solutions. The morphology, composition, crystal phase, magnetic property, chemical and lattice structures, thermal stability, and optical and luminescence responses of the as-obtained cenospheres were systematically studied by means of field emission scanning electron microscopy (FESEM), energy dispersive spectroscopy (EDS), x-ray diffraction (XRD), vibrating sample magnetometry (VSM), Fourier transform infrared spectroscopy (FT-IR), x-ray photoelectron spectroscopy (XPS), transmission electron microscopy (TEM), thermal gravimetric analysis, differential scanning calorimetry (DSC), diffuse reflectance spectroscopy (DRS), and photoluminescence (PL) spectroscopy. It is essential to note that the core/shell structured cenospheres can not only be recycled by a magnetic field, but also float on the surface of water, resulting in absorbing more solar light.
II. EXPERIMENTAL
A. Materials
The white cenospheres were purchased from Sinosteel Maanshan Institute of Mining Research Co., Ltd. (Anhui, China). The particle size of the cenosphere was from 8 to 80 μm. The compressive strength was in the range of 38–42 MPa and the true particle density was about 0.46 g/cm3. All chemicals were of analytical grade without further purification, and included ferric sulfate (Fe2(SO4)3), sodium thiosulfate pentahydrate (Na2S2O3·5H2O), tetraethyl orthosilicate (C8H2O4Si), titanium sulfate (Ti(SO4)2), urea (CO(NH2)2), polyethylene glycol (PEG-1000, OH(CH2CH2O) n H), polyvinylpyrrolidone [PVP, (C6H9NO) n ], 25% ammonium hydroxide (NH3·H2O), europium nitrate hexahydrate (Eu(NO3)3·6H2O), MB dye, and anhydrous ethanol (CH3CH2OH). The silane coupling agent KH550 (H2N(CH2)3Si(OC2H5)3, 3-aminopropyltriethoxysilane) was obtained from Dow Corning Co., Ltd. (Shanghai, China). Deionized water was used in the preparation of all solutions.
B. Deposition of Fe3O4 nanoparticles on cenosphere
The cenospheres were modified with silane coupling agent KH550 prior to use according to a process as previously reported in Ref. Reference Zhan, Zhang and Zhu22. A hydrothermal processing was used to immobilize Fe3O4 nanoparticles onto cenosphere surface. About 0.03 mol/L ferric sulfate was completely dissolved in 40 mL of deionized water at 60 °C. 0.03 mol/L sodium thiosulfate pentahydrate was then added into the above solution under vigorous stirring. The color of the mixed solution quickly changed into dark black purple and then into colorless and clear. A certain amounts of urea (0.27 mol/L) and PEG-1000 (2.5 g/L) were subsequently added into the mixed solution under continuous stirring. When the mixed solution turned into the colloidal suspension, 0.5 g of modified cenospheres was immediately poured into. After stirring for a further 3 min, the mixture solution was transferred to a 50 mL polytetrafluroethylene-lined (PTFE) stainless steel autoclave. Six identical autoclaves were sealed and placed in a furnace. The autoclaves were then heated to 150 °C at the rate of 10 rpm. After 4 h, the autoclaves were cooled down naturally and the black cenospheres floated on water surface were separated from the suspension. The as-obtained cenospheres were dipped into anhydrous ethanol solution for 10 min and then washed with deionized water for 5 min, and lastly dried in vacuum at 60 °C for 24 h.
C. Deposition of SiO2 particles on the Fe3O4 coated cenosphere
A precipitation route was used for the deposition of SiO2 particles on the Fe3O4 coated cenosphere. A mixture solution containing 150 mL anhydrous ethanol and 30 mL deionized water was first prepared. The pH value of the mixture solution denoted as A was adjusted to 8 by adding of 4 mL of 25% ammonium hydroxide. About 20 g of Fe3O4 coated cenospheres was put into the solution A and stirred at 60 °C at a rate of 250 rpm. 20 mL of anhydrous ethanol was mixed with 35 mL of tetraethyl orthosilicate under vigorous stirring at room temperature. The mixed solution, denoted as B, was then added dropwise into the above solution A. After that the mixture was kept stirring at the constant rate for 6 h. The gray cenospheres floated on water surface were separated from the suspension and successively washed with anhydrous ethanol and deionized water for 10 min, respectively. The as-obtained cenospheres were dried in vacuum at 80 °C for 1 h and then baked at 150 °C for 10 min.
D. Deposition of Eu-doped TiO2 nanoparticles on the Fe3O4/SiO2 core/shell cenosphere
The hydrothermal method was applied to deposit TiO2 nanoparticles on the surface of the Fe3O4/SiO2 core/shell cenosphere. The doping concentrations of Eu3+ ions were set to be 0.05, 0.1, 0.3, 0.5, 0.7, and 1% with respect to the concentration of Ti4+ ions. 0.2, 0.4, 1.2, 2.0, 2.8, and 4.0 mL of 0.01 mol/L europium nitrate hexahydrate solution were mixed with 30 mL of deionized water under ultrasound sonication at a frequency of 50 kHz and energy level of 100 W, respectively. 0.96 g of titanium sulfate, 0.48 g of urea, and 0.1 g of PVP were successively dissolved into the six different solutions, and sonicated for 10 min. The total volume of the reaction solution was controlled at 40 mL by adding of deionized water. 1.0 g of Fe3O4/SiO2 core/shell cenospheres was then put into the suspension, which was transferred to the above mentioned autoclave. Six different autoclaves were sealed and placed in a furnace and heated to 140 °C at a heating rate of 2 °C/min. After 2 h, the autoclaves were cooled down and the gray white cenospheres floated on water surface were separated from the suspension. The as-obtained cenospheres were washed with anhydrous ethanol and deionized water thrice for 10 min, respectively, and finally dried in vacuum at 60 °C for 24 h. The control cenospheres without Eu3+ doping were also prepared with same method as a comparison.
E. Characterization and measurements
The surface morphologies of cenospheres obtained at different stages were observed by using a field emission scanning electron microscope (JEOL JSM-6700; JEOL Ltd., Tokyo, Japan) coupled with an Oxford INCA Energy 400 x-ray EDS (Oxford Instruments, Oxfordshire, UK). The elemental analysis of cenosphere sample was performed with an EDS system.
The XRD patterns of cenospheres prepared at different stages were obtained by using Cu
 ${{\rm{K}}_{{\alpha _1}}}$
radiation (λ = 0.154056 nm), with a 7000S diffractometer (Shimazdu Corporation, Kyoto, Japan) at 40 kV and 40 mA with an angle of 2θ from 10 to 80° at a scan speed of 8°/min.
The microstructure of the Eu-doped TiO2 nanoparticles was determined by TEM (JEOL3010, 200 keV).
The static magnetic properties of cenospheres were measured by using a vibrating sample magnetometer (Quantum Design, Inc., San Diego, California) at a temperature of 300 K. The samples placed at the holder were caused to vibrate vertically at a frequency of 40 Hz and amplitude of 2 mm.
The Fourier transformed infrared spectra of cenosphere samples were obtained using a FT-IR 7600 spectrophotometer (Lambda Scientific Systems, Inc., Miami, Florida). The cenosphere samples were mixed with potassium bromide to obtain a uniform pellet. The spectra were in the range 400–4000 cm−1 at a resolution of 4 cm−1.
The surface chemical compositions and bonding states of cenospheres with and without Eu3+ doping were characterized by an x-ray photoelectron spectroscope using a Thermo Scientific Kα x-ray photoelectron spectrometer (Thermo Scientific, Manchester, UK) without Ar+ ion bombardment. The cenosphere samples were analyzed using a monochromatic Al Kα radiation at a binding energy of 1486.68 eV as the x-ray source. The vacuum of the analysis chamber was less than 8 × 10⁻⁶ Pa. All binding energies were calibrated to the C1s peak at 284.6 eV. The XPS peak areas and peak decomposition were studied by using the Thermo Scientific Advantage Data System (Thermo Scientific, Manchester, UK). The spectrum was first smoothed by using the Savitsky–Golay algorithm (auto-apply changes). The peak background was then processed by using the smart algorithm. The peak was fitted by using the Gaussian–Lorentzian mixed algorithm.
The thermogravimetric and DSC measurements were carried out in a NETZSCH STA 449F3 instrument (Netzsch, Bavaria, Germany) at a constant heating rate of 10 K/min with a nitrogen flush rate of 20 mL/min over the range of 40–550 °C.
The optical properties of cenospheres were determined by using DRS. The spectrophotometer (PerkinElmer Lamda 950 UV-VIS-NIR, Perkin Elmer, Waltham, Massachusetts) was equipped with an integrating sphere (ø150 mm) and barium sulfate (BaSO4) was used as the reference. The spectra were recorded in the 200–800 nm range at a scanning speed of 120 nm/min.
The PL spectra of cenospheres at room temperature were recorded using a Hitachi F-4500 fluorescence spectrophotometer (Hitachi Ltd., Tokyo, Japan) with a 150 W xenon lamp under photoexcitation at 300 nm.
The photocatalytic activity of as-prepared cenospheres was performed by using MB dye as the targeting agent under either UV or visible light irradiation. About 0.03 g of cenosphere samples was added into 50 mL of a 5 mg/L MB solution. For UV light irradiation, three Philips UV lamps (20 W, main wave length 254 nm; Shanghai Yitu Electronic Technology Co. Ltd., Shanghai, China) were hung above the solution at a distance of 15 cm. The intensity of UV light was determined as 3.3 mW/cm2 by a ST-512 UV illumination meter (Sentry Optronics Corp., Taipei, Taiwan). To simulate the visible light irradiation, the MB solution was covered with a 400 nm cut-off UV filter, and exposed to a 125 W metal halide lamp. The intensity of visible light was measured as 1.25 × 10⁴ lux by a TES 1332A digital light intensity meter (TES Electrical Electronic Corp., Taipei, Taiwan). The absorbance of the MB solution at λmax 664 nm was measured by using a VIS-7220N spectrophotometer (Beijing Rayleigh Analytical Instrument Corp., Beijing, China) at set intervals. The apparent photo-decolorization rate constant (k value) of MB solution was calculated according to a first order kinetic equation: ln(C 0/C t ) = f(t) = kt, where C 0 is the initial concentration of MB aqueous solution, and C t is the concentration of MB solution at time t. Reference Hsiao, Arul, Mangalaraj and Juang8 Prior to irradiation, the mixture solution was magnetically stirred in the dark for 90 min to obtain the adsorption–desorption equilibrium of MB onto cenospheres. The reusability of the as-prepared cenospheres for MB degradation was also carried out based on the above method. The MB solution was replaced with fresh solution and the cenosphere samples were used repeatedly.
III. RESULTS AND DISCUSSION
A. XRD analysis
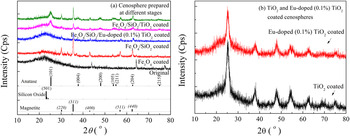
The XRD patterns of the as-prepared cenospheres at different stages are shown in Fig. 1. The XRD pattern of the original cenosphere is observed without any characteristic diffraction peaks. After being loaded with Fe3O4 nanoparticles, the diffraction peaks located at 2θ of 30, 36, 43, 57, and 63° are in accordance with the {220}, {311}, {400}, {511}, and {440} planes of magnetite, which has a cubic inverse spinel structure (JCPDS card No. 19-0629). Reference Lu, Shen, Xie and Zhang23 After deposition of SiO2, the broad diffraction peak centered at 2θ = 23° for the Fe3O4/SiO2 coated cenospheres are apparently enhanced (JCPDS card No. 43-0784). Reference Anastasescu, Anastasescu, Teodorescu, Gartner and Zaharescu24 After being immobilized with TiO2 nanoparticles, a series of typical peaks at 2θ of 25, 38, 48, 54, 55, 63, and 75° are found. These diffraction peaks are ascribed to the {101}, {004}, {200}, {105}, {211}, {204}, and {215} planes of tetragonal anatase TiO2 (JCPDS card No. 21-1272). Reference Zhang, Huo, Shen, Jia and Sun15 When the Eu3+ ions are doped into TiO2, there is no significant change in the XRD pattern of the Fe3O4/SiO2/Eu-doped (0.1%) TiO2 coated cenosphere [Fig. 1(a)]. This result is also verified by comparison of the XRD patterns between the TiO2 coated and 0.1% Eu-doped TiO2 coated cenosphere [Fig. 1(b)]. Furthermore, the characteristic diffraction peaks of Eu2O3 are not identified because of the trace amount of Eu3+ element.
XRD patterns of the as-prepared cenospheres.

B. FESEM and EDS analyses
The surface morphologies of the original and Fe3O4 coated cenospheres and EDS spectrum of the Fe3O4 coated cenospheres are shown in Fig. S1 in Supporting Information (TiO2 coated and 0.1% Eu-doped TiO2 coated cenospheres are not given). It can be seen that the surface of the original cenosphere is very clean and smooth [Fig. S1(a)]. After hydrothermal treatment with ferric sulfate, cenosphere is homogeneously coated by a layer of granular substances scattering with some micrometer sized particles [Figs. S1(b) and S1(c)]. From the high resolution image, this coating is composed of spherical nanoparticles with a lateral size smaller than 100 nm [Fig. S1(d)]. The EDS results indicate that the chemical compositions of the Fe3O4 coated cenosphere consist of O, Si, Fe, Ca, and S elements [Fig. S1(e)]. The element mapping of the Fe3O4 coated cenospheres is shown in Fig. S2 in Supporting Information. It is testified that the elements of O, Si, Fe, and Ca are uniformly distributed onto cenosphere surface. These micrometer sized particles are mainly comprised of S element.
The surface and cross-section morphologies, line scanning map, and EDS spectrum of the Fe3O4/SiO2 coated cenosphere are shown in Fig. S3 in Supporting Information. After deposition of SiO2, the surface of the Fe3O4/SiO2 coated cenosphere becomes very rough and looks like globular flower sphere in appearance [Fig. S3(a)]. Many small particles composed of submicrometer-sized particles are randomly stacked onto cenosphere surface [Fig. S3(b)]. The cross-sectional image confirms that the “valley-and-ridge” topography together with a lot of tiny holes is formed [Fig. S3(c)]. Obviously the special topography not only contributes to the deposition of TiO2 nanoparticles, but also causes the repeated reflections of light within or onto cenospheres, suggesting the increase of light absorption. The increased surface area of cenosphere is liable to contact with pollutant molecules. At the same time, the results of the line scanning map reveal that the thickness of the Fe3O4/SiO2 coating is about 4 μm. The inner layer of Fe3O4 nanoparticles is totally enclosed by an exterior layer of SiO2 particles [Fig. S3(d)]. The EDS results show that after being coated with SiO2, the amounts of O and Si elements increase, while the contents of Ca and Fe elements decrease. However, the element of S is not detected [Fig. S3(e)]. The reason may be due to the redissolving of S element during treatment.
The surface morphology, line scanning map, and EDS spectrum for the Fe3O4/SiO2/TiO2 coated and Fe3O4/SiO2/Eu-doped (0.1%) TiO2 coated cenospheres are shown in Figs. S4 and S5 in Supporting Information, respectively. It is seen that after deposition of TiO2 or Eu-doped (0.1%) TiO2, the surfaces of the as-prepared cenospheres become smooth for both samples and many tiny particles are immobilized on the surfaces of the tiny SiO2 microspheres [Figs. S4(a), S4(b), S5(a), and S5(b)]. The high resolution images display that the average particle sizes for the TiO2 and Eu-doped (0.1%) TiO2 are below 100 nm [Figs. S4(c) and S5(c)]. These spherical nanoparticles are compactly packed together. The line scanning map analyses testify that the Ti element is located in the outer layer, and the Si element is in the middle section, and the Fe element is existed in the inter layer [Figs. S4(d) and S5(d)]. Additionally, the EDS results prove that besides the elements of O, Si, Ca, Ti, and Fe, the rare earth Eu element is observed in the Fe3O4/SiO2/Eu-doped (0.1%) TiO2 coated cenospheres [Figs. S4(e) and S5(e)]. So the Fe3O4/SiO2/TiO2 coated cenospheres doped with or without Eu3+ ions are fabricated.
C. TEM analysis
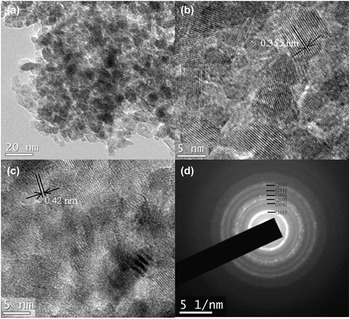
To investigate the effect of Eu3+ doping on the crystal structure of TiO2, the TEM, high-resolution transmission electron microscopy (HRTEM), and selected area electron diffraction (SAED) of 0.1% Eu-doped TiO2 nanoparticles are shown in Fig. 2. It is seen that the average particle size of the 0.1% Eu-doped TiO2 is smaller than 10 nm [Fig. 2(a)]. The resolved lattice spacing, judged from the typical HRTEM lattice image, is measured as 0.355 nm [Fig. 2(b)], which is in accord with the earlier works. Reference Chen, Zhu, Lv, Deng, Zhou and Deng7,Reference Paul and Mohanta12 The obtained value agrees well with the low energy (101) crystal plane of anatase TiO2 (0.35 nm). However, it is also noted that the lattice spacing of 0.42 nm for some specific nanocrystals is quite larger than others [Fig. 2(c)], which is very close to the lattice spacing (0.44 nm) of (211) crystal plane of Europia (Eu2O3, JCPDS card No. 34-0392). In addition, the distortion of TiO2 lattice along with edge dislocation is also noticed. The lattice defect is probably induced by the incorporation of Eu3+ ions into the internal crystallite structure of TiO2. Reference Paul and Mohanta12 The diffraction rings displayed in SAED pattern can be indexed as (101), (004), (200), (105), (211), and (204) crystal planes of anatase TiO2 [Fig. 2(d)]. As a result, it can be deduced that the Eu3+ ions are doped homogeneously into TiO2 coating.
TEM (a), HRTEM (b) and (c) images, and SAED pattern (d) of the Eu-doped (0.1%) TiO2.

D. Thermogravimetry (TG) and DSC analyses
The TG and DSC curves of the as-prepared cenospheres are shown in Fig. S6 (Supporting Information). It is obvious from the TG curves [Fig. S6(a)] that there is no typical onset decomposition temperature for all samples. The weight of the tested sample decreases linearly with the increase of temperature. The remaining masses are about 96.0% for the original, 94.4% for the Fe3O4 coated, 93.0% for the Fe3O4/SiO2 coated, 91.5% for the Fe3O4/SiO2/TiO2 coated cenosphere, and 91.7% for the Fe3O4/SiO2/Eu-doped (0.1%) TiO2 coated cenospheres at 550 °C, respectively. It is clear from the DSC curves [Fig. S6(b)] that the initial endothermic peaks occurred in the range of 50–60 °C are assigned to the evaporation of adsorbed water on all tested samples. The endothermal peak at about 470 °C is found in the Fe3O4 coated cenospheres, which is attributed to the decomposition of Fe3O4. After being coated with a thick layer of SiO2, the thermal stability of the Fe3O4/SiO2 coated cenospheres is greatly improved. Further being loaded with TiO2 or Eu-doped (0.1%) TiO2, the thermal behaviors of the Fe3O4/SiO2/TiO2 coated and Fe3O4/SiO2/Eu-doped (0.1%) TiO2 coated cenospheres change a little.
E. FT-IR analysis
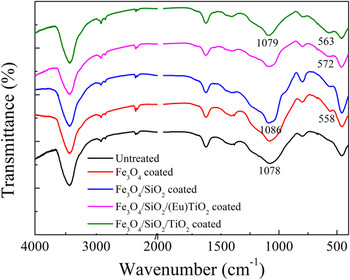
The FT-IR spectra of the as-prepared cenospheres at different stages are shown in Fig. 3. After treatment with KH550, the characteristic absorption peaks of silane coupling agent are not found in the modified cenospheres because of a trace amount of KH550 (not given here). After deposition of Fe3O4 nanoparticles, the absorption band at 558 cm−1 is observed in the Fe3O4 coated cenospheres, which is attributed to the characteristic band of Fe–O stretching vibration of Fe3O4. After deposition of SiO2, the Si–O stretching band is distinctly enhanced and shifted from 1078 to 1086 cm−1. After deposition of TiO2, influenced by the Ti–O band at 578 cm−1 of TiO2, Reference Leostean, Stefan, Pana, Cadis, Suciu, Silipas and Gautron25 the band at 558 cm−1 is shifted to 572 cm−1. When the Eu3+ ions (0.1%) are doped into TiO2, the corresponding absorption band is shifted to 563 cm−1.
FT-IR spectra of the as-prepared cenospheres.

F. XPS analysis
The XPS spectra of the Fe3O4/SiO2/TiO2 coated and Fe3O4/SiO2/Eu-doped (0.1%) TiO2 coated cenospheres and high-resolution Eu3d XPS spectrum are shown in Fig. S7 (Supporting Information). The quantitative elemental analysis is also listed in Table S1. It is evident that the existence of C1s is resulted from the usage of conductive carbon tape. The element of Fe2p is not observed for both samples, implying the internal layer of Fe3O4 nanoparticles is completely coated by the middle layer of SiO2 with a certain thickness. The element of N1s (400.11 eV) is identified in the survey spectrum of the Fe3O4/SiO2/TiO2 coated cenosphere, which has the capability of photocatalytic activity under visible light irradiation. For the Fe3O4/SiO2/Eu-doped (0.1%) TiO2 coated cenosphere, the element of N1s is disappeared. This is because the N element might be incorporated into the matrix of TiO2. However, the element of Eu3+ (1133.37 eV) is detected [Fig. S7(a)]. Reference Mezzi, Kaciulis, Cacciotti, Bianco, Gusmano, Lamastra and Fragala26 This is further confirmed by the high-resolution Eu3d XPS spectrum [Fig. S7(b)], indicating the coexistence of two oxidation states for the Eu2+ and Eu3+ ions. Reference Feng, Yang, Zhang and Liu27 The peak at about 1135 eV is ascribed to the Eu3+3d 5/2 (3d4f 6) configuration of Eu2O3, and the peak at around 1124 eV is attributed to the Eu2+ configuration of Eu2O3. Reference Wang, Guo, Wang and Wang5
G. DRS analysis
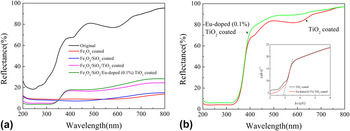
The diffuse reflectance spectra of the original, Fe3O4 coated, Fe3O4/SiO2 coated, Fe3O4/SiO2/TiO2 coated, and Fe3O4/SiO2/Eu-doped (0.1%) TiO2 coated cenospheres are shown in Fig. 4(a). It is apparent that the original cenosphere with smooth morphology absorbs UV rays to a certain extent and reflects most of visible lights. Three characteristic absorption peaks are noticed at around 245, 410, and 590 nm. About 90% of UV and visible light irradiations can be absorbed by the nanoparticulate Fe3O4 coated cenospheres. After deposition of globular-flower-like SiO2 coating, the reflectance of the Fe3O4/SiO2 coated cenosphere changes slightly, which is mainly determined by the internal Fe3O4 coating. Further being coated with nanoparticulate TiO2 thin film, the typical reflectance spectrum is observed in the Fe3O4/SiO2/TiO2 coated cenosphere. The reflectance in UV wavebands decreases slightly, while the reflectance in visible light wavebands increases because of the TiO2 coating. When the element Eu3+ is doped into TiO2, the surface morphology has no distinct change, but the reflectance of the Fe3O4/SiO2/Eu-doped (0.1%) TiO2 coated cenosphere increases slightly in visible light region. The results are confirmed by the diffuse reflectance spectra of the TiO2 coated and 0.1% Eu-doped TiO2 coated cenospheres without regard for the influence of Fe3O4/SiO2 basement, as depicted in Fig. 4(b). Additionally, the curves of (αhν)1/2 (α is the absorption coefficient) versus hν are depicted in the inset of Fig. 6(b) for the TiO2 coated and 0.1% Eu-doped TiO2 coated cenospheres. Reference Lin, Guan, Zou, Liu, Zhang, Liu and Zhai28 The calculated band gaps are nearly identical (2.9 eV) for both samples, smaller than the theoretical value of anatase TiO2 (3.2 eV). Reference Yao, Sui and Shi14 The differences are obviously caused by the matrices of cenospheres.
Diffuse reflectance spectra of (a) the original, Fe3O4 coated, Fe3O4/SiO2 coated, Fe3O4/SiO2/TiO2 coated and Fe3O4/SiO2/Eu-doped (0.1%) TiO2 coated cenospheres, and (b) TiO2 coated and Eu-doped (0.1%) TiO2 coated cenospheres.

H. PL analysis
The PL spectra of the Fe3O4/SiO2/TiO2 coated and Fe3O4/SiO2/Eu-doped (0.1%) TiO2 coated cenospheres are shown in Fig. S8 in Supporting Information. It is reported that the PL spectrum of TiO2 is correlated with its transfer behavior of photo-induced electrons and holes (TiO6 octahedra and oxygen vacancies), reflecting the separation and recombination of charge carriers. Reference Lei, Zhang, Meng, Li, Zhang, Liang, Chen and Wang29 For the Fe3O4/SiO2/TiO2 coated cenospheres, a broad emission band is noticed in the 350–550 nm range (direct electron–hole radiative recombination in 350–400 nm, indirect band gap and surface recombination in 400–500 nm, and charge transfer transition of trapped electron in an oxygen vacancy and Ti3+ defects in 500–550 nm), which has been demonstrated by the previous literature. Reference Yu, Yu, Ho, Jiang and Zhang30,Reference Li, Haneda, Labhsetwar, Hishita and Ohashi31 After being doped with Eu3+ (0.1%) ions, the intensity of the Fe3O4/SiO2/Eu-doped (0.1%) TiO2 coated cenospheres decreases significantly, indicating the higher charge-separation efficiency. The reason is attributed to the incorporation of Eu3+ ions into the TiO2 nanocrystals, resulting in effective quenching of PL in 0.1% Eu-doped TiO2 coated cenospheres. Reference Cheng, Zhu, Weng, Lin and Wang32 The low recombination rate of photo-generated electron–hole pairs Reference Agorku, Kuvarega, Mamba, Pandey and Mishra33 and the reduction of surface Ti3+ species Reference Chen, Cao, Lin and Gao34 lead to the high photocatalytic activity. Therefore, the doping of Eu3+ ions causes the change in the valence band level of Fe3O4/SiO2/Eu-doped (0.1%) TiO2, which results from the photocatalytic formation of OH∣ radicals induced by UV or visible light irradiation.
I. Analysis of photocatalysis
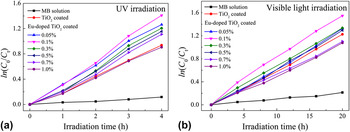
It has been reported that the doping concentration of the rare earth ion has a great effect on the photocatalytic activity of rare earth doped TiO2 nanoparticles. Reference Wang, Wang, An, Song and Zhang35 Thus the TiO2 coated cenospheres doped with various Eu3+ ion concentrations have been fabricated by a hydrothermal method. The photocatalytic degradation of MB solution for the TiO2 coated and Eu-doped TiO2 coated cenospheres is measured under UV and visible light irradiations, respectively, and the results are shown in Figs. 5(a) and 5(b). The effect of Eu3+ doping concentration on the photo-decolorization rate constant (k value) is shown in Fig. S9 in Supporting Information. It is clear that the k value increases with the increase of the doping concentration of Eu3+ ions at first. When the doping concentration of Eu3+ ions reaches to 0.1%, the 0.1% Eu-doped TiO2 coated cenosphere has the best photocatalytic activity in all tested samples under both UV and visible light irradiations. Afterward, the k value gradually decreases with increasing Eu3+ doping concentration [Figs. S9(a) and S9(b)]. The doping of Eu3+ ions causes the distortion of TiO2 lattice confirmed by TEM analysis, which results in the imbalance of surface charge onto TiO2 surface. Reference Liu and Jiang36 To compensate the surface charge imbalance, more OH− radicals are accordingly adsorbed on the surface of TiO2. A high concentration of OH− ions facilitates the generation of active radicals. Meanwhile, the Eu3+ ions incorporated into TiO2 could decrease the recombination probability of electron–hole pairs during the charge transfer process in some degree. Reference Puskelova, Michal, Caplovicova, Antoniadou, Caplovic, Plesch and Lianos10 The crystal structure of TiO2 nanoparticle has little change when the doping concentration of Eu3+ ions is below 0.1%. On the other hand, if more than 0.1% Eu3+ ions are doped into TiO2, the deposition of Eu3+ ions on TiO2 surface would hinder the energy transfer from a photo activated donor to TiO2. These Eu-doped sites became the recombination center of charge carriers. Reference Li, Hou, Zhang and Zhang37 Therefore, the optimum doping amount of Eu3+ ions is determined as 0.1% with respect to the amount of Ti4+ ions.
The photocatalytic degradation of MB solution for the control MB solution, TiO2 coated and Eu-doped TiO2 coated cenospheres under (a) UV and (b) visible light irradiation.

The photocatalytic degradations of MB dye solution for the TiO2 coated, 0.1% Eu-doped TiO2 coated, Fe3O4/SiO2/TiO2 coated, and Fe3O4/SiO2/Eu-doped (0.1%) TiO2 coated cenospheres under UV irradiation are compared in Fig. S10 (Supporting Information). Obviously, the 0.1% Eu-doped TiO2 coated cenosphere exhibits the highest photoactivity. The k value of 0.1% Eu-doped TiO2 coated cenosphere (k = 0.37) is almost 1.5 times higher than that of TiO2 coated one (k = 0.25), which is consistent with the previous study. Reference Wei and Chen20 However, the photoactivity of Fe3O4/SiO2/TiO2 coated cenosphere is greatly reduced primarily due to the decrease of TiO2 content per unit weight. In comparison with the Fe3O4/SiO2/TiO2 coated cenosphere (k = 0.22), the photoactivity of the Fe3O4/SiO2/Eu-doped (0.1%) TiO2 coated cenosphere (k = 0.26) is improved to a certain extent. Moreover, the k value of the Fe3O4/SiO2/Eu-doped (0.1%) TiO2 coated cenosphere is slightly larger than that of the TiO2 coated one. Thus the doping of Eu3+ ions (0.1%) can improve the photocatalytic activity of the Fe3O4/SiO2/TiO2 coated cenosphere.
In life cycle assessment studies, the Fe3O4/SiO2/Eu-doped (0.1%) TiO2 core/shell structured cenosphere is used for the photo-degradation of MB dye solution. After 5 h of UV irradiation, the cenosphere sample was collected and washed with deionized water and dried for the next testing. The relationship between ln(C 0/C t=5 ) and experimental cycle are shown in Fig. S11 (Supporting Information). It is apparent that the photocatalytic activity of the Fe3O4/SiO2/Eu-doped (0.1%) TiO2 coated cenosphere decreases with the increase of experimental cycle. After 5 cycle, the ln(C 0/C) decreases by 10%. In other words, the core/shell coating of Fe3O4/SiO2/Eu-doped (0.1%) TiO2 is firmly deposited onto cenosphere surface.
J. VSM analysis
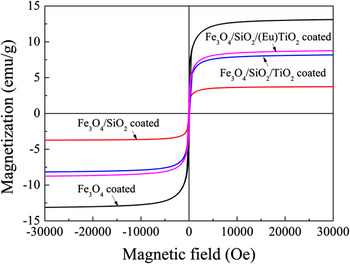
The hysteresis loops for the as-prepared cenospheres at ambient temperature are shown in Fig. 6. The magnetic properties of the cenospheres are obtained after being coated by a layer of Fe3O4 nanoparticles. The magnetization first increases with increasing the magnetic field, and then turns flat at a magnetic field of around ±5000.0 Oe. This is attributed to the superparamagnetism behaviors of magnetite. When the particle sizes of magnetic materials are below the single domain value, these particles display paramagnetic or superparamagnetic properties. Reference Yao, Zhang, Shi and Wang38 Once the magnetic field is switched off, the magnetization is lost quickly. The coercive force and remnant magnetizations of the Fe3O4 coated cenospheres can be ignorable, and the high saturation magnetization is about 13.1 emu/g. After being loaded with SiO2, the magnetization of the Fe3O4/SiO2 coated cenospheres is reduced to some degree. The high saturation magnetization decreases to 3.7 emu/g. This is caused by the decrease of the magnetite content per unit weight. After being deposited with TiO2 nanoparticles, the saturation magnetization increases to 8.2 emu/g. It is primarily assigned to the removal of some of SiO2 particles during processing. The content of magnetite in the whole coating is relatively improved. Moreover, the saturation magnetization of the Fe3O4/SiO2/Eu-doped (0.1%) TiO2 coated cenospheres increases further to 8.7 emu/g, which is probably due to its intrinsic magnetic characteristics of Eu3+ ions. Reference Franco, Pessoni and Soares39
Hysteresis loops of as-prepared cenospheres at ambient temperature.

IV. CONCLUSIONS
In this study a three-layer core/shell structured Fe3O4/SiO2/Eu-doped TiO2 particle is coated in succession onto cenosphere by hydrothermal and precipitation processes. The doping concentration of Eu3+ ions has a great effect on the photoactivity of the Fe3O4/SiO2/Eu-doped TiO2 coated cenosphere. The mass percent of Eu3+ to Ti4+ ions is optimized as 0.1%. The Eu3+ ions are successfully doped into TiO2. The Fe3O4/SiO2/Eu-doped (0.1%) TiO2 coated cenosphere exhibits better photocatalytic activity in the photodegradation of MB than that of the Fe3O4/SiO2/TiO2 coated one. The saturation magnetization of the Fe3O4/SiO2/TiO2 coated cenosphere increases to some extent after being doped with Eu3+ ions. The functionalized cenosphere endowed with magnetic and photocatalytic properties can be used repeatedly and applied to waste water treatments.
Supplementary Material
To view supplementary material for this article, please visit http://dx.doi.org/jmr.2015.352.
ACKNOWLEDGMENTS
This study has been supported by the cooperative innovational center for technical textiles (Grant No. 2015-ZX21), Shaanxi Province of China. The corresponding author also acknowledges the Youth Leading Scholar Supporting Plan of Xi'an Polytechnic University.