1. Introduction
Starspots, analogous to sunspots, are the most prominent manifestations of stellar magnetic activity. Their properties provide crucial insights into the stellar dynamo, the mechanism responsible for generating magnetic fields in cool stars (Berdyugina Reference Berdyugina2005). A deeper understanding of the analogy between solar and stellar spots is crucial for comprehending the stellar dynamo, an effort supported by advances in solar and stellar observations (Wedemeyer et al. Reference Wedemeyer, Barta and Brajša2024). It is a well-established empirical fact that a star’s magnetic activity declines as it ages, a cornerstone of age-dating techniques like gyrochronology (Skumanich Reference Skumanich1972; Barnes Reference Barnes2007). However, the physical processes driving this decline are not fully understood, and recent studies have begun to explore not only internal mechanisms but also external influences, such as star-planet interactions (Menezes et al. Reference Menezes, Araújo and Valio2025).
The manifestation of stellar magnetic activity includes phenomena such as chromospheric emission, coronal X-rays, flares, and, most visibly, starspots. Measuring the magnetic fields inside these spots is a challenging task. Traditional methods face limitations; for instance, as discussed by Donati & Landstreet (Reference Donati and Landstreet2009), Zeeman-Doppler Imaging (ZDI) is best suited for mapping global, weaker magnetic fields on fast-rotating stars and often misses the compact, ultra-strong fields within spots. Zeeman Broadening (ZB) can measure total magnetic flux but is limited to slowly rotating stars and is entangled with the spot filling factor (Reiners Reference Reiners2012).
The fundamental question of this work is whether the age-related decrease in activity is driven by a change in the intrinsic properties of starspots or by their surface coverage. As a star ages, do its spots become magnetically weaker (a change in quality), or does the star simply produce fewer spots, thus reducing the total spotted area (a change in quantity)? This work synthesizes the key findings from two recent studies (Menezes et al. Reference Menezes, Araújo and Valio2024; Araújo et al. Reference Araújo, Lima, Menezes and Valio2025) that applied the starspot transit mapping technique, first proposed by Silva (Reference Silva2003), to address the quality vs. quantity dichotomy.
2. Methodology
Our approach leverages the unique geometry of planetary transits to probe the properties of starspots. When a planet passes in front of its host star, it causes a characteristic dip in the observed stellar brightness. If the planet’s path crosses a dark starspot during transit, the amount of blocked light temporarily decreases, creating a small positive “bump” in the transit light curve (Figure 1).
Illustration of the starspot transit mapping technique. Top panel: A schematic of a transiting exoplanet (large black circle) occulting a starspot (smaller grey circle) on the stellar disk. Middle panel: The observed transit light curve (black dots) shows a characteristic anomaly, or bump, where the planet crosses the spot. A model of a transit on an immaculate star is overplotted (red dashed line). Bottom panel: The residual flux, obtained by subtracting the spotless model from the data. The spot-crossing event is isolated as a prominent peak, which is modeled (red solid line) to determine the spot’s physical properties.

Figure 1 Long description
Panel A: A schematic diagram of a star with a transiting exoplanet. The star is depicted as a large white circle with a smaller grey circle representing a starspot. The exoplanet is shown as a large black circle transiting across the star, crossing the starspot. The x-axis is labeled 'x/R_Star' and the y-axis is labeled 'y/R_Star'. Panel B: A line graph showing the observed transit light curve. The x-axis is labeled 'Time (h)' and the y-axis is labeled 'Relative Flux'. Black dots represent the light curve of the transits, and a red dashed line represents the model without spots. The graph shows a dip in relative flux as the exoplanet transits the star, with an anomaly where the planet crosses the spot. Panel C: A scatter plot showing the residual flux. The x-axis is labeled 'Time (h)' and the y-axis is labeled 'Residual Flux'. Black dots represent the residual flux, and a red solid line represents the fit spot. The plot shows a prominent peak corresponding to the spot-crossing event.
By carefully analysing these spot-crossing events, we can extract key physical parameters of the starspot, including its size, position, and intensity contrast relative to the surrounding photosphere. This technique offers several advantages:
-
• It is not limited by the stellar rotation rate, unlike Zeeman-Doppler Imaging.
-
• It provides direct measurements of individual spots, avoiding the degeneracy between spot coverage and field strength that affects Zeeman Broadening.
-
• It can be applied to archival data from space-based photometric missions like Kepler, K2, and TESS.
2.1. Deriving Magnetic Field Strength and Area Coverage
A key challenge in modeling spot-crossing events is the well-known degeneracy between a spot’s area (A) and intensity (I). To break this degeneracy, we use a combined parameter, the Spot Flux Deficit (
 ${\Delta F_\mathrm{spot}}$
), which robustly quantifies the total missing flux from the spot:
 \begin{equation}{\Delta F_\mathrm{spot}} = A \times (1 - I)\end{equation}
As shown in Menezes et al. (Reference Menezes, Araújo and Valio2024), the strong empirical relationship between the Spot Flux Deficit and the maximum magnetic field strength (
 ${B_\mathrm{spot}}$
), calibrated using over 32,000 sunspots (Valio et al. Reference Valio, Spagiari, Marengoni and Selhorst2020), is given by:
 \begin{equation}{B_\mathrm{spot}} = (1170 \pm 3) + (844 \pm 3) \times {\log({\Delta F_\mathrm{spot}})}\end{equation}
This relationship, calibrated using solar observations in which both photometric properties and direct magnetic field measurements are available, allows us to estimate the magnetic field strength of starspots on distant stars where direct magnetic measurements are not feasible. The same models also allow us to estimate the fractional area of the star covered by spots, as described in Araújo et al. (Reference Araújo, Lima, Menezes and Valio2025).
2.2. Sample Selection and Data Analysis
Our study includes 14 FGK and M stars hosting transiting exoplanets from the Kepler, K2, and TESS missions, spanning ages from
 $\sim$
100 Myr to
 $\sim$
4.5 Gyr. For each star, we identified spot-crossing events, measured the spot properties, and derived the corresponding magnetic field strengths and area coverages to investigate trends with stellar age.
3. Results
3.1. Magnetic Field Strengths of Starspots
Our analysis of 2,269 spots on 14 stars revealed that the average spot magnetic fields are consistently high, ranging from 2,700 to 4,600 G, with a sample average of approximately 3500
 $\pm$
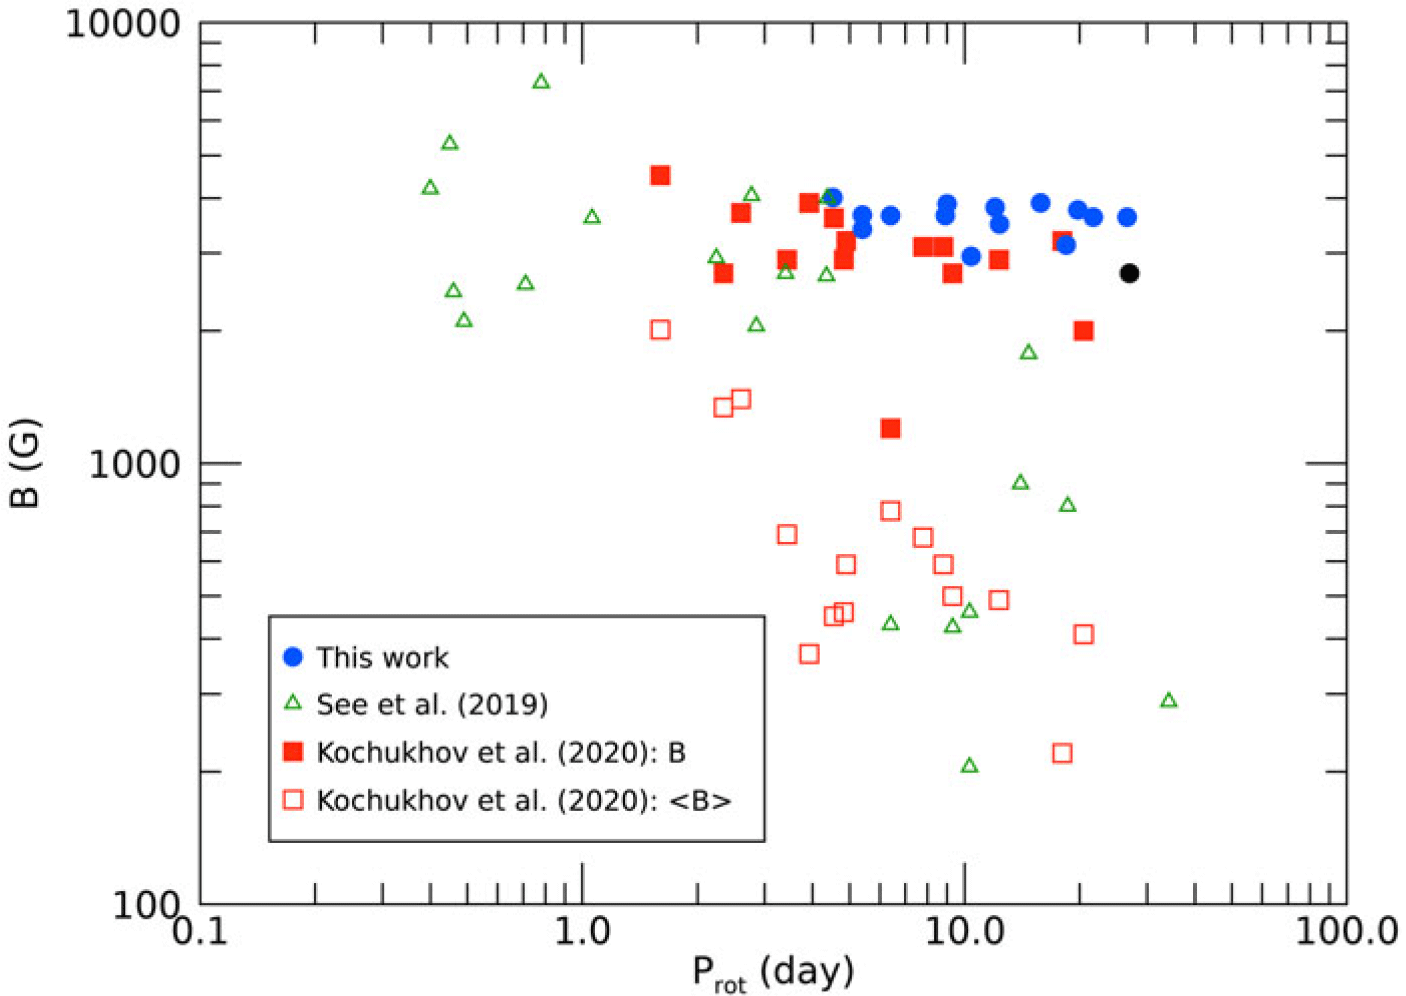
300 G (Menezes et al. Reference Menezes, Araújo and Valio2024). Remarkably, we found no significant correlation between spot magnetic field strength and stellar age or rotation period (see Figure 2). Even on relatively old, slowly rotating stars, the spots maintain field strengths comparable to those on young, rapidly rotating stars. This finding suggests the existence of a magnetic saturation plateau for starspots.
The magnetic field strength of starspots (red circles) as a function of stellar rotation period. Our results remain on a high “saturation plateau,” in contrast to measurements of the global mean magnetic field (open symbols from other works), which decrease with longer periods. Adapted from Menezes et al. (Reference Menezes, Araújo and Valio2024).

3.2. Spot Coverage and Stellar Age
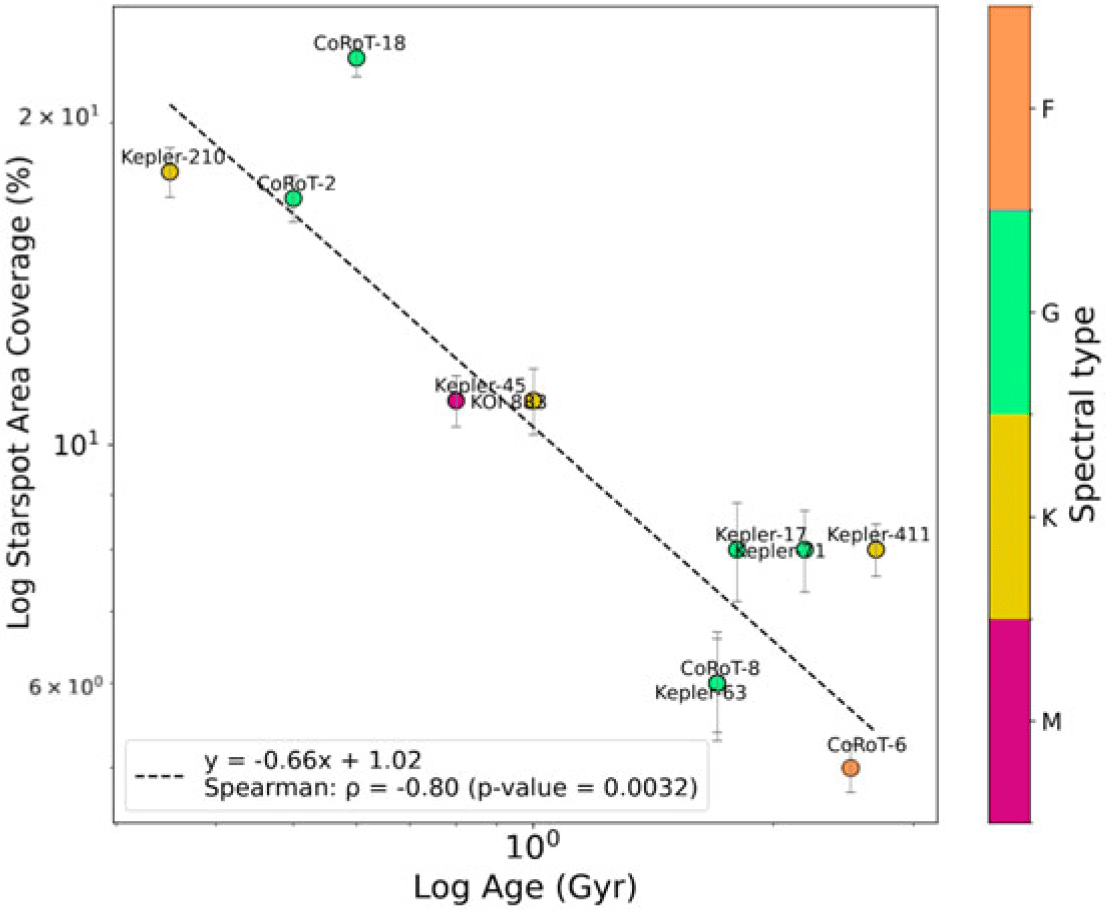
In contrast to the consistent magnetic field strengths, our analysis of spot coverage on 11 stars revealed a strong and statistically significant anticorrelation with stellar age (Spearman
 $\rho = -0.80$
), as shown in Figure 3 (Araújo et al. Reference Araújo, Lima, Menezes and Valio2025). Young stars are heavily spotted, with up to 29% of their surface covered. In comparison, older stars (age
 $\sim$
1-4.5 Gyr) exhibited much lower coverage, typically around 4-10%. This provides compelling evidence that the quantity, rather than the quality, of starspots is the primary driver of the observed decline in stellar magnetic activity.
The logarithm of starspot area coverage as a function of stellar age. The plot shows a strong anticorrelation, confirming that older stars have a significantly smaller fraction of their surface covered by spots. From Araújo et al. (Reference Araújo, Lima, Menezes and Valio2025).

4. Discussion: Quality versus Quantity
4.1. The “Quality”: Spot Magnetic Field Strength Remains Constant
Most critically, we found that the spot magnetic field strength does not decrease with stellar age or with longer rotation periods. As shown in Figure 2, our measurements (red circles) lie on a saturation plateau, even for slowly rotating stars. The discovery of a magnetic saturation plateau for starspots has profound implications for our understanding of stellar dynamo processes. It suggests that the mechanism generating the intense magnetic fields within spots operates at or near its maximum efficiency across a wide range of stellar conditions. Once a spot forms, the local magnetic field amplification appears to proceed to a similar endpoint regardless of the star’s global properties.
This saturation behavior may reflect fundamental physical constraints on the local dynamo process, such as:
-
• Equipartition between magnetic and kinetic energy densities in the convection zone.
-
• Thresholds for magnetic buoyancy and flux emergence.
-
• Limits imposed by magnetohydrodynamic instabilities.
The consistency of spot magnetic field strengths across different stellar types and ages also suggests that the basic physics of spot formation remains similar throughout main-sequence evolution, even as the global dynamo efficiency changes.This indicates that the physical process generating the magnetic field inside a spot is highly stable and does not weaken significantly as the star evolves. This finding suggests that the decline in global activity is not caused by a change in the intrinsic quality of spots.
4.2. The “Quantity”: Starspot Area Coverage Decreases with Age
If the strength of spots remains constant, the decline in activity must be driven by a change in their number or area. Our second study (Araújo et al. Reference Araújo, Lima, Menezes and Valio2025), tested this by measuring the starspot area coverage on 11 stars of various ages. Our findings provide strong evidence that the well-documented decline in stellar magnetic activity with age is driven primarily by a reduction in the number and total area of starspots, rather than by a weakening of the spots themselves. This provides direct evidence that the quantity of spots decreases dramatically as a star ages.
This “quantity over quality” conclusion has several important implications:
First, it suggests that age-related changes in the stellar dynamo affect primarily the generation and emergence rate of magnetic flux tubes, rather than the intensity of the magnetic fields they contain. This points to large-scale properties of the dynamo, such as differential rotation or meridional circulation, as the key factors that evolve with stellar age.
Second, it helps explain why activity indicators that measure the integrated effect of magnetic regions (such as chromospheric emission or X-ray luminosity) show smooth declines with age, while the properties of individual active regions remain relatively constant.
Third, it provides new constraints for theoretical models of stellar dynamos, which must now account for this dichotomy between global and local magnetic properties.
4.3. Implications for Stellar Age Determination
The strong anticorrelation between spot coverage and stellar age identified in Araújo et al. (Reference Araújo, Lima, Menezes and Valio2025) has practical applications for stellar astrophysics. Traditional age-dating methods using isochrones can be significantly affected by starspots, which alter the apparent temperature and luminosity of the star. By accounting for the expected spot coverage based on other age indicators (such as rotation or activity), more accurate age estimates can be derived, particularly for young, active stars where the effect is most pronounced.
Our findings also strengthen the physical basis for gyrochronology and activity-age relations by clarifying the underlying mechanism driving the observed correlations. The decrease in spot coverage with age provides a direct link between the evolution of the stellar dynamo and observable changes in rotation and activity.
5. Final Remarks
This study has addressed a fundamental question in stellar evolution: does magnetic activity decline with age because individual starspots become magnetically weaker, or because the number of spots decreases? Our analysis provides a clear answer: it is the quantity, not the quality, that changes over stellar lifetimes. A star’s magnetic activity decreases primarily because it produces fewer spots, not because its spots become magnetically weaker. The intrinsic quality (magnetic strength) of the spots remains high and constant, while the quantity (total area covered) is what truly changes over time.
Our key findings can be summarized as follows:
-
(1) Starspot magnetic field strengths remain consistently high (2,700-4,600 G), suggesting a fundamental magnetic saturation plateau.
-
(2) Spot coverage shows a strong anticorrelation with stellar age, decreasing from
 $\sim$
29% in young stars to
$\sim$
4% in older stars.
-
(3) The decline in stellar magnetic activity over time is primarily driven by a reduction in the total area of spots.


These results have significant implications for stellar astrophysics:
-
• Improving Age-Dating: Accounting for spot coverage in stellar evolution models (isochrones) may lead to more precise age estimates, especially for young, active stars whose radii and temperatures are affected by high spot coverages (Somers & Pinsonneault Reference Somers and Pinsonneault2015).
-
• Refining Dynamo Models: Models of how stars generate magnetic fields should focus on the mechanisms that control the rate of magnetic flux emergence to the surface rather than the strength of individual flux tubes.
Future work will focus on expanding our sample to cover a wider range of stellar types and ages, further refining the relationship between spot properties and stellar parameters. Additionally, we plan to investigate potential star-planet magnetic interactions, examining whether planetary characteristics correlate with the properties of starspots, particularly those near the planet’s transit path. This could provide insights into whether planets can modulate their host star’s magnetic activity, a question of growing interest in the field of star-planet interactions.