I
The Boulangist movement represented a dramatic novelty in the political life of the young French Third Republic and a serious challenge to its survival (Irvine Reference Irvine1988; Garrigues Reference Garrigues1992, Reference Garrigues1999). Inspired by the Jacobin values of the revolutionary tradition, it emerged in 1887, when General Georges Boulanger undertook a successful mass campaign against the republican government. The movement, galvanised by a winning streak of electoral successes in 1888, reached its peak on 27 January 1889, when Boulanger's victory in a by-election in Paris created propitious conditions for a coup d’état, which he eventually decided not to stage.
The mass popularity of Boulangism, ‘born of the radical left yet issuing in a radical right’ (Hutton Reference Hutton1976, p. 86), was the result of a concurrence between socialists, radicals and monarchists, unified by the common desire to oust republican parties from government. Given the heterogeneity of his supporters, what kind of political regime would follow to Boulanger's seizure of power was highly uncertain. However, his call for radical political reforms (condensed in his famous platform of ‘dissolution, division, constituante’) and his violent attacks on industrialists and bankers for corrupting the parliamentary regime spelt hard times for the business elites that had established strong connections with the republican forces since the creation of the Republic.
In order to assess whether the Boulangist crisis was perceived by French investors as a real threat that challenged the stability of the republican regime, this article analyses the effects of the political events of January 1889 on the performance of stocks of politically connected firms quoted on the Paris Bourse. I find that in windows of two and 10 days after the by-election, firms with connections to republican parties experienced positive cumulative abnormal returns, while no abnormal returns are found for those connected to conservative parties or with no political connections. These findings suggest that French investors perceived Boulanger as an actual threat to the stability of the Third Republic and reacted positively to his renunciation of a violent overthrow of the republican regime.
The article is structured as follows. Section ii surveys the diverse stream of literature, which this article contributes to. Section iii provides a narrative of the events of 1888–9 against the background of political developments in the 1880s. Section iv presents the dataset. Section v empirically assesses the impact of political connections on stock trading in the months preceding the events of January 1889. Sections vi and vii describe the empirical strategy used to estimate cumulative abnormal returns and present the main findings. Section viii concludes.
II
This article contributes to an extensive empirical literature that uses abnormal stock returns to explore the impact of political connections on firms’ value. After Fisman's (Reference Fisman2001) seminal paper on the value of political connections to the Suharto regime in Indonesia, several studies focused on developing economies, where institutions are weaker and corruption widespread. For instance, in a sample of 47 developing countries, Faccio (Reference Faccio2006) finds that companies with political connections pay lower taxes and have preferential access to credit market and public contracts. In the case of China, Li et al. (Reference Li, Meng, Wang and Zhou2008) find that firms connected to the Communist Party enjoy larger benefits, easier access to credit, and more legal flexibility. Goldman et al. (Reference Goldman, Rocholl and So2009) find that after the 2000 presidential election in the United States, companies connected to the Republican Party obtained higher cumulative abnormal returns than firms linked with the Democrats. Coulomb and Sangnier (Reference Coulomb and Sangnier2014) find strong value-effects derived from Nicolas Sarkozy's victory in the Reference Faccio2007 presidential election, for the firms linked to the president.
In recent years, the subject has attracted a growing interest also from economic historians. In the case of Germany, Ferguson and Voth (Reference Ferguson and Voth2008) find a strong correlation between German firms’ positive returns and political connections with the Nazi Party after the elections of 1933. However, Lehman-Hasemeyer and Opitz (Reference Lehmann-Hasemeyer and Opitz2017) find little evidence of a positive impact of political connections on firm performance after the general elections of 1924 and 1928 during the Weimar Republic. In turn, Lehman-Hasemeyer et al. (Reference Lehmann-Hasemeyer, Hauber and Opitz2014) show that investors reacted negatively to the democratisation of Saxony's electoral rules in 1896 and 1909 (which increased the political influence of Social Democrats in the regional government), which negatively affected Saxon firms listed on the Berlin Stock Exchange. In the case of UK, Braggion and Moore (Reference Braggion and Moore2013), focusing on variations in stock returns in the London Stock Exchange after legislative elections in the late nineteenth century, find a positive and significant effect for companies with elected MPs on their boards. On the other hand, Grossman and Imai (Reference Grossman and Imai2016) find little (or negative) impact of political connections on the profitability of British banks from 1879 to 1909. Finally, in the case of Japan, Okazaki and Sawada (Reference Okazaki and Sawada2017) find that political connections contributed to improve firms’ performance in non-regulated sectors but had no effect on firms operating in regulated sectors (where the majority of politically connected firms were located).
III
After the tribulations that characterised the early political life of the Third Republic, with a National Assembly dominated by monarchists and persistent uncertainties about the fate of the republican regime, the late 1870s inaugurated a period of stability, especially after republican Jules Grévy replaced monarchist General MacMahon as president of the Republic. The legislative elections of 1876–7 and 1881 marginalised right-wing parties (Bonapartists and royalists) and gave republicans (dominated by Leon Gambetta's Union Républicaine and Jules Ferry's Gauche Républicaine) a solid majority in both the Chamber of Deputies and the Senate. Moderate republicans (also termed Opportunistes by their radical opponents) controlled French governments during the last quarter of the nineteenth century, and successfully rallied banking and industrial elites to support the republican regime. The ‘contract’ between the new ruling class and the milieux d'affaires, cemented by a significant expansion of government spending on public works and infrastructures (such as the Freycinet Plan; Le Bris Reference Le Bris2012), shaped legislation on sensitive issues (such as railways, colonial expansion and trade policy) and led to the proliferation of connections between MPs and business (Garrigues Reference Garrigues1997, pp. 70–1, 73–82).
However, the frequent eruption in the press of corruption scandals that involved politicians and financiers generated increasing public disillusionment with the ‘République des hommes d'affaires’. The turning of popular sentiment against republicans became visible in the legislative elections of October 1885, which resulted in a hung parliament, with the ruling parties losing votes on both their right (to the alliance between Bonapartists and royalists) and left (to radicals and socialists).
Against this background of renewed polarisation and political stalemate, the figure of Georges Boulanger emerged as a catalyst for public discontent. A young army general and a protégé of radical leader Georges Clemenceau, Boulanger had served as Minister of War in the governments of Charles de Freycinet and René Goblet (1886–7). He enjoyed increasing popularity for his policy of modernisation of the army, as well as for banning members of former royal families from military cadres, which initially alienated monarchists. His aggressive anti-German posturing (claiming the reconquest of Alsace and Lorraine) also met popular sentiments of revenge for the defeat in the Franco-Prussian War of 1870, earning him the nickname of Général Revanche. However, his animosity turned into a source of embarrassment for the French government, quite wary of a diplomatic and military escalation of conflict with Germany, and eventually cost him a reappointment in the new cabinet of Maurice Rouvier in May 1887.
Boulanger's exit from government marked the start of his intense campaign against ‘opportunist’ republicans and parliamentary corruption, advocating an ‘honest Republic’ and a strong executive. Initially backed by radicals, socialists and disillusioned republicans, with the support of newspapers such as La Cocarde, Le Gaulois and L'Intransigeant, his anti-establishment movement soon attracted the interest – and the generous funding – of conservative forces, who saw its growing popularity as a golden opportunity to return to power by democratic means (Irvine Reference Irvine1988; Garrigues Reference Garrigues1992). Especially harmful for the moderate republicans was the ‘Scandale des Décorations’ (December 1887), which forced the resignation of the president of the Republic, Grévy, and the prime minister, Rouvier. Boosted by a relentless press campaign (a radical innovation that announced the advent of political mass mobilisation) now supported also by conservative newspapers such as the influential Le Figaro, the movement also developed an efficient organisation based on the Ligue des Patriotes, a nationalist group whose militants were mobilised for electoral rallies and street actions. The populist tide continued to rise in the following months, reaching out to the provinces as Boulanger travelled the country to run for by-elections across the French territory.Footnote 1 After his success in three simultaneous by-elections (Somme, Charente-Inférieure and Nord) in August 1888, the government realised that Boulanger had turned into a serious challenge and calls for a dialogue with monarchists were voiced in the ‘opportunist’ press (Garrigues Reference Garrigues1999, pp. 188–95).
Boulangists saw the call for a by-election in the Department of the Seine in January 1889 as an opportunity for the movement to show its power in Paris, a republican stronghold with a special symbolic value. In fact, all parties interpreted the election as a plebiscite on the republican regime. In the evening of Sunday 27 January, as Boulanger's victory over the republican candidate was announced, an enthusiastic crowd gathered in Place de la Madeleine, ready to march on the Élysée (Garrigues Reference Garrigues1999, pp. 225–34). At the same time, the government called an emergency meeting, whilst waiting for events to unfold. Chronicles suggest that Boulanger, uncertain about the degree of support he enjoyed in the army and the Paris police, hesitated for some hours. He finally refused to stage a coup d’état, arguing that a government born out of bloodshed would lack legitimacy, and postponed seizing power until the legislative elections scheduled for September 1889. With no news from the general and disappointed by his inaction, the crowd left the square in the early hours of Monday 28 January.Footnote 2 The following hours and days saw a sudden reversal of the political fortunes of the movement. Divided republicans joined forces, Boulanger made no public appearances, and the ‘end of Boulangism’ became a leitmotiv in the press.
Two weeks later, on 13 February, the Parliament reformed electoral rules to reintroduce individual constituencies (scrutiny d'arrondissement) and prohibited multiple candidatures, with the aim of containing the Boulangist movement. Soon after, the Ligue des patriotes was dissolved. Boulanger's parliamentary immunity was revoked, and the general was accused of conspiracy against the state. On 1 April 1889, to escape arrest, Boulanger fled to Brussels; he was sentenced to life imprisonment in absentia in August of the same year. His movement, whose campaign was systematically obstructed or repressed by the mobilisation of the state in support of republican candidates (Fulton Reference Fulton1991), failed to make a decisive breakthrough in the elections of September–October 1889. Although the monarchist–Boulangist alliance won almost as many popular votes as the alliance of republicans and radicals (Rudelle Reference Roudelle1982, pp. 258–62), the new electoral rules and the success of republican candidates in borderline seats (for a very narrow margin in most cases) returned a comfortable majority for the government. Boulanger would die in exile two years later, in September 1891.
IV
Boulangism promised to fight parliamentary corruption and the connections between politics and business. If this promise had been perceived as credible, investors would have expected a Boulangist regime to penalise heavily firms connected to republican parties. In this case, the sudden vanishing of the Boulangist threat after the by-election of 27 January 1889 should have been received with relief and optimism, as it implied a stabilisation of the republican regime, at least in the short run. As a consequence, we should observe positive abnormal returns on stocks of firms with links to republican forces. To test this hypothesis, I have built an original database covering a sample of 73 firms listed on the Paris Bourse in the period from 1 March 1888 to 16 February 1889.
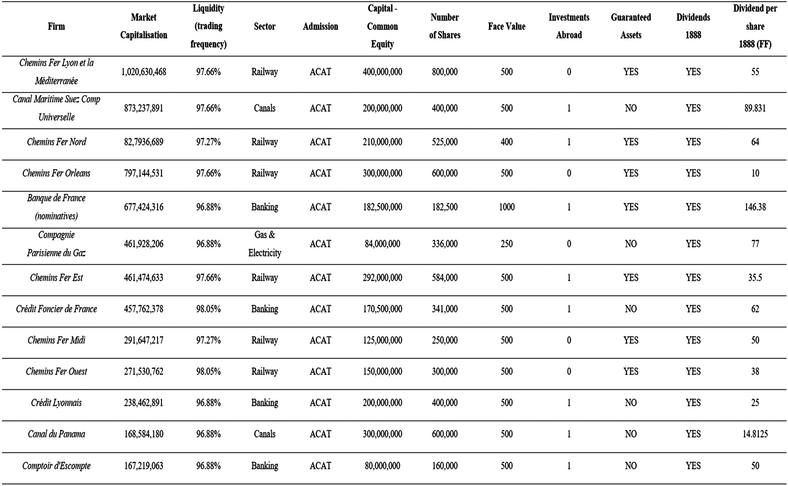
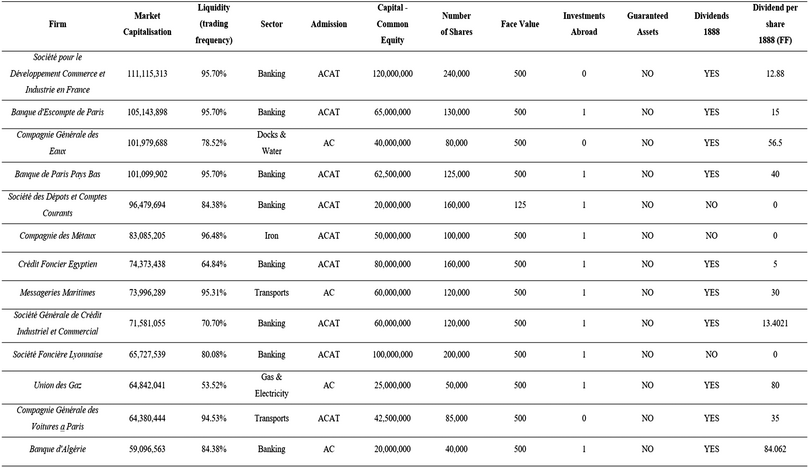
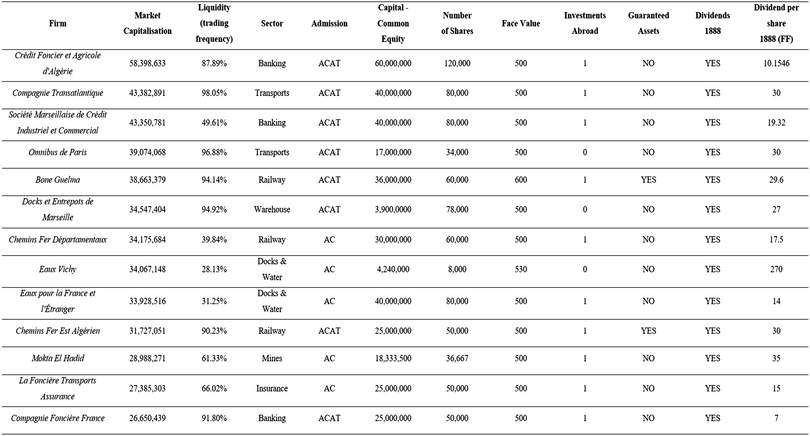
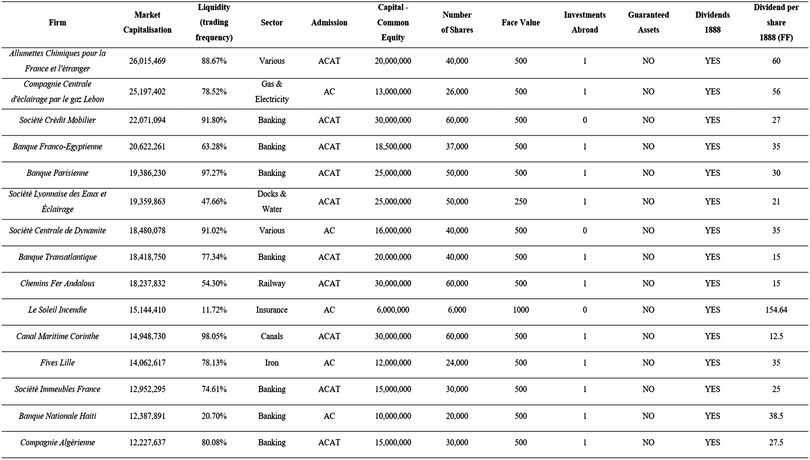
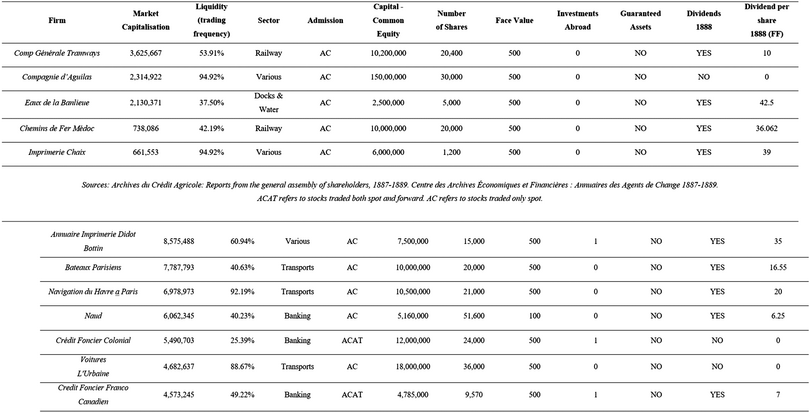
To make the sample suitable for an event study, I have selected large firms with liquid stocks and available information about the board. Liquidity is proxied by the number of days in which stocks were traded out of the total number of trading days in the period. Daily prices of common stocks are from the official bulletins (Bulletins de la Cote) published by the Compagnie des Agents de Change.Footnote 3 Data on firms’ nominal and paid capital, dividends, and the composition of boards of directors are from shareholder annual reports (available in the archives of Crédit Agricole and belonging to the historical collection of Crédit Lyonnais) and stockbrokers’ yearbooks (Annuaires des Agents de Change, available in the archives of the Centre des archives économiques et financières).Footnote 4 The full dataset is described in Appendix 1 (firms’ balance sheet data) and Appendix 2 (political affiliations).
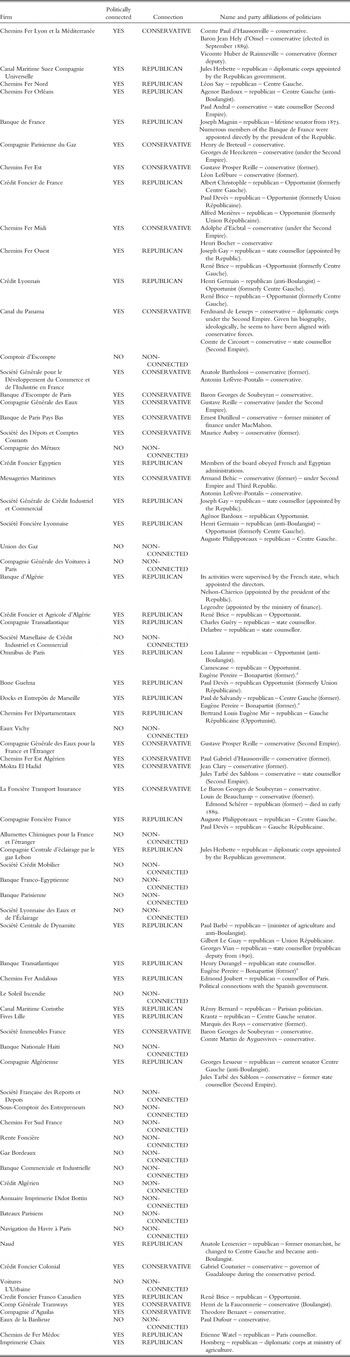
Politicians sitting in the board of directors were identified mainly on the basis of information provided by shareholder reports. A complementary source was biographies of French deputies, senators and members of the government from the online repository of the Assemblée Nationale and the Sénat Français,Footnote 5 drawing on Robert and Cougny (1890) and Jolly (Reference Jolly1960). Politically connected firms are defined as firms whose board of directors included in 1888 at least one MP (deputy or senator, either in office or elected in previous legislatures), a member of the Conseil d’État (a body acting as a legal adviser to the government and a supreme court of administrative justice), diplomatic corps (appointed by the government, such as consuls or ambassadors), politicians at a regional and local level, or directors directly appointed by the government (such as in the case of colonial banks).Footnote 6 ‘Republican’ firms are those connected to republican parties. Republican groups were heterogeneous and changed over time. In 1881, there existed three main groups: the Centre Gauche, the Gauche Républicaine and the Union Républicaine. In 1885, the two last groups merged, giving rise to the Union de Gauche. However, in the sources, MPs belonging to any of those groups are generically labelled as ‘republicans’. In turn, ‘conservative’ firms are those connected to any of the right-wing parties that joined the Boulangist movement: the royalist factions of ‘Légitimistes’ and ‘Orléanistes’, who supported the dynastic rights of the Houses of Bourbon and Orleans respectively; and the ‘Bonapartistes’, who aimed at restoring the House of Bonaparte and the Empire. In a few cases of politically ‘mixed’ boards (nine firms with politicians from both camps), the sign of the connection has been attributed on the basis of political prominence.Footnote 7 As a result, seven firms were assigned to republicans and two to conservatives. State counsellors and the diplomatic corps were classified as conservatives or republicans depending on whether they were appointed during the Second Empire – or during the monarchist MacMahon government, 1873–9 – or after the republican forces gained power, respectively. Overall, the sample includes 25 firms with no political affiliation and 48 politically connected firms (two-thirds of the sample), of which 18 were linked to conservatives, and 29 to republicans.
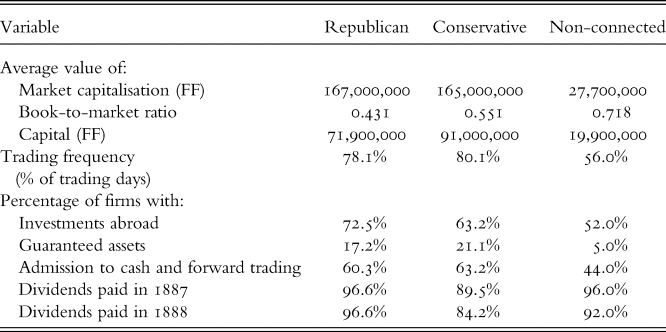
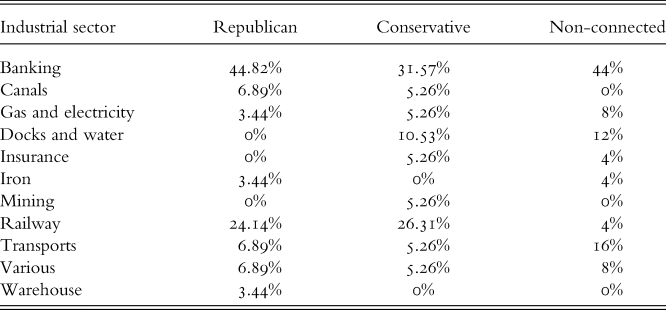
Tables 1 summarises the economic characteristics of the firms included in the sample, grouped by political affiliation (republican, conservative, non-connected). Politically connected companies were on average much larger (both by market capitalisation and nominal capital) and significantly more liquid (their stocks were traded in approximately 80 per cent of trading days) than non-connected firms. Republican and conservative companies had similar average market capitalisation (167 and 165 million FF respectively) and book-to-market ratios (0.431 and 0.551 respectively), although conservative firms were slightly larger by nominal capital. Politically connected companies were also far more internationalised (72 per cent of republican and 63 per cent of conservative firms had investments abroad) and included more firms with guaranteed assets (e.g. railways and some colonial banks) (17 per cent of republican and 21 per cent of conservative) than companies with no political affiliation. Approximately two-thirds of stocks of politically connected firms (against only 44 per cent of non-connected firms) were allowed to be traded both au comptant (cash) and à terme (forward). In turn, there were no significant differences between politically connected and non-connected firms as far as dividend policy is concerned, although the share of dividend-paying firms was slightly lower among those affiliated to the conservatives. As far as sectorial distribution is concerned (see Table 2), banks were dominant in all camps, although they were slightly more represented among republican and non-connected firms (45 and 44 per cent respectively) than among conservative firms (32 per cent). By contrast, railways were the second largest group among politically connected companies (24 per cent of republican and 26 per cent of conservative firms), while only 4 per cent of non-connected companies operated in the railway sector.
Firms’ characteristics by political connection
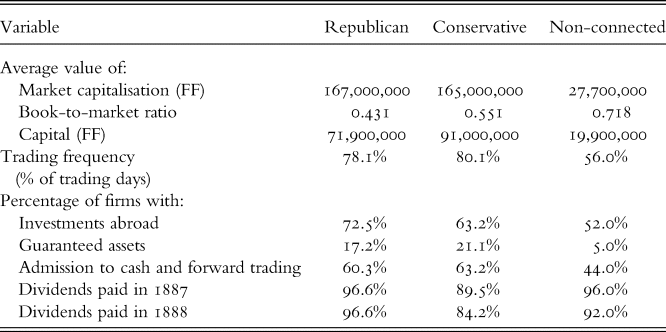
Note: Market capitalisation is calculated by multiplying the number of ordinary shares by the daily price of each stock. Book-to-market ratio is constructed by dividing common shareholders’ equity by market capitalisation. Trading frequency is the number of days in which a stock is traded divided by the total number of trading days in the period, calculated from daily bulletins. Data on capital, investments abroad, guaranteed assets, admission to cash and forward trading, and paid dividends were collected from primary sources, particularly from the Archives du Crédit Agricole and the Annuaires des Agents de Change.
Sectorial distribution of firms by political connection
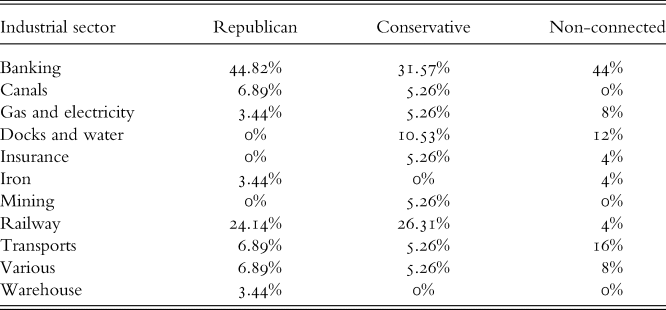
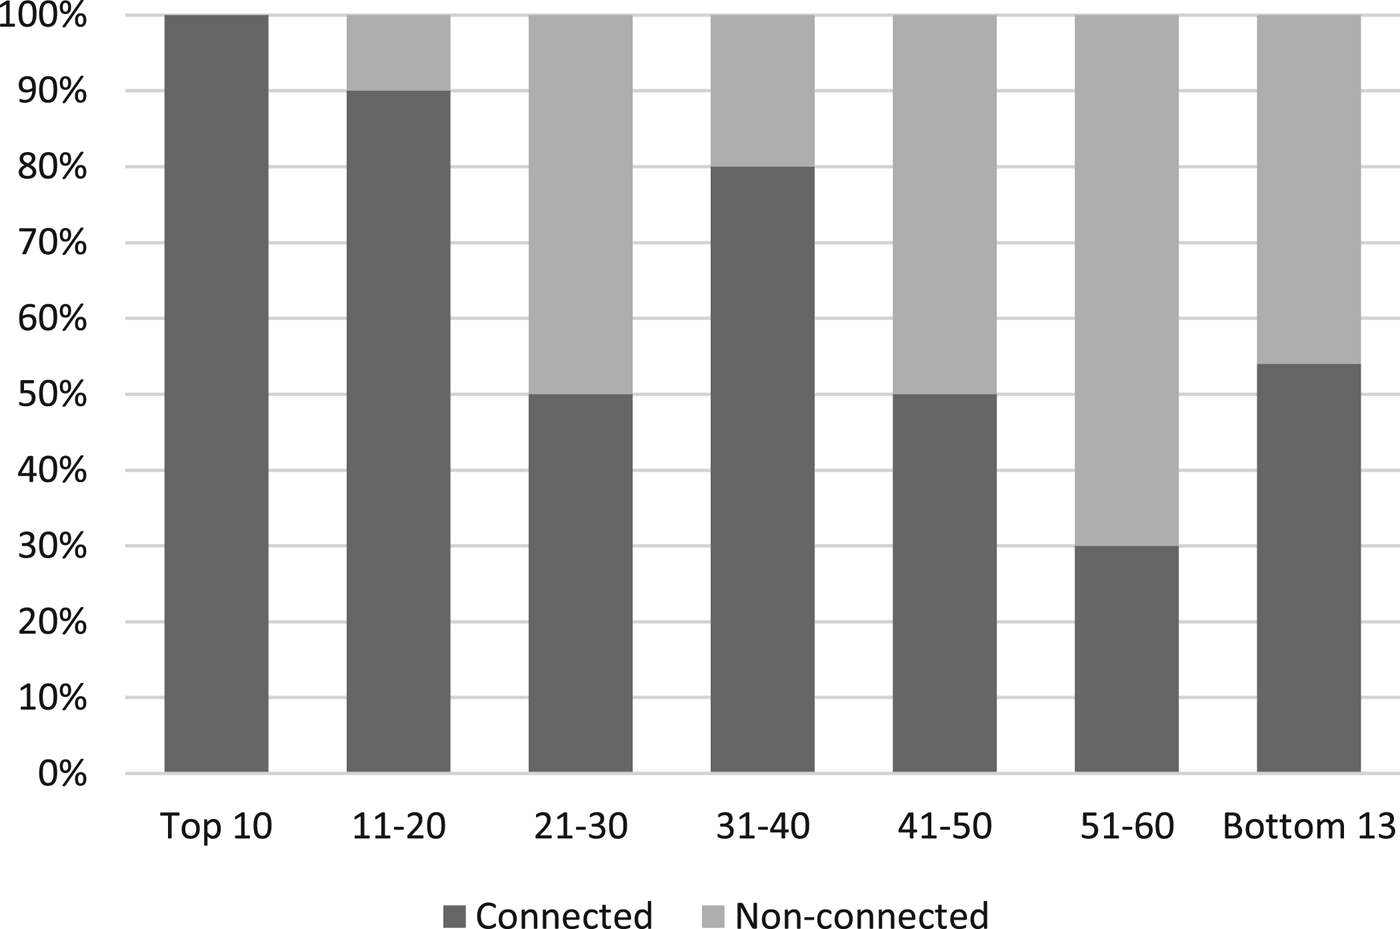
Figure 1 shows the frequency of political connections by firms’ size, measured by their market capitalisation in 1888. Of the top 20 largest companies, virtually all were politically connected (with one exception); and so were 80 per cent of the top 40 largest companies. By contrast, non-connected companies slightly prevailed among the bottom 33 firms of the sample. Overall, these numbers confirm that virtually all of the largest French companies – and more prominently those operating in strategic sectors such as banking and railways – had developed political connections under the Third Republic.
Distribution of politically connected firms by market capitalisation

V
In the months that preceded the Paris election of January 1889, the rise of the Boulangist movement and its electoral successes in French provinces generated huge uncertainty about the balance of power between republican and conservative parties and more generally about the immediate future of the Republican regime. Therefore politically connected firms were especially sensitive to political news and shifts in investors’ expectations, which should be reflected in more intense trading of their stocks. Did political connections contribute to the frequency with which stocks were traded in the Paris Bourse (a proxy for liquidity) during the agitated months of the Boulangist campaign? To answer this question, I use a Logit regression to explore the determinants of the conditional probability of a stock being traded in the period from 1 March to 31 December 1888. The empirical specification assumes that this probability depends on structural characteristics of firms, including the presence of politicians on their board of directors:
 $$\ln \lsqb {Pr\lpar {Trade_{it} \gt 0{\rm \vert} X} \rpar } \rsqb = \beta _0 + \beta _1PolCon_i + \beta _zZ_i + \varepsilon _{it}$$
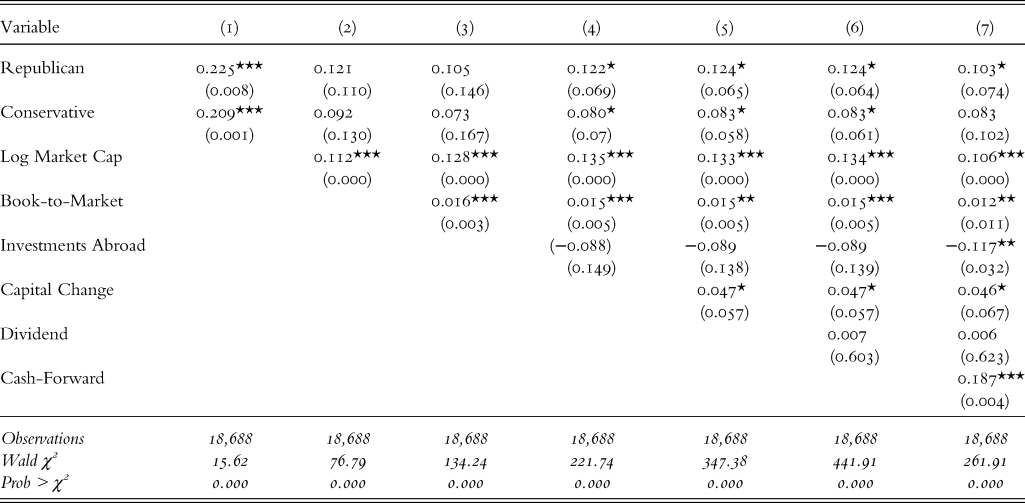
The dependent variable, Trade, is a dummy variable taking the value of one if the stock of firm i was traded on day t, and zero otherwise. The explanatory variable of interest is whether or not a firm was politically connected. In a first regression (Table 3) this variable (Connected) takes the value of one if a firm had at least one politician (of any denomination) or a state counsellor in its board and zero otherwise. In a second regression (Table 4) political connections are specified by affiliation, so that the equation includes two dummies, Republican and Conservative, taking the value of one if the firm was affiliated to republicans or conservatives, respectively. The regression includes a vector Z of control variables, which are potential structural determinants of trade frequency: firm's size (the log of market capitalisation); firm's value (the book-to-market ratio); a dummy taking the value of one if the firm had investment abroad; a dummy taking the value of one if the firm had a capital change in the year 1888; a dummy taking the value of one if the firm distributed dividends in the year 1888. Since in the Paris Bourse forward transactions (à terme) largely dominated securities trading (Hautcoeur and Riva Reference Hautcoeur and Riva2012; Lagneau-Ymonet and Riva Reference Lagneau-Ymonet and Riva2018), I also include a dummy taking the value of one if, upon the terms of admission to the Parquet, a stock was tradable both cash (au comptant) and forward (à terme), and zero if only the former were permitted.Footnote 8 Standard errors have been clustered by industrial sector.
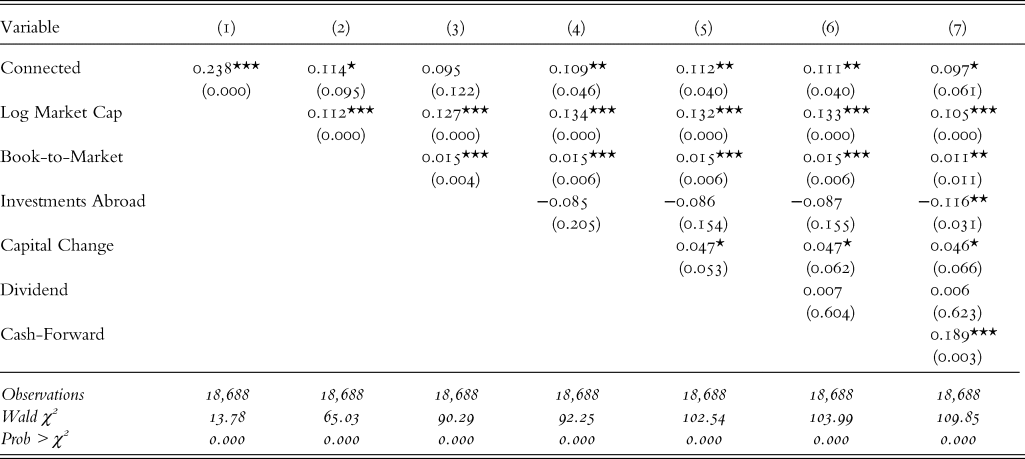
Political connections and trading frequency in 1888
The table shows the marginal effects from the logistic regression (1). Dependent Variable: Trade, a binary variable taking value 1 if the stock was traded on the day in question, and 0 otherwise. Connected is a dummy taking value 1 if the company had politicians (of any affiliation) in the board of administration. Log Market Cap is the logarithm of market capitalisation. Book-to-Market is the ratio between the book and market value of shares. Investments Abroad takes value 1 if the firm had investments outside of France and 0 otherwise. Capital Change takes value 1 if the firm experienced capital changes in 1888 and 0 otherwise. Dividend takes value 1 if the firm distributed dividends during 1888 and 0 otherwise. Cash-Forward is a dummy taking value 1 if the stock was admitted both to cash and forward trading, and 0 if only cash trading was permitted. Standard errors are clustered by industrial sector.
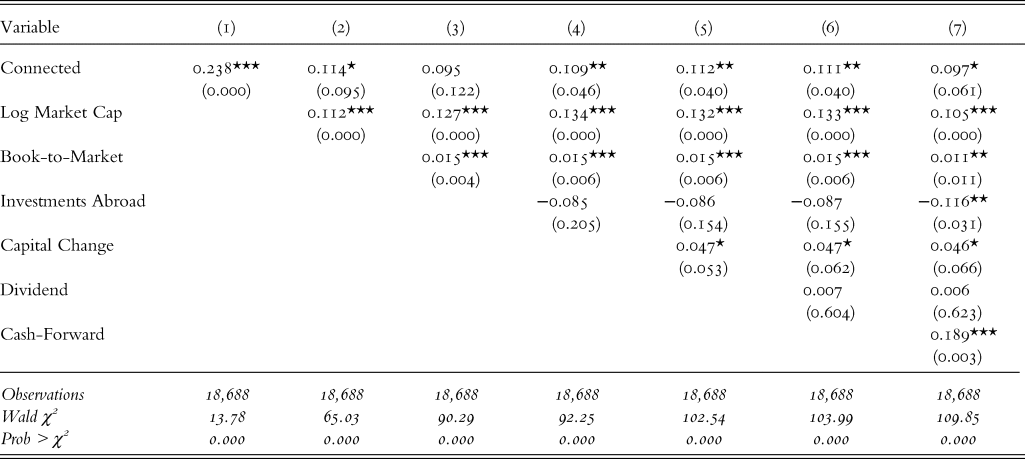
Coefficients with significance levels 0.10%*, 0.05**, 0.01***. P-values in parentheses.
Party connections and trading frequency in 1888
The table shows the marginal effects from the logistic regression expressed in the text. Republican is a dummy taking value 1 if the board contains republican politicians and 0 otherwise. Conservative takes value 1 if the board contains conservative politicians and 0 otherwise. For the dependent variable and the rest of explanatory variables, see Table 3. Standard errors have been clustered by Industrial Sector.
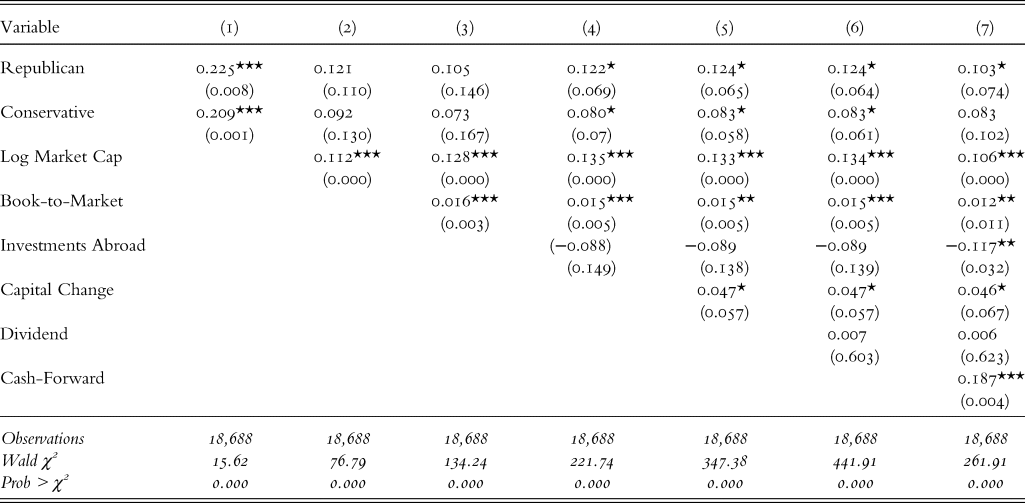
Coefficients with significance levels 0.10%*, 0.05**, 0.01***. P-values in parentheses.
Results are presented in Tables 3 and 4. As expected, size, value and the existence of capital operations increased the frequency with which stocks were traded. Dividend payments during the year in question have no statistical effect. Table 3 shows the marginal effects of the Logit regressions. The results suggest that, after controlling for other structural determinants, political connections (to any faction) increased trade frequency relative to non-connected firms at the 5 per cent level of confidence. However, once we control for the possibility to trade stocks both cash and forward (which has a strong positive impact: see column 7), the effect of political connections can be identified only at the 10 per cent level of confidence. Table 4 shows that the magnitude of this positive impact (again, identified only at the 10 per cent level of confidence) was very similar for republican and conservative connections, although the latter lose significance when a control for cash and forward trading is added to the regression.
VI
As explained in Section iii, the Paris by-election of 27 January 1889 was interpreted by both political fronts as a plebiscite on the republican regime. Boulanger's electoral success could trigger a violent change with unpredictable consequences for republicans and their business connections. If ex ante investors anticipated this scenario as realistic, the ex post ‘surprise’ of Boulanger's inaction in spite of his victory should have generated a wave of optimism about the prospects of republican-connected companies, at least in the short run. This would be reflected in a relatively more positive stock market performance compared to the rest of firms in the days after the election. It is unclear to what extent a hypothetical Boulanger government would have had a positive effect on stock prices of companies with conservative connections, therefore I have no prior as to the effect of Boulanger's decision on them. In turn, the ‘surprise’ should have had no differential effect on non-connected firms. However, if investors considered a violent overthrow of the ruling government unlikely, Boulanger's decision would have had little differential effect on stock prices of any firm.
To test these alternative hypotheses, I follow an event study approach based on a market model (Campbell et al. Reference Campbell, Lo and Mackinlay1997, pp. 149–217; Kothari and Warner Reference Kothari, Warner and Espen Eckbo2007):
 $$\eqalign{& R_{it} = \alpha _i + \beta _iR_{mt} + \varepsilon _i \cr & E\lpar {\varepsilon_{it}} \rpar = 0\; Var\lsqb {\varepsilon_{it}} \rsqb = \sigma _{\varepsilon _i}^2} $$
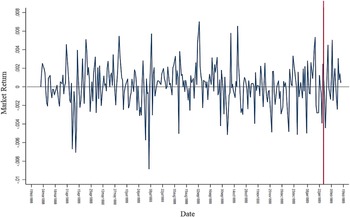
where R it is the log return of firm i’s stock on day t, and R mt is the log return of a market index on the same day. Following Le Bris and Hautcoeur (Reference Le Bris and Hautcoeur2010), I have calculated a daily market price index (see Figure 2) based on my sample of 73 firms and weighted by market capitalisation as follows:
 $$Index_{73} = \displaystyle{{\sum \nolimits_{i = 1}^{73} Shares_{i,t + 1} {\ast} Price_{i,t + 1}} \over {\sum \nolimits_{i = 1}^{73} Shares_{i,t}*Price_{i,t}}} - 1 $$
Daily price return on a market index of the Paris Bourse, 1 March 1888 – 16 February 1889
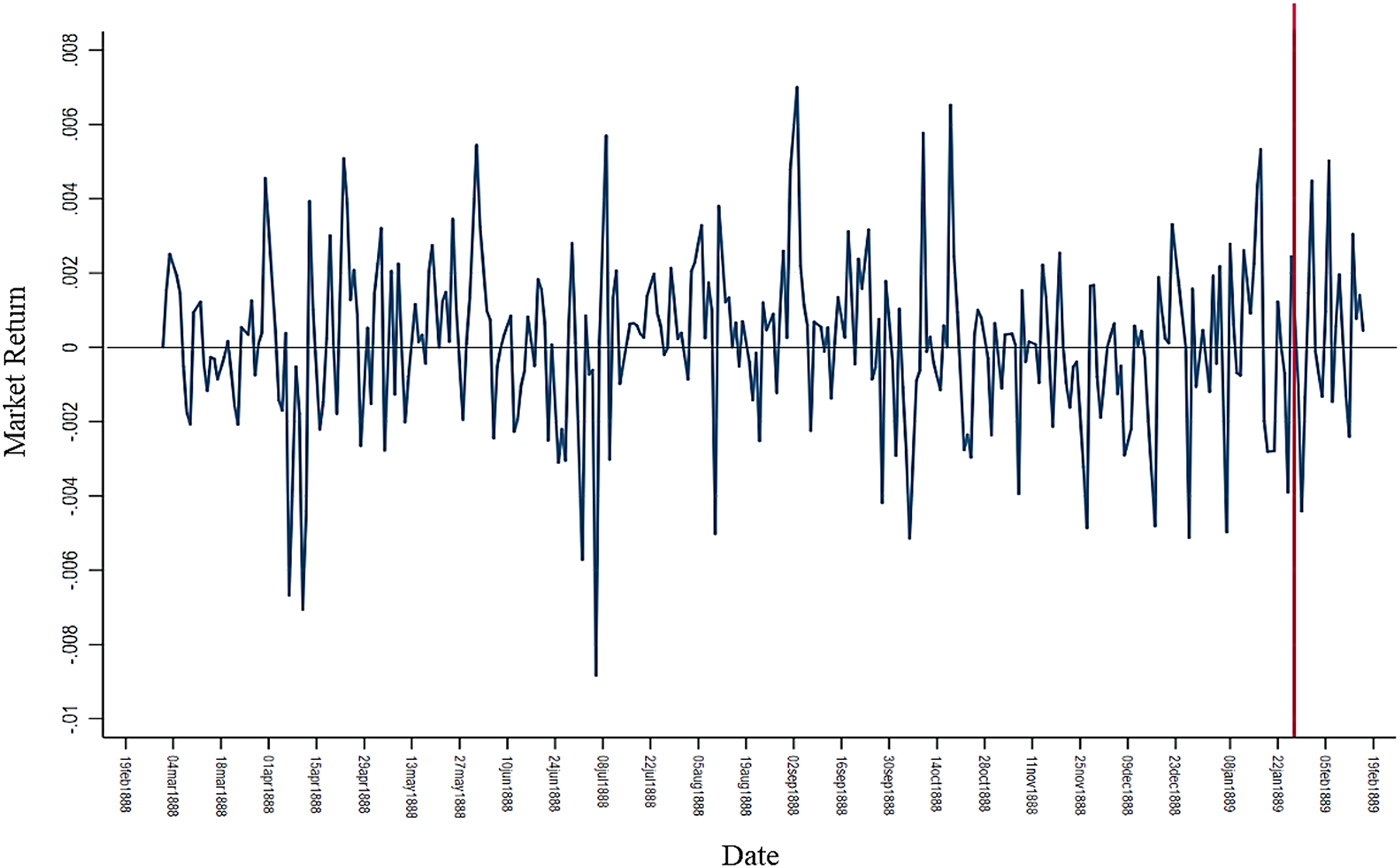
Event studies allow researchers to capture and isolate the potential causes of variations in returns by analysing their ‘normal’ performance in a control period before the event of interest (the ‘estimation window’) and their deviations from ‘normal’ values in a treatment period in coincidence or immediately after the event (the ‘event window’). These deviations are defined by Campbell et al. (Reference Campbell, Lo and Mackinlay1997) as abnormal returns. The sum of abnormal returns in a given event window are Cumulative Abnormal Returns (CARs):
 $$CAR\; \lpar {t_1,t_i} \rpar = \sum \limits_{t = t_1}^{t_i} AR_t $$
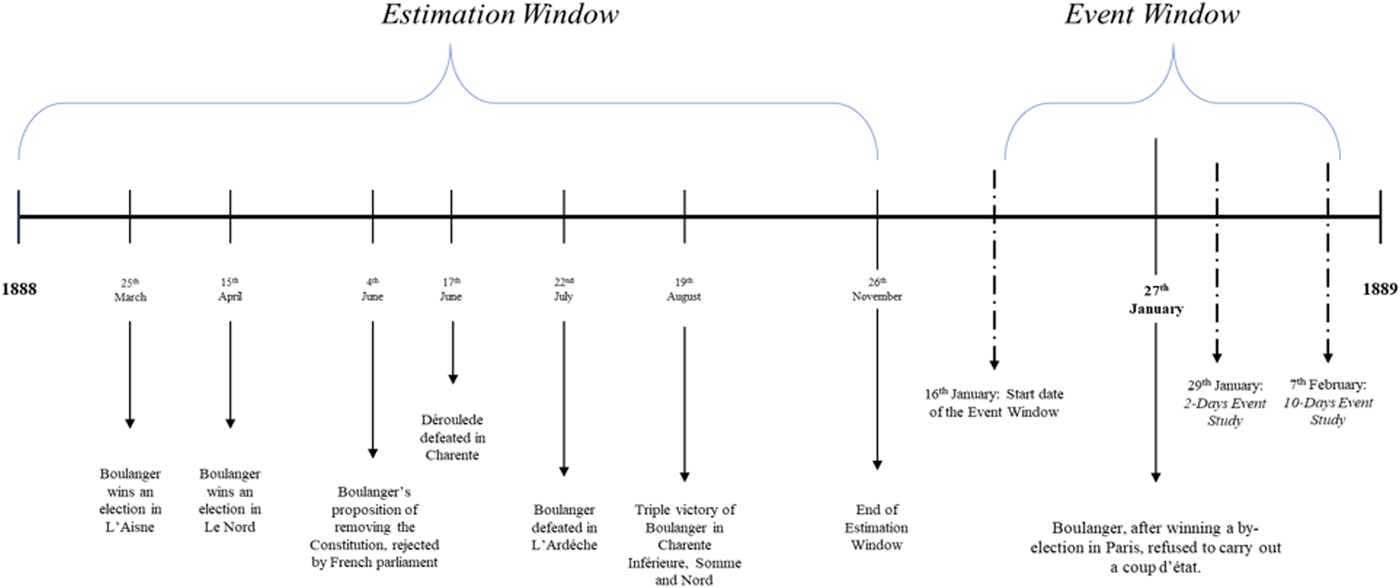
To make sure that the event does not affect ‘normal’ returns in the estimation window, the latter should not overlap with, and should be located at sufficient distance from, the event window. The event window should also include some days before the event, as investors could have anticipated its occurrence and discount its effect on prices in advance. Figure 3 illustrates the timeline of my event study. A prior test excludes the existence of possible weekday effects on returns, thus they are not included in the estimation.
Timeline of the Boulangist campaign
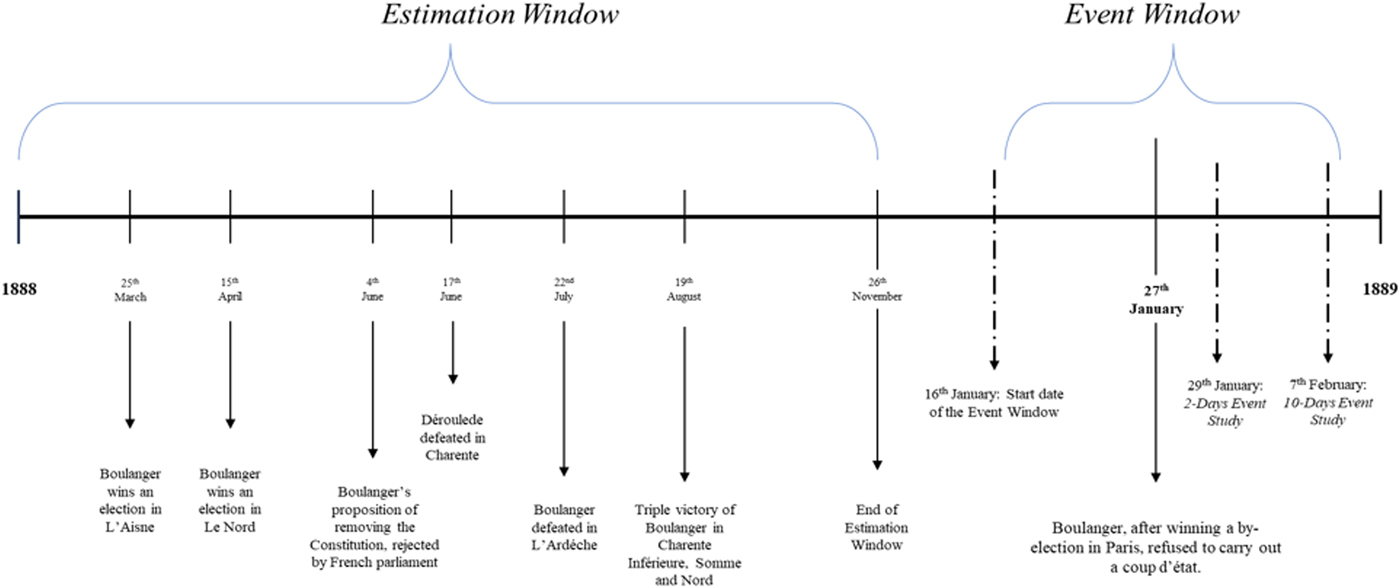
Following best practice in event studies, the analysis has been performed allowing for a 52-day gap between the estimation and the event window. Thus, the estimation window covers the period 1 March – 26 November 1888 for a total of 230 trading days (the literature recommends between 120 and 270 days). The event window starts 10 trading days before the event, on Wednesday 16 January 1889. Abnormal returns are calculated for two event windows of different duration to check the robustness of results: one ending two trading days after the election, on Tuesday 29 January (included); a second one ending 10 trading days after the event, on Thursday 7 February (included). When testing the statistical significance of CARs, one must consider two potential issues that may arise. The first one is cross-correlation of abnormal returns, which might bias upward the tests of significance. However, this does not seem to be the case here. Campbell et al. (Reference Campbell, Lo and Mackinlay1997, pp.168–9) argue that, in case of multiple event windows, if they do not overlap, it is reasonable to assume the absence of cross-correlation, while Kothari and Warner (Reference Kothari, Warner and Espen Eckbo2007) (following Brav Reference Brav2000, Mitchell and Stafford Reference Mitchell and Stafford2000, and Jegadeesh and Karceski Reference Jegadeesh and Karceski2009) suggest that cross-correlation is relevant only in long-horizon event studies. The second problem is event-induced volatility, which arises when different events are clustered in a short period of time, making it unclear which one is really affecting the variations in the estimates. This issue can be dealt with by implementing a standardised cross-sectional test, also known as a BMP test (Boehmer et al. Reference Boehmer, Masumeci and Poulsen1991), to solve potential issues in volatility changes. Furthermore, the chronicle of the events of January–February 1889 does not suggest the existence of other events likely to cause abnormal returns in the event windows analysed.
VII
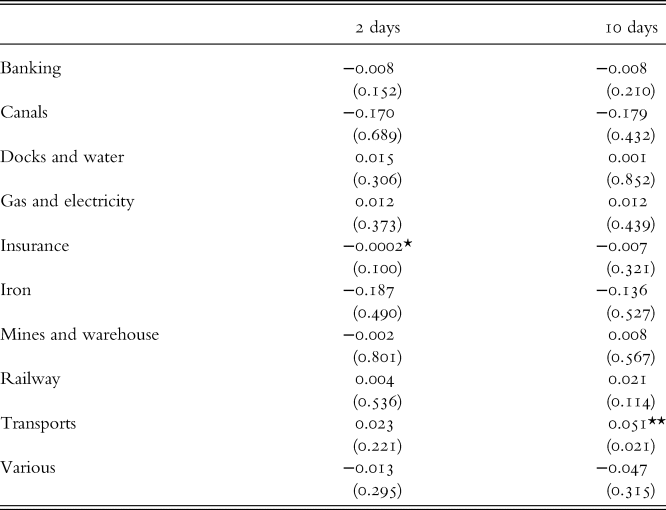
First, I test the existence of abnormal returns for firms grouped by industry, in order to rule out the possibility that they interfere with the results obtained for political connections. As shown in Table 5, estimates for windows ending two and 10 days after the election find no statistically significant effect. The transport industry (other than railways) is the only sector showing significant and positive CARs in the 10-day window; however, this sector represents a very small share of politically connected firms (see Table 2). By contrast, no sectoral CARs can be observed in highly politically connected sectors, such as banking or railways.
Cumulative abnormal returns by industrial sector
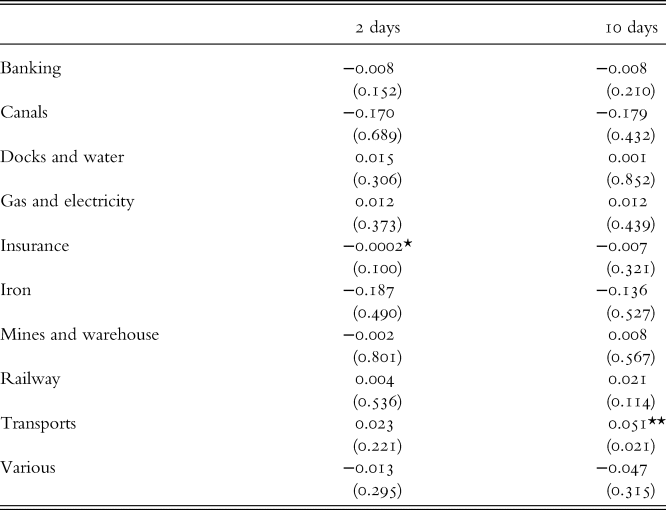
Coefficients with significance levels 0.10%*, 0.05**, 0.01***. P-values in parentheses.
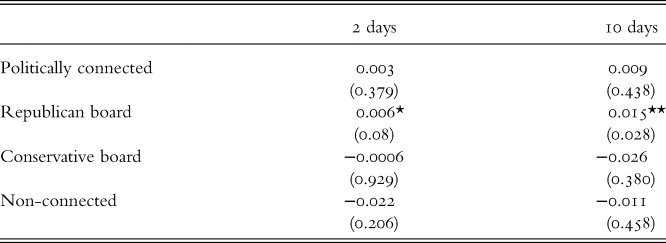
The cumulative abnormal returns for connected (to any faction), republican, conservative and non-connected firms are shown in Table 6. In both event windows the results suggest a positive effect of Boulanger's decision to step back for republican firms. In the window ending two days after the election, they obtained, on average, 0.6 per cent higher returns than the rest of the firms in the sample at the 10 per cent level of significance. In the window ending 10 days after the election, they show a 1.5 per cent cumulative abnormal return at 5 per cent statistical significance. No other group experienced a significant variation in returns after the elections in any of the event windows. However, this effect is not observable for politically connected firms in general (those connected to both republicans and conservatives). In fact, neither firms connected to conservatives nor non-connected firms experienced significant abnormal returns.Footnote 9
Cumulative abnormal returns by political connection
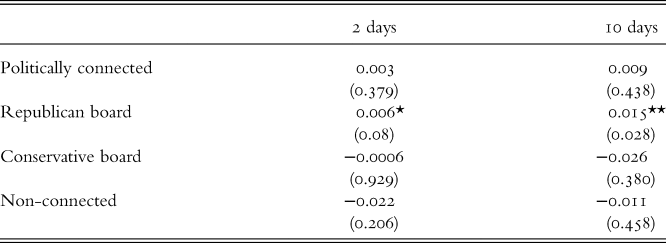
Coefficients with significance levels 0.10%*, 0.05**, 0.01***. P-values in parentheses.
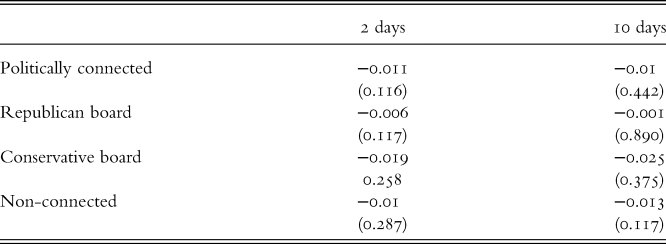
To check if the findings illustrated in Table 6 were driven solely by political factors and not by other exogenous causes, I perform a placebo test, choosing a new ‘event date’ around which, according to information from the press, no relevant event occurred. The selected date for this placebo test is 20 December 1888, and an event study is performed around this date using comparable estimation and event windows. The results in Table 7 show no significant variations in returns, which supports the findings illustrated in Table 6.
Placebo test

Coefficients with significance levels 0.10%*, 0.05**, 0.01***. P-values in parentheses.
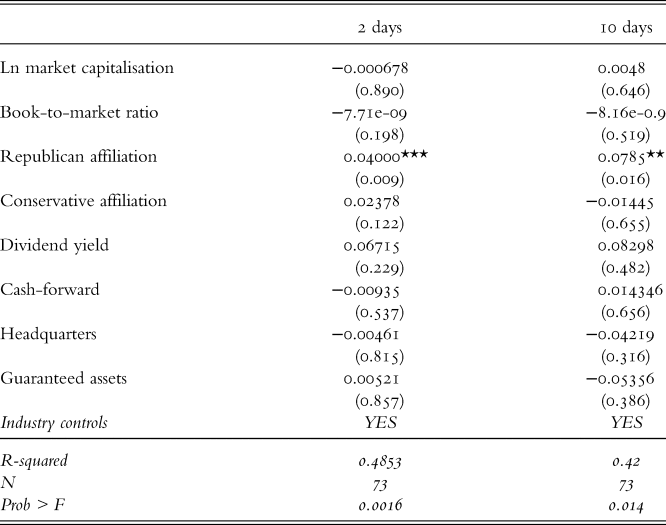
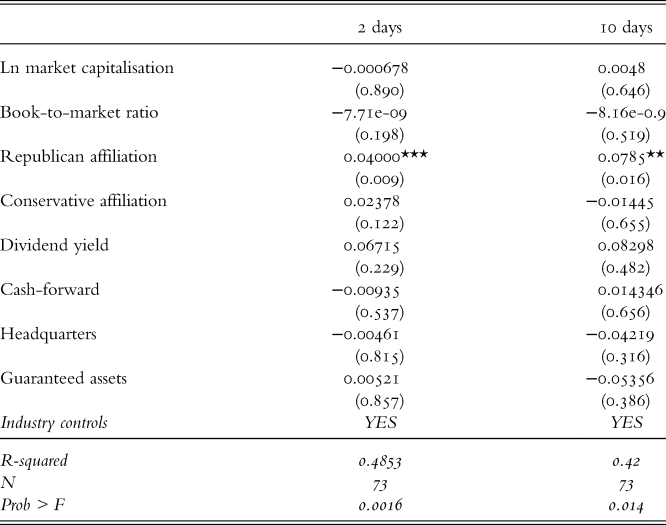
Finally, following Goldman et al. (Reference Goldman, Rocholl and So2009), I explore which variables may explain the observed significant variation in CARs. The set of explanatory variables include: log market capitalisation and the book-to-market ratio (averaged for the three months before the event) as common-risk factors; firm-specific controls, such as the dividend yield (also a three-month average), and dummies taking the value of one if the stock was tradable both spot and forward, the company had its headquarters in France, and if the company had guaranteed assets (as in the case of railways and some colonial banks); finally, dummies for republican and conservative affiliations. Industry-fixed effects are also included.
The results, shown in Table 8, confirm that political connections to republicans is the only variable with a positive and significant effect on CARs for both event windows.
Determinants of cumulative abnormal returns
Coefficients with significance levels 0.10%*, 0.05**, 0.01***. P-values in parentheses.
VIII
This article has explored investors’ reaction to the rise of Boulangism, a mass political phenomenon that shook the foundations of the French Third Republic between 1887 and 1889. The main objective of the study was to understand whether the Boulangist movement was perceived as a credible threat to the republican regime, and especially to the symbiotic relationship between republican parties and business elites. For this purpose, I reconstructed political connections for a large sample of 73 companies quoted in the Paris Bourse, in order to identify ‘republican’, ‘conservative’ and non-connected firms. I found that political connections were widespread (two-thirds of the firms in the sample had at least one politician on the board of directors), especially among large firms (80 per cent of the top 40 firms by market capitalisation were politically connected). Among the 48 politically connected firms in the sample, links with republican parties largely prevailed (63 per cent, against 37 per cent linked to monarchist forces). I also found that political connections contributed positively to the probability of stocks being traded in the Bourse in the period March–December 1888, which saw the escalation of the Boulangist movement.
Finally, I implemented an event study around a critical date, 27 January 1889, when Boulanger, after winning a by-election in Paris that political forces regarded as a plebiscite on the Republic, surprisingly decided not to stage a coup d’état, against the expectations of his supporters. I found that the stocks of ‘republican’ firms experienced positive cumulative abnormal returns in windows ending two and 10 days after the election, whereas no abnormal returns can be observed for ‘conservative’ and non-connected firms. This finding suggests that investors considered Boulanger's threat credible and reacted positively to his surprising decision to abstain from staging a violent overthrow of the regime, as well as to the sudden subsiding of his political movement in the days after the election.
Appendix 1. Balance sheet data of sampled firms
Political connections of sampled firms