INTRODUCTION
It has long been recognized that white clover (Trifolium repens) can have beneficial effects on productivity when sown in a mixture intermingled with grass in grazed pasture (Chapman et al. Reference Chapman, Parsons, Schwinning and Woodfield1996; Davies & Hopkins Reference Davies, Hopkins and Younie1996; Parsons & Chapman Reference Parsons, Chapman and Hopkins2000). The benefits of its use can be seen in terms of both increased biomass productivity, through greater nitrogen (N) inputs (Frame et al. Reference Frame, Charlton and Laidlaw1998), and animal productivity, through the provision of forage with increased protein availability and quality (Rutter et al. Reference Rutter, Orr, Penning, Yarrow and Champion2002; Champion et al. Reference Champion, Orr, Penning and Rutter2004). In New Zealand in 1996, clover contributed an estimated NZ$3.04 billion annually, c. £1·07 billion, through fixed N and forage yield (Caradus et al. Reference Caradus, Woodfield, Stewart and Woodfield1996). However, one of the primary limitations to realizing these benefits is the low proportion of clover observed in pastures (Chapman et al. Reference Chapman, Parsons, Schwinning and Woodfield1996), which is spatially patchy and temporally variable (Edwards et al. Reference Edwards, Parsons, Newman and Wright1996; Fothergill et al. Reference Fothergill, Davies, Morgan, Jones and Younie1996). This is thought to be due to the metabolic costs of N fixation, competition with grass, the preference for clover by grazing animals and patchy dung and urine deposition.
A variety of approaches, such as field experiments, pasture management and modelling, have been used to understand the limitations experienced with the use of clover, and plant breeding is used to overcome them (Parsons et al. Reference Parsons, Edwards, Chapman and Carran2006). There have been a number of models developed to simulate processes within pasture (Parsons et al. Reference Parsons, Harvey and Johnson1991a; Thornley Reference Thornley1998). One model used to study grass–clover dynamics was the physiologically based mechanistic model, developed by Thornley et al. (Reference Thornley, Bergelson and Parsons1995), which used the fluxes of carbon (C) and N between pools in soil and plant material. The key understanding derived from the model was the formalization of the N-based competitive trade-off between grass and clover. Thornley et al. (Reference Thornley, Bergelson and Parsons1995) showed that when soil mineral N is low, clover is able to supplement its mineral N uptake through fixation, therefore giving it a greater relative growth rate than, and competitive advantage over, grass. However, when soil mineral N is high, grass has the competitive advantage because it has only the energetic cost of mineral N uptake alone. This is more efficient than clover, which undertakes both N uptake and N fixation. By the cycling of N through soil and plant material, it is hypothesized that an equilibrium in soil N and species is established, where the relative competitive advantages of grass and clover are balanced (Thornley et al. Reference Thornley, Bergelson and Parsons1995).
The Thornley et al. (Reference Thornley, Bergelson and Parsons1995) model, however, was not able to adequately simulate the temporal and spatial variability observed in the field (Edwards et al. Reference Edwards, Parsons, Newman and Wright1996; Fothergill et al. Reference Fothergill, Davies, Morgan, Jones and Younie1996) and was later modified by Schwinning & Parsons (Reference Schwinning and Parsons1996a), who introduced selective grazing and a spatial context, and showed that clover populations oscillated at the patch scale, while urine deposits stabilized the clover population at the field scale. Schwinning & Parsons (Reference Schwinning and Parsons1996a) also showed that the soil mineral N status determined whether grass and clover were able to co-exist; however, when they did co-exist, the plant species regulated the soil mineral N. This mechanism was then embedded within a spatially explicit cellular automaton model (Schwinning & Parsons Reference Schwinning and Parsons1996b) and used to investigate the intrinsic spatial and temporal variability within mixed grass–clover swards. This method brought together both ecological and physiological understanding, and combined them to successfully reproduce the observed complex dynamics of grass–clover populations (Cain et al. Reference Cain, Pacala, Silander and Fortin1995; Schwinning & Parsons Reference Schwinning, Parsons and Younie1996c).
One method suggested to increase the clover content within grass–clover pasture is to spatially separate grass and clover into monocultures within the same pasture (Chapman et al. Reference Chapman, Parsons, Schwinning and Woodfield1996). This would allow clover to grow without competition from grass and allow grazing animals their diet of choice. Spatially separated systems have been used extensively in preference studies, and have demonstrated short-term benefits to animal intake, milk yield, wool growth and liveweight change (Parsons et al. Reference Parsons, Edwards, Chapman and Carran2006). However, it is unclear if spatial separation, as a method of pasture management, has long-term beneficial consequences to the persistence of clover in grass–clover pasture. In addition, a concern with the use of spatially separated grass–clover monocultures is that the transfer of N from clover to grass may be reduced, potentially leading to lower overall grass production (Edwards et al. Reference Edwards, Parsons and Bryant2008). Below-ground transfer of N will only occur along the boundary where the clover monoculture meets the grass monoculture. Above-ground transfer will still take place via the grazing animal; however it may be lessened if their grazing activity is concentrated on the preferred clover monocultures in the pasture. In this context, changing the degree of spatial separation to narrow strips of alternating grass and clover within the same field may be a useful strategy for balancing plant competition and selective grazing with the transfer of N (Rutter Reference Rutter2006). It is difficult to assess the potential long-term benefits and challenges associated with the use of spatially separated grass–clover pastures through experimental studies, which are short in duration (typically <3 years) and modelling is an important tool in addressing this.
The importance of the initial spatial arrangement to the persistence and coexistence of plant communities has been highlighted by a number of authors (Silvertown et al. Reference Silvertown, Holtier, Johnson and Dale1992; Racz & Karsai Reference Racz and Karsai2006). Silvertown et al. (Reference Silvertown, Holtier, Johnson and Dale1992), using a cellular automaton model, parameterized from a field experiment, showed that a random starting arrangement produced a rapid loss of the majority of species and a shift to a few dominating species, while monocultures enabled coexistence of the majority of species, before they started to decline at a decreased rate. Silvertown et al. (Reference Silvertown, Holtier, Johnson and Dale1992) concluded that the spatial pattern and order in which the competing species were arranged may be as important to the outcome of a competitive interaction as the density and frequency of competitors. This concept was expanded upon by Racz & Karsai (Reference Racz and Karsai2006), who explored the effect that initial starting arrangement had on the time taken for a stronger plant species to drive a weaker plant species to extinction and showed that there was a direct negative relationship between the time for the weaker species to go extinct and the perimeter to area ratio of the monocultures in the initial starting arrangement. Racz & Karsai (Reference Racz and Karsai2006) argued that aggregation should be taken into account when choosing an initial starting arrangement for spatially explicit models, as it would provide new insights into the timescale over which competition takes place.
As part of ongoing research into strategies to increase legume abundance in pasture and diet, the purpose of the present work was to explore, using modelling, the impact of the spatial separation of grass and clover within the same pasture by managing the initial sowing arrangement, at a range of spatial scales, on clover abundance, distribution and spatial aggregation at time frames up to 40 years.
METHODS
Model structure
The model used was an adaptation of the Schwinning & Parsons (Reference Schwinning and Parsons1996b) model and represents a two-dimensional cellular automaton ‘universe’, made up of interlocking hexagonal cells, which are spatially and temporally discrete. The model is representative of a grass–clover pasture which might be found in temperate regions, but is climatically and pedologically non-specific. Each cell represents a 30 mm wide patch. Model construction and testing was developed in Borland Delphi 7 (©Borland Software Corporation Reference Parsons, Edwards, Chapman and Carran1983–2002).
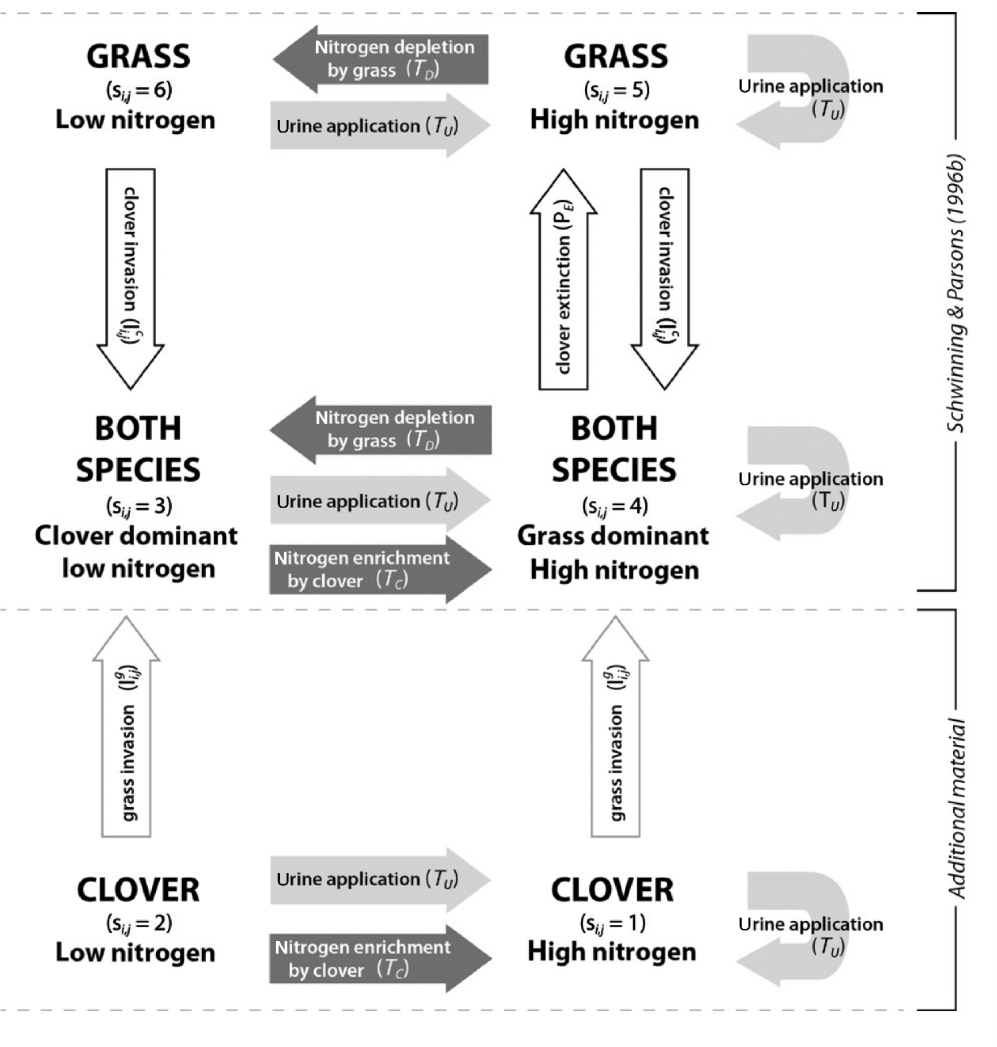
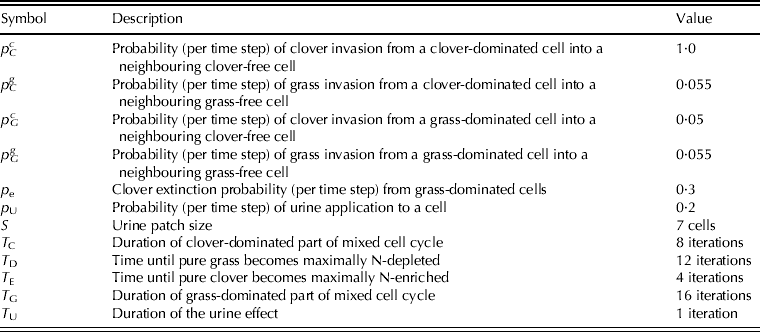
Each cell had one of six discrete states (s), numbered 1–6, denoting both the species composition and N status (Fig. 1). To allow for clover monoculture in spatially separated systems, two new clover-only cell states were added to the existing four cell states in the Schwinning & Parsons (Reference Schwinning and Parsons1996a) model, using information from both experimental (Sharp Reference Sharp2007) and modelling studies (Schwinning & Parsons Reference Schwinning and Parsons1996b). Cells contained either grass (5 or 6) or clover (1 or 2) or both grass and clover (3 or 4), and could either have a ‘high’ N status (1, 3 or 5) or ‘low’ N status (2, 4 or 6). Nitrogen status (denoted a) denotes the time taken for clover to enrich the soil N and grass to deplete soil N. While the value for state is discrete, N status is continuous. The transition between states was determined by changes in the soil N status of the cell, local invasion of clover or grass, or extinction of clover. Values for these parameters are given in Table 1. Values governing the deterministic state transitions of N depletion by grass and N enrichment by clover were derived from Schwinning & Parsons (Reference Schwinning and Parsons1996a) and are supported by empirical data (Schwinning & Parsons Reference Schwinning, Parsons and Younie1996c). To the present authors’ knowledge, data are not available on the local extinction and invasion of clover and grass in response to local plant community structure; therefore values for these stochastic state transitions were predominantly derived from Schwinning & Parsons (Reference Schwinning and Parsons1996b). The model ran with a 2-month time step, as used in the Schwinning & Parsons (Reference Schwinning and Parsons1996a) model.
Diagrammatic representation of the cell states and the relationships between them, where s is the state of the cell at coordinates i,j. Note, the model depicted above the broken line is derived from Schwinning & Parsons (Reference Schwinning and Parsons1996b) and below is additional material added to accommodate clover monocultures.

Default model parameter values, as described in Schwinning & Parsons (Reference Schwinning and Parsons1996b) and derived from Sharp (Reference Sharp2007)
s is defined as:
$$Si,j(t)= \left\{\openup6 {\matrix{ {1 \ {\rm if} \ (S_{i,{\rm} j(t - 1)} = 1) \ {\rm or} \ (S_{i,{\rm} j(t - 1)} = 2 \ {\rm and} \ a_{i,{\rm} j(t - 1)} - 1 = 0)} \hfill \cr {2 \ {\rm if} \ (S_{i,{\rm} j(t - 1)} = 2) \ {\rm and} \ a_{i,{\rm} j(t - 1)} - 1 \gt 0)} \hfill \cr {3 \ {\rm if} \ (S_{i,{\rm} j(t - 1)} = 3 \ {\rm and} \ a_{i,{\rm} j(t - 1)} - 1 \gt 0) \ {\rm or} \ (S_{i,{\rm} j(t - 1)} = 4 \ {\rm and} \ a_{i,{\rm} j(t - 1)} - 1 = 0){\rm}} \hfill \cr {{\rm or} \ ({\rm with \ probability} I_{i,j}^{\,\rm g} \ {\rm if} \ S_{i,j(t - 1)} {\rm = 2)\ or} \ ({\rm with \ probability} I_{i,j}^{\,\rm c} \ {\rm if} \ S_{i,j(t - 1)} {\rm = 6)}} \hfill \cr {4 \ {\rm if} \ (S_{i,{\rm} j(t - 1)} = 4 \ {\rm and} \ a_{i,{\rm} j(t - 1)} - 1 \gt 0) \ {\rm or} \ (S_{i,{\rm} j(t - 1)} = 3 \ {\rm and} \ a_{i,{\rm} j(t - 1)} - 1 = 0){\rm}} \hfill \cr {{\rm or} \ ({\rm with \ probability} I_{i,j}^{\,\rm c} \ {\rm if} \ S_{i,j(t - 1)} {\rm = 5) \ or} \ ({\rm with \ probability} \ I_{i,j}^{\,\rm g} \ {\rm if} \ S_{i,j(t - 1)} {\rm = 1)}} \hfill \cr {5 \ {\rm if} \ (S_{i,{\rm} j(t - 1)} = 5 \ {\rm and} \ a_{i,{\rm} j(t - 1)} - 1 \gt 0) \ {\rm or} \ ({\rm with \ probability} \ \rho _{\rm e} \ {\rm if} \ S_{i,j(t - 1)} {\rm = 4)}} \hfill \cr {6 \ {\rm if} \ (S_{i,{\rm} j(t - 1)} = 6 \ {\rm or} \ (S_{i,{\rm} j(t - 1)} = 5 \ {\rm and} \ a_{i,{\rm} j(t - 1)} - 1 = 0){\rm}} \hfill \cr}} \right.$$where the state (s) of the cell at coordinates i,j at time (t) is determined by the state (s i,j (t−1)) and N status (a i,j (t−1)) of that cell in the previous time step, the probability of extinction of clover (p e), and the probability of invasion by grass (I i, jg) or clover (I ci, j).
a is defined as:
$$a_{i,j(t)} = \left\{\openup4 {\matrix{ {a_{i,j(t - 1)} - 1\ {\rm if} a_{i,j(t - 1)} - 1 \lt 0,} \hfill \cr {T_{\rm G} \ {\rm if \ (}a_{i,j(t - 1)} - 1 = 0 \ {\rm and} \ s_{i,j(t - 1)} = 3) \ {\rm or} \ ({\rm with \ probability} \ I_{i,j}^{\,\rm g} \ {\rm if} \ S_{i,j(t - 1)} {\rm = 1),}} \hfill \cr {T_{\rm C} \ {\rm if \ (}a_{i,j(t - 1)} - 1 = 0 \ {\rm and} \ s_{i,j(t - 1)} = 4) \ {\rm or} \ ({\rm with \ probability} \ I_{i,j}^{\,\rm c} \ {\rm if} \ S_{i,j(t - 1)} {\rm = 6)}} \hfill \cr {0 \ {\rm if \ ((}s_{i,j(t - 1)} \lt 3\ {\rm or}\ S_{i,j(t - 1)} {\rm \gt 4) \ and \ (}a_{i,{\rm} j(t - 1)} - 1 = 0 \ {\rm or} \ a_{i,{\rm} j(t - 1)} = 0)){\rm}} \hfill \cr {T_{\rm C} \left( {\displaystyle{{a_{i,j(t - 1)} - 1} \over {T_{\rm E}}}} \right)\ {\rm with \ probability} \ I_{i,j}^{\,\rm g} \ {\rm if} \ S_{i,j(t - 1)} {\rm = 2,}} \hfill \cr {T_{\rm D} \left( {\displaystyle{{a_{i,j(t - 1)} - 1} \over {T_{\rm G}}}} \right)\ {\rm with \ probability} \ \rho _{\rm e} \ {\rm if} \ S_{i,j(t - 1)} {\rm = 4,}} \hfill \cr {T_{\rm G} \left( {\displaystyle{{a_{i,j(t - 1)} - 1} \over {T_{\rm E}}}} \right)\ {\rm with \ probability} \ I_{i,j}^{\,\rm c} \ {\rm if} \ S_{i,j(t - 1)} {\rm = 5;}}, \hfill \cr}} \right.$$where the N status (a) of the cell at coordinates i,j at time (t) is determined by the state (s i,j(t−1)) and N status (a i,j(t−1)) of that cell in the previous time step, the probability of extinction of clover (p e), the probability of invasion by grass (I gi, j) or clover (I ci, j), the time taken for clover to enrich the soil N in a ‘low’ N mixture (T C) and a clover monoculture (T E), and for grass to deplete the soil N in a ‘high’ N mixture (T G) and a grass monoculture (T D).
The probability of clover (I ci,j) and grass (I gi, j) invading a cell at coordinates i,j were determined by:
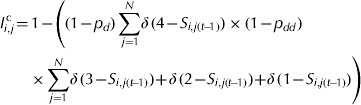 $$\eqalign{\tab{I_{i,j}^{\,\rm c}\! = \!1 \!-\! \left( {(1 \!-\! p_d)\sum\limits_{\,j = 1}^N\! \delta \, (4 \!-\! S_{i,j(t\! -\! 1)}) \times (1 \!-\! p_{dd}})\right.}\cr\tab\quad\quad\left.\times\sum\limits_{j = 1}^N\! \delta \, (3\! -\! S_{i,j(t\! -\! 1)}) \!+\! \delta \, (2\! -\! S_{i,j(t\! -\! 1)}) \!+ \!\delta \, (1 \!-\! S_{i,j(t\! -\! 1)})} \right)} $$
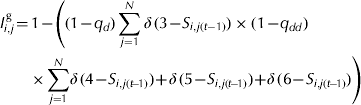 $$\eqalign{\tab {I_{i,j}^{\,\rm g} \!= \!1 \!-\! \left( (1\! -\! q_d)\sum\limits_{j = 1}^N \delta \, (3\! -\! S_{i,j(t - 1)}) \times (1\! -\! q_{dd})\right.}\cr\tab\quad\quad\left.\times\sum\limits_{j = 1}^N\! \delta \, (4\! -\! S_{i,j(t\! -\! 1)})\! +\! \delta \, (5\! -\! S_{i,j(t\! -\! 1)})\! +\! \delta \, (6 \!-\! S_{i,j(t\! -\! 1)})} \right)} $$
where the probability of invasion (I) of the cell at coordinates i,j by grass (g) or clover (c) is calculated using the probability of clover invading from a clover-dominant (p Cc) or grass-dominant cell (p Gc), as defined in Schwinning & Parsons (Reference Schwinning and Parsons1996b), or grass invading from a clover-dominant (p gC) or grass-dominant cell (p gG), derived from Sharp (Reference Sharp2007), and the number of neighbours (N) of each cell type in the previous time step.
In addition, the ability to include urine patches and variable winter mortality, such as might be observed in a temperate pasture grazing system, was included in the simulation model. Urine patches are a local disturbance, previously described as one of the key drivers of heterogeneity in this system (Schwinning & Parsons Reference Schwinning and Parsons1996a, Reference Schwinning and Parsonsb), while winter mortality represented field-scale disturbance. Patches of urine may be applied at random across the simulated pastures, with probability (p u) and size (S), using values which correspond to a stocking rate of 20 sheep/ha and 15 urinations/animal/day (values from Schwinning & Parsons (Reference Schwinning and Parsons1996b) derived from data in Doak (Reference Doak1952), Orr et al. (Reference Orr, Penning, Parsons and Champion1995) and Parsons et al. (Reference Parsons, Orr, Penning, Lockyer and Ryden1991b)). The duration of the urine effect (T U) contributes to the N status of the cell, with a value that corresponds to elevating the soil N for 2 months (values from Schwinning & Parsons (Reference Schwinning and Parsons1996b) derived from data in Ryden (Reference Ryden1984) and Marriott et al. (Reference Marriott, Smith and Baird1987)). Non-selective defoliation is implicit in the model of Schwinning & Parsons (Reference Schwinning and Parsons1996a), from which the transition values T C, T E, T G and T D are derived. Variable winter mortality could impose an annual, i.e. at six 2-monthly iterations, clover extinction from a proportion of grass-dominant mixed cells; however, clover cannot go extinct from clover-dominant mixed cells or clover monoculture cells, a rule used by Schwinning & Parsons (Reference Schwinning and Parsons1996b), as it is unlikely that all clover plants within a 30 mm-wide clover-dominant patch would go extinct as a result of cold temperatures at the same time. To the present authors’ knowledge, there is no experimental data on winter mortality of clover in relation to local plant species composition, therefore the proportion of winter mortality was uniform within-year, and varied randomly from 0·2 to 0·8 each year (Schwinning & Parsons Reference Schwinning and Parsons1996b).
Simulations
Simulations were made up of 160 000 cells of 585 mm2 each, which represented a 12×12 m area. While this is significantly smaller than a typical commercial pasture, test simulations showed that this was the size beyond which there were no significant differences between outputs from multiple runs of the model.
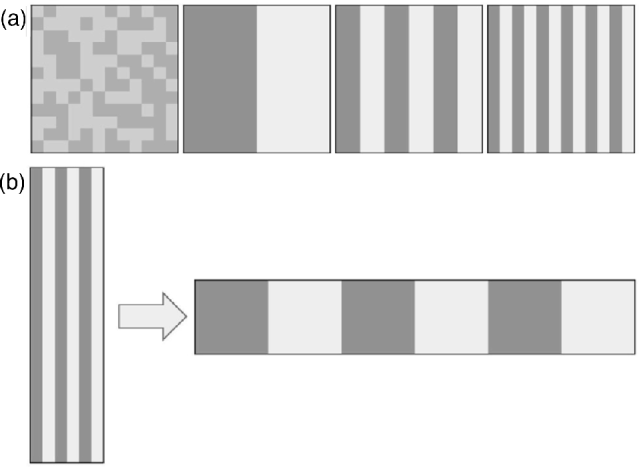
Four starting spatial arrangements were selected as being useful to explore grass–clover dynamics and representative of the possible levels of spatial separation (Fig. 2a). First, a mixture treatment of mixed cells was used, with a random distribution of 0·5 clover-dominant and 0·5 grass-dominant cells, and then three spatially separated arrangements, all containing 0·5 by area monocultures of both species. These were full separation, through adjacent 6 m-wide monocultures, and partial separation through 3 and 0·75 m-wide alternating monoculture strips. Default parameter values (Table 1) were used for all simulations, first without urine application.
Diagrammatic representation of the starting spatial arrangements of grass (dark grey) and clover (light grey) for two sets of simulations. The first set (a) comprises a mixture, adjacent monocultures, 3 and 0·75 m strips. The second set (b) compromises a range of simulations where the strip ‘widths’ and simulation ‘length’ were varied, and the number of strips and simulation area was held constant.
Patches of urine, using the default values, were then applied at random across the same simulated pastures as described above to examine the impact of local disturbance. Similarly, variable winter mortality was introduced later to simulate disturbance at the field scale.
The influence that the degree of spatial separation had on clover persistence was also explored. Simulations were constructed where the initial spatial arrangement was changed to examine the impact of the degree of spatial separation on the amount, dispersal and spatial aggregation of clover within the pasture (Fig. 2b). The strip width was varied at intervals of 0·3 m, from 0·3 to 6·0 m, and the number of strips held constant, giving a number of simulations with a range of ‘widths’. To ensure the simulation area, and therefore the number of cells, was constant between simulation setups, the ‘length’ of the simulation was varied. In all cases, each simulation was repeated 25 times and the arithmetic mean value shown.
Four measures were used to address the effect of spatial separation on clover dynamics. First, the clover content of the automata quantifies the amount of clover present in the simulated pasture at a point in time. Although a dimensionless parameter between 0 and 100, and not comparable with that derived from experimental data, it does provide a method by which simulations can be compared. Clover content was calculated using the formula (Schwinning & Parsons Reference Schwinning and Parsons1996b):
 $${\rm Clover\ contents}_{(t)} = \displaystyle{{\left( {\sum\nolimits_{i = 1}^{n_{c(t)}} {\theta \left( {1 + \sin \left( {\displaystyle{{a_{i,j(t)}} \over {T_{\rm C}}} \pi} \right)} \right)}} \right) + \left( {\sum\nolimits_{i = 1}^{n_{g(t)}} {\theta \left( {1 - 0.8\sin \left( {\displaystyle{{a_{i,j(t)}} \over {T_{\rm G}}} \pi} \right)} \right)}} \right) + 100n_{m(t)}} \over {n_{c(t)} + n_{g(t)} + n_{m(t)}}}} $$
where θ is a constant, set at the mid-point of 50, n is the number of cells at time (t) which are grass-dominant mixed cells (g), clover-dominant mixed cells (c) or clover monoculture cells (m), a i,j(t)=N status of the cell at coordinates i at time t, T C=the time taken for clover to enrich the soil N in a ‘low’ N mixture and T G=the time taken for grass to deplete the soil N in a ‘high’ N mixture. Second, the proportion of cells containing clover, as a value between 0 and 1, was used as a measure of clover spread and dispersal within the automaton. Third, to give an indication of year-to-year variation in both amount and dispersal, variance was calculated. Fourth, to provide an indication of spatial aggregation, a clumping index (I C) was used (Schwinning & Parsons Reference Schwinning and Parsons1996b):
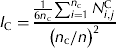 $$I_{\rm C} = \displaystyle{{{\textstyle{1 \over {6n_{\rm c}}}} \sum\nolimits_{i = 1}^{n_{\rm c}} {N_{i,j} ^{\rm C}}} \over {\left( {n_{\rm c} /n} \right)^2}} $$
where n is the total number of cells, n c is the number of cells containing clover and N Ci,j is the number of cells adjacent to the cell with coordinates i,j that contain clover. The index is the ratio of the actual frequency of interfaces between cells containing clover to the expected frequency. Therefore, if the clover was distributed spatially at random, I C would have a value of one, while a value of greater than one would indicate spatial aggregation.
RESULTS
Grass–clover dynamics
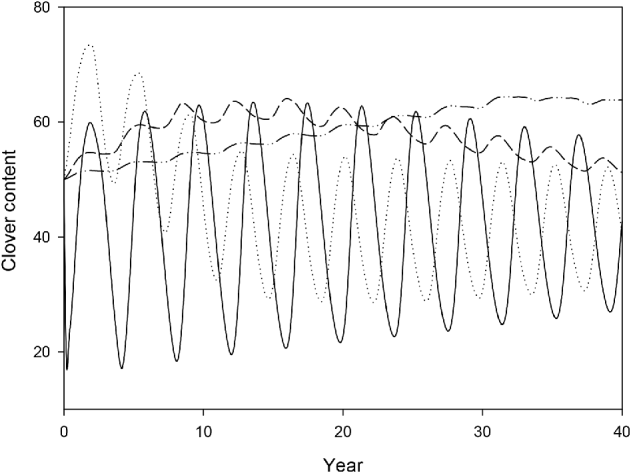
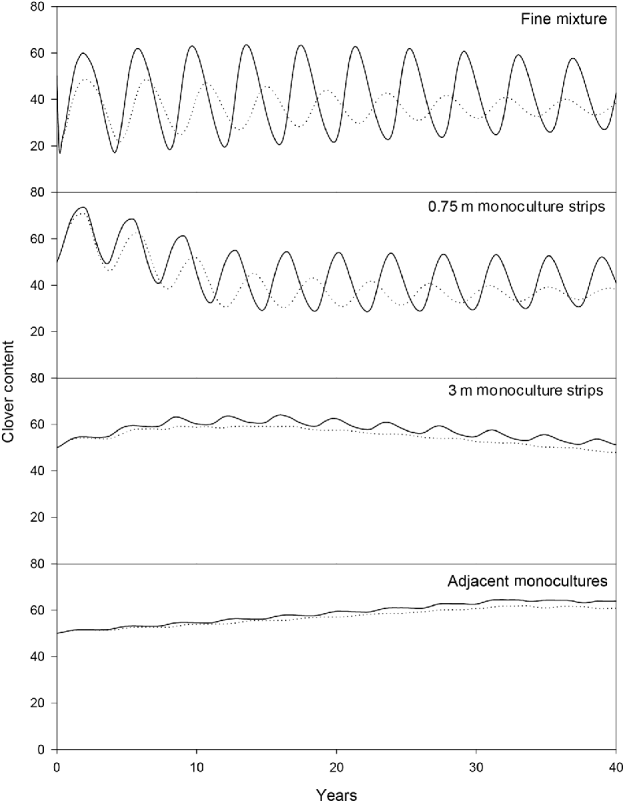
The clover content in the mixture treatment showed a cyclical pattern, with values of this dimensionless parameter ranging from 20 to 60 (Fig. 3). The wavelength of the oscillations was c. 4 years, with the waves appearing to start to reduce after 15 years in both wavelength and amplitude. For the spatially separated treatments, the oscillations were less pronounced and had lower amplitude, as the degree of spatial separation increased. Similar to the mixture treatment, the spatially separated treatments started with a similar wavelength of 4 years, but increasingly cycled out of phase through time. Ultimately all treatments arrived at the same equilibrium clover content of c. 40, but their behaviour and the time taken to reach this equilibrium varied with the degree of spatial separation.
Clover content (dimensionless parameter) from model runs using default values and no urine, for the four treatments, (—) mixture, (…) 0·75 m strips, (- - -) 3 m strips and (–··–··) 6 m adjacent monocultures.
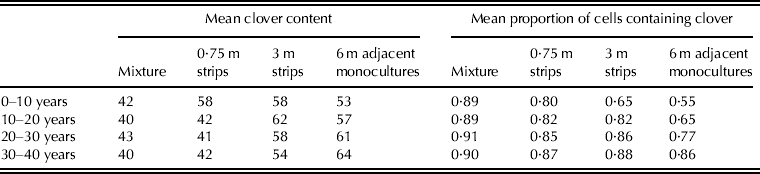
The mean clover content, in the first 10 years, was greater in the spatially separated treatments than in the mixture treatment (Table 2). After the first 10 years, the clover content in the 0·75 m strip treatment resembled the mixture treatment, while the other spatially separated treatments maintained a greater clover content. As time progressed the mean clover content declined in all treatments, except in the adjacent monoculture treatment that increased throughout the timeframe of the simulation.
Model outputs for mean clover content (dimensionless parameter) and proportion of cells containing clover for 10-year periods at 10-year intervals for the four treatments
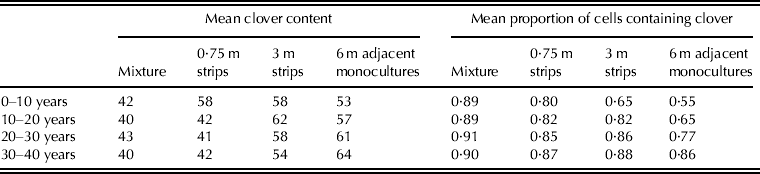
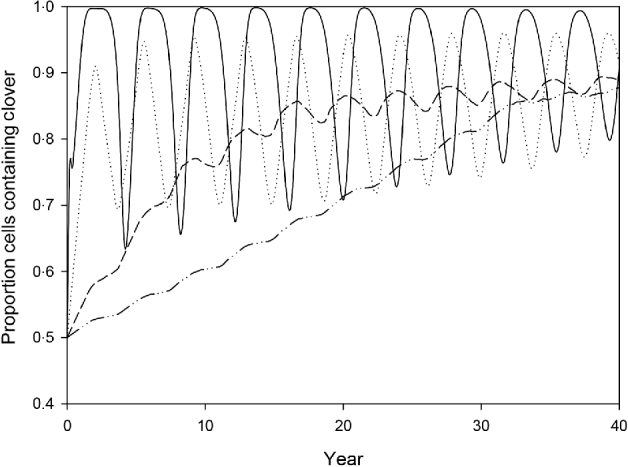
When considering the dispersal of clover throughout the pasture, the mixture treatment, although showing large oscillations, achieved and maintained a greater proportion of cells containing clover than the spatially separated treatments (Fig. 4, Table 3). Figure 4 also shows that as the degree of spatial separation increased, the amplitude of the oscillations decreased, and the time taken to achieve the mean proportion of cells containing clover of c. 0·9 increased. As with clover content, the proportions of cells containing clover, across all treatments, arrived at the same equilibrium, but their behaviour and the time taken to reach that equilibrium varied with the degree of spatial separation.
Proportion of cells in model outputs containing clover using default values and no urine, of the four treatments, (—) mixture, (…) 0·75 m strips, (- - -) 3 m strips and (–··–··) 6 m adjacent monocultures.
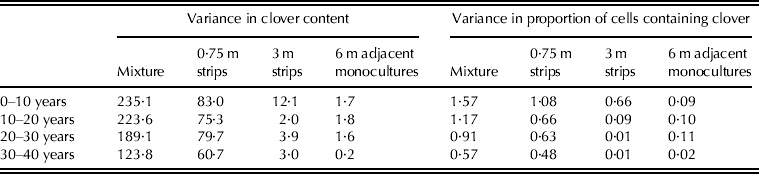
Variance in model outputs for clover content (dimensionless parameter) and proportion of cells containing clover for 10-year periods at 10-year intervals for the four treatments
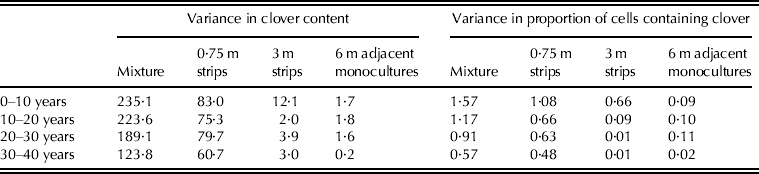
From the above simulations, over the 40-year period, variance in both the clover content and the proportion of cells containing clover, for 10-year periods, was greater in the mixture treatment than in the spatially separated treatments (Table 3). For the mixture treatment, the variances declined through time. Variance declined with the degree of spatial separation.
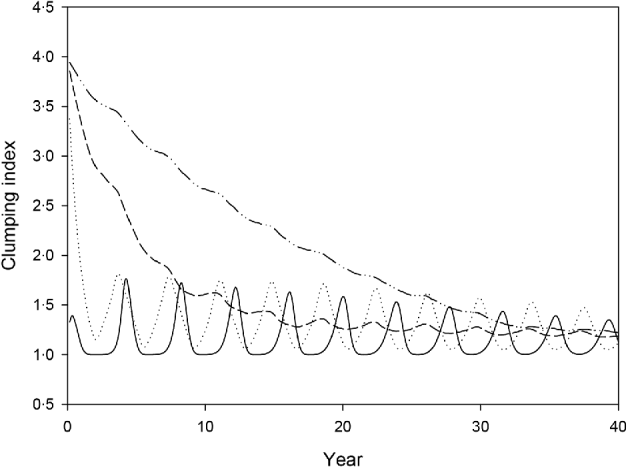
The I C in the mixture treatment varied between 1 and 1·8, indicating that clover showed an aggregated spatial pattern (Fig. 5). These values for clumping, however, were not as great as in the spatially separated treatments, where I C started at 4 but later declined to c. 1·4. The rate of decline decreased as the degree of spatial separation increased. Figure 5 also shows that there was variation in I C, with oscillations increasing as the degree of spatial separation decreases. The amplitude of the oscillations decreases through time.
Clumping index of clover from the model run using default values and no urine, of the four treatments, (—) mixture, (…) 0·75 m strips, (- - -) 3 m strips and (–··–··) 6 m adjacent monocultures.
The results therefore suggest that while spatial separation increases the content and patchiness, and reduces the variation of clover in simulated pasture, clover is less dispersed than in the mixture treatment. This is due to the time taken for clover to spread through the grass monocultures, disintegrating the initial spatial structure, which increases with the degree of spatial separation.
Local and field-scale disturbance
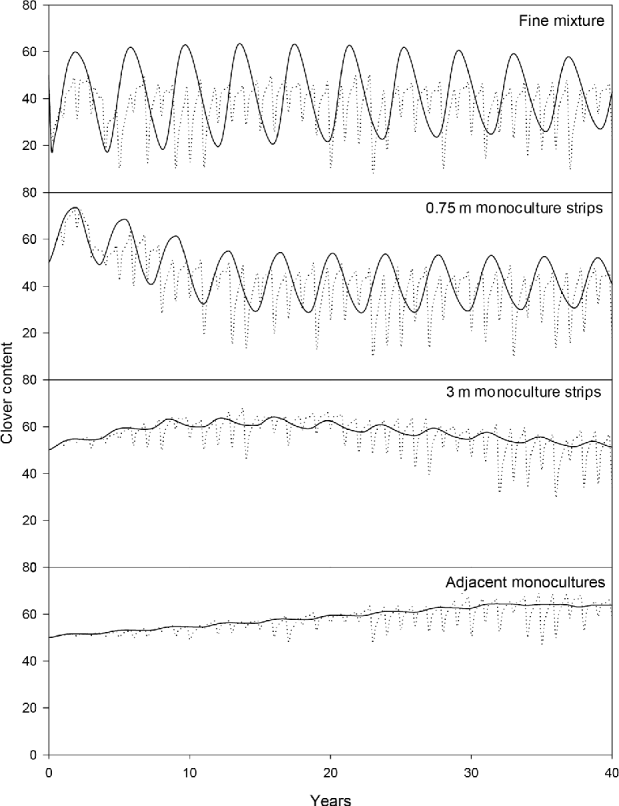
The addition of urine caused changes in the clover content of both the mixture and spatially separated pastures (Fig. 6). In all pastures it caused the amplitude of the oscillations in clover content to decrease, while the wavelength increased. The mean value around which the clover content oscillated was slightly lower than that without urine and caused an increase in the rate at which the oscillations were depressed. Consequently, the equilibrium to which the oscillations in clover content were approaching was lower than that without urine, and was reached more quickly.
Clover content (dimensionless parameter) in mixture, 0·75 m strip, 3 m strip and adjacent monoculture treatments, with (…) and without (—) the application of urine.
Comparing treatments, the addition of urine depressed the clover content to the same extent. Urine also reduced the amplitude of oscillations in all of the treatments; however, in the 3 m and adjacent monoculture treatments it almost completely removed the oscillations, resulting in little difference between the with- and without-urine treatments. Urine, therefore, reduces the total amount and oscillations of clover in a pasture, regardless of initial spatial arrangement, due to urine increasing the overall time mixed species patches spend in the grass-dominant phase, during which clover is vulnerable to the regular extinction (p e, default=0·3).
Figure 7 shows the impact of introducing both urine and variable winter mortality on the clover content in the different treatments. Regular oscillations in clover content were no longer observed, and were replaced by large variation around a constant mean in all treatments. The mean around which the variation occurred was also reduced. The results therefore suggest that the introduction of urine and variable winter mortality produced irregular variation and decreased the amount of clover.
Clover content (dimensionless parameter) in mixture, 0·75 m strip, 3 m strip and adjacent monoculture treatments, with (…) and without (—) the application of urine and, uniform within-year, random between-year winter mortality (0·2–0·8).
Degree of spatial separation
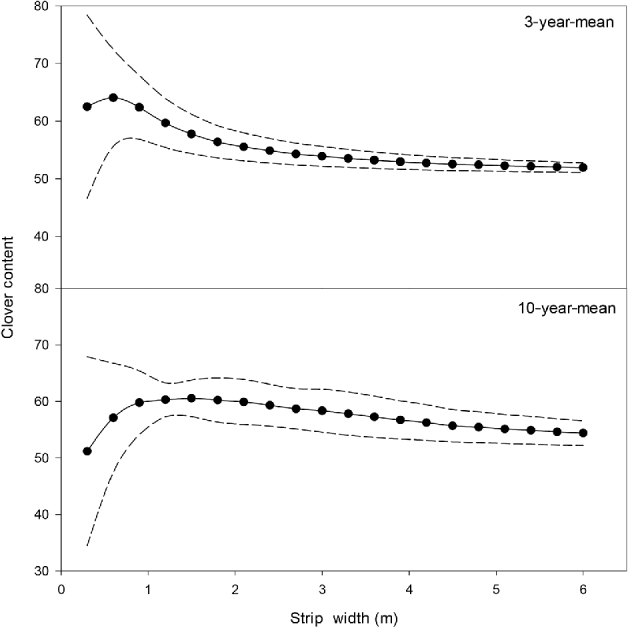
The mean clover content, a measure of the amount of clover in the pasture, over the first 3 years increased slightly from the finer degrees of spatial separation, peaked at 64 and then declined to 55 (Fig. 8). When examined over a greater timeframe, the 10-year mean clover content also exhibited a curved relationship with the degree of spatial separation; however, the peak was reached at a greater strip width. Over both time frames, the standard deviation declined as the degree of spatial separation increased.
Mean clover content (dimensionless parameter) (—●—) over the first 3 and 10 years, with standard deviation (- - - - -), over a range of strip widths, in simulated pastures using default values and no urine application.
Extending the time frame over which the mean clover content was examined increased the clover content in spatially separated systems at wider strip widths, but decreased that in narrower strip widths. This is due to, in the short term, there being more clover in finer degrees of spatial separation by clover spreading into the grass monocultures. However, in the long term, in the same pastures, the clover content starts to decline due to competition with grass.
The proportion of cells containing clover, a measure of dispersal of clover within the pasture, declined as the degree of spatial separation increased. In the first 3 years, there was a rapid decline with strip width from 0·8, levelling off at 0·5–0·6. For the 10-year mean, the rate of decline over the range of spatial separation was relatively constant, levelling-off at c. 0·6. There was greater deviation from the mean in the first 10 years, compared with the first 3 years.
The clumping index increased with the degree of spatial separation, indicating that the greater the degree of spatial separation, the more spatially aggregated the clover was within the pasture. In general, there was a reduction in the aggregation of clover within spatially separated pastures through time due to the time taken for the grass to spread into the clover monocultures.
While finer degrees of spatial separation of plant species resulted in a greater amount of clover in a pasture, which is more dispersed, it also caused a less spatially aggregated pattern of clover rich patches. This is due to the time taken for both species to spread across the other monoculture, disintegrating the initial spatial structure, than pastures with greater strip monoculture width.
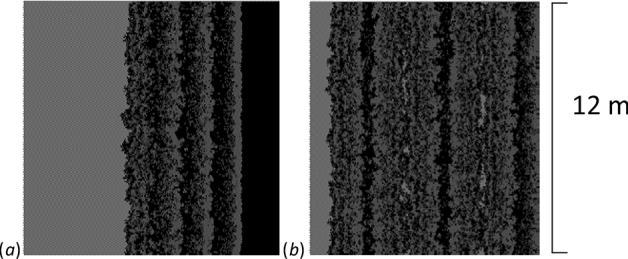
The disintegration of the initial spatial structure in spatially separated systems is shown in Fig. 9. Clover spread across the grass monoculture in waves, leading with clover-dominant mixed cells, followed by grass-dominant mixed cells and then pure grass cells. The pure grass was then easily invaded by the next wave of clover-dominant mixed cells. Strips disintegrated more rapidly than adjacent monocultures, due to the increase in the number of boundaries between the monocultures. In addition, when waves of clover moving in opposite directions in the strip treatments met one another, they caused interference with one another and cancelled one another out.
(a) Adjacent monocultures and (b) monoculture strips, of equal area, after 10 years, where light grey=clover dominance, dark grey=grass dominance and black=grass only.
DISCUSSION
Clover, being typically low and variable in dry matter (DM) content in a mixed sward, is often perceived as an unreliable source of both N and nutritious forage for grazing animals (Chapman et al. Reference Chapman, Parsons, Schwinning and Woodfield1996; Nolan et al. Reference Nolan, Connolly and Wachendorf2001; Williams et al. Reference Williams, Evans, Rhodes and Abberton2003). As a result, a number of authors have suggested the use of spatial separation as a possible method for increasing the clover content of pasture and reducing the year-to-year variation (Chapman et al. Reference Chapman, Parsons, Schwinning and Woodfield1996; Cosgrove et al. Reference Cosgrove, Parsons, Marotti, Rutter and Chapman2001; Rutter Reference Rutter2006). This method of pasture establishment would allow clover to grow in large areas without competition from grass, therefore increasing the amount of clover and removing the observed variation.
Grass–clover dynamics
High clover content in the sward is important for a number of reasons. First, clover is seen as an ‘environmentally friendly’ alternative to artificial N fertilizers, due to its ability to fix atmospheric N (Parsons & Chapman Reference Parsons, Chapman and Hopkins2000). There is a linear relationship between clover production and N input through fixation, therefore suggesting that the amount of biological N fixation achieved within a pasture can be improved by increasing sward clover content (Ledgard et al. Reference Ledgard, Sprosen and Steele1996). This however, may not be the case in spatially separated grass–clover monocultures since the transfer of N from clover to grass may be reduced, potentially leading to lower overall production given the proportion of clover within the pasture (Edwards et al. Reference Edwards, Parsons and Bryant2008). Second, clover is a more nutritious food source than grass, and lambs grazing on clover-rich diets have been shown to have greater liveweight gain than those without clover in their diet (Fraser & Rowarth Reference Fraser and Rowarth1996), therefore suggesting that increased liveweight gains may be achievable through increasing clover DM in the sward.
Simulation outputs from the present study showed that the clover content in the mixed pasture oscillated with a wavelength of c. 4 years, the same as that modelled by Schwinning & Parsons (Reference Schwinning and Parsons1996b) and validated using the 23-year Winchmore dataset (Schwinning & Parsons Reference Schwinning, Parsons and Younie1996c). The simulations also showed that although spatially separated pastures had the same equilibrium clover content as a mixed pasture, clover content could be increased during the first 40 years after establishment. At present it is not possible to validate this finding experimentally, due to previous studies of spatially separated grass–clover grazing systems being of limited duration with the longest currently being 3 years (Sharp et al. Reference Sharp, Edwards and Jeger2012a). The increased clover content was observed throughout the whole 40 years of the simulation for the 3 m strips and adjacent monoculture treatments. However, this was not the case in the 0·75 m strips treatment. This was due to the 0·75 m clover strips being rapidly invaded by grass, competing with the clover. In the other spatially separated treatments, the increased time taken for grass to invade the larger clover monocultures allowed the pasture to maintain a high clover content. While this cannot be supported by long-term experimental evidence, short-term studies show that spatial separation increases the clover content (18–30% in the spatially separated treatments v. 9% in the conventional mixture on a DM basis) and production (average over the growing season of 3 years 2881–3466 kg DM/ha in the spatially separated treatments v. 1470 kg DM/ha in the conventional mixture) at the field scale (Sharp et al. Reference Sharp, Edwards and Jeger2012a, Reference Sharp, Edwards and Jegerb). Pastures tend to deteriorate in productivity though time as less productive weed species, such as Poa spp. and Agrostis spp., invade. It must therefore be noted that the model does not consider the invasion of weed species.
Silvertown et al. (Reference Silvertown, Holtier, Johnson and Dale1992) showed that aggregation in grassland plant species had a significant effect on the time taken for stronger competitors to drive weaker ones to extinction, and also noted that while the results of cellular automata models for mixtures were similar to those from non-spatial models, aggregated initial spatial arrangements often gave a completely different outcome in the intermediate stages of community development. Silvertown et al. (Reference Silvertown, Holtier, Johnson and Dale1992) therefore hypothesized that the spatial pattern and spatial order of competing species may be as important to the outcome of a competitive interaction, as the density and frequency of competitors. The Schwinning & Parsons (Reference Schwinning and Parsons1996b) model does not allow a competitive outcome with one dominant species driving the others to extinction, as in Silvertown et al. (Reference Silvertown, Holtier, Johnson and Dale1992). However, the adaptation and use of their grass–clover model for spatially separated systems has shown that an aggregated initial spatial arrangement of grass and clover monocultures can significantly improve the clover content in the short-to-medium term.
Dispersal of clover within a pasture, and its close proximity to the companion grass, is important for below-ground transfer of fixed atmospheric N (Ledgard Reference Ledgard2001). With an aggregated distribution, as is observed in spatially separated grass–clover pastures, there may be insufficient contact with grass and fixed N may be lost from the system through leaching (Whitehead Reference Whitehead1995). This is one of the primary concerns of the use of a spatially separated system (Chapman et al. Reference Chapman, Parsons, Schwinning and Woodfield1996; Rutter Reference Rutter2006). The present model results showed that spatial separation in the short-to-medium term inhibits the dispersal of clover throughout the pasture due to the time taken for clover to spread throughout the grass monocultures.
Variation in clover content is another limiting factor to the successful use of clover in pasture (Fothergill et al. Reference Fothergill, Davies, Morgan, Jones and Younie1996). While high clover content may have the benefits described above, the observed variation results in clover performance falling short of its expected potential (Chapman et al. Reference Chapman, Parsons, Schwinning and Woodfield1996; Brock & Hay Reference Brock and Hay2001). This perception has led to the increased dependence on artificial N fertilizers as a reliable and controllable source of N (Whitehead Reference Whitehead1995). The outputs of the simulation model for mixed pastures showed the typical peaks in clover content every 3–4 years observed in the field (Fothergill et al. Reference Fothergill, Davies, Morgan, Jones and Younie1996). Outputs also showed that spatial separation reduced the observed variation in both clover content and dispersal, due to the stability provided by large monoculture areas, within which there is no inter-specific competition.
Spatial aggregation or patchiness of plant species, especially clover, within a pasture has important implications for grazing behaviour and animal outputs. Champion et al. (Reference Champion, Orr, Penning and Rutter2004), with the use of spatially separated plant species, showed the importance of spatial heterogeneity on the grazing behaviour of sheep; they showed that the main energetic cost associated with diet selection, to sheep grazing on mixture, was the time required to search for clover, their preferred pasture species. In situations where the sheep did not have to search for clover, the animal growth rates were greater. This suggests that increasing the frequency and size of clover-rich patches, such as clover monoculture strips, would have the benefit of reducing the energetic costs associated with foraging. Model outputs showed that clover has greater spatial aggregation in the short to medium term in spatially separated pastures than in a mixture. This was due to the use of monocultures which took time to be invaded by grass, increasing the time during which there were large patches of high clover content available, i.e. as a monoculture. While this model did not include any aspect of selective grazing, selective grazing can alter the competitive interactions between plant species and may lead to species coexistence, which in the absence of grazing may not occur. In studies using monocultures of differing sizes, evidence of preference is observed at all scales, but extinction of a particular plant species is not observed (Parsons et al. Reference Parsons, Newman, Penning, Harvey and Orr1994; Sharp et al. Reference Sharp, Edwards and Jeger2012a, Reference Sharp, Edwards and Jegerb). Therefore, in the short to medium term, spatial separation can result in an increase in the size and frequency of clover-rich patches, which could potentially have important implications for animal grazing behaviour and production.
Local and field-scale disturbance
In the original work on which the present model is based, the authors showed the importance of both local and field-scale disturbance in driving the observed patchiness and variability of clover (Schwinning & Parsons Reference Schwinning and Parsons1996b). To appreciate whether these disturbances would have similar effects on spatially separated pastures, simulations were run with both random urine application and variable winter mortality.
The introduction of urine patches reduced both the clover content of spatially separated pastures and, if oscillations had been previously observed, these were also reduced or removed, due to urine creating N rich patches and lengthening the time mixed cells spend in their grass-dominated state, and reducing the time in the clover-dominated state. The randomness of urine application also encouraged heterogeneity in the ‘age’ or N status of the cells, and as a result, stopped the cells cycling in concert between states. This observation was the same as that described by Schwinning & Parsons (Reference Schwinning and Parsons1996b). Similarly, field observations of clover content have also shown that compared with mown pastures, grazed pastures receiving patchy urine return have lower clover content (Evans et al. Reference Evans, Williams, Jones and Evans1998).
The introduction of the variable winter mortality resulted in increased but irregular variation in the previously described characteristics. The variation decreased as the degree of spatial separation increased. This is due to a greater proportion of the clover in spatially separated treatments being in grass dominant mixed cells, where it is susceptible to winter mortality.
Degree of spatial separation
The method of spatial separation has been discussed by a number of authors (Chapman et al. Reference Chapman, Parsons, Schwinning and Woodfield1996; Cosgrove et al. Reference Cosgrove, Parsons, Marotti, Rutter and Chapman2001; Rutter Reference Rutter2006; Sharp et al. Reference Sharp, Edwards and Jeger2012a), as a means of increasing the clover content in both the pasture and diet of grazing animals, and research has predominantly focused on large adjacent monocultures. By using these monocultures, concern has been raised over the potential loss of one of the primary reasons for increasing clover content in the sward, N fixation and transfer to the companion grass. The transfer of N from clover to grass can still occur via the above-ground route (Ledgard Reference Ledgard1991), but the below-ground transfer of N may be interrupted. Rutter (Reference Rutter2006) suggested overcoming this problem by separating grass and clover using different degrees of separation, meaning the monocultures are sown in strips of differing width. This would allow animals their diet of choice, while still encouraging contact, and therefore N transfer, between the pasture species. Model outputs showed that spatial separation has a negative relationship with clover content and dispersal and a positive relationship with spatial aggregation, indicating that there is a trade-off between these factors.
In the short term, i.e. over the first 3 years after sowing, the greatest clover content and dispersal was observed in the finer degrees of separation. However, these pastures showed the least spatial aggregation. This is because they had the greatest total boundary length with the grass monocultures, and as a result, spread into a greater area, while still maintaining some clover monoculture area. Over the medium term, i.e. the first 10 years after sowing, these same pastures started to suffer from competition with grass and showed the lowest content and spatial aggregation, while still maintaining the greatest dispersal. These finer degrees of spatial separation also showed the greatest amount of variation in both clover content and dispersal. The findings are similar to those of Racz & Karsai (Reference Racz and Karsai2006), who showed that the greater the perimeter to area ratio of the monocultures in the initial starting arrangement, the longer a weaker competitor was able to persist.
Depending on the characteristics of the pasture deemed most important, for example clover content, patchiness or reduced year-to-year variation, and the timescale over which they were to be achieved, it may be possible to select an optimum degree of spatial separation with respect to these characteristics. For example, if selecting over the medium term (i.e. 10 years), a low- to mid-range strip width might be optimal. This would result in greater clover content and dispersal, but lower spatial aggregation than a wider strip width, and greater clover content and spatial aggregation, but lower dispersal than a narrower strip width.
Validation of the model with experimental data is required to enable its transfer to pastures in the real world, and increase its potential use as a tool to design spatially separated pastures.
Conclusions
A grass–clover model was adapted from an existing spatially explicit grass–clover model (Schwinning & Parsons Reference Schwinning and Parsons1996b). Simulations showed that spatial separation of grass from clover within a pasture led to an increased clover content and spatial aggregation with reduced spread of clover throughout the pasture. The introduction of local-scale disturbance had a similar effect on spatially separated pastures as it did on mixed pasture; however, with field-scale disturbance, spatially separated pastures were less susceptible to this form of irregular variation.
The authors thank Tony Parsons for useful discussions on the development of this work. J Sharp was funded by a BBSRC scholarship.