A word’s phonological characteristics impact its perception and production whether it is heard, spoken, or read. Less intuitively, a word’s orthographic characteristics also impact its perception whether it is heard, spoken, or read, because exposure to a word will activate its orthographic representation regardless of modality (e.g., Frith, Reference Frith1998; Miller & Swick, Reference Miller and Swick2003; Pattamadilok, Perre, Dufau, & Ziegler, Reference Pattamadilok, Perre, Dufau and Ziegler2009; Ventura, Morais, Pattamadilok, & Kolinsky, Reference Ventura, Morais, Pattamadilok and Kolinsky2004; Ziegler, Ferrand, & Motant, Reference Ziegler, Ferrand and Montant2004; Ziegler, Jacobs, & Klueppel, Reference Ziegler, Jacobs and Klueppel2001). This effect has been shown even in verbal tasks such as picture naming and (spoken) lexical decision making, which are conducted even when the speaker is not actually reading (Rastle, McCormick, Bayliss, & Davis, Reference Rastle, McCormick, Bayliss and Davis2011). For example, words with components containing ambiguous spellings may be associated with longer auditory lexical decision times, longer shadowing times as a measure of attention, and more errors in production (Ventura, Morais, & Kolinsky, Reference Ventura, Morais and Kolinsky2007). Alario, Perre, Castel, and Ziegler (Reference Alario, Perre, Castel and Ziegler2007) suggest that this orthographic effect might also serve as a mnemonic device. This phenomenon is called orthographic interference, meaning that phonological–orthographic consistency or inconsistency may cause facilitation or disruption of language processing (Burgos, Cucchiarini, van Hout, & Strik, Reference Burgos, Cucchiarini, van Hout and Strik2014; Weber-Fox, Spencer, Cuadrado, & Smith, Reference Weber-Fox, Spencer, Cuadrado and Smith2003). The current study focuses on the ways in which the modality of nonword stimuli, along with variations in their written representations, impact speech production in children who are good or poor readers.
Orthographic interference occurs for individuals who are literate, specifically in an alphabetic orthography (Morais, Cary, Alegria, & Bertelson, Reference Morais, Cary, Alegria and Bertelson1979; Read, Zhang, Nie, & Ding, Reference Read, Zhang, Nie and Ding1986). Orthographic interference occurs when literate individuals are unable to ignore a written word’s orthography even when instructed to do so. Shankweiler et al. (Reference Shankweiler, Mencl, Braze, Tabor, Pugh and Fulbright2008) state that, for skilled readers, written and spoken language skills are interconnected to such a degree that comprehension occurs regardless of whether the message is communicated by speech or print. Likewise, Halle, Chereau, and Segui (Reference Halle, Chereau and Segui2000) explored the ways in which listeners tend to hear what they think they “should” hear in the context of a meaningful utterance, rather than what is actually presented by the real acoustic signal. Orthography is one factor in this process, in that literate individuals’ knowledge of orthography can disrupt their perception of real speech sounds. For instance, French listeners of spoken language detected the sound /b/ rather than the sound /p/ in the word “absurde,” even though this word is spoken with a /p/ sound (Halle et al., Reference Halle, Chereau and Segui2000). Similarly, Portuguese speakers relied on orthography when blending phonemes into syllables (e.g., whether or not a mute “e” was present), and relied on the spelling of nonwords’ neighbors when blending phonemes into the nonwords (Ventura, Kolinsky, Brito-Mendes, & Morais, Reference Ventura, Kolinsky, Brito-Mendes and Morais2001).
Understanding orthographic interference has important theoretical implications, as it enables us to explore the interactive nature of phonological and orthographic characteristics in language processing. For instance, Damian and Bowers’s (Reference Damian and Bowers2003) findings that orthography influences response times even in word naming suggests that the interaction between phonology and orthography is strong. Other evidence (Damian & Bowers, Reference Damian and Bowers2009) suggests that the orthographic effect is task dependent, as demonstrated by finding that priming effects were exclusively dependent on the presence of phonological, but not orthographic, overlap between the picture and word stimuli. This effect has additionally been explored in logographic orthographies, such as Mandarin Chinese, wherein one written character corresponds to one word. Li, Wang, and Idsardi (Reference Li, Wang and Idsardi2015) found that Chinese characters did not impact reaction time in an implicit priming task, whereas Pinyin (phonetic transcription) was associated with onset facilitation and rime inhibition in reaction time. These authors conclude that in Pinyin, phonological encoding occurs in a smaller unit, whereas in Chinese characters, phonological encoding occurs in a larger unit. Li and Wang (Reference Li and Wang2017) demonstrated a similar effect in native Mandarin-speaking children, indicating that extensive experience with Chinese characters or with Pinyin influences these speakers’ phonological representations.
There are two important theories related to orthographic interference. One is the print–speech coactivation hypothesis, in which researchers describe the development of learning across modalities. More specifically, this is the process of connecting printed letters or words to their corresponding spoken forms, and this process is apparent at the behavioral level as well as at the neurobiological level (Preston et al., Reference Preston, Molfese, Frost, Mencl, Fulbright, Hoeft and Pugh2016). For skilled adult readers, the neural networks activated during reading show substantial overlap with the neural networks activated during spoken language, and for child readers, the brain undergoes changes to their visual and (oral) language systems (Chyl et al., Reference Chyl, Kossowski, Dębska, Łuniewska, Banaszkiewicz, Żelechowska and Pugh2018). Thus, learning to read is not simply a visual–orthographic task, but actually involves the synthesis of speech and print. Preston et al. (Reference Preston, Molfese, Frost, Mencl, Fulbright, Hoeft and Pugh2016) state that “print-speech convergence is the operative construct in developing a fluent reading system” (p. 80). Poor cross-modal integration may contribute to reading difficulties, and the extent of this coactivation may vary systematically according to the individual’s reading skill (Shankweiler et al., Reference Shankweiler, Mencl, Braze, Tabor, Pugh and Fulbright2008). More specifically, Chyl et al. (Reference Chyl, Kossowski, Dębska, Łuniewska, Banaszkiewicz, Żelechowska and Pugh2018) found that coactivation for print and speech was present only in children who are readers, not prereaders, and that greater convergence was associated with increased reading skill. Finally, Taft (Reference Taft2011) presented conflicting evidence as to whether orthography is activated in a similar manner during the processing of real words versus nonwords.
The second theory that is relevant to orthographic interference is the phonological restructuring hypothesis. In comparison to words that are spelled with inconsistent, or relatively opaque, spellings, words that are spelled with greater transparency develop better and more fine-grained phonological representations at the level of the brain. This creates qualitative differences between the phonological representations of transparent and opaque words (Perre, Pattamadilok, Mondant, & Ziegler, Reference Perre, Pattamadilok, Montant and Ziegler2009). Learning to read and spell means that orthography has changed, or “contaminated,” the nature of a word’s phonological representations (Perre et al., Reference Perre, Pattamadilok, Montant and Ziegler2009). Children who are beginning to read and to learn the sound–symbol mappings experience this phenomenon. Nation and Hulme (Reference Nation and Hulme2011) describe that “the act of learning to read an alphabetic language helps to bring about the creation of segmental phonological representations which, in turn, directly facilitate nonword repetition” (p. 655), a finding that influenced the development of our nonword task in the current study, as will be described below. In addition, Castro-Caldas, Petersson, Reis, Stone-Elander, and Ingvar (Reference Castro-Caldas, Petersson, Reis, Stone-Elander and Ingvar1998) found that learning the written form of language influences the development of oral language. At a neurological level, the acquisition of literacy as either a child or an adult can restructure cortical organization (Dehaene et al., Reference Dehaene, Pegado, Braga, Ventura, Nunes Filho, Jobert and Cohen2010).
Defining this principle also has important clinical implications, as orthographic interference may manifest differently in individuals with oral and/or written communication disorders. However, little empirical evidence exists as to the specific mechanisms through which the orthographic characteristics of words influence their spoken production. The study reported here is a direct continuation of two previous works. Saletta, Goffman, and Brentari (Reference Saletta, Goffman and Brentari2015) investigated the influences of orthography and modality on speech production in adults, and found that speakers’ accuracy increased as a function of modality (i.e., reading the nonwords aloud as opposed to just hearing and repeating them). Saletta, Goffman, and Hogan (Reference Saletta, Goffman and Hogan2016) investigated those same phenomena in adults with varying reading skills and in children with good reading skills. These authors found that the speech of adults with poor reading skills was lower in speech movement stability when reading nonwords presented with an opaque spelling. These two works also confirm that there is a bidirectional relationship between orthography and speech motor output in adults. That is, speech production accuracy and stability in a nonword repetition task varied as a function of the modality and orthographic transparency of the nonword stimuli.
The current study extends these previous works by using the same paradigm to systematically compare children with typical development or children with low reading proficiency. This is an important next step because we are extending our work beyond the observation that orthographic interference exists to investigating how new readers, both good and poor, experience this phenomenon in a way that may differ from that of adults. It is the goal of the current study to investigate the impact of orthographic interference when children are producing speech—a task that does not involve reading, writing, or making active judgments about language. Accomplishing this goal will shed light on the developmental course of the orthographic interference effect; how this factor fits in with other aspects of reading development will be explored below.
Developmental trajectory of reading development
Research regarding the trajectory of reading development for children who are developing reading skills typically focuses on three areas: the specific course of orthographic learning that children generally follow; the ways in which this course may vary depending upon the orthographic depth of the child’s language; and how children’s brains most likely change as they acquire literacy skills. Each of these points will be addressed below.
First, the time course of orthographic learning by young children, known as the self-teaching hypothesis, was described by Share (Reference Share2004). Children with typical development move through several stages en route to becoming proficient readers. They go through a visual/logographic stage, in which they recognize words by their salient graphic characteristics (Masonheimer, Drum, & Ehri, Reference Masonheimer, Drum and Ehri1984). Next, they go through an alphabetic stage, in which they learn the rules of grapheme–phoneme correspondence and that they can use those rules to decode new words (Kamhi & Catts, Reference Kamhi, Catts, Kamhi and Catts2012); for many children, decoding may be laborious at this stage. Decoding skills grow with each successful identification of a given word and as well-specified orthographic representations are formed. Four or fewer exposures to a new spelling are adequate for orthographic learning to occur (Share, Reference Share1999). A child may notice that a grapheme is often associated with a specific sound, and then may begin to rely upon these regularities of phoneme–grapheme correspondence to translate new printed words into speech. Later, the child becomes a proficient reader who is able to automatically identify written words (Ventura et al., Reference Ventura, Morais and Kolinsky2007). The thrust of kindergarten and early elementary reading curricula on “learning to read” and acquiring decoding skills changes to “reading to learn” and focusing on comprehension around Grades 2 or 3 (Chall, Reference Chall1983; Ciancio, Thompson, Schall, Skinner, & Foorman, Reference Ciancio, Thompson, Schall, Skinner and Foorman2015). These studies are relevant to the current work because they illustrate the typical developmental course and confirm that young children’s relationship with orthography goes through many iterations before becoming mature.
Second, languages including Italian, Greek, Spanish, and pointed Hebrew have relatively transparent orthographies, whereas languages including English and Dutch have relatively opaque orthographies (Borgwaldt, Hellwig, & de Groot, Reference Borgwaldt, Hellwig and de Groot2004; Share, Reference Share2004; Ziegler & Goswami, Reference Ziegler and Goswami2005; Zoccolotti et al., Reference Zoccolotti, De Luca, Di Pace, Judica, Orlandi and Spinelli1999). Those transparent languages tend to have more one-to-one grapheme–phoneme correspondences, whereas more opaque languages are less direct and consequently more difficult to decode. Novices to transparent orthographies can decode virtually every new word they encounter, and a critical volume of print exposure facilitates a fundamental change in their sensitivities to orthography (Share, Reference Share2004). In contrast, readers who are literate in relatively opaque orthographies must devote greater attention to word-specific visual/orthographic information, as in the orthographic depth hypothesis (Katz & Frost, Reference Katz, Frost, Frost and Katz1992). Unlike children who are learning to read in a more transparent orthographic system, children who are learning to read in a relatively opaque orthographic system must also devote greater attention to large orthographic units such as digraphs, and rely on whole-word (rather than decoding) strategies (Goswami, Ziegler, Dalton, & Schneider, Reference Goswami, Ziegler, Dalton and Schneider2001; Share, Reference Share2004).
The developmental course described above proceeds differently for children who experience reading and/or language impairments (Saletta, Reference Saletta2015). These individuals are less able to efficiently and successfully perform this reorganization. Consequently, they are less sensitive to changes in orthographic transparency. This may be especially true in languages whose orthographies are relatively transparent (Kamhi & Catts, Reference Kamhi, Catts, Kamhi and Catts2012), which are generally associated with less severe reading difficulties (Serrano & Defior, Reference Serrano and Defior2008). Speakers of languages with more opaque orthographies struggle to access those fine-grained and sublexical components of the language.
Third, changes to literacy skills cause actual changes in the brain. Castro-Caldas and Reis (Reference Castro-Caldas and Reis2003) investigated the neural activation of literate and illiterate individuals while repeating nonwords. Their data indicated that several areas of the brain showed greater activation for the literate group during a nonword repetition task (right frontal operculum/anterior insula, left anterior cingulate, left putamen/pallidum, anterior thalamus/hypothalamus, and pons and medial cerebellum). These authors concluded that acquiring literacy skills during childhood changes the functional organization of the adult brain. In a study using event-related brain potentials, Weber-Fox et al. (Reference Weber-Fox, Spencer, Cuadrado and Smith2003) determined that adults and children performed better (greater accuracy and lower reaction time) in a rhyme judgment task when encountering words that were congruent in their spelling and sound (e.g., “thrown–own” as opposed to “gown–own”). Shankweiler et al. (Reference Shankweiler, Mencl, Braze, Tabor, Pugh and Fulbright2008) examined the impact of literacy skills on young adults’ neural activation when hearing or reading. They discovered that neural integration of speech and print processing varies in concert with reading skill, specifically in the brain’s inferior frontal region, which shows changes as a consequence of restructuring induced by literacy. In addition, they explained that differences in reading skill occurred both when hearing and when reading sentences, not just when reading them, suggesting that these brain changes affect language processing in the phonological system as well. These previous studies relate to the current investigation because they examine the effects of orthography on a deep level of language processing. Specifically, individuals’ literacy skills and their exposure to orthography change language processing in such fundamental ways that they actually bring about changes at the level of the brain. Here, we propose to explore these effects on a different aspect of processing: speech production accuracy and stability.
Orthographic interference differentially impacts readers of various languages and skill levels
Continuing the above discussion about reading development, children with varying degrees of reading proficiency may also experience differential effects of orthographic interference. For example, one view is that only good readers display the positive effects of orthographic neighborhood density (Ziegler & Muneaux, Reference Ziegler and Muneaux2007; Ziegler, Muneaux, & Grainger, Reference Ziegler, Muneaux and Grainger2003). Similarly, the number of orthographic neighbors was found to be associated with speed in lexical decision responses to words presented auditorily, but only in children who were good readers (Ziegler & Muneaux, Reference Ziegler and Muneaux2007). It may be the case that more proficient readers experience disruptive effects of manipulations of modality because their reading is more automatic. That is, they are likely to struggle when that automaticity is compromised or when they experience phonological and orthographic inconsistencies (Bolger, Hornickel, Cone, Burman, & Booth, Reference Bolger, Hornickel, Cone, Burman and Booth2008). Dodd and Gillon (Reference Dodd and Gillon2001) described how even children who are developing speech and language skills typically may experience limited phonological awareness, which may not steadily improve with maturation.
Effects of a given language’s orthographic transparency also differ between readers of different skill levels (Borgwaldt et al., Reference Borgwaldt, Hellwig and de Groot2004; Ziegler & Goswami, Reference Ziegler and Goswami2005; Zoccolotti et al., Reference Zoccolotti, De Luca, Di Pace, Judica, Orlandi and Spinelli1999). Oney and Goldman (Reference Oney and Goldman1984) researched the acquisition of literacy skills across languages with varying degrees of grapheme–phoneme correspondence (Turkish and English). Languages with more regular orthographies (in this case, Turkish as opposed to English) facilitate faster acquisition of decoding skills. In addition, readers of transparent orthographies may depend more on decoding to recognize words as opposed to readers of opaque orthographies, and readers rely to a lesser extent on phonological coding when reading more frequent words (Oney, Peter, & Katz, Reference Oney, Peter and Katz1997). Further comparisons of orthographic systems have focused on alphabetic versus nonalphabetic orthographies, where the former system depends on the readers’ phonological awareness and the latter system represents syllables or morphemes. For example, Hong Kong students (learners of a nonalphabetic first language) demonstrated poorer phonological processing skills than learners of an alphabetic first language (Holm & Dodd, Reference Holm and Dodd1996). Finally, overall, second language learners have more limited exposure to the orthography of their second language than native speakers of that language. This impacts second language learners’ word recognition and reading comprehension (Nassaji, Reference Nassaji2014). Together, these above studies indicate that exposure to alphabetic orthography (in particular, transparent alphabetic orthography) is beneficial for the development of certain language and literacy skills.
The effects of orthographic interference may also be stronger in specific situations, as when the task involves lexical representations (Ventura et al., Reference Ventura, Morais and Kolinsky2007). For example, Alario et al. (Reference Alario, Perre, Castel and Ziegler2007) found that the orthographic interference effect occurs as a mnemonic device to improve memorization in word-pair learning, while other studies have shown that orthography only influences speech production if it is relevant to the task at hand. For instance, Roelofs (Reference Roelefs2006) found that spelling only influences production in reading tasks but not object naming tasks. According to Blythe, Pagan, and Dodd (Reference Blythe, Pagan and Dodd2014), both children and adults are influenced by phonology even in silent reading. This finding lends further support to the concept of the interactivity between phonology and orthography. Next, we will explore some limitations to these paradigms, and will present one possible way to circumvent these difficulties and to extend this concept in important ways.
Speech production indexes implicit learning
The previous investigations of orthographic interference, as described above, have generally shared the limitation that they explore explicit learning, also known as declarative, meta-linguistic, or conscious-level processing. The paradigms used in these studies all require the participant to make mindful decisions, such as detecting rhymes, blending or segmenting phonemes in words, or counting syllables (e.g., Ehri & Wilce, Reference Ehri and Wilce1980; Seidenberg & Tannenhaus, Reference Seidenberg and Tanenhaus1979; Ventura et al., Reference Ventura, Kolinsky, Brito-Mendes and Morais2001). These methods address a relatively surface level of processing, which is not a requirement for successful speaking and that may not be present in illiterate individuals. Furthermore, investigations of implicit learning have generally focused on either psycholinguistics or motor control, but not both (Hickok, Reference Hickok2012).
In contrast, in studies of implicit, procedural, or unintentional processing, language is not available for conscious access (Poldrack, Prabhakaran, Seger, & Gabrieli, Reference Poldrack, Prabhakaran, Seger and Gabrieli1999) and knowledge of procedures rather than the statement of facts is involved (Thomas et al., Reference Thomas, Hunt, Vizueta, Sommer, Durston, Yang and Worden2004). These studies require the participant to produce speech or motor movements only. The quintessential procedural task used with many populations is the serial reaction time task (e.g., Tomblin, Mainela-Arnold, & Zhang, Reference Tomblin, Mainela-Arnold and Zhang2007), which is nonverbal and involves motor execution. Other tasks that involve orthographic processing but do not directly involve reading, such as auditory shadowing tasks (e.g., Rastle et al., Reference Rastle, McCormick, Bayliss and Davis2011) or auditory lexical decision tasks (Dich, Reference Dich2011), may also provide evidence for orthographic interference at a deeper level. These types of tasks circumvent the limitations of purely explicit learning and may have a deeper effect that is apparent only in the individual’s speech production.
Crucial to the argument of the current paper, previous studies have demonstrated that speech production tasks involve both implicit learning and motor performance, and in that way are sensitive to manipulations of task demands such as changes in modality (i.e., whether words are spoken, written, or read aloud) and orthographic transparency in written stimuli. As important, speech production provides access to a level of processing achieved by all competent speakers, not just those who are literate or those who can make meta-linguistic judgments.
Usually, language and motor components of processing have been investigated separately (Hickok, Reference Hickok2012), with a unidirectional movement from the conceptual or language level down to the output or movement level (e.g., Levelt, Roelofs, & Meyer, Reference Levelt, Roelofs and Meyer1999). However, specific elements of speech production can also speak to higher aspects of language processing. For instance, research regarding speech errors (Goldrick, Baker, Murphy, & Baese-Berk, Reference Goldrick, Baker, Murphy and Baese-Berk2011), slips of the tongue that indicate a lexical bias (McMillen, Corley, & Lickley, Reference McMillan, Corley and Lickley2009), and the connection between lexical–semantic and articulatory processing (Heisler, Goffman, & Younger, Reference Heisler, Goffman and Younger2010), all indicate that lexical and phonological levels of processing are related.
Traditionally, researchers using methods to directly measure articulation have examined speech production in two ways. First, measuring segmental accuracy, as for example by calculating percent consonants correct (PCC), defines the precision with which the speaker produces the utterance. Second, measuring speech movement stability, as for example by calculating the spatiotemporal variability index (STI; a measure of the underlying spatial and temporal consistency of repeated utterances), designates the patterning and the degree to which repeated movements converge on a single template (Smith, Johnson, McGillem, & Goffman, Reference Smith, Johnson, McGillem and Goffman2000). Lower STI values are indicative of a smaller deviation from the underlying pattern (i.e., greater stability; Smith, Goffman, Zelaznik, Ying, & McGillem, Reference Smith, Goffman, Zelaznik, Ying and McGillem1995). Previous studies have demonstrated that both PCC and STI can quantify the progression of motor speech development and directly index the influences of syntactic, lexical, phonological, and orthographic characteristics on implicit processing (e.g., Goffman, Gerken, & Lucchesi, Reference Goffman, Gerken and Lucchesi2007; Heisler et al., Reference Heisler, Goffman and Younger2010; McMillan et al., Reference McMillan, Corley and Lickley2009; Saletta et al., Reference Saletta, Goffman and Brentari2015, Reference Saletta, Goffman and Hogan2016; Smith & Goffman, Reference Smith and Goffman1998).
Segmental accuracy and speech motor stability have been traditionally analyzed together, as two intertwined components of speech production. While it has been generally assumed that better segmental or phonemic-level accuracy is associated with higher speech movement stability, these two processes are not inexorably linked. There is evidence of a disassociation between the two (Goffman et al., Reference Goffman, Gerken and Lucchesi2007), most likely due to the fact that segmental accuracy is the manifestation of characteristics in the speaker’s phonological system, while movement stability reflects motor practice and demands on the speech motor system. In the current study, we propose to examine both accuracy and stability over the course of the nonword learning task.
Previous findings: orthography and modality influence adult speakers’ implicit learning
Speech production, which lends itself to analyses of both segmental accuracy and motor stability, can be used to index implicit learning. Traditionally, increased articulatory stability is considered to be indicative of more skillful and efficient processing within the individual, of defining healthy speakers versus clinical populations, and of responding to lower task demands (e.g., Brumbach & Goffman, Reference Brumbach and Goffman2014; Goffman & Smith, Reference Goffman and Smith1999; Green, Moore, Higashikawa, & Steeve, Reference Green, Moore, Higashikawa and Steeve2000; Kleinow & Smith, Reference Kleinow and Smith2000; Nip & Green, Reference Nip and Green2013; Walsh & Smith, Reference Walsh and Smith2011). Our previous works indicated that adults, both typical and low-proficiency readers, demonstrated increased phonetic accuracy when enabled to read, rather than just hear, nonword stimuli (Saletta et al., Reference Saletta, Goffman and Brentari2015, Reference Saletta, Goffman and Hogan2016). Adults with low reading proficiency also demonstrated increased speech movement stability when enabled to read the nonword stimuli in an orthographically transparent spelling, rather than in an orthographically opaque spelling. These findings indicated that in adults, both orthography and modality influence speech production.
Motivation for the study
The studies reviewed above provide a strong motivation for the current study. In summary, in individuals who are literate in an alphabetical orthography, a word’s spelling influences how it is processed (orthographic interference). The orthographic depth of various languages, as well as the skill of the specific reader, differentially impact the ways in which orthographic interference is manifest. Individuals with reading difficulties do not respond consistently to a new word’s orthography. To address these issues, it is important to not only quantify explicit learning (as in much of the previous literature) but also quantify implicit learning. Capturing speech production is one way to measure implicit learning.
Therefore, the purpose of the current study was to expand earlier work, which revealed a bidirectional relationship between orthography and speech motor output in adults. In this relationship, speech production changes in response to manipulations of modality and orthographic transparency in adults who are good or poor readers (Saletta et al., Reference Saletta, Goffman and Brentari2015, Reference Saletta, Goffman and Hogan2016). However, this story is incomplete. In adults, the problem becomes murky, and it is difficult to disentangle which difficulties are due to the actual problem and which are due to years of struggle, environmental factors, and the application of adaptive or maladaptive compensatory strategies. In contrast, children who are just beginning to develop reading skills and are starting to experience difficulties have not yet been influenced by time and experience. If a phenomenon is present in childhood, it is likely a problem that has not yet been clouded due to years of difficulty and experience using flawed strategies. Therefore, our next logical step in this line of research is to investigate how children with varying degrees of reading skill respond to these same manipulations. This will enable us to determine what effects are due to a developmental, or (relatively) pure experience, as opposed to effects that are due to a lifetime of experiencing difficulties in language or literacy. It is this question that we explore in the current study, using a paradigm that was identical to that used in previous work with adults. Taking this next step by examining this question in children is a crucial means toward a more complete understanding of orthographic interference and other phenomena associated with skilled or less-skilled reading.
Questions and hypotheses
We had two main objectives in this experiment. First, we investigated whether children with typical development of reading skills (TD) and those with low proficiency reading skills (LP) differed in their responses to manipulations of modality and orthographic transparency. We predicted that the TD group would experience a greater facilitative effect of modality and orthographic transparency than the LP group. We predicted this because previous findings indicate that better readers experience more powerful facilitative effects of orthographic interference than poor readers (Ziegler & Muneaux, Reference Ziegler and Muneaux2007; Ziegler et al., Reference Ziegler, Muneaux and Grainger2003).
Second, we inquired whether earlier findings (Saletta et al., Reference Saletta, Goffman and Brentari2015, Reference Saletta, Goffman and Hogan2016) with adults would be connected with children who present with good or poor reading skills. Adults experienced changes to their speech production when exposed to the written form of nonwords. We hypothesized that our task would be more difficult for children in that they would experience less of a facilitative effect of the written modality and the transparent spelling, but would exhibit a developmental trajectory similar to those of adults. Specifically, we predicted that children would show gains in both accuracy and stability after reading aloud (rather than hearing and repeating) and when exposed to transparent (rather than opaque) orthography. This hypothesis was based on evidence explained above, including the self-teaching hypothesis, in which rapid orthographic learning in children occurs after relatively few exposures to a target spelling, and the strong influence of orthography in their spoken word recognition system (Share, Reference Share2004; Ventura et al., Reference Ventura, Morais and Kolinsky2007). We therefore predict that changes in speech production will occur in the course of the experiment. We also expected that our measures of segmental accuracy and motor stability would be associated with one another in children, as in previous studies of children (e.g., Saletta, Goffman, Ward, & Oleson, Reference Saletta, Goffman, Ward and Oleson2018), which indicate that these two variables may be correlated under certain linguistic contexts including high task demands.
Method
Participants
Approval for this study was granted by the University of Iowa Institutional Review Board. Two groups of children were compared. These included 17 children in the TD group (8 females, 9 males), who ranged in age from 6.00 to 8.83 years old (M = 7.45, SD = 0.91), and 17 children in the LP group (9 females, 8 males), who ranged in age from 7.25 to 9.83 (M = 8.71, SD = 0.86). This number was chosen based on prior works (Saletta et al., Reference Saletta, Goffman and Brentari2015, Reference Saletta, Goffman and Hogan2016), in which this group size was sufficient to confirm a statistically significant effect. The children in the TD group were drawn from a prior study of orthography and speech production (Saletta et al., Reference Saletta, Goffman and Hogan2016). All children were native English speakers, had normal or corrected-to-normal vision per parent report, had no history of neurological disease per parent report, demonstrated age-appropriate nonverbal reasoning skills, and passed a hearing screening. For the TD group, parents reported no history of speech, language, or reading problems. For the LP group, parents reported a positive history of dyslexia or other reading difficulties.
Summary of assessment battery
Behavioral testing consisted of four assessments. Reading was assessed via the Woodcock Reading Mastery Tests—Revised /Normative Update (WRMT-R/NU; Woodcock, Reference Woodcock2011). This assessment battery is an individual assessment of basic reading skills and comprehension in order to diagnose reading difficulties and provide a foundation for remediating reading difficulties. Its subtests include word identification, word attack, word comprehension (antonyms, synonyms, and analogies), and passage comprehension. Reading was also assessed by the Test of Word Reading Efficiency—Second Edition (Torgesen, Wagner, & Rashotte, Reference Torgesen, Wagner and Rashotte2011). This test includes two subtests: sight word reading and decoding, which are used to measure the reader’s ability to accurately and fluently pronounce printed words and phonemically regular nonwords. The Clinical Evaluation of Language Fundamentals—Fourth Edition (Semel, Wiig, & Secord, Reference Semel, Wiig and Secord2003) was administered. This omnibus language measure assesses semantic and grammatical knowledge via subtests including concepts and following directions, word structure, recalling sentences, and formulating sentences. Nonverbal reasoning was assessed via the Test of Nonverbal Intelligence—Fourth Edition (Brown, Sherbenou, & Johnsen, Reference Brown, Sherbenou and Johnsen2010). This is a language-free test that quantifies aptitude, abstract reasoning, and problem solving by requiring the examinee to point to the item in the given field that correctly completes a particular pattern.
Children were classified as demonstrating low reading skills if their parents reported a history of difficulties characteristic of developmental dyslexia or other reading difficulties, and if they achieved less than a standard score of 85 on one or more subtests of the WRMT-R/NU or the Test of Word Reading Efficiency—Second Edition.
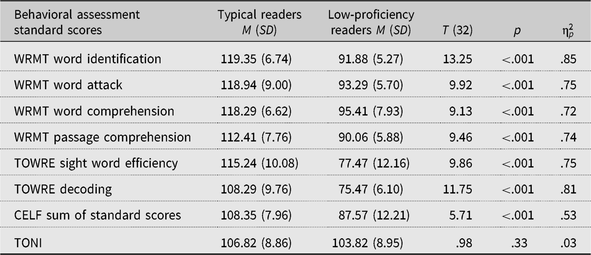
Results of the standardized assessments indicated that the two groups differed in all tests that quantified language or reading, all ps < .001. The two groups performed similarly on the nonverbal reasoning test, t (32) = 0.98, p = .33. This indicates that our participants were appropriately matched, and also shows that children in the LP group demonstrated language difficulties beyond just reading skills. In addition, overall, the TD group demonstrated above average performance on the reading testing. These results are summarized in Table 1.
Performance on standardized behavioral tests

Note: WRMT, Woodcock Reading Mastery Tests. TOWRE, Test of Word Reading Efficiency. CELF, Clinical Evaluation of Language Fundamentals. TONI, Test of Nonverbal Intelligence.
Data collection
Instrumentation
We obtained high-quality audio and video recordings in order to code segmental accuracy. Simultaneous three-dimensional speech kinematic data were collected at 250 samples per second using a three-camera Optotrak Certus movement capture system (Northern Digital, Inc., Waterloo, ON, Canada). Three 6-mm infrared light emitting diodes (IREDs) were attached to each child’s upper lip, lower lip, and a lightweight splint attached at the midline of the jaw with hypoallergenic medical adhesive. Five additional IREDs were attached to the face to create a three-dimensional head coordinate system to allow head motion artifact to be subtracted, based on the procedure of Smith et al. (Reference Smith, Johnson, McGillem and Goffman2000). A time-locked acoustic signal was also collected at 16,000 samples per second to verify that movement records aligned with the child’s speech production.
Procedures and session structure
Each child participated in two sessions, each of which lasted approximately from 75 to 90 min, including behavioral testing and the collection of the speech movement data. Breaks, such as playing a board game or coloring a picture, were interspersed across the experiment in order to reduce participant fatigue and inattention.
The task used was identical to the task described in Saletta et al. (Reference Saletta, Goffman and Brentari2015) and Saletta et al. (Reference Saletta, Goffman and Hogan2016). Children heard or read and then produced nonwords assigned to pictures of a unique character that was described as an “imaginary alien” (Ohala, Reference Ohala1996). Children were introduced to the task and then instructed that they would either listen to or read each alien’s name and then insert its name in the sentence “Bob saw a (insert name) before.” It was necessary to include this carrier sentence in order to increase linguistic complexity (beyond repetition of a single word), and it was necessary to include a majority of labial consonants to ensure sequences of lip and jaw closing and opening movements.
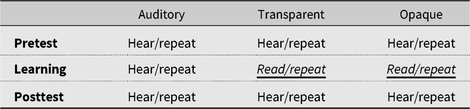
There were three experimental conditions, each associated with a single presentation: auditory, transparent orthography, or opaque orthography. Each condition contained 2 target nonwords and 10 fillers that were similar to the target nonwords and that were not analyzed, but that were present in order to increase the task difficulty. Each condition was subdivided into three phases: pretest, learning, and posttest. Two different target words were each presented 10 times (quasi-randomly and nonsequentially) in the pretest and posttest phases of each condition. These target words were interspersed with 10 different fillers, each presented once in the pretest and posttest phases of each condition. The use of 10 repetitions was based on work by Smith et al. (Reference Smith, Johnson, McGillem and Goffman2000), which indicates that between 5 and 10 repetitions are necessary to calculate the STI. Three counterbalancing schemes were employed to control for the order of conditions and which target nonwords were presented within each condition. See Table 2 for a representation of session structure.
Structure of each session

During the pretest phase, participants heard each word and then repeated it in the carrier sentence. During the learning phase, participants either heard each word and repeated it aloud in the carrier sentence (in the auditory condition) or saw each word in writing and read it aloud in the carrier sentence (in the transparent and opaque orthography conditions). The written stimuli disappeared after 2 s, to ensure comparability to the transience of the auditory stimuli. The posttest phase exactly mirrored the pretest phase. This arrangement enabled us to determine whether contact with orthography facilitated speech accuracy and stability over and above motor practice. Although the key manipulation occurred in the learning phase, the most important phase was actually the posttest phase. By analyzing the posttest phase in comparison to the pretest phase (i.e., after the orthographic representations had been removed), we were able to determine whether past exposure to orthography was integrated into participants’ representations of the nonword in a way that influenced speech production.
Target stimuli
Each target nonword was bisyllabic, trochaic, and followed a consonant–vowel–consonant–consonant–vowel–consonant (CVCCVC) pattern, in which the first and third consonants were either labial or labio-dental to facilitate kinematic analysis. The first syllable in each target nonword was controlled for positional and biphone probabilities (online Speech and Hearing Lab Neighborhood Database of Washington University in St. Louis, Retrieved from https://web.archive.org/web/20160102181352/http://neighborhoodsearch.wustl.edu/neighborhood/Home.asp [original page no longer available]; Vitevitch, Luce, Charles-Luce, & Kemmerer, Reference Vitevitch, Luce, Charles-Luce and Kemmerer1997). The second syllable in each target nonword was based on a real English homophone pair with the first segment altered. For instance, the homophone pair “strait/straight” was altered to become the nonword /pet/, and was paired with the high-probability nonsense syllable /fis/ to become the target nonword /fispet/. One item of the homophone pair (in this case, the nonword corresponding to “strait”) was spelled in a way that was associated with a greater number of orthographic neighbors and was thus considered a relatively transparent representation. In contrast, the other item of the homophone pair (in this case, the nonword corresponding to “straight”) was spelled in a way that was associated with a fewer number of orthographic neighbors and was therefore considered a relatively opaque representation. Thus, if this nonword was presented in the transparent orthography condition, it was spelled “feespait,” whereas if it was presented in the opaque orthography condition, it was spelled “feespaight.” Each nonword was paired with a unique illustration of an imaginary alien (Ohala, Reference Ohala1996). The six nonwords are all equally similar to real words, because they are all based on a real homophone pair with one grapheme/phoneme couple changed. See Appendix A for a list of all target nonwords and their characteristics.
The filler items were created using the high-probability syllables in Vitevitch et al. (Reference Vitevitch, Luce, Charles-Luce and Kemmerer1997), and included the following nonwords: /tʃɅn, sɅʃ, Ɵin, lel, wes, rem, hɅspəvet, gestədƷən, kɅkləfis/, and /rigləsep/. The order of administration of the three blocks was counterbalanced across participants.
Data processing
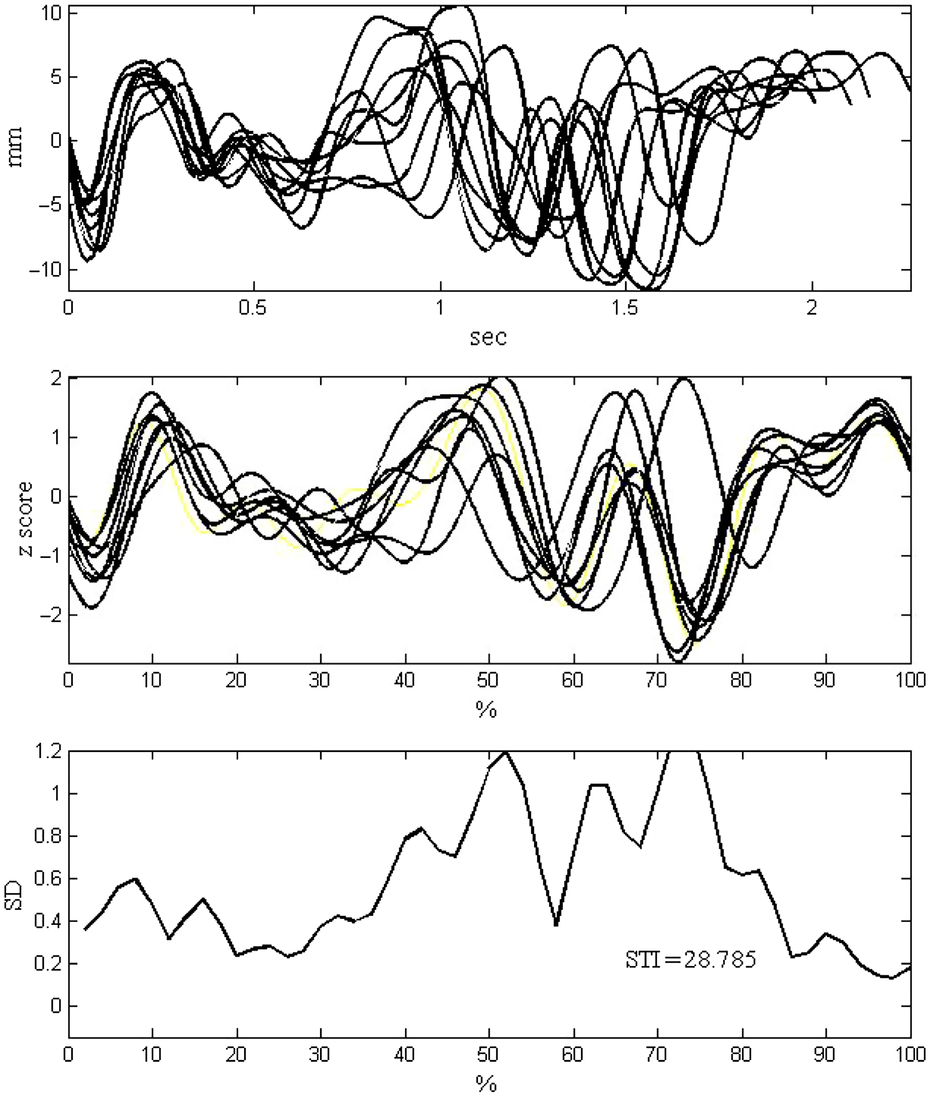
Data were processed in Matlab (The Mathworks, 2009, Natick, MA) by first segmenting each sentence out of the movement record and sorting each by condition and phase. This was accomplished by selecting the onsets and offsets of each sentence based on peak velocity of the movements of the lower lip and jaw. The onsets and offsets were chosen by a visual inspection of the displacement record for local minima and then confirmed by an automated algorithm. The five stationary IREDs enabled us to correct for head movement. The data were then low-pass filtered (10 Hz cutoff) and linearly amplitude- and time-normalized to fit each production to the same scale. Time normalization was conducted by setting each record to 1000 points, and then using a spline function to interpolate between points. Amplitude normalization was conducted by setting the mean to 0 and the standard deviation to 1. Next, standard deviations were computed at 2% intervals across each movement record and then summed; this number is the STI. Higher STI values are indicative of greater movement variability (Figure 1; see Smith et al., Reference Smith, Goffman, Zelaznik, Ying and McGillem1995; Smith & Zelaznik, Reference Smith and Zelaznik2004).
Examples of extracted movement sequences from a child producing the utterance “Bob saw a /fɅlvæʃ/ before.” The top panel represents the raw records. The middle panel represents the time- and amplitude-normalized records. The bottom panel represents the standard deviations used to calculate the lip aperture variability index values. (Reprinted from “Orthography and Modality Influence Speech Production in Adults and Children,” by Saletta, M., Goffman, L., & Hogan, T., 2016, Journal of Speech, Language, and Hearing Research, volume 59, page 1428. jslhr.pubs.asha.org. Reprinted with permission).

Measures
Segmental accuracy
High-quality video recordings were viewed, utterances were transcribed, and percent consonants correct (PCC; the proportion of consonants for each nonword produced accurately) was calculated for each target nonword in each phase of each condition. Independent coders re-transcribed 20% of the sessions to establish reliability of phonetic transcription. The coders were in agreement for 92% of the transcribed consonants. In addition, pretest–posttest difference scores were calculated to directly index within-participant change across the experiment.
Speech movement stability
The STI, a measure of movement stability, was calculated for the 10 repetitions of each nonword in each phase of each condition. As with the PCC data, pretest–posttest difference scores were also calculated. (Reliability was not calculated because the STI was determined by a computer algorithm.)
Reading, oral language, and nonverbal reasoning skills
Behavioral assessments were conducted to quantify the children’s reading, oral language, and nonverbal reasoning skills for inclusion in the study, and to see whether these skills predicted reading accuracy and/or reading comprehension.
Statistical analyses
The research questions were answered using separate linear mixed-effects models for speech accuracy and speech stability. Fixed effects in both models were age, group (LP, TD), condition (auditory only, transparent spelling, opaque spelling), and phase (pretest, posttest). A random intercept was included in the models to account for within-subject correlation arising from the within-subjects factors: condition and phase. Interactions between group and phase and phase and condition were included in the model as it was hypothesized that the effect of modality and orthographic transparency would differ between groups and that children would show gains after reading aloud and when exposed to transparent orthography, but not when exposed to opaque orthography. Absolute effect sizes are reported using  $\hat {\rm{\beta }}$ estimates, and relative effect sizes in the style of Cohen’s d are computed following Brysbaert and Stevens (Reference Brysbaert and Stevens2018). The α level was set to .05.
Results
Analytic issues
Approximately 9% of the kinematic data were missing because children did not produce at least five consistent utterances. This occurred when data were excluded due to disfluencies or other interruptions, such as laughing or coughing; substituting a nonlabial consonant for a labial consonant or vice versa; an IRED missing from the cameras’ view; or inconsistent productions of the target utterance. In these instances, we were unable to extract the articulatory trajectories from the speech stream. We did not exclude data due to vowel errors or substitutions of one labial consonant from another. For example, if in one production the participant produced the nonword “munfeek” as “bunfeek,” we did not exclude that production. In addition, we did not analyze the productions obtained during the learning phase; these data were obtained in a manner that was considerably different from the manner in which the pre- and posttest data were obtained (i.e., for the two written conditions, the stimuli were read aloud vs. heard and repeated). Finally, one participant with low reading proficiency refused to wear the IREDs while completing the experimental task; her data are therefore included in the speech accuracy analysis but not the speech movement stability analysis. We counterbalanced the nonwords across conditions. T tests revealed no significant effects of specific nonwords (i.e., one nonword was not associated with a different accuracy or stability from the other target nonword in each condition). Therefore, we collapsed all statistical analyses across the two nonwords in each condition.
Segmental accuracy
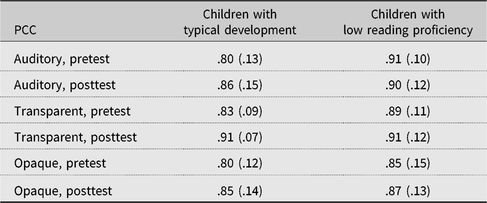
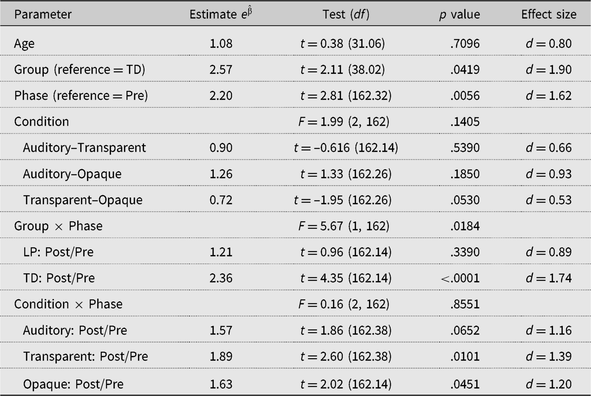
We applied a logit transformation to the PCC data before modeling to better approximate normality. PCC scores of exactly 1 were reduced to 0.99 before applying the transformation. Thus, absolute effect sizes and the numerator of the relative effect sizes are exponentiated for interpretability on the odds scale. PCC descriptive data are found in Table 3. For PCC, the estimated subject variance was 0.8429, while the estimated residual variance was 0.9923. The model had a significant interaction effect between group and phase, F (1, 162) = 5.67, p = .02. There was not a significant interaction between condition and phase, F (1, 162) = 0.16, p = .86. There were significant main effects of group,  ${e^{\hat {\rm{\beta }}}}$ = 2.57, p = .04, d = 1.90, and phase,
 ${e^{\hat {\rm{\beta }}}}$ = 2.20, p = .006, d = 1.62. There was not a statistically significant effect of condition, F (2, 162) = 1.99, p = .14. Age was also not significant,
 ${e^{\hat {\rm{\beta }}}}$ = 1.08, p = .71, d = 0.80. See Table 4 for these mixed-model estimates.
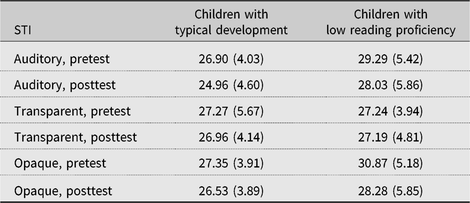
Descriptive variables for percent consonants correct (PCC); mean (standard deviation)

Percent consonants correct (PCC) mixed-model estimates, p values, and effects (pairwise contrasts are indented)

These results indicate that speech accuracy for all children improved, but children with LP and TD improved by different amounts. To analyze the differences in improvement between the groups, pairwise comparisons were used, averaging over condition. The effect of phase was highly significant in the TD group,  ${e^{\hat {\rm{\beta }}}}$ = 2.36, p < .001, d = 1.74, but not significant in the LP group,
 ${e^{\hat {\rm{\beta }}}}$ = 1.21, p = 0.34, d = 0.89. This indicates that children with TD improved, while their peers with LP did not. As the condition–phase interaction was not significant, there is not sufficient evidence that improvement differs by condition.
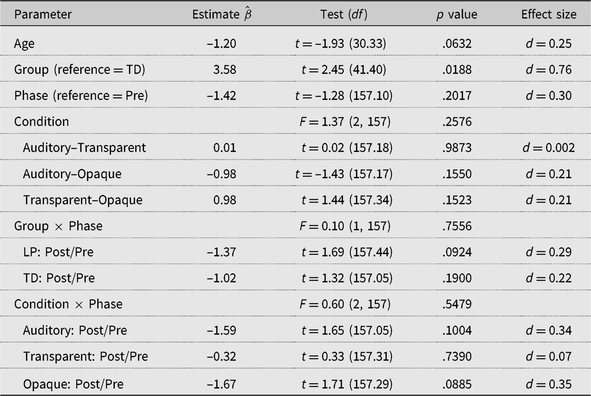
Speech motor stability
STI descriptive data are found in Table 5. For the STI model, the estimated subject variance was 7.179, while the estimated residual variance was 15.336. The STI model results show no significant interaction between group and phase, F (1, 157) = 0.10, p = 0.76, and no interaction effect between condition and phase, F (2, 157) = 0.60, p = .55. There was a significant main effect of group  $\hat {\rm{\beta }}$ = 3.58, p = .02, d = 0.76. There were no significant main effects of phase,
 $\hat {\rm{\beta }}$ = –1.42, p = .20, d = –0.30, condition, F (2, 157), p = .26, or age,
 $\hat {\rm{\beta }}$ = –1.20, p = .06, d = –0.25. This indicates that LP children had STI scores 3.58 units higher than their TD peers, on average. Because the group–phase interaction was not significant, there is not sufficient evidence that the improvement was higher for TD children. In addition, there is not sufficient evidence that the amount of improvement differs by condition. See Table 6 for these mixed-model estimates.
Descriptive variables for the spatiotemporal variability index (STI); mean (standard deviation)

Spatiotemporal variability index (STI) mixed-model estimates, p values, and effects (pairwise contrasts are indented)

Relationships between accuracy, speech motor stability, and reading scores
We used the mixed-model framework to determine whether a relationship existed between reading skill and speech production for participants in our study. We collapsed both groups for this analysis by taking group out of the models. The models still included variables for condition, phase, and a condition–phase interaction. For this analysis, we chose to examine Woodcock Reading Mastery Test (WRMT) scores that employed similar tasks (i.e., reading single words) and yet reflected each of the two different components of the simple view of reading: decoding and comprehension (Hoover & Gough, Reference Hoover and Gough1990). Four separate models were run predicting both PCC and STI using WRMT word comprehension w scores (an equal-interval scale that takes into account both the reader’s ability level and the items’ difficulties; Woodcock, Reference Woodcock2011) and WRMT word attack raw scores separately. PCC was again normalized using the logit transformation.
Neither WRMT word comprehension nor word attack scores were significant in predicting PCC ( $\hat {\rm{\beta }}$ = 1.01, p = .61, d = 0.71; and
 $\hat {\rm{\beta }}$ = 0.99, p = .75, d = 0.70, respectively). However, both WRMT scores were significant in predicting STI (
 $\hat {\rm{\beta }}$ = –0.07, p = .02, d = –0.03; and (
 $\hat {\rm{\beta }}$ = –0.13, p = .04, d = –0.02, for word comprehension and word attack scores, respectively). The slope estimates in both STI models indicate that after adjusting for relationship with condition and phase, an increase in WRMT word comprehension score by 1 decreases STI by 0.07, on average, and an increase in WRMT word attack score by 1 decreases STI by 0.13, on average.
Discussion
We researched whether orthographic interference affects nonword production in children with varying levels of reading skill. In this phenomenon, literate individuals are influenced by a word’s orthography even when performing language tasks that do not actually involve reading or writing. The current study is novel in that we systematically compare the ways in which the modality of presentation of nonword stimuli, and the transparency of their orthographic representations, impact speech production in children with good or poor reading skills. This is important because children experience reading differently from adults, and therefore, understanding the developmental course of orthographic interference has important theoretical and clinical implications. Our main findings and their potential interpretations and limitations are discussed below.
Main findings
The data revealed three main findings. First, for children with typical reading skills and children with poor reading skills, condition did not influence speech accuracy. This was contrary to our hypothesis that the three different conditions (auditory only, transparent orthography, and opaque orthography) would bring about changes in speech production. Furthermore, children with low reading proficiency did not improve in their accuracy with practice or as the result of exposure to orthography. This is in contrast to the children with good reading skills, who did improve with practice over the course of the task. This finding speaks to the crucial role of practice in learning new words, in either spoken or written modalities.
Second, children with high reading proficiency demonstrated overall that they had greater speech movement stability than the children with poor reading proficiency. For both groups, children did not change in speech motor stability in response to either changes in modality or orthographic transparency. These data, along with previous works reviewed above (Saletta et al., Reference Saletta, Goffman and Brentari2015, Reference Saletta, Goffman and Hogan2016), indicate that orthographic interference differentially affects children and adults. For example, Castro-Caldas and Reis (Reference Castro-Caldas and Reis2003) found that acquiring literacy skills during childhood changes the functional organization of the adult brain, and Weber-Fox et al. (Reference Weber-Fox, Spencer, Cuadrado and Smith2003) found that the efficiency of processing in the left hemisphere is less efficient in children than in adults. It is possible that the readers in our two groups of children had not yet experienced this reorganization. This raises the question of whether speech production indexes implicit learning in children in the same way as in adults. That is, did the children in this study simply not learn, or did they learn but not show gains in stability? Clearly, children’s reading skills are still emerging and less automatic than those of adults. This may mean that they are not as vulnerable to being influenced by the new word’s orthographic characteristics. It could also be that our task was too difficult for our clinical group, and that these readers could not easily navigate the written conditions. This is in contrast to our previous work (Saletta et al., Reference Saletta, Goffman and Hogan2016), which suggests that some children with TD are able to complete the task without significant difficulty.
These findings also speak to the dissociation, or differential sensitivity, between segmental accuracy and speech movement stability. These two factors capture different components of processing, and motor learning is not always identical to other aspects of learning (see Goffman et al., Reference Goffman, Gerken and Lucchesi2007; and Saletta et al., Reference Saletta, Goffman, Ward and Oleson2018). As in these previous works, our current data indicate that individuals’ motor performance is independent from their phonemic accuracy. That is, the organization of movement is not dependent upon whether speakers are producing the words or sentences flawlessly, and motor stability does not automatically increase along with segmental accuracy. Rather, a trade-off occurs between the resources speakers devote to segmental accuracy versus movement control. Therefore, one cannot make inferences about motor development based solely on observing segmental accuracy, a conclusion also supported by our data.
Third, WRMT word comprehension and word attack scores predicted speech stability but not accuracy. This relationship is interesting because it supports the concept of the interactivity between reading and speech production. This interactivity may be present to different degrees in individuals with varying reading skills. This concept also speaks to the idea of the differential sensitivity between speech accuracy and stability. This idea demands further and systematic investigation.
Differences in orthographic interference across development versus in maturity
Our previous studies of adults who were good or poor readers (Saletta et al., Reference Saletta, Goffman and Brentari2015, Reference Saletta, Goffman and Hogan2016) inspired the current work. Here, we add the developmental story. It is crucial to study this piece of the question because children’s experience of reading is relatively pure and has not been impacted by years of experience, environmental changes, and use of reading strategies. We must therefore compare previous results regarding adults who are good or poor readers with the current study regarding children who are good or poor readers, who are approaching the task of reading earlier and with a blank slate. These previous studies have indicated that adults produced nonwords more accurately after reading them aloud than after just hearing and repeating them aloud. Moreover, this change occurred even after the reading phase was concluded, when participants were no longer able to read the nonwords. This indicates that adult speakers integrated the nonwords’ orthography into their mental representations, and that there is an interactive relationship between orthographical and phonological knowledge. Unlike adults, who improved in response to the addition of a written cue, the children improved only with practice (in some situations) and not with the addition of orthographic representations. Also unlike adults, in which case the stronger readers consistently outperformed the weaker readers, the children did not always show this trend. Finally, unlike adults, who demonstrated changes in speech movement stability in response to our manipulations, the children did not demonstrate these task-related changes. Neither group of children showed gains in speech movement stability in any of the three conditions.
Thus, children (both those with relatively strong or weak reading development) have reading skills that not only are emerging and less automatic in comparison to their adult counterparts, but also interact with orthography in a way that is quantifiably different. This finding supports the concept that orthographic interference differentially influences speech production in children and adults. This may also be the case because of the phenomena of “learning to read” versus “reading to learn,” in which the reader switches from a primary emphasis on decoding to a primary emphasis on comprehending and acquiring new information. This fundamental shift occurs around third grade, so it probably had not yet occurred for the readers in our study (see Chall’s, Reference Chall1983, stage theory of reading). Another possibility is that the children’s exposure to the orthography was not enough to produce the effect of orthographic interference. This possibility follows the results of Li and Wang (Reference Li and Wang2017), who indicate that long-term exposure to certain orthographic types (in this case, Chinese character knowledge vs. the alphabetic Pinyin system; children’s formal literacy instruction includes instruction in both systems during specific years of their education) influences children’s production. These different views should be explored in future works on this issue.
Taken together, the data from these four groups suggest that orthographic interference is less robust, or does not play as significant a role, in learning to read as opposed to mature reading skills. This raises the question of why this phenomenon becomes important later on. One answer to this question may be that adults have a great deal of automaticity when reading. When this automaticity is compromised by exposure to inconsistencies in orthography, adult readers are susceptible to changes in their reading and/or speech production. More proficient adult readers may experience disruptive effects of orthographic interference, because their reading automaticity is compromised when phonology and orthography are inconsistent. Another answer may be that speech production simply does not index implicit learning in children in the same way as it indexes implicit learning in adults. Children early on in their development of language skills (both spoken and written) are clearly less automatic in their reading and have less influence of environmental factors and years of practice. Consequently, the interaction between reading and speech production may still be in flux. It may be the case that obtaining extra reading experience over the course of many years causes adults (with good or poor reading skills) to experience facilitative effects of exposure to orthography.
Limitations and future directions
The next step in this line of research will be a systematic and longitudinal comparison of children, adolescents, and adults who are good or poor readers. We will need to include a group of adolescents to determine when the switch described above occurs and what factors may be present to explain this change. From a clinical perspective, adolescence may be the key developmental period to target with intensive interventions.
This investigation should also be broadened by examining children with other types of language difficulties or those who experience speech- or limb-motor impairments. This will enable us to determine the specific contributions of oral language skills and motor skills to the implicit learning that is the subject of this investigation. Furthermore, we should also examine aspects of reading other than pure decoding. This may include analyses of participants’ reading comprehension, awareness of text macrostructure, and use of context cues. In some ways, these factors are more representative of successful reading then simple decoding.
Another remaining problem is the issue of why, anecdotally, the reading component of the task seemed relatively easy for some participants (for both the TD and LP groups) and relatively difficult for others (for both the TD and LP groups). That is, some children particularly struggled during the reading phases, while others seemed to gain confidence and accuracy by being exposed to the orthography. This implies that individual readers are using different strategies, some of which are more effective than others. One way to explore this issue is to quantify each reader’s type-token ratio (TTR) in the learning phases of the experiment. The TTR is a measure that is traditionally used to quantify lexical diversity in spontaneous language samples. In the case of the current study, greater diversity of errors within the learning phases may indicate that participants experienced greater difficulty with the task. Therefore, changes for the better in TTR would indicate that individuals improved (i.e., became less variable in their productions) as a consequence of exposure to the nonwords’ orthography; the reverse is also true.
In addition, it is important to expand this study by looking at bilingual or monolingual native speakers and/or readers of languages with varying degrees of orthographic depth. We can then determine whether or not children learning transparent orthographies can decode every word they encounter, and whether or not children learning opaque orthographies need to use a whole-word rather than a decoding strategy when learning to read.
Finally, this study is theoretical in nature. Future works should examine the clinical applications of this paradigm. It is crucial to identify problems in reading as early as possible. There is a need to develop therapeutic paradigms that emphasize that children’s needs regarding intervention are not entirely comparable to adults’ needs. Therefore, it is necessary to design interventions that more directly target the specific patterns produced by individual readers, and to understand the best ways of teaching new words.
Conclusions
The current study furthers our understanding of the developmental effects of orthographic interference, the influences (or lack thereof) of modality and orthography on implicit learning in children, and the disassociation between segmental accuracy and motor stability. It is innovative to systematically explore the relationship between orthographic interference and speech production in children who are good or poor readers. This work represents an important step in designing methods of identification and intervention for children who experience reading difficulties.
Supplementary material
To view supplementary material for this article, please visit https://doi.org/10.1017/S0142716419000055.
Acknowledgments
This project was supported by University of Iowa departmental (Communication Sciences and Disorders) funds. The author would like to thank Hope Gerlach, Jacob Oleson, Naomi H. Rodgers, and Caitlin E. Ward for their help with multiple components of this project. The content is solely the responsibility of the author and does not necessarily represent the official views of the University of Iowa.
Appendix A Characteristics of target nonwords