Introduction
Genomic imprinting causes genes to be expressed in a parent-of-origin-specific manner. In such a situation, the phenotypic effects of a gene are determined by whether the gene is inherited from the mother or the father (Smit et al., Reference Smit, Segers, Carrascosa, Shay, Baraldi, Gyapay, Snowder, Georges, Cockett and Charlier2003). Imprinted genes are expressed lower than the copy from the other parent. Silencing of one parental allele may be complete or, in the case of partial imprinting, there may be some remaining activity. Partial imprinting results in phenotypic differences between heterozygotes (Spencer, Reference Spencer2002) and hence produce more variation compared with complete imprinting. The biochemical background of this phenomenon is still not fully understood, but differential methylation of specific DNA regions seems to be a key component (Essl and Voith, Reference Essl and Voith2002). Imprinted genes which show parent-of-origin expression manner have been detected in mammals, plants and insects (Ferguson-Smith, Reference Ferguson-Smith2011). The most famous imprinted genes in livestock are the callipyge mutation in sheep (Smit et al., Reference Smit, Segers, Carrascosa, Shay, Baraldi, Gyapay, Snowder, Georges, Cockett and Charlier2003) and the IGF2 gene in pigs (Jeon et al., Reference Jeon, Carlborg, Tornsten, Giuffra, Amarger, Chardon, Andersson-Eklund, Andersson, Hansson, Lundstrom and Andersson1999). In livestock, for the first time, de Vries et al. (Reference de Vries, Kerr, Tier, Long and Meuwissen1994) studied the contribution of parent-of-origin effects to carcass and growth traits in pigs. They reported that about, respectively, 5 and 4% of phenotypic variation in backfat thickness and growth rate were caused by imprinting effects. In recent years, by developing suitable computer software such as WOMBAT (Meyer, Reference Meyer2020), estimating imprinting effects in livestock has attracted lots of attention. By considering imprinting from both parents, the importance of imprinting effects on performance traits of pigs, beef cattle, sheep and chicken has been studied by Neugebauer et al. (Reference Neugebauer, Luther and Reinsch2010), Meyer and Tier (Reference Meyer and Tier2012), Amiri Roudbar et al. (Reference Amiri Roudbar, Mohammadabadi, Mehrgardi and Abdollahi-Arpanahi2017) and Karami et al. (Reference Karami, Zerehdaran, Javadmanesh and Shariati2019), respectively.
Baluchi breed is the most populous sheep in Iran and is raised in large parts of the northeastern regions of the country. Baluchi is also raised in Pakistan and Afghanistan (Rahman et al., Reference Rahman, Rehman, Akhtar, Jan, Qureshi and Rahman2013). According to published statistics, this breed constitutes 12% of the total population of sheep in Iran (Bahreini-Behzadi et al., Reference Bahreini-Behzadi, Aslaminejad, Sharifi and Simianer2014). This breed has a high resistance to heat stresses and food shortages, and under favourable environmental conditions, a twining rate up to 25% has been observed in this breed. Although, the Baluchi breed has an excellent ability to produce meat, the wool of this breed, with its unique elegance and quality, is suitable for use in various spinning and carpet weaving industries (Saedi, Reference Saedi2016). Makuie is a medium-sized breed of sheep in Iran with fat tail, and white colour. It is raised in the east and west Azerbaijan provinces in the northwest of the country. Also, there is a variety of Makuie sheep in Turkey called White Karaman. This breed is reared mainly for meat production; nonetheless, their wool and milk are also important for rural families (Abbasi and Ghafouri-Kesbi, Reference Abbasi and Ghafouri-Kesbi2011).
According to the geneimprint website (https://www.geneimprint.com), there are 17 maternal and 14 paternal imprinted genes in sheep, of which some genes have been shown that affect growth and reproduction traits (Davis et al., Reference Davis, Dodds, Wheeler and Jay2001; Tellam et al., Reference Tellam, Cockett, Vuocolo and Bidwell2012). Despite this, little effort has been made to quantify imprinting effects on the growth traits of sheep (Amiri Roudbar et al., Reference Amiri Roudbar, Mohammadabadi, Mehrgardi and Abdollahi-Arpanahi2017, Reference Amiri Roudbar, Abdollahi-Arpanahi, Ayatollahi Mehrgardi, Mohammadabadi, Taheri Yeganeh and Rosa2018). In addition, for efficiency-related traits such as the Kleiber ratio (Kleiber, Reference Kleiber1947), there are no previous reports regarding imprinting effects. Moreover, correlations between traits due to imprinting effects in livestock have not been estimated. Therefore, this study was conducted to investigate maternal and paternal imprinting effects on growth-related traits and Kleiber ratio in Makuie and Baluchi sheep breeds. The results will not only give us an insight into the effect of parental imprinting on the economic traits of sheep, but also provide useful information about the effect of data size and data structure on the estimation of parental imprinting effects.
Materials and methods
Data
Data collected at Baluchi sheep breeding station (Khorasan Razavi province) and Makuie sheep breeding station (West Azerbaijan province) was used in this study. The management of the two flocks was almost similar. Flocks were managed under a semi-migratory system. In both flocks, ewes mated for the first time at about 18 months of age in late summer and early autumn. Lambing started in mid-February and lasted until March. The suckling period lasted on average 90 days. In the spring and summer months, the lambs were grazed on natural pasture, and in the autumn and winter months, they are kept indoors and manually fed. At two stations, body weights were recorded at three-month intervals at birth, weaning, 6, 9 and 12 months. Pedigree information, which includes the animal ID, parents ID, as well as information such as lamb sex, type of birth and date of birth was also recorded.
Traits evaluated
Data included body weights at birth (BW), weaning (WW) and six months of age (W6). To account for the differences among animals with different ages, WW and W6 were adjusted to standard 90 and 180 days of age, respectively. The increases in body weight from birth to weaning and from weaning to 6 months of age were used for calculating growth rate (GRa and GRb) by dividing total gain by the number of days in the period. The estimates of GRa and GRb were then used to calculate corresponding Kleiber ratios (Kleiber, Reference Kleiber1947) as KRa = GRa/WW0.75 and KRb = GRb/W60.75.
Statistical analyses
The GLM procedure (SAS, 2004) was run to determine known environmental factors or fixed effects. The effects of the year of birth (25 classes in Baluchi and 10 classes in Makuie), sex of lamb (2 classes; male and female), type of birth (3 classes; single, twin and triplet) and age of dam at lambing (7 classes; 2–8 years old) were significant (P < 0.05) for all traits studied and, therefore, were included in the final model.
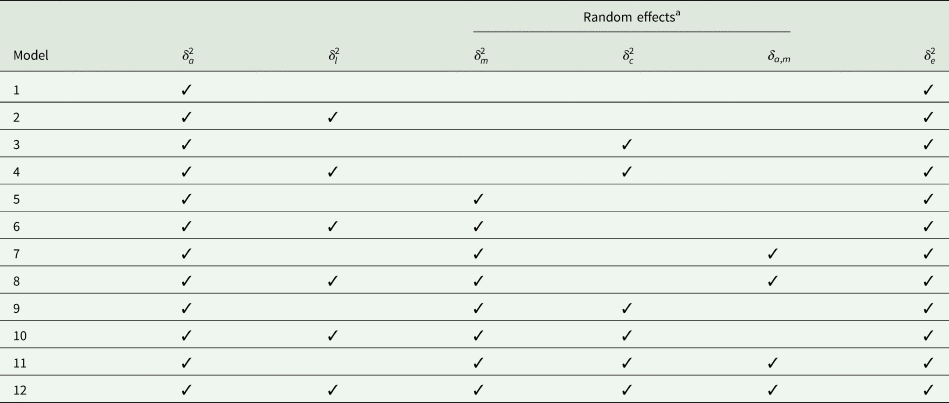
Estimation of variance components and genetic parameters was done in a two-step procedure. In the first step, each trait was analysed with a series of 12 univariate animal models, including various combinations of direct additive genetic, maternal additive genetic, maternal permanent environmental and maternal common environmental effects (Table 1). Model 1, which included only random animal effect, was the simplest. On contrary, Model 12, which was the complete animal model, included direct and maternal additive genetic effects, maternal permanent environmental effect, maternal common environmental effect and direct-maternal genetic covariance. The general representation of Model 12 was as follows:

where y is the vector of observations. β is the vector of fixed effects fitted with design matrix X. Z1 is the incidence matrix for direct additive genetic effects. Z2, Z3 and Z4 are incidence matrices relating observations to maternal permanent environmental, maternal additive genetic and maternal common environmental effects, respectively. The (co)variance matrix for the random effects was as follow:

where a, c, m, l and e, are vectors for direct additive genetic, maternal permanent environmental, maternal additive genetic, maternal common environmental and residual effects, respectively. $\delta _{\rm a}^2$ , $\delta _{\rm c}^2$
 , $\delta _{\rm m}^2$
 , $\delta _{\rm l}^2$
 and $\delta _{\rm e}^2$
 are direct additive genetic, maternal permanent environmental, maternal additive genetic, maternal common environmental and residual variances, respectively.δ am is the covariance between direct and maternal additive genetic effects. A is the numerator relationship matrix, and Ic, Il and, Ie are identity matrices of appropriate dimensions. To estimate (co)variance components and genetic parameters, the WOMBAT program (Meyer, Reference Meyer2020) was used. The information criterion of Akaike (AIC) (Reference Akaike1974) was computed to rank the models according to their power to fit the data. Let p denotes the number of random (co)variance parameters to be estimated, and Log L is the maximum likelihood, then the information criterion is defined as AIC = −2 Log L + 2p. The model yielding the smallest AIC fits the data best.
The random (co)variance components fitted in the twelve models

a $\delta _a^2$ , direct additive genetic variance; $\delta _l^2$
 , maternal common environmental variance; $\delta _m^2$
 , maternal genetic variance; $\delta _c^2$
 , maternal permanent environmental variance; δ a,m, direct-maternal genetic covariance; $\delta _e^2$
 , residual variance.
In the second step, three models were considered for fitting imprinting effects. Imprinting effects were added to the best model selected in the previous step by the AIC (hereinafter referred to as Model I). Models 13 and 14 were the same as Model I but allowed either a single maternally or a single paternally imprinted effect, respectively. In Model 15, both maternally and paternally imprinted effects were jointly fitted. The three models used to estimate imprinting effects were:


where I indicate the selected fixed and random effects from the first step; Z5 and Z6 are the design matrices relating observations to the maternally and paternally imprinted effects, respectively, and gm and gp are vectors of maternally and paternally imprinted effects, respectively. The (co)variance structure of the random effects for the full model (Model 15) was as follows:

where gm and gp are vectors of maternally and paternally imprinted effects, respectively, assuming gm ~ N(0, ${\bf G}\delta _{{\rm gm}}^2$ ) and gp ~ N(0, ${\bf G}\delta _{{\rm gp}}^2$
 ) in which G is the gametic relationship matrix and $\delta _{{\rm gm}}^2$
 and $\delta _{{\rm gp}}^2$
 are maternal and paternal imprinting variances, respectively. The inverse of the gametic relationship matrix (G−1) was used as supplied covariance matrix in the model with imprinting effects. The matrix G was calculated according to Tier and Meyer (Reference Tier and Meyer2012) algorithm. The diagonal elements of gametic relationship matrix (gii) were equal to 1, and the off-diagonal elements (gij) calculated through the following formula:

where m and p are the maternal and paternal gametes of gamete j, respectively (Meyer and Tier, Reference Meyer and Tier2012).
Genetic correlations between traits were obtained through bivariate analyses. Only traits that were affected by maternally or paternally imprinting effects included in the bivariate analyses. The models applied in the bivariate analyses were those selected as the best model for each of the underlying traits in the univariate analyses. The matrix notation for the complete bivariate model can be shown as follow:

where y1 and y2 denote traits 1 and 2, respectively.
Results
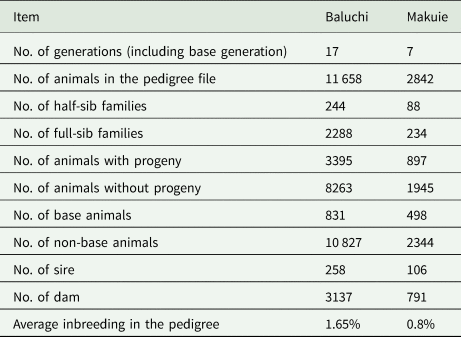
The pedigree structure of Baluchi and Makuie sheep is shown in Table 2. The pedigree of Baluchi sheep included 11 658 animals distributed over 17 generations. Animals were the progenies of 258 sires and 3137 dams. In Makuie sheep, 2842 animals, progenies of 106 sires and 791 dams were present in the pedigree.
Pedigree structure of the Baluchi and Makuie sheep

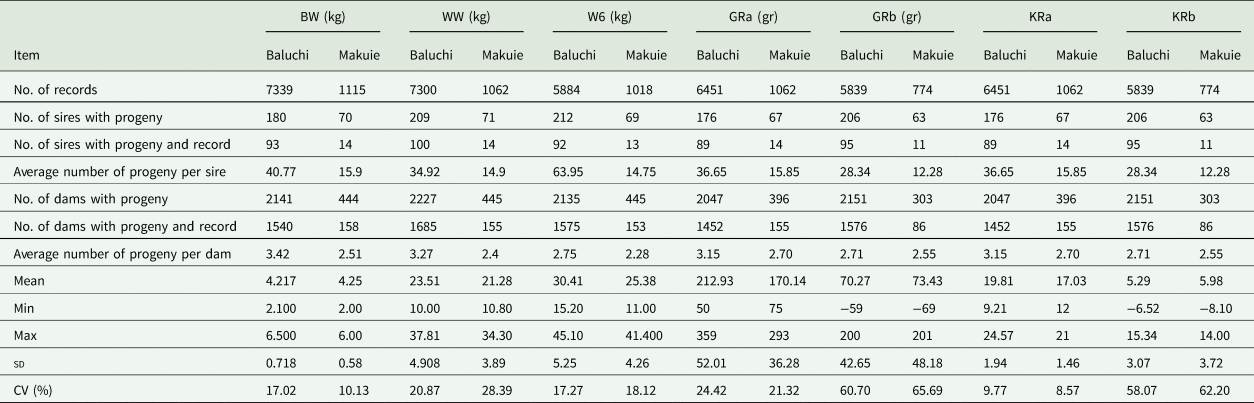
The characteristics of the data used are shown in Table 3. In both breeds, body weight of lambs increased from birth to six months of age, with a significantly higher growth rate in the pre-weaning growth phase. Likewise, estimates of pre- and post-weaning KR showed that lambs utilized feed more efficiently in the pre-weaning growth phase. In both Baluchi and Makuie breeds, estimates of the coefficient of variations (CV) revealed that KRa and GRb were, respectively, the least and most variable traits.
Characteristics of the data structure in Baluchi and Makouie sheepa
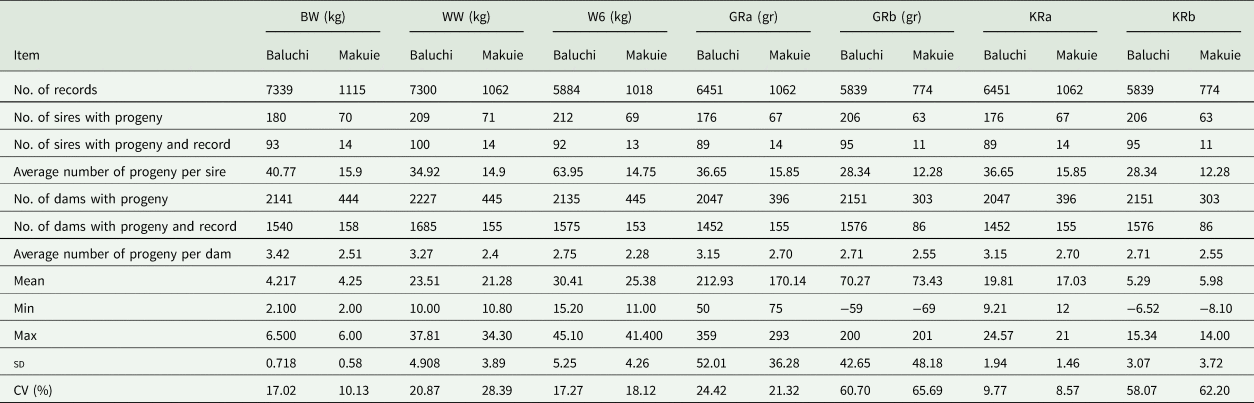
a BW, birth weight; WW, weaning weight; W6, 6 months weight; GRa, growth rate from birth to weaning; GRb, growth rate from weaning to 6 months of age; KRa, Kleiber ratio at weaning; KRb, Kleiber ratio at six months of age; sd, standard deviation; CV, coefficient of variation.
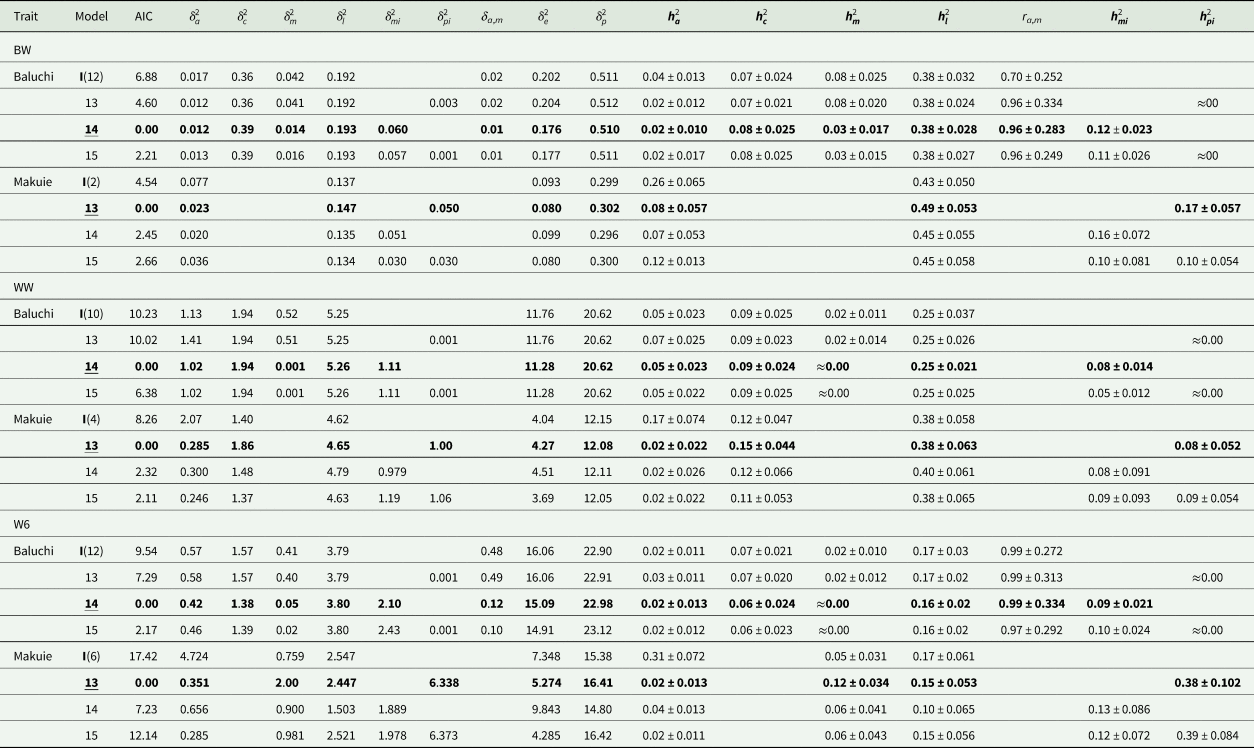
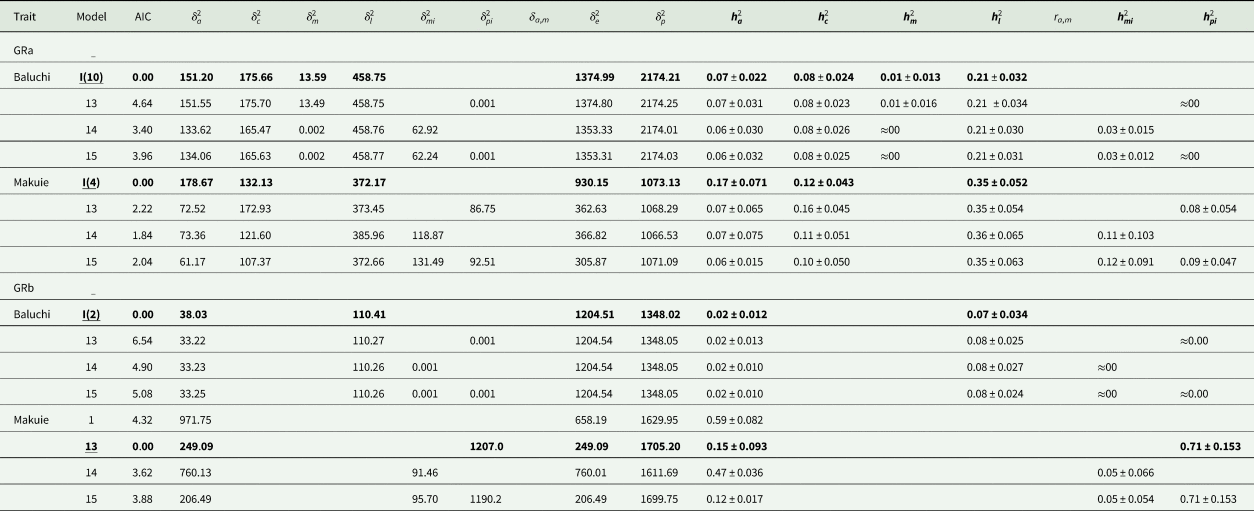
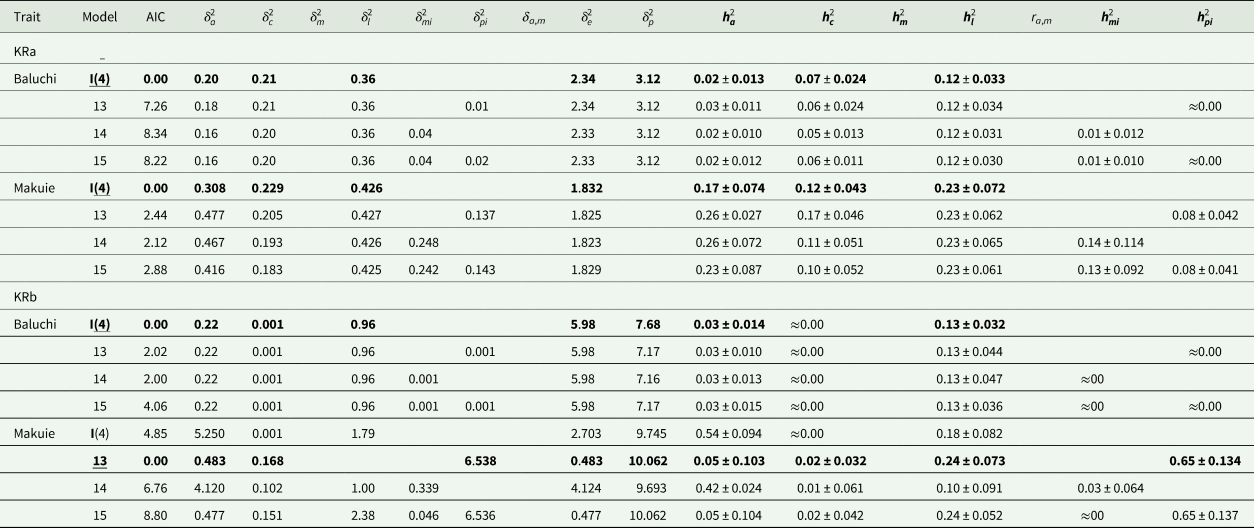
Estimates of variance components and genetic parameters from univariate animal models for studied traits are presented in Tables 4 to 6.
Estimates of variance components and genetic parameters from uni-variate models for body weight traits (final best model in bold)a
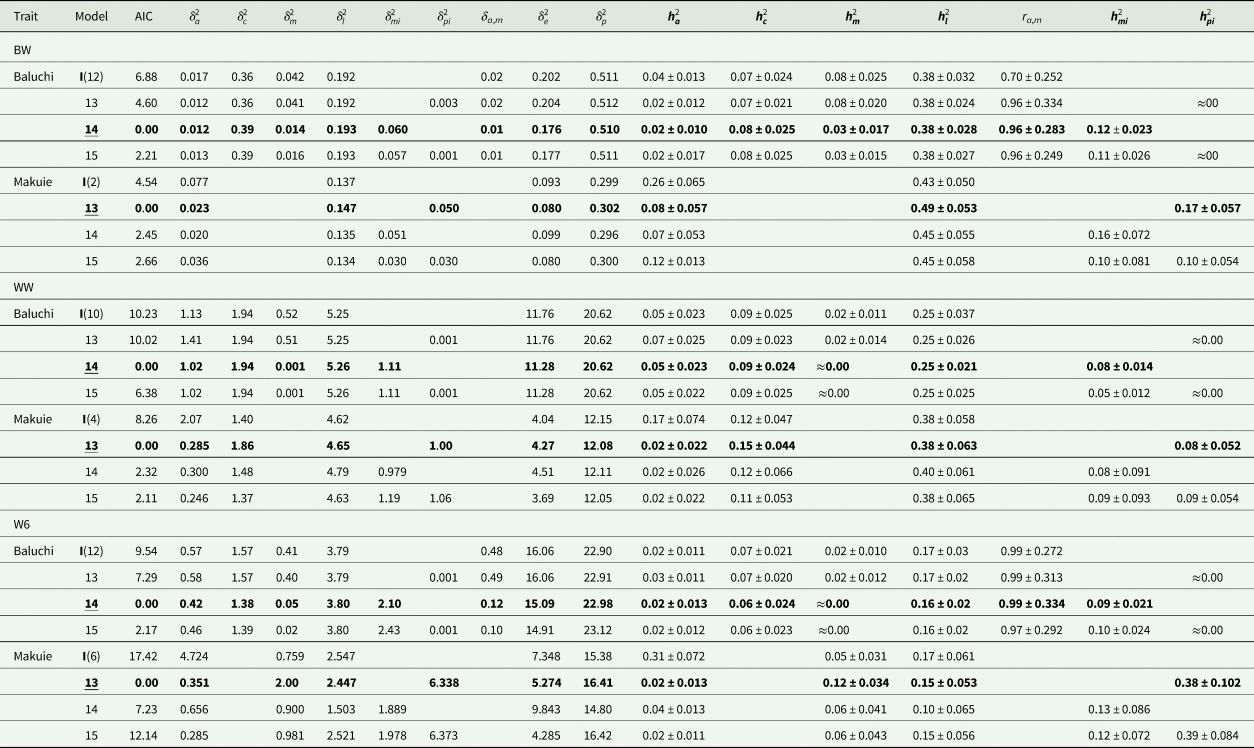
a $\delta _a^2$ , additive genetic variance; $\delta _c^2$
 , maternal permanent environmental variance; $\delta _m^2$
 , maternal genetic variance; $\delta _l^2$
 , maternal common environmental variance; $\sigma _{mi}^2$
 , maternal imprinting variance; $\sigma _{pi}^2$
 , paternal imprinting variance; δ a,m, direct-maternal genetic covariance; $\delta _e^2$
 , residual variance; $\delta _p^2$
 , phenotypic variance; ${\boldsymbol h}_{\boldsymbol a}^2$
 , direct heritability; ${\boldsymbol h}_{\boldsymbol m}^2$
 , maternal heritability; ${\boldsymbol h}_{\boldsymbol c}^2$
 , maternal permanent environmental effect; ${\boldsymbol h}_{\boldsymbol l}^2$
 , maternal common environmental effect; ${\boldsymbol h}_{{\boldsymbol mi}}^2$
 , maternal imprinting heritability; ${\boldsymbol h}_{{\boldsymbol pi}}^2$
 , paternal imprinting heritability; BW, birth weight; WW, weaning weight; W6, 6 months weight; AIC are presented as differences from the model with the least AIC criterion; I, best model selected for each trait in step one.
Estimates of variance components and genetic parameters from uni-variate models for growth rate (final best model in bold)1a
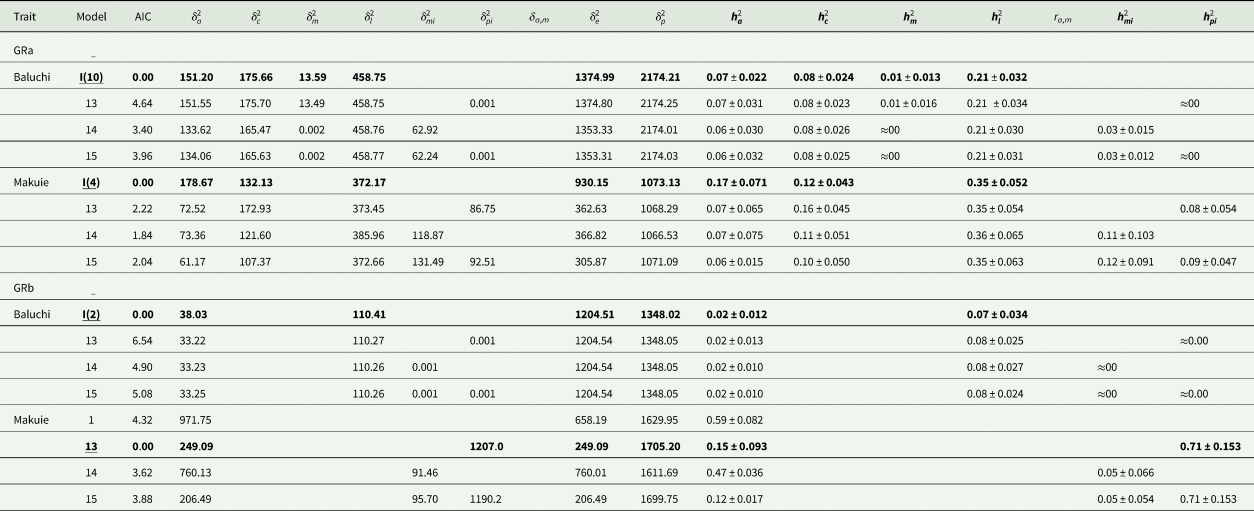
a $\delta _a^2$ , additive genetic variance; $\delta _c^2$
 , maternal permanent environmental variance; $\delta _m^2$
 , maternal genetic variance; $\delta _l^2$
 , maternal common environmental variance; $\sigma _{mi}^2$
 , maternal imprinting variance; $\sigma _{pi}^2$
 , paternal imprinting variance; δ a,m, direct-maternal genetic covariance; ${\boldsymbol \delta }_{\boldsymbol e}^2$
 , residual variance; ${\boldsymbol \delta }_{\boldsymbol p}^2$
 , phenotypic variance; ${\boldsymbol h}_{\boldsymbol a}^2$
 , direct heritability; ${\boldsymbol h}_{\boldsymbol m}^2$
 , maternal heritability; ${\boldsymbol h}_{\boldsymbol c}^2$
 , maternal permanent environmental effect; ${\boldsymbol h}_{\boldsymbol l}^2$
 , maternal common environmental effect; ${\boldsymbol h}_{{\boldsymbol mi}}^2$
 , maternal imprinting heritability; ${\boldsymbol h}_{{\boldsymbol pi}}^2$
 , paternal imprinting heritability; GRa, growth rate from birth to weaning; GRb, growth rate from weaning to 6 months of age; AIC are presented as differences from the model with the least AIC criterion; I, best model selected for each trait in step one.
Estimates of variance components and genetic parameters from uni-variate models for Kleiber ratio (final best model in bold)a

a $\delta _a^2$ , additive genetic variance; $\delta _c^2$
 , maternal permanent environmental variance; $\delta _m^2$
 , maternal genetic variance; $\delta _l^2$
 , maternal common environmental variance; $\sigma _{mi}^2$
 , maternal imprinting variance; $\sigma _{pi}^2$
 , paternal imprinting variance; δ a,m, direct-maternal genetic covariance; $\delta _e^2$
 , residual variance; $\delta _p^2$
 , phenotypic variance; ${\boldsymbol h}_{\boldsymbol a}^2$
 , direct heritability; ${\boldsymbol h}_{\boldsymbol m}^2$
 , maternal heritability; ${\boldsymbol h}_{\boldsymbol c}^2$
 , maternal permanent environmental effect; ${\boldsymbol h}_{\boldsymbol l}^2$
 , maternal common environmental effect; ${\boldsymbol h}_{{\boldsymbol mi}}^2$
 , maternal imprinting heritability; ${\boldsymbol h}_{{\boldsymbol pi}}^2$
 , paternal imprinting heritability; KRa, Kleiber ratio at weaning; KRb, Kleiber ratio at six months of age; AIC are presented as differences from the model with the least AIC criterion; I, best model selected for each trait in step one.
In the Baluchi breed, in the first step, for BW, WW, W6, GRa, GRb, KRa and KRb, models 12, 10, 12, 10, 2, 4 and 4 were selected as the best model (Model I). In step two, for BW, WW and W6, adding maternally imprinting effect to the best model already selected in step one, improved the overall property of the model and resulted in a decrease in AIC values. Therefore, model 14 was selected as the final best model for BW, WW and W6. For these traits, adding paternally imprinting effect to the model did not decrease AIC values. For GRa, GRb, KRa and KRb, in step one, models 10, 2, 4 and 4 were selected as the best model, respectively. In step two, including maternally or paternally imprinting effects, neither alone nor together, did not decrease AIC values anymore. Therefore, for these traits, models 10, 2, 4 and 4 were selected as the final best model. Estimates of direct heritability (${\boldsymbol h}_{\boldsymbol a}^2$ ) were lower than 0.1 for all traits studied. All the traits were influenced by maternal effects, with maternal common environmental effect as the most important component. Adding maternal imprinting effect to the Model I resulted in a noticeable decrease in direct and maternal additive genetic variances in such a way that for BW, WW and W6, direct additive genetic variance decreased by 29, 10 and 26%, respectively. At the same time, estimates of maternal additive genetic variance were reduced drastically (69, 99 and 88% decrease for BW, WW and W6, respectively). Estimates of maternal imprinting heritability (${\boldsymbol h}_{{\boldsymbol mi}}^2$
 ) were 0.12 ± 0.02, 0.08 ± 0.01 and 0.09 ± 0.02 for BW, WW and W6, respectively. The contribution of the paternal imprinting effect to phenotypic variance (${\boldsymbol h}_{{\boldsymbol pi}}^2$
 ) was almost zero for all traits studied.
In the Makuie breed, in the first step, according to the AIC criterion, for BW, WW, W6, GRa, GRb, KRa and KRb, models 2, 4, 6, 4, 1, 4 and 4 were selected as the best model (Model I). Contrary to Baluchi sheep, in the Makuie breed, traits were affected by paternally imprinting effects in a way that, in step two, for BW, WW, W6, GRb and KRb, adding this component to the best models already selected in step one (Model I), followed with a decrease in AIC values and, therefore, model 13 which included paternal imprinting effect was selected as the final best model for these traits. Additive genetic variance for BW, WW, W6, GRb and KRb decreased significantly by 70, 88, 93, 74 and 90% when the paternal imprinting effect was added to the Model I. Estimates of paternal imprinting heritability (${\boldsymbol h}_{{\boldsymbol pi}}^2$ ) for BW, WW, W6, GRb and KRb were 0.17 ± 0.05, 0.08 ± 0.05, 0.38 ± 0.10, 0.71 ± 0.15 and 0.65 ± 0.13, respectively. Estimates of direct heritability (${\boldsymbol h}_{\boldsymbol a}^2$
 ) ranged between 0.02 ± 0.02 (WW and W6) to 0.17 ± 0.07 (GRa and KRa). Similar to the Baluchi breed, all studied traits were controlled by maternal effects, with maternal common environmental component as the most important effect.
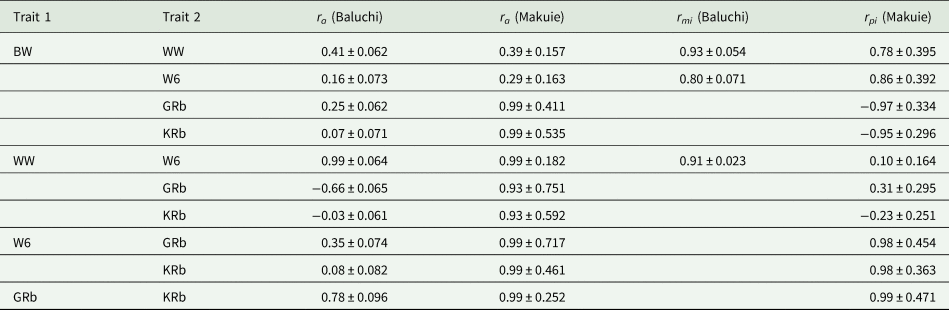
Imprinting correlations between traits are listed in Table 7. In the Baluchi breed, maternal imprinting correlations (rmi) were 0.93 ± 0.05 between BW and WW, 0.80 ± 0.07 between BW and W6 and 0.99 ± 0.02 between WW and W6. In Makuie breed, estimates of paternal imprinting correlations (rpi) ranged from −0.97 ± 0.33 (BW-GRb) to 0.99 ± 0.47 (GRb-KRb).
Correlations between traits yielded from bi-variate analysesa
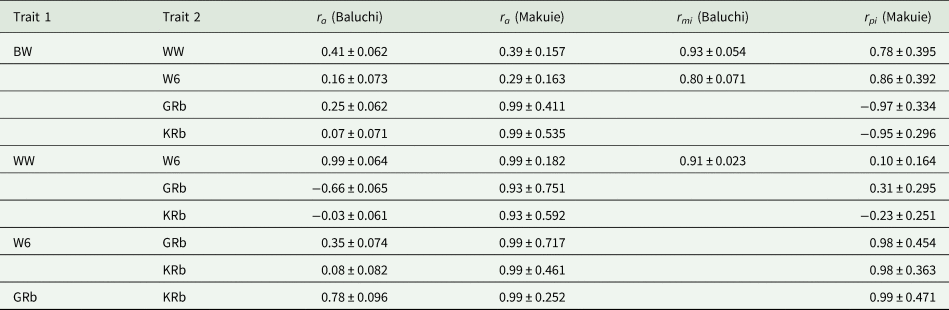
a Correlations between traits which influenced by imprinting effects are presented. ra, direct additive genetic correlation; rmi, maternal imprinting correlation; rpi, paternal imprinting correlation.
Discussion
In mammals, many imprinted genes have been shown to directly or indirectly affect individual development and growth (Hager et al., Reference Hager, Cheverud and Wolf2008). Our study showed that, especially for growth traits of sheep, imprinting effects are important sources of phenotypic variation. Amiri Roudbar et al. (Reference Amiri Roudbar, Mohammadabadi, Mehrgardi and Abdollahi-Arpanahi2017), who worked on Iran-Black sheep, reported estimates of maternal imprinting heritability for weaning weight and 6 months weight as 0.22 and 0.21, respectively. In addition, in Lori-Bakhtiari sheep, Amiri Roudbar et al. (Reference Amiri Roudbar, Abdollahi-Arpanahi, Ayatollahi Mehrgardi, Mohammadabadi, Taheri Yeganeh and Rosa2018) estimated maternal imprinting heritability for birth weight, weaning weight, 9 months weight and pre- and post-weaning growth rates as 0.23, 0.10, 0.13, 0.16 and 0.05, respectively. The difference between estimates of imprinting effects in different breeds of sheep could be because of the different genetic structures of the populations, the amount of data used and the model fitted. In other species, such as beef cattle, the significant contribution of imprinting effects to growth traits has been reported. In Australian beef cattle, for example, the relative proportion of maternal and paternal imprinting effects to phenotypic variance were 0.00 and 5%, 11 and 7%, 7 and 0.00% and 8 and 1% for birth weight, weaning weight, yearling and final weight, respectively (Meyer and Tier, Reference Meyer and Tier2012). For the Kleiber ratio, there are no previous reports regarding the estimation of maternal or paternal imprinting heritability which makes comparison difficult. Although, in mammals only about 1% of genes are subjected to imprinting, these genes affect a wide variety of traits. For example, studies in mice have shown the contribution of imprinted genes to variation in body weight, muscle traits, metabolism and disease susceptibility (O'Doherty et al., Reference O'Doherty, MacHugh, Spillane and Magee2015). Therefore, as a quantitative trait, efficiency-related traits such as the Kleiber ratio are expected to be affected by imprinted genes.
Comparing two breeds, the effect of data size on the estimation of genetic parameters was revealed. As seen in the Makuie breed, estimates had higher standard errors (SE), which shows the lower reliability of the estimates. In animal models, SE is an indicator of data size, data structure and deep and quality of pedigree used. For example, considering BW, while in the Baluchi breed, the data size was significantly larger and the percentage of dams and sires with the record were, respectively, 72 and 52%; in the Makuie breed, besides smaller data size, only 35 and 20% of dams and sires had record, respectively. In addition, the average number of progeny per dam and sire in the Makuie breed was 39 and 73% of those observed in Baluchi breed. The low proportion of recorded dams and sires, as well as fewer numbers of progeny per dam and sire, negatively affect the precision of estimates which reflect in genetic parameters with high SE. Large estimates of SEs indicate that estimated model parameters should be treated with caution. For traits measured after weaning, especially GRb and KRb, estimated values of paternal imprinting heritability were very high and seemed unusual (0.71 ± 0.15 and 0.65 ± 0.13, respectively), indicating that there may be a problem in disentangling the paternal imprinting effect from autosomal additive effects. For these traits, not only the number of records was smaller than other traits (774 records), but also only 28% of dams and 17% of sires had record. Beside number of records and percentage of recorded dams and sires, average number of progeny per dam and sire is also important and if it is low, causes the incidence matrices of direct, maternal and paternal components become very similar (Gerstmayr, Reference Gerstmayr1991). In such a situation, the types of (co)variances between relatives available in the data do not have sufficiently different expectations to allow all components of phenotypic variance to be estimated properly (Meyer, Reference Meyer1992). As a result, the ability to statistically separate maternal and paternal imprinting effects from direct additive effects requires sires and dams with multiple offspring of two sexes, presence of a high percentage of recorded sires and dams and presence of a high proportion of half-sib families in the pedigree. Although, REML might give us an ‘answer’ regardless of input data, the occurrence of such estimates with high SE usually represents a stern warning that the data and pedigree structure do not allow to separate the observed variation into its causal components.
An interesting result was that while imprinting effects in Baluchi originated from the maternal side, in Makuie, imprinting effects had a paternal origin. Results of Baluchi sheep were in agreement with Amiri Roudbar et al. (Reference Amiri Roudbar, Abdollahi-Arpanahi, Ayatollahi Mehrgardi, Mohammadabadi, Taheri Yeganeh and Rosa2018). Maternally imprinted genes have important roles in placenta development, whereas paternally imprinted genes have important roles in embryonic tissue development. In Iranian native fowl, significant effects of paternally imprinted effect was detected for body weight at 8 weeks of age and estimated value of ${\boldsymbol h}_{{\boldsymbol pi}}^2$ was 0.04 (Karami et al., Reference Karami, Zerehdaran, Javadmanesh and Shariati2019). Where the effects of maternal and paternal imprinting effects are significant, they can be included in the selection procedure, by considering the breeding values of the maternal and paternal imprinting effects when selecting ewes and sires for the next generation.
Decrease in direct and maternal additive genetic variances as observed here was in agreement with other reports, including Meyer and Tier (Reference Meyer and Tier2012), Tier and Meyer (Reference Tier and Meyer2012) and Amiri Roudbar et al. (Reference Amiri Roudbar, Mohammadabadi, Mehrgardi and Abdollahi-Arpanahi2017). For example, in a study by Amiri Roudbar et al. (Reference Amiri Roudbar, Mohammadabadi, Mehrgardi and Abdollahi-Arpanahi2017), when the maternal imprinting effect was added to the model, estimates of ${\boldsymbol \delta }_{\boldsymbol a}^2$ decreased by 21, 26 and 14% for BW, WW and W6, respectively. As a result, using an animal model which ignores imprinting effects when they are present, results in inflated estimates of the additive genetic variance, as it also includes the imprinting variance of the population. It can result in inaccurate predictions of breeding values and erroneous ranking of top animals. Hager et al. (Reference Hager, Cheverud and Wolf2008) reported that estimates of maternal additive genetic variance would be overestimated if maternal imprinting effect is ignored because maternal genetic effect can mimic maternal imprinting effect. It is confirmed here by a decrease in maternal genetic variance following including maternal imprinting effect in the model. In addition, Tier and Meyer (Reference Tier and Meyer2012) stated that other sources of variation could be partially confounded with imprinting effects. These include cytoplasmic and maternal common environmental effects for the maternal gamete and the possibility of y-chromosomal effects for the paternally inherited gamete. In our study, a maternal common environmental effect was present in all models, and in terms of size, was the most important effect (for all traits, it was larger than the sum of the other effects). For all traits studied, we did not see any decrease in maternal common environmental variance after including maternalimprinting effect in the model. So, this effect should be considered a totally independent effect without any confounding with the maternal imprinting component.
In bivariate analysis, a genetic correlation is the proportion of variance that two traits share due to genetic causes (Falconer and Mackay, Reference Falconer and Mackay1996). In the present study, for the first time, imprinting correlations between body weight traits were estimated. In the Baluchi breed, strong maternal imprinting correlations between body weights at different ages showed that body weight at birth, weaning and 6 months of age share similar genes with maternally imprinted effects. It means that the imprinting effects of genes are not limited to a specific stage of life and can be active in different stages of growth and development. These correlations, besides positive additive genetic correlations, can accelerate correlated response to selection. However, as imprinted genes can express differentially at different stages of development (Spencer, Reference Spencer2002), negative imprinting correlations are also expected. In the Makuie sheep, again the effect of data size on estimates was revealed. High standard errors of direct genetic and paternal imprinting correlations showed that size and structure of data did not support accurate estimates of correlations. In some cases, SE was higher than the estimates of correlations. Gerstmayr (Reference Gerstmayr1991) reported that the estimation of genetic correlations was more sensitive to data size and data structure than the estimation of heritabilities and that a larger sample is required to estimate a genetic correlation with the same accuracy as for heritability. Therefore, correlations in the Makuie breed are meaningless. The mating ratio and numbers of half-sib families have a key role in the accuracy of genetic correlations between traits. Results from aquaculture breeding programmes, such as for Tilapia, show that the commonly used strategy of mating a sire to only two dams, together with the presence of common full-sib family effects, causes very large standard errors, even when 600 half-sib families are used (Bijma and Bastiaansen, Reference Bijma and Bastiaansen2014). In other species, such as sheep, usually a sire mates with more than two ewes; however, to obtain correlations with SE lower than 0.1, more than 200 half-sib families are required in most cases (Bijma and Bastiaansen, Reference Bijma and Bastiaansen2014). The number of half-sib families in Makuie breed (88 families) was below this threshold and, therefore, prevented accurate estimation of additive genetic and imprint correlations between traits.
In conclusion, in Baluchi sheep, maternal imprinting effect had a significant influence on body weighs and, therefore, need to be included in the models of genetic evaluation. Otherwise, the genetic evaluation won't be accurate because of the inflation of additive genetic variance. Strong maternal imprinting correlation was observed between body weights that could accelerate correlated response to selection. In the Makuie breed, the paternal imprinting effect was an important source of variation for body weights, growth rate and Kleiber ratio; however, results emphasized the difficulties in partitioning variance components due to small data size and inappropriate data structure.
Acknowledgements
Valuable comments of two anonymous reviewers on a previous version of this manuscript are gratefully acknowledged. The staff of Makuie Sheep Breeding Station as well as the staff of Baluchi Sheep Breeding Station are gratefully acknowledged for providing us with the data used in the current study.
Author contributions
F. Ghafouri-Kesbi: designed the study, analysed the data and wrote the original draft. M. Mokhtari: contributed to the data analysing and writing the original draft. M. Gholizadeh and M. A. Abbasi: provided the data and contributed to the manuscript editing. M. Amiri Roudbar: contributed to the designing the study.
Financial support
This research received no specific grant from any funding agency, commercial or not-for-profit sectors.
Conflict of interest
The authors declare no conflicts of interest between authors and between authors and other people, institutions or organizations.
Ethical standards
Not applicable.