Introduction
It is often recognized that agricultural systems do not provide adequate resources for natural enemies, mainly for arthropod predators and parasitoids, as a result of the frequent and intense disturbance regimes experienced (e.g. Landis et al., Reference Landis, Wratten and Gurr2000). In this context, habitat management practices, such as manipulation of ground cover vegetation within crop systems, may provide the missing habitat requirements for natural enemies, including: (i) supplementary food resources, that is, alternate hosts, or prey; (ii) complementary food resources, such as pollen, honeydew or nectar; (iii) microclimatic alterations; and (iv) overwintering or aestivation shelters and refuges to overcome major disturbances caused by agricultural practices (Bugg & Pickett, Reference Bugg, Pickett, Pickett and Bugg1998; Jonsson et al., Reference Jonsson, Wratten, Landis and Gurr2008). Such additional resources will enhance the survival and fecundity of natural enemies and, therefore, their efficiency as pest regulators (Landis et al., Reference Landis, Wratten and Gurr2000). Habitat management tactics often consist of increasing plant diversity within-crop, at farm level or at landscape level, thus creating more diverse agro-ecosystems (e.g. Russell, Reference Russell1989; Andow, Reference Andow1991; Bugg & Pickett, Reference Bugg, Pickett, Pickett and Bugg1998; Landis et al., Reference Landis, Wratten and Gurr2000). According to the ‘enemies hypothesis’ (Root, Reference Root1973), increased plant diversity is expected to reduce pest attack through a top-down effect, resulting from an enhancement of the abundance and diversity of natural enemies. Most studies show that lower pest densities are found in more diverse agro-ecosystems (Russell, Reference Russell1989; Andow, Reference Andow1991; Bugg & Pickett, Reference Bugg, Pickett, Pickett and Bugg1998).
In perennial crops, such as fruit orchards, cotton and vineyards, the increase in plant diversity at ground cover level, by allowing resident vegetation to grow or by sowing selected plant species in inter-rows between crop trees, is considered promising regarding the augmentation of natural enemy diversity and abundance (e.g. Bugg & Waddington, Reference Bugg and Waddington1994; Rieux et al., Reference Rieux, Simon and Defrance1999; Landis et al., Reference Landis, Wratten and Gurr2000; Showler & Greenberg, Reference Showler and Greenberg2003). Increasing agro-ecosystem vegetation diversity through habitat management of ground cover vegetation, in order to enhance the biological control of crop pests, is a technique based upon the assumption that natural enemies overwintering or aestivating and exploring food resources in ground cover vegetation will eventually move to adjacent crop plants (Corbett, Reference Corbett, Pickett and Bugg1998). However, few studies provide evidence of ground cover vegetation derived benefits upon the establishment of natural enemies of insect pests within the canopy of orchard trees. Whereas some studies showed that cover cropping favoured beneficial arthropods in tree canopy, as observed in pear orchards by Rieux et al. (Reference Rieux, Simon and Defrance1999), others found that ground cover had little effect upon the density, or type, of arthropods found in tree canopy, as reported by Smith et al. (Reference Smith, Arnold, Eikenbary, Rice, Shiferaw, Cheary and Carroll1996) in pecan orchards. Similarly, in a study conducted in vineyards, Costello & Daane (Reference Costello and Daane1998) found that although ground cover maintenance increased spider species diversity at ground level, it had little significance upon spider species richness, or density, in the vines. Cover cropping in citrus orchards has been practiced in China using Ageratum conyzoides, in order to improve the biological control of the citrus red mite, Panonychus citri, and other plant-feeding mites by enhancing numbers and the effectiveness of several predatory mites. This cover crop has been shown to provide a pollen source, alternative prey and to stabilize temperature and moisture, thus benefiting predatory mites (Olkowski & Zhang, Reference Olkowski, Zhang, Pickett and Bugg1998).
Citrus orchards are one of the most important agro-ecosystems in the Mediterranean region (Davies & Albrigo, Reference Davies and Albrigo1994; Spreen, Reference Spreen2001). Until recently, the application of herbicides and soil tillage constituted the two most common practices used by citrus farmers to control weeds, but cover cropping is presently expanding, as an alternative tactic, aimed at reducing the use of herbicides and promoting soil conservation (Bugg & Waddington, Reference Bugg and Waddington1994; Sainju & Singh, Reference Sainju and Singh1997; Sousa et al., Reference Sousa, Vasconcelos, Moreira, Franco, Franco, Ramos and Moreira2006). However, cover cropping may also be explored as a potential habitat management tactic aimed at enhancing biological control of citrus pests through the manipulation of plant-based resources in the landscape (Bugg & Waddington, Reference Bugg and Waddington1994; Bugg & Picket, Reference Bugg, Pickett, Pickett and Bugg1998; Landis et al., Reference Landis, Wratten and Gurr2000; Fiedler et al., Reference Fiedler, Landis and Wratten2008).
This study aimed at testing the hypothesis that habitat management, through the manipulation of ground cover vegetation in citrus orchards, would enhance the diversity and abundance of natural enemies, within the tree canopy. Three treatments of ground-cover management of inter-rows within lemon orchard were compared: RV, maintenance of the resident vegetation; S, cover cropping by sowing selected species; and BS, bare soil by herbicide application, the most common weed management practice in the study area. Additionally to treatment comparison, temporal patterns of abundance of the arthropod communities were analyzed using principal response curves (PRC) (Van den Brink et al., Reference Van den Brink, Van den Brink and Ter Braak2003).
Material and methods
Study sites
Three orchards, 2–4 ha each, located in the major lemon producing Oeste region of Portugal, near Mafra, were selected for the experiment: Casal Mato de Cima (CMC), Pinhal de Frades (PF) and Carrasqueira de Cima (CC). The orchards were planted respectively in 1997, 1987 and 1994, in drip irrigated sandy soils. The landscapes up to about 200 m surrounding the CMC and CC orchards were diverse and the vegetation consisted of: Arundo donax L., Pittosporum undulatum Vent. and Cupressus lusitanica Mill. windbreaks, other lemon orchards, strawberry plantations, stands of maritime pine, Pinus pinaster L. and Mediterranean shrubs, in the case of CMC; and P. undulatum windbreaks, horticultural and ornamental plantations, maritime pine stands and lemon orchards, in the case of CC. The landscape surrounding the PF orchards was less diverse, being dominated by lemon orchards and maritime pine stands. During this study, a limited number of insecticide treatments were applied each year to control major insect and mite pests in the experimental plots: up to three treatments with lufenuron for the citrus flower moth Prays citri (Millière), which is the key pest in this region; up to one treatment with abamectin+mineral oil against the broad mite, Polyphagotarsonemus latus (Banks). CMC and CC plots were sprayed once in 2002 with mineral oil to control scale insects. Within each experimental plot, subplots pertaining to the three ground-cover management treatments were exposed to identical insecticide sprays.
Treatments
Each orchard was split into three equal-sized subplots of 0.6 ha consisting of six rows of trees each. Each ground-cover management treatment was randomly allocated to one of the three subplots in each orchard. The subplots were separated by at least one inter-row, where ground cover vegetation was controlled by herbicide application.
In March 2002, three ground-cover management treatments were installed in each orchard, in the inter-rows of each subplot, namely: RV, maintenance of resident vegetation; S, installation of a cover cropping by sowing selected species; and BS, bare soil, following the most common practice in the study area, i.e. herbicide application. For treatment S, a plant mixture of Lolium multiflorum Lamarck (5 kg ha−1), L. perenne L. (5 kg ha−1), Medicago polymorpha L. (3 kg ha−1), Trifolium fragiferum L. (3 kg ha−1), T. incarnatum L. (3 kg ha−1) and T. resupinatum L (3 kg ha−1) was selected, taking into account the soil type, floral type and phenology, so as to promote nectar and pollen sources in extended flowering periods. The herbicide diuron (21.5 g l−1)+glyphosate (150 g l−1)+terbutilazine (237.5 g l−1) was applied in the spring and fall to the BS treatment. In treatments RV and S, regular cuts were performed with a rotary mower twice per year, according to vegetation growth, except in PF in 2003, where only one cut was carried out. Before this study began, weed management was achieved by herbicide spraying in all selected orchards except CC, where regular mowing was conducted.
Sampling methods
Arthropods
Samples of beneficial arthropods, namely spiders (Aranaea) and insect predators, including pirate bugs (Hemiptera: Anthocoridae), plant bugs (Hemiptera: Miridae), coccinelids (Coleoptera: Coccinellidae), green lacewings (Neuroptera: Chrysopidae) and hymenopteran parasitoids (Hymenoptera: Parasitica), were collected from lemon trees using two sampling techniques, beating and suction.
Twenty-five trees per treatment and orchard were sampled monthly, from July 2002 to December 2003, by beating. Arthropods were collected in funnel trays 80 cm in height with a rectangular opening (45×64 cm). The funnel tapered to an 8 cm threaded exit with a metal handle into which a vial was attached to receive the dislodged arthropods. The tray was held under two randomly selected branches, ca. 1.20 m above soil level, from the southwest side of the tree canopy. Each branch was struck three times with a rubber-coated rod. Each sample consisted of the sum of all specimens collected from the 25 trees (sampling units) randomly selected per treatment (subplot) and orchard (plot).
Suction samples were obtained monthly, from March to September 2003, using a ‘Vortis’ (Burkard Manufacturing Co. Ltd, UK) suction sampler (Arnold, Reference Arnold1994). Each sampling unit consisted of suctioning the tree foliage of three different canopy sections of a lemon tree (corresponding to an area of ca. 50 cm2 each), during four seconds per location, with an 8 cm diameter flexible tube (estimated airflow=34.8 m s−1), following a protocol optimized in a previous experiment (Rodrigues et al., Reference Rodrigues, Baptista, Passarinho, Grade, Silva and Franco2003). Each sample consisted of the sum of all specimens collected from ten trees (sampling units) randomly selected per treatment (subplot) and orchard (plot).
The arthropods collected were separated from plant material in the laboratory and kept in 70% ethyl alcohol for later identification and counting under a stereomicroscope. Parasitoid wasps include all identified Hymenoptera Parasitica, i.e. non-aculeate apocrite Hymenoptera (Gauld & Bolton, Reference Gauld and Bolton1988). All predators were identified to family level, except spiders and coccinelids, which were identified to genera and species level, respectively.
Spider identifications were based on Barrientos (Reference Barrientos2003) and Roberts (Reference Roberts1995). Coccinelids were identified according to Raimundo & Alves (Reference Raimundo and Alves1986). For the two previous taxa, identifications were confirmed by Pedro Cardoso (University of Lisbon) and Armando Raimundo (University of Évora), respectively.
Flora
Ground cover composition, plant density and dry weight biomass were determined every three months by sampling a surface of four squares of 0.25 m2 each, per treatment and orchard, from February 2002 to December 2003.
Statistical analysis
Arthropod abundance and plant biomass are presented as means±standard error of the mean. Generalized estimating equations (GEE) procedure, type III mean squares, was used to analyze arthropod abundance response variable, in relation to the predictor variables: ground-cover management treatment, sampling date and site. Sampling date was selected as the within subjects variable for analysis of repeated measures.
Separate models were applied to each sampling technique (beating and suction) and to each of the most representative groups of natural enemies: spiders, lady birds, green lacewings and parasitoids. A normal distribution, using the log link function, was used for the dependent variable; whereas, for green lacewings, the best fit was achieved with a Poisson distribution. Pairwise comparisons of estimated marginal means based on the dependent variable were used to estimate significant differences between treatments. No interaction terms were estimated with GEE models due to model convergence instability. The models were fitted using SPSS 15.0 for Windows (SPSS Inc. Chicago, IL, USA). The GEE extends generalized models by providing support for non-independent data, such as repeated measures (Hardin & Hilbe, Reference Hardin and Hilbe2003).
For spiders and coccinelids, richness (S) and Shannon index H (Magurran, Reference Magurran1988) were calculated, based on the numbers of individuals, respectively, at the genera and species level, for the whole experimental period. Differences on mean species/genera richness and on plant biomass (g m−2) between treatments were tested using ANOVA, type III. Data on plant biomass were logarithmic transformed to homogenise variances.
For spider and coccinelid communities, similarities among the three treatments were analysed by nonmetric dimensional scaling (NMDS) using packages Mass and Vegan of R 2.7.1 software for Windows (The R Foundation for Statistic Computing, Boston, MA, USA), after log(x+1) transformation of the number of individuals. Distances between treatments were estimated by using Bray-Curtis dissimilarity index (Bray & Curtis, Reference Bray and Curtis1957), and significance was tested by multi-response permutation procedure for within- versus among-group dissimilarities (Oksanen, Reference Oksanen2008).
PRC were used to study the effect of RV and S treatments upon temporal patterns of the arthropod communities in comparison with BS (CANOCO 4.5 for Windows software). The PRC approach constitutes a multivariate method, based on redundancy analyses, which describes changes in community response over time, in relation to a control (Van den Brink et al., Reference Van den Brink, Van den Brink and Ter Braak2003). The principal component is plotted against time, giving a PRC of the community for each treatment. A quantitative interpretation of the effects at species level is allowed by scoring the species weight, accounting for the deviances (Van den Brink et al., Reference Van den Brink, Van den Brink and Ter Braak2003). The model was fitted with log-transformed values. PRC were performed for each sampling method (i.e. beating and suction) considering abundance of: (i) all arthropods sampled, at family/order level; (ii) coccinelids at species level; and (iii) spiders at genera level. Monte Carlo permutations tests (Van den Brink et al., Reference Van den Brink, Van den Brink and Ter Braak2003) were performed to test the significance of the first axis; t-values of regression coefficients were used to test the significance of the PRC deviations for each sampling date.
Results
Abundance and diversity of beneficial arthropod
In total, 7799 specimens of beneficial arthropods were collected from the canopy of lemon trees, including 4720 spiders, 2082 parasitoid wasps, 593 coccinelids, 276 green lacewings, 114 pirate bugs and 13 plant bugs. Spiders dominated the beating samples, comprising 70% of all arthropods collected, followed by wasp parasitoids (19%); whereas this last group dominated the suction samples (53%) followed by spiders (33%).
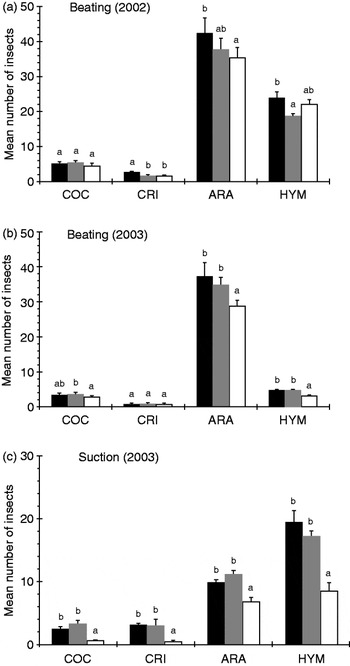
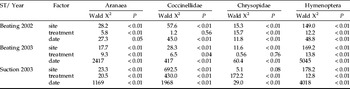
In 2003, significant differences among treatments were detected in both beating and suction samples, for almost all taxonomic groups (table 1). In general, treatments S and RV showed significantly higher arthropod abundance than BS (fig. 1), with the exception of green lacewings in beating samples, for which no significant differences among treatments was found. Furthermore, lacewings were captured in very small numbers (fig. 1). For the beating samples collected in 2002, treatment S captured significantly higher numbers of spiders and green lacewings in comparison to both treatments RV and BS, and in comparison with RV treatment, regarding wasp parasitoids (fig. 1).
Mean number (±SE) of beneficial arthropods (Ara, Aranaea; Coc, Coccinellidae; Cri, Chrysopidae; Hym, Hymenoptera Parasitica) collected in tree canopy, in lemon orchards, in Mafra (Portugal) from July 2002 to December 2003 by the beating sampling technique (a and b) and from March to September 2003 by suction (c). Three treatments of ground-cover management were installed in 2002: S, sowing selected plant species; RV, maintenance of resident vegetation; and BS, bare soil by herbicide application. Within each group, bars capped with the same letter are not significantly different (P=0.05), based on pairwise comparisons of estimated marginal means (▪, S;  , RV; □, BS).

Generalized estimation equation results for the effect of site (df=2), ground cover treatment (df=2) and sampling date (df=3, 8 and 6, for beating 2002, beating 2003 and suction 2003, respectively) in function of the sampling technique (ST), considering as dependent variable the abundance of arthropods. Date was selected as the within-subject variable.

Significant differences between dates and sites were observed in all cases (table 1). In general, PF and CC orchards showed significantly higher captures than CMC, while differences among treatments were higher in PF.
For both spiders and coccinelids, values of total species richness S, and mean Shannon index H were similar for all treatments (table 2). Also, mean species richness did not differ significantly between treatments both for spiders (F2,6=1.47, P=0.303; F2,6=0.36, P=0.712, suction and beating samples, respectively) and coccinelids (F2,6=3.00, P=0.125; F2,6=0.75, P=0.512, suction and beating samples, respectively).
Overall richness (S) and Shannon index H for Aranaea (genera) and Coccinellidae (species) captured by suction and beating, in 2002 and 2003, in plots of lemon orchards in Mafra (Portugal) exposed to three treatments of ground-cover management: S, sowed selected plant species; RV, resident vegetation; BS, bare soil by herbicide application.

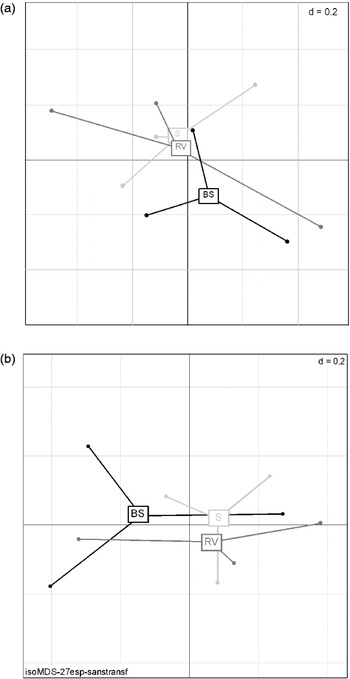
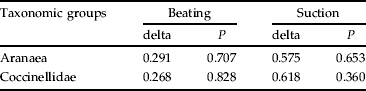
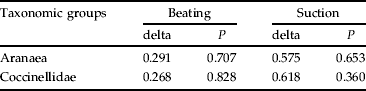
Spiders and coccinelids communities showed a similar composition in the three treatments, as tested by Bray-Curtis dissimilarity index (table 3). Nevertheless, for the S and RV treatments, the communities were, in general, located at a lower distance from each other than from the BS treatment, as exemplified in fig. 2. For suction samples, dissimilarities between treatments were about twice higher than for beating samples (table 3).
Ordination plots of the communities of Aranaea (a) and Coccinellidae (b) for the three ground cover treatments, i.e. sowing selected plant species (S), maintenance of resident vegetation (RV), and bare soil by herbicide application (BS), based on Bray-Curtis dissimilarities estimated from beating samples collected in lemon orchards in Mafra (Portugal) in 2002 and 2003.

Bray-Curtis dissimilarities index (delta) and respective significance (P) for the communities of both Aranaea (genus level) and Coccinellidae (species level) captured by suction and beating techniques, in 2002 and 2003, in the tree canopy on lemon orchards (Mafra, Portugal) exposed to three treatments of ground-cover management: S, sowing selected plant species; RV, maintenance of resident vegetation; BS, bare soil by herbicide application.
Temporal variation patterns
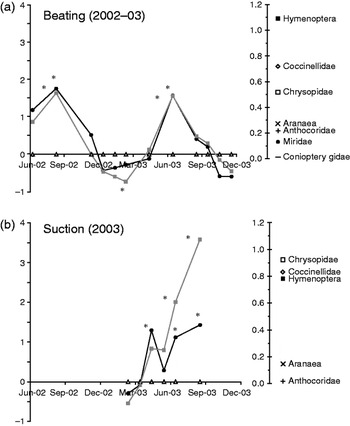
Considering beneficial arthropods, the PRC analyses showed significant deviances for the S and RV treatments, in comparison to bare soil. Furthermore, the seasonal patterns of the S and RV treatments converged in all cases (figs 3–5). For beating samples, similar time series were further observed, both in 2002 and 2003. The first axes of the PRC were significant in all models (P<0.01). Both for overall arthropods and the coccinelids, the highest deviations from BS treatment occurred in late spring and summer, when higher numbers of individuals were observed in the S and RV treatments, in comparison to BS (figs 3 and 5), while smaller deviations were found in the fall and winter. Also, an opposite trend occurred during winter, when higher numbers were observed in treatment BS than RV, although differences were generally not significant (fig. 3). Wasp parasitoids, coccinelids and green lacewings were the major contributors to higher positive deviance observed for the S and RV treatments. Among coccinelids, Rodolia cardinalis (Mulsant) and Scymnus spp. were the most relevant species accounting for differences between treatments, both in beating and suction samples (fig. 4).
First principal response curves (PRC) representing the effects of the two cover crop treatments, i.e. sowing selected species (S) and resident vegetation (RV), in relation to the control treatment, bare soil (BS), on the overall studied arthropod communities (family/order level) associated with tree canopy in lemon orchards in Mafra (Portugal) from July 2002 to December 2003 by the beating sampling technique (a) and from March to September 2003 by suction (b). The left y-axis represents deviances from the control. Significant deviances based on t-test of the regression coefficients (P<0.05) are marked with an asterisk. The right side of the figure represents family weight, accounting for the deviances of the PRC. Higher weight stands for higher contribution. Percentage variance of species-environment relation explained by y-axis is 76.6% for suction samples and 70.4% for beating samples (–•–, S;  , RV; –▵–, BS).

First principal response curves (PRC) representing the effects of the cover crop treatments, i.e. sowing selected species (S) and resident vegetation (RV), in relation to the control treatment, bare soil (BS), on coccinelids (Coleoptera: Coccinellidae) (species level) collected in tree canopy in lemon orchards in Mafra (Portugal) from July 2002 to December 2003 by the beating sampling technique (a) and from March to September 2003 by suction (b). The left y-axis represents deviances from the control. Significant deviances based on t-test of the regression coefficients (P<0.05) are marked with an asterisk. The right side of the figure represents genus weight, accounting for the deviances of the PRC. Percentage variance of species-environment relation explained by the y-axis is 43.3% for suction samples and 37.1% for beating samples (–•–, S;
, RV; –▵–, BS).

First principal response curves (PRC), indicating the effects of the two cover crop treatments, i.e. sowing selected species (S) and resident vegetation (RV), in relation to the control treatment, bare soil (BS), on spiders (Aranaea) (genus level) collected in the tree canopy in lemon orchards in Mafra (Portugal) from July 2002 to December 2003 by the beating sampling technique (a) and from March to September 2003 by suction (b). The left y-axis represents deviances from the control. Significant deviances based on t-test of the regression coefficients (P<0.05) are indicated with asterisks (*). The right side of the figure represents species weight, accounting for the deviances of the PRC. Percentage variance of species-environment relation explained by y-axis is 87.2% for suction samples and 73.5% for beating samples (–•–, S; , RV; –▵–, BS).

Seasonal deviations of the spider community followed a pattern different from those observed for the other arthropods. Thus, during late winter and early spring, a higher abundance of spiders in the tree canopy was found in the S and RV treatments, than in BS; whereas in the summer this pattern was reversed, with a significant effect for the suction samples (fig. 5). The genera Nigma (Dictynidae) and Ozyptila (Thomisidae) were the major contributors to the differences observed between both S and RV treatments and BS (fig. 5) and also the most common spiders in lemon trees, accounting for 27% and 10%, respectively, of the total number of spiders collected.
Plant community composition and biomass
As expected, plant biomass was significantly higher in the S and RV treatments than in BS (F2,26=4.03, P=0.03). Poa annua L. (Poaceae) was the most abundant species in both S and RV. In addition to the species sown, Polycarpon tetraphyllum L. (Caryophyllaceae) was also abundant in the S treatment. Arctotheca calendula (L.) Levyns (Asteraceae), Hordeum murinum L. (Poaceae), Oxalis pes-caprae L. (Oxalidaceae) and Stellaria media (L.) Vill (Caryophyllaceae) were the most common plant species in RV, while Portulaca olearacea L. (Portulaceae), a summer species, was the most abundant in BS (fig. 6).
The ten most abundant plant species in ground-cover vegetation for each treatment of ground-cover management installed in lemon orchards in Mafra (Portugal) from March 2002 to December 2003: S, sowing selected plant species; RV, maintenance of resident vegetation; and BS, bare soil by herbicide application (species marked with an asterisk correspond to sown species on S treatment) (▪, S; , RV; □, BS).

Discussion
In general, both S and RV treatments showed a significant positive effect upon the numbers of arthropods present in the lemon tree canopy for almost all taxonomic groups: spiders, parasitoid wasps, coccinelids and green lacewings. Yet, significant differences were consistently found in the second year only, possibly indicating a time-delayed effect on the increase of beneficial arthropods. For coccinelids and spiders, community diversity and structure in lemon trees was similar for the three treatments. Thus, an increase of the diversity of beneficial canopy arthropods, in response to the manipulation of ground cover vegetation, was not supported by the present study. Non-significant effects of ground cover management, both upon the numbers and species richness of arthropods established in the canopy of perennial crops were reported by Costello & Daane (Reference Costello and Daane1998) in vineyards and by Smith et al. (Reference Smith, Arnold, Eikenbary, Rice, Shiferaw, Cheary and Carroll1996) in pecan plantations, whereas in other studies both the structure and numbers of arthropod assemblages in tree canopy were influenced by ground cover modality (e.g. Rieux et al., Reference Rieux, Simon and Defrance1999). Such apparent discrepancies among studies may be related to the dependence of population dynamics and trophic interactions processes occurring at spatial scales larger than that of an agricultural plot (Tscharntke et al., Reference Tscharntke, Bommarco, Clough, Crist, Kleijn, Rand, Tylianakis, van Nouhuys and Vidal2007). Factors, such as orchard size, composition of the adjacent vegetation and type of landscape, may also be involved. For example, Thies & Tscharntke (Reference Thies and Tscharntke1999) found that parasitism of the rape pollen beetle, Meligethes aeneus, an important pest on oilseed rape, Brassica napus, was higher in structurally complex landscapes than in simple landscapes. Schmidt et al. (Reference Schmidt, Roschewitz, Thies and Tscharntke2005) observed that spider species richness in crop fields was linked to large-scale landscape complexity, while spider densities responded to local management practices. Both Thies & Tscharntke (Reference Thies and Tscharntke1999) and Schmidt et al. (Reference Schmidt, Roschewitz, Thies and Tscharntke2005) studies found that local management were likely to have a positive effect only in simple landscapes, which is in accordance to our findings. Orchards used in the present study were relatively small (ca. 1–4 ha), a characteristic which might have facilitate the colonization by beneficial arthropods from the surrounding landscape, depending on habitat diversification. Accordingly, the highest differences among ground-cover management treatments were registered in the largest orchard (PF, ca. 4 ha), which was surrounded by the least diversified landscape. By contrast, orchards CC and CMC, which were surrounded by a more diverse landscape, including different horticultural and ornamental crops, pine stands and windbreak corridors, as well as shrub land areas, showed only minor differences among treatments. This result suggests that the presence of ground cover vegetation may be more important for the establishment of beneficial arthropods in orchards with a lower diversity of surrounding habitats, thus highlighting the importance of a landscape perspective (Altieri et al., Reference Altieri, Ponti and Nicholls2005; Tscharntke et al., Reference Tscharntke, Bommarco, Clough, Crist, Kleijn, Rand, Tylianakis, van Nouhuys and Vidal2007). The complexity of the mechanisms relating biodiversity to trophic relationships (Duffy et al., Reference Duffy, Cardinale, France, McIntyre, Thébault and Loreau2007) may also explain divergences between studies.
Effects observed on beneficial arthropods due to ground cover vegetation may vary with the season. By using PRC models, positive significant deviances of both RV and S treatments on the abundance of total arthropods were observed in the late spring and summer, but not in other seasons. Similar seasonal patterns were observed for the two consecutive study years, independently of the sampling method (suction or beating). Wasp parasitoids, green lacewing and coccinelids were the most relevant beneficial arthropods accounting for the higher values in both S and RV treatments, in the spring–summer. This period coincides with the season when predators and parasitoids and their prey/hosts, mainly scales insects, whiteflies and mites, build up their populations (e.g. Katsoyannos, Reference Katsoyannos1996; Riley & Ciomperlik, Reference Riley and Ciomperlik1997). Therefore, the S and RV treatments seem to enhance the build up of natural enemy populations, which may be a result of improved survival and fecundity due to the additional food resources and/or habitats supplied by the ground vegetation layers. Nevertheless, regarding parasitic wasps, the expected overall effect of their increase in abundance on the biological control of citrus pests, as a result of cover cropping, may be positive, neutral or negative, depending on the resulting balance between parasitoid and hyperparasitoid species.
Direct or indirect effects upon the diversity and abundance of natural enemies might have resulted from the insecticide applications, despite a small number of chemical interventions with relatively selective pesticides was carried out. Lufenuron was reported to have no effect on the wasp parasitoid Encarsia citrina (Thomson et al., Reference Thomson, Tomkins, Wilson and O'Callaghan1996) but was classified as harmful for the larvae of the green lacewing Chrysoperla externa (Bueno & Freitas, Reference Bueno and Freitas2004). Abamectin was considered to be innocuous for the larvae of C. externa (Bueno & Freitas, Reference Bueno and Freitas2004). Mineral oil was classified as harmless for the braconid wasp Aphidius colemani and as slightly harmful for the lady beetle Cryptolaemus montrouzieri (Urbaneja et al., Reference Urbaneja, Pascual-Ruiz, Pina, Abad-Moyano, Vanaclocha, Montón, Dembilio, Castañera and Jacas2008). Therefore, the corresponding impact of these insecticides on natural enemies is expected to be minor, except for a possible detrimental influence of lufenuron on green lacewings. Nevertheless, the fact that all treatments were submitted to identical phytosanitary conditions allows us to accept that the observed differences are due to the effect of ground-cover management treatments. Further, the results allow us to understand how ground cover treatments might influence natural-enemies abundance and diversity under commercial orchards conditions, where pesticide sprays are commonly applied for pest control.
Spiders were the dominant group of natural enemies, representing 70% of the specimens in beating samples. Over 30 genera were sampled, the most frequent ones being Nigma (Dictynidae) (27%), a web-sheet spinner, and Ozyptila (Thomisidae) (10%), an ambush-wandering spider. Results confirm the relevance of these generalist predators in agro-ecosystems, including citrus (Bugg & Waddington, Reference Bugg and Waddington1994; Olkowski & Zhang, Reference Olkowski, Zhang, Pickett and Bugg1998; Riechert, Reference Riechert, Pickett and Bugg1998; Marc et al., Reference Marc, Canard and Ysnel1999). Significantly higher numbers of spiders were caught from the tree canopy of the S and RV treatments, confirming that spider density is directly related to the structural complexity of the environment (e.g. Riechert & Lockley, Reference Riechert and Lockley1984; Schmidt et al., Reference Schmidt, Roschewitz, Thies and Tscharntke2005).
The observed seasonal fluctuations of the spider community followed a different pattern from those of the other arthropods. During late winter and early spring, the S and RV treatments showed a higher abundance of spiders in the tree canopy in comparison with BS; whereas, in the summer, the opposite was observed. Spider movements between tree canopy and ground vegetation layers may explain this result. In treatments RV and S, spiders probably move to the mulch layer originated by the senescence of the ground cover vegetation in the late spring and summer; whereas, in treatment BS, aggregation in the tree canopy is expected, due to the lack of ground layer vegetation.
Such findings indicate that habitat management may reduce the abundance of natural enemies in the crop. Similar cases were observed for different arthropods, such as Harmonia axyridis, the adults of which showed lower rates of predation upon aphid colonies in extra-floral nectar-bearing trees, since more time was spent feeding on nectar, or pollen, than on prey search (Brown & Mathews, Reference Brown and Mathews2007). Concomitantly, Roltsch et al. (Reference Roltsch, Hanna, Zalom, Shorey, Mayse, Pickett and Bugg1998) reported for vineyards in California, a decline in late June of agelenid spiders in the vine canopy, next to cover crops, in parallel with an increase of the population in the cover crop, as well as with the progression of the cover crop senescence. Roltsch et al. (Reference Roltsch, Hanna, Zalom, Shorey, Mayse, Pickett and Bugg1998) further suggested that spiders were dispersing from vines to senescent cover crops.
During winter and early spring an opposite trend occurred, possibly due to spider movements from the ground vegetation layers to the tree canopy. In our study, the abundance of ground-dwelling spiders, such as Ozyptila, in the tree canopy, contributes to reinforce the likely occurrence of interactions between the canopy of citrus trees and ground cover vegetation, as observed for other fruit orchards and forest stands (e.g. Bogya & Markó, Reference Bogya and Markó1999; Marc et al., Reference Marc, Canard and Ysnel1999; Schmidt & Tscharntke, Reference Schmidt and Tscharntke2005; Branco et al., Reference Branco, Santos, Calvão, Telfer and Paiva2008).
On the other hand, whereas during the winter and early spring, a high number of spiders in the tree canopy may contribute to higher predation rates; since this period does not correspond to prey populations peaks, it may be of limited relevance for the population dynamics of the main pests, except maybe for species having an early population build-up in the spring.
Among coccinelids, R. cardinalis and Scymnus spp. were the most abundant and relevant species, accounting for differences between the S and RV treatments and BS. Both species feed on scale insects, such as Icerya purchasi Maskell, in the case of R. cardinalis, and Lepidosaphes beckii (Newman) and Aspidiotus nerii Bouché, commonly preyed upon by Scymnus spp. (Raimundo & Alves, Reference Raimundo and Alves1986; Ben-Dov et al., Reference Ben-Dov, Miller and Gibson2008). Therefore, the observed increase of the two predators in the two vegetation treatments might contribute positively to the control of scale insects in lemon orchards.
Several authors, reviewed by Landis et al. (Reference Landis, Wratten and Gurr2000), suggest that selected species planting, to provide nectar, pollen and alternative prey refuges, can be expected to yield better results than just allowing resident vegetation to grow. In this study, the communities of tree canopy beneficial arthropods showed similar abundance, structure and seasonal patterns, both under resident vegetation and selected species sowing conditions. The fact that diverse Mediterranean vegetation was observed in RV, namely Poaceae, Asteraceae and Caryophyllaceae, and that flowering periods of sowed and natural vegetation overlapped considerably, may explain our results. Ideally, cover crops sown for biological control should be selected aiming to benefit the third-trophic level (natural enemies) in comparison with the second (pests) or fourth (e.g. hyperparasitoids) (Araj et al., Reference Araj, Wratten, Lister and Buckley2008). However, further studies are needed to investigate how natural enemies may actually be favoured by selected cover-cropping plant species (e.g. Baggen et al., Reference Baggen, Gurr and Meats1999; Lee et al., Reference Lee, Heimpel and Leibee2004; Ceballo & Walter, Reference Ceballo and Walter2005; Araj et al., Reference Araj, Wratten, Lister and Buckley2008). Besides direct effects on natural enemies, cover crops may have indirect impact on pests, such as over-wintering sites, and crop productivity, such as through the competition for water, soil nitrogen and soil organic matter content (e.g. Lapointe, Reference Lapointe2003; Wright et al., Reference Wright, McCloskey and Taylor2003). Further studies are needed to investigate all possible implications of ground-cover management in this crop system.
In conclusion, this study showed that an increase of plant diversity within citrus orchards, achieved by cover cropping of the tree inter-rows, enhances the abundance of beneficial arthropods in the tree canopy, in comparison to bare soil. However, no effect was observed upon species/genera richness of either spiders or coccinelids.
Acknowledgements
We would like to thank: Manuel Cariano, Ana Baptista, Ana Passarinho, Carla Ribeiro, Nuno Grade and Pedro Rodrigues for help with field and laboratory work; Pedro Cardoso and Armando Raimundo, for advice regarding, respectively, the identification of spiders and coccinelids; Hervé Jactel, Maria Rosa Paiva and two anonymous reviewers for valuable comments on an earlier draft of this manuscript; Inge Van Halder for help with the NMDS analysis. Thanks are also due to lemon growers of Frutoeste CRL, for permission to use their orchards. This study was financed by Programme AGRO Med. 8.1 DE&D Project no. 29, ‘Management of ground cover and hedgerows in citrus orchards for biological control of pests’. EBS received a grant from FCT (SFRH/BPD/22145/2005).