


INTRODUCTION
In a growing number of developing, democratizing countries, the global shift away from centralized political and economic regimes coincided with a rarely noted phenomenon: the proliferation of subnational administrative units. This trend has been particularly pronounced in sub-Saharan Africa, where almost half of countries increased their number of administrative units by over 20% since the mid-1990s. However, it is not unique to Africa; for example, as part of their postcommunist decentralization reforms, Czechoslovakia and Hungary increased their number of municipalities by about 50% between 1989 and 1993 (Ilner, Reference Ilner and Kimball1999). Brazil also increased its municipalities by over 50% following its return to civilian rule (Dickovick, Reference Dickovick2011). Similarly, after relocating essential government functions to the district level, Indonesia increased its number of provinces from 26 to 33 and districts from 290 to 497 in less than a decade after Suharto's fall (Kimura, Reference Kimura2013), and following liberalization reforms Vietnam increased its number of provinces from 40 to 64 between 1996 and 2003 (Malesky, Reference Malesky2009). In sum, in numerous countries, the subnational structure of the state has undergone a substantial transformation.
Administrative unit proliferation can bring dramatic changes to a country's political, social, and economic landscape. The creation of several new units typically makes each one, on average, smaller and more homogeneous, which may affect citizens’ capacity for collective action and therefore the level and quality of public goods and services they receive. The increased homogeneity in local units can also influence local ethnic politics, as in Indonesia (Kimura Reference Kimura2013), Nigeria (Kraxberger Reference Kraxberger2004), and Uganda (Green Reference Green2008), potentially reifying ethnic boundaries and creating a sense of improved group control over their affairs. Citizens in a newly created unit have new leaders drawn from an area that is more proximate to them; those leaders are thus more likely than prior leaders to share constituents’ familial and social networks. These citizens further face a new calculus for resource allocation within their locality as well as a shift in the locus of many social services. District creation may also change political dynamics in rump areas where politicians now face a different composition of constituents and thus altered electoral incentives.Footnote 1 Additionally, particularly in places where administrative units correspond with national legislative constituency boundaries—as in Uganda, India, and Vietnam, among others—the carving of a large number of new local governments may have important implications for national politics (Malesky Reference Malesky2009). Finally, as we argue below, the proliferation of administrative units likely influences intergovernmental balance of power, contributing to processes of recentralization.
This article examines the determinants of administrative unit proliferation. Despite the prevalence of administrative unit proliferation in developing countries and its potential to substantially shape political, social, and economic outcomes, the existing literature on the determinants of this phenomenon is small and suffers from theoretical and methodological shortcomings that we seek to address. Existing work rarely theorizes the political incentives, importance, and agency of local actors, instead envisioning administrative unit creation as a top-down strategy devised by national elites intent on expanding their ethnic patronage network (Green Reference Green2010; Kasara Reference Kasara2006) or on weakening the powers of regional opposition forces (Kraxberger Reference Kraxberger2004). We posit that a fuller account of administrative unit proliferation should go beyond an analysis of the incentives of national leaders and include local actors.
To illuminate the dynamic processes that give rise to the proliferation of administrative units, we conceptualize a given locality as being comprised of two types of areas: core areas that control the local government and outlying areas. We argue that demand for territorial secession is triggered by decentralization reforms, which increases the value of local government units, and it grows where citizens of outlying areas perceive themselves to be marginalized compared to the core area. The source of marginalization may be political (e.g., lack of control over allocation of local resources), symbolic (e.g., the ethnic or religious group that predominates in the outlying area is a minority in the larger locality (ethnic or religious group), or material (e.g., low levels of development). The more marginalized an outlying area is, the greater the demand for a new governance unit. Administrative unit proliferation is, we argue, largely driven by a convergence of interests between citizens in marginalized areas that seek more direct access to local government resources and who view the creation of new units as an avenue to such access; elites in marginalized areas who seek job opportunities and greater control of public resources; and the national executive, which seeks electoral support. Such alliances between the national executive and certain local actors are particularly important in democratizing countries where electoral incentives increasingly shape policy.
We substantiate our argument with original data on district proliferation in Uganda, whose decentralization process has been heralded as “one of the most far-reaching local government reform programs in the developing world” (Francis and James Reference Francis and James2003). Our empirical analysis has two steps. First, we directly test our hypothesis that political, symbolic and material marginalization fuel local demand for new districts using a new, fine-grained, county-level (subdistrict) dataset. These data include information on local political dominance along with county-level data on economic activity, inputs and outputs in the education and health sectors, and ethnic demographic data from the Ugandan census. We also include qualitative evidence from newspaper articles and fieldwork in Uganda. We show that counties that are under-represented in a district's committee governing intradistrict resource allocation are more likely to form a new district. This finding is robust to various model specifications including the incorporation of spatial dependencies. Moreover, we find that counties in which the largest ethnic group is different than the district's largest group are more likely to split from that district, suggesting that being a concentrated ethnic minority amplifies perceptions of marginalization (Hale Reference Hale2004; Kraxberger Reference Kraxberger2004). Second, we test the supply side of our theoretical argument by examining the electoral incentives of the national executive. Using both static and dynamic panel-data estimations, we find that the incumbent president receives an electoral bonus of between 2.5% and 3% in counties that were elevated to the status of a district prior to an election and is not penalized by “mother” areas that have recently lost territory due to a split. These findings support our claim that the electoral benefits to the incumbent president of approving new districts are substantial.
This article also makes two important methodological contributions to the nascent administrative unit proliferation literature. One contribution is to suggest changing the level of analysis in order to overcome thorny methodological challenges that have constrained earlier studies. In particular, all past empirical studies of the creation of administrative units use data at the level of the units that split. Such a design has prevented these studies from directly testing arguments about the role that heterogeneity within administrative units may play in increasing demand for unit splits. By contrast, our use of data at a level (county) lower than the unit that splits (district) allows us to examine directly the subdistrict forces driving why some counties and not others break away from their former “mother” district. For example, we revisit prior results that—based on district-level data—did not identify a relationship between economic marginalization and district creation in Uganda (Green Reference Green2010). Using subdistrict (county-level) data, our analysis reveals substantial variation within districts in economic development and political domination and we find strong evidence of a positive relationship between economic and political marginalization and district splits. Our data are also measured at each of three interelection periods, which enables us to account for the dynamic processes whereby shifts in the extent of a county's marginalization influence the likelihood it will mobilize to secede from its mother district.
Additionally, we propose a new solution to another methodological challenge of studying administrative unit proliferation: district splits may exhibit unobserved location-related effects or follow a contagion process that drive some of the variation in counties’ proclivities to secede. Such spatial dependencies invalidate standard limited dependent variable estimation techniques (Gleditsch and Ward Reference Gleditsch and Ward2006). In this article we test the robustness of our findings to the inclusion of spatial dependencies by adapting the approach of Bhat and Sener (Reference Bhat and Sener2009), which develops a copula-based binary logit choice model for accommodating spatial correlation across observational units.Footnote 2
Beyond their contribution to the study of administrative unit proliferation, the arguments and findings in this article have implications for several distinct literatures. First, this article engages the literature on decentralization, arguing that even when decentralization reforms are characterized by a far-reaching de-jure devolution of power, administrative unit proliferation can reverse short-term gains by local governments and contribute to a de-facto recentralization of power. Our logic linking administrative unit proliferation to intergovernmental power is straightforward and builds on Ziblatt (Reference Ziblatt2004): the creation of a large number of new local governments fragments existing ones into smaller units with lower intergovernmental power and weak administrative capacity. This contributes to an increased dependence of local governments on the resources and “know-how” of the central government. In the last section of the study, we provide suggestive evidence—from interviews with local officials, secondary accounts, and national and local government budget data—that is consistent with our argument that the proliferation of districts that followed Uganda's decentralization reforms has contributed to a recent recentralization of power there. To our knowledge, no prior study considers the possibility that administrative unit creation—often assumed to be simply an indicator of decentralization—can in fact diminish localities’ intergovernmental power.
This article also contributes to the growing literature on the implications of Africa's political liberalization. This literature focused initially on whether liberalization reforms are genuine (Lindberg Reference Lindberg2009) or superficial, merely designed to appease the international community (Chabal and Daloz Reference Chabal and Daloz1999). More recently, the literature has explored the implications of heightened political competition (Weghorst and Lindberg Reference Weghorst and Lindberg2013). Our findings about the national executive's electoral incentive to supply districts to marginalized rural localities provide further support to the idea that elections in hybrid African regimes like Uganda generate incentives for national elites to implement redistributive policies that broadly entice rural voters (Stasavage Reference Stasavage2005).
Finally, the article contributes to research on the African voter. While a large portion of this literature suggests the overwhelming importance of ethnicity in influencing African voters (Eifert, Miguel, and Posner Reference Eifert, Miguel and Posner2010), recent research has documented the influence of several factors beyond ethnicity—such as incumbent performance and access to public goods—in determining vote choice (Conroy-Krutz Reference Conroy-Krutz2013; Ichino and Nathan Reference Ichino and Nathan2013). Our finding that Uganda's president receives a significant electoral boost for allowing the creation of new districts further demonstrates that African voters respond to popular policy initiatives in predictable ways (Baldwin, Reference Baldwin2013).
The article proceeds as follows. First, we explore the prevalence of administrative unit proliferation amidst decentralization reforms and review related research. Second, we propose a theoretical argument that emphasizes the role of citizens and local elites in demanding new administrative units and the incentives for the national executive to supply them. Third, we provide context about decentralization and district creation in Uganda. Fourth, we present extensive evidence that political, economic, and symbolic marginalization underpins local demand to increase the number of administrative units, as well as evidence of the national executive's electoral incentives to create such units. Fifth, we provide evidence suggesting that the process of administrative unit proliferation can contribute to changes in intergovernmental balance of power. We conclude with a discussion of the policy and research implications of our findings.
LITERATURE REVIEW
Administrative unit proliferation denotes a political process resulting in a large number of local governments splitting into two or more units over a relatively short period.Footnote 3 The newly created local governments can be any subnational level of administration (for example, states, provinces, or districts) provided that those units have meaningful resources, powers (e.g., legislate by-laws and set local tax rates), and responsibilities (e.g., provide and supervise social services).
While administrative unit creation is often conflated with decentralization, the two are distinct phenomena. Decentralization is the delegation of authority—political, financial, or administrative—to local units of government (Falleti Reference Falleti2005), regardless of the quantity of those units. In practice, however, administrative unit proliferation often occurs following the initiation of decentralization reforms. Investigating the conditions under which decentralization reforms lead to administrative unit proliferation is beyond the scope of this article, however one reason the former often begets the latter is straightforward: devolution of new authority to localities—the centerpiece of decentralization reforms—makes them more valuable to citizens and elites, and thus can trigger their demand. This phenomenon is widespread particularly in sub-Saharan Africa, where almost half of the countries have increased their number of administrative units by at least 20% since 1990, amidst a wave of decentralization reforms (Table 1).Footnote 4
Increase in Local Government Units in Africa Since 1990

Note: List of sub-Saharan African countries that increased their number of administrative units by at least 20% since 1990. *denotes 2012.
Proponents of administrative unit creation tend to justify it using a repertoire of arguments about the relative efficiency of decentralized service provision—arguing, for example, that district splits bring government “closer to the people” and thereby promote more responsive and accountable local governments.Footnote 5 Emphasis on the administrative efficiency of decentralized governance has dominated much of the policy debate about district splits in numerous countries from Uganda (Asiimwe and Musisi Reference Asiimwe and Musisi2007) to Indonesia (Fitrani, Hofman, and Kaiser Reference Fitrani, Hofman and Kaiser2005).Footnote 6 Such arguments echo optimistic expectations about decentralization reforms in the 1980s and 1990s, which held that such reforms would bring about a host of benefits, particularly in promoting good governance and improving the delivery of services.
However, the record of decentralization reforms in improving governance and service delivery has been mixed, at best (Bardhan and Mookherjee Reference Bardhan and Mookherjee2006). Recognizing the gap between such reforms’ initial promise and their record, the nascent literature on administrative unit proliferation has focused on political economy explanations, which foreground the incentives and constraints of national actors who implement the reforms (Eaton, Kaiser, and Smoke Reference Eaton, Kaiser and Smoke2010). The starting point of this approach posits that national politicians design and implement reform processes in ways that are aligned with their interests, which may or may not coincide with the original reform goals of international donors (Van de Walle Reference Van de Walle2001). Specifically, Kraxberger (Reference Kraxberger2004), Kasara (Reference Kasara2006), and Green (Reference Green2010) all argue that the creation of new districts occurs because it provides national elites an opportunity to develop and strengthen patronage networks that had been weakened in the wake of structural adjustment reforms. While advancing our knowledge on district formation, patronage-based explanations suffer from a critical shortcoming: in their focus on national-level actors, these theories tend to overlook the agency and incentives of local actors, who are not simply passive recipients of decisions made in a country's capital (Boone Reference Boone2003).
We argue that local actors play a fundamental role in the process of district formation. In doing so, we build on two notable exceptions to the general omission of local actors from the literature on administrative unit creation: Kimura (Reference Kimura2013) and Malesky (Reference Malesky2009). The former undertakes case studies of province creation in Indonesia and finds that while there have been several pathways to province creation, all involved a coalition of actors at both the national and local levels. Our theoretical argument presented below accords with this logic. The reach of Kimura (Reference Kimura2013)’s arguments is, however, constrained by the small number of provinces created in Indonesia (six) and from limited within-province data on material and political marginalization; we are able to offer a more comprehensive test of our argument owing to the much greater variation that exists in Uganda and to the unique structure of our within-district data. Malesky (Reference Malesky2009) argues that the splitting of provinces in Vietnam amidst liberalization reforms is best understood as a top-down gerrymandering tactic, intended at weakening the powers of regional oppositional forces by enabling reformers to secure a majority of votes in the Communist Party's Central Committee. Importantly, Malesky (Reference Malesky2009)’s theoretical argument emphasizes the role of heterogeneous preferences within provinces in local government creation; in this case, distinct preferences associated with areas that have high versus low levels of reliance on state owned enterprises. Indeed, our theoretical argument also builds on that intuition.
We diverge, however, from Malesky (Reference Malesky2009) in two important ways. First, we extend Malesky (Reference Malesky2009)’s focus on material interests to include a focus on political and symbolic marginalization. Second, Malesky (Reference Malesky2009)’s use of province-level data limits his ability to directly test his key theoretical argument that intraprovince variation drives province creation.Footnote 7 The unit-of-analysis problem that Malesky (Reference Malesky2009) faces is common; in fact, it constrains all existing works on administrative unit proliferation. Kasara (Reference Kasara2006), Pierskalla (Reference Pierskalla2013), and Green (Reference Green2010) each use district-level data from Kenya, Indonesia, and Uganda, respectively, to study the creation of new districts. While this approach can be informative, it can also be misleading. Consider a case in which districts that split contain one subdistrict unit with a higher-than-average level of development and a second unit with a lower-than-average level of development. A district-level regression may, in this case, result in an insignificant coefficient on the development variable, obscuring the fact that subdistrict areas that seek to split are, in fact, economically marginalized.Footnote 8 For example, using district-level data from Uganda, Green (Reference Green2010, 89) finds “no concrete evidence that new districts have, on the whole, been created in deprived areas.” We revisit this finding below using original subdistrict data and find strong evidence to the contrary.
Finally, unlike previous studies, this article investigates how administrative unit proliferation contributes to shaping intergovernmental balance of power. As Falleti argues, “to evaluate the consequences of decentralization . . . we need to establish first when and how decentralization policies increase or decrease the power of subnational officials” (Falleti Reference Falleti2005, 328). We argue that because administrative unit proliferation fragments the coordination potential of local governments and because it increases the reliance of local governments on the center, it can limit the extent to which decentralization reforms ultimately result in meaningful devolution of power. In doing so, we aim to contribute to an emergent literature that seeks to explain why several formerly decentralizing countries have recently recentralized (Dickovick Reference Dickovick2011).
DETERMINANTS OF ADMINISTRATIVE UNIT PROLIFERATION
Given the background conditions of decentralization reforms in a low-income, democratizing country, why does administrative unit proliferation occur? This section presents our theoretical approach to understanding the determinants of district formation. We make three overarching arguments: First, we argue that elites from marginalized areas have a strong incentive to mobilize for a new local government, since this offers them the best opportunity to hold office and control the allocation of public resources. Second, we posit that local elites are likely to succeed in their mobilization efforts only where there is widespread perception among constituents of political, material, or symbolic marginalization. Finally, on the supply side we argue that the national executive has incentives to meet the demand for new administrative units, in part because it provides an electoral boost in areas granted “their own” local government, while also fragmenting potential opposition power bases. This confluence of interests effectively generates an alliance between national incumbents and elites from marginalized localities, allowing them to overcome possible opposition to the splitting of local governments.
To illustrate these points, we consider a national executive based in a capital city and a set of localities that are governed by locally elected elites. Within each locality there are two types of areas: a “dominant” and an “outlying” area. Dominant areas are the local center of commerce and politics and are where local governments are typically based. In contrast, those living in outlying areas are remote from such local metropoles and thus removed from many public services—for example, hospital care, which is provided only in the district capital—and from the decision-making bodies that govern them. This conceptualization reflects an emerging pattern in much of the developing world, in which certain areas of countries’ peripheries are becoming urbanized. For example, in 2005, only about 15 percent of the urban population in sub-Saharan Africa resided in large cities of over one million people, while over half lived in small cities of less than 200,000 people (Kessides Reference Kessides2005). In Latin America, almost 40 percent of the population now lives in small cities with fewer than 500,000 inhabitants (UN 2008). When combined with an influx of funds to localities induced by decentralization reforms, such demographic dynamics can generate tension between local metropoles and the surrounding, outlying villages.Footnote 9
How do these patterns influence local demand for new administrative units? First, consider the interests of elites from outlying areas. Those elites have a clear incentive to advocate for a new district since a new administrative unit brings substantial employment opportunities for local elites in the form of district political and civil service positions. While prior to a split, elites from outlying areas could seek positions in the leadership of their larger district, such positions would be far more competitive and remote than they would be in a newly formed district. Furthermore and crucially, district creation in an outlying area affords elites from such areas the opportunity to gain favor with their constituents, if those constituents demand a new district. Thus, while forming a new administrative unit in their locality may entail some costs for local elites from outlying areas—including a potential loss of bargaining power with the center, discussed below—those costs are typically outweighed by the strong electoral and material incentives that a new local government entails if local citizens are demanding a new district.
Incentives faced by citizens in areas remote from a local metropole are more mixed, as they face the following trade off. On one hand, the status quo has clear benefits, such as better integration into local markets and remaining part of a district that has an established, relatively experienced and capable bureaucracy. On the other hand, those citizens typically incur high transaction costs in order to take advantage of the infrastructure and the political, administrative, and economic activities that are centered in the local metropole. Due to poor roads and a dearth of transit options, transportation costs in many rural parts of developing countries are quite high. For citizens in outlying areas, the creation of a new local government shortens the distance to district capitals, the locus of a district's headquarters and services. District creation also serves as a local economic stimulus, given the need to construct and staff a new district's headquarters. How do citizens in outlying areas weigh these tradeoffs?
We argue that when outlying areas have the same dominant identity group (e.g., ethnic or religious) and similar levels of development with the metropole, and have equal representation in local governance bodies, the benefits of the status quo typically outweigh the costs. Conversely, the more marginalized outlying areas are, or perceive themselves to be, the more likely that the expected benefits to citizens of new districts will exceed that of the status quo. Perceptions of marginalization, we posit, are generated and exacerbated in outlying areas by low levels of development (material marginalization), by over-representation of the local metropole in political bodies governing intradistrict resource allocation (political marginalization), and by conditions in which the majority ethnic group in the outlying area is a minority in the larger subnational unit (symbolic marginalization). We therefore expect that not all outlying areas will demand a new district, and that the ability of elites from outlying areas to mobilize locals to demand a new district will be increasing in these three types of marginalization. We assess these arguments by focusing on the following hypothesis regarding subdistrict characteristics that increase the demand for district formation:
-
H 1 Demand: areas that are more marginalized—politically, economically, and ethnically—are more likely to secede from their local administrative unit, forming “their own” new local government.
The discussion above suggests a puzzle. Why would elites in a local metropole allow their outlying areas to secede, especially if political control of those areas allows them to allocate a disproportionate share of the local government budget to citizens in their own area, closer to the metropole? We argue that the incentives of elites from metropole areas do not necessarily align with their citizens; elites from metropole areas derive benefits from unit splits that citizens do not. First, a district split reduces metropole elites’ campaigning costs in local elections because in a new, smaller district, they face less competition and a less geographically dispersed constituency. Second, the creation of a new district creates civil service job vacancies in the rump district as elites from the formerly marginalized area who previously held positions there move to positions in the new district. Third, using side payments, the national executive may buy off metropole elites. In sum, notwithstanding the loss of control over territory and resources, local metropole elites do not have a strong incentive to stand in the way of new district creation where demand arises.Footnote 10
Beyond local actors, the national executive also derives substantial benefits from administrative unit proliferation, forming the basis for alliances between the executive and outlying areas.Footnote 11 This alliance further reduces the ability and will of metropole elites from organizing a determined opposition to the district's split. In short, given the widespread popularity of creating new administrative units in outlying areas that are marginalized, meeting demands for new units can provide national executives a significant electoral boost. Our logic here is similar to that of Mani and Mukand (Reference Mani and Mukand2007), who argue that heightened political competition encourages central governments to implement policies which are highly visible, do not require high-implementation capacity, and which can be credibly attributable to incumbents’ behavior.Footnote 12 The primary costs to a national executive of approving new administrative units will be a budgetary burden, which may be offset, at least in part, by international donors who often view the creation of new units as a positive step towards decentralization. We formalize this discussion with the following hypothesis:
-
H 2 Electoral Incentive: the national executive receives increased electoral support in newly created districts.
The national executive has additional incentives to approve district splits. As Green (Reference Green2010) and others have argued, the creation of new districts provides ample opportunities to reward loyal supporters and to co-opt powerful opposition leaders through the distribution of jobs. Indeed, broadening the incumbent's patronage network is one of the most effective means to secure regime stability (Arriola Reference Arriola2009). The government may also try to lessen local conflict by separating tribal and ethnic groups into districts with their own governments (Hale Reference Hale2004). Finally, assuming that the bargaining leverage of local units is a function of their size, the national executive will be at an advantage in intergovernmental struggles over resource control if it bargains with a greater number of smaller units rather than with a smaller number of larger units.Footnote 13 Since the transaction costs among numerous units are higher than those among fewer units, administrative unit proliferation makes the coordination between local governments more difficult—a problem that is exacerbated when new units have had little time to build institutional capacity.
The above discussion suggests a possible countervailing influence on some of the incentives described above. Specifically, citizens’ expectations about future diminished local capacity and bargaining power could plausibly dampen their demand for new districts. We argue, however, that citizens from marginalized areas typically weigh these trade-offs in favor of secession. This is because the benefits of a new district—such as a shorter physical distance to district headquarters, as well as shorter social distance to local government functionaries—are immediate and tangible. By contrast, the possible loss of intergovernmental power and its attendant impact on the new local government's capacity is more abstract and uncertain. Furthermore, a classic free rider problem exists: if citizens from a given marginalized area know that other areas are receiving new districts, and thus the “commons” of district bargaining power will already be degraded, then they have an incentive to demand one as well. These problems are exacerbated when district creation occurs rapidly; in such cases, citizens’ ability to adjust their prior expectations concerning service improvements may be slower than the rate of splits, contributing to what in hindsight may appear to be extremely myopic voter behavior.Footnote 14
INTERGOVERNMENTAL POLITICS IN UGANDA
Uganda is an interesting and useful case for examining the above arguments for several reasons. First, with respect to external validity, Uganda shares characteristics with many low-income countries that have undergone decentralization reforms in recent decades. For example, its population is largely rural and subsistence-based, and its export economy relies primarily on commodities. It is ranked 162 in the latest United Nations Human Development Index ranking (low human development countries are ranked between 143 and 188) and in terms of GDP per capita, it is in the mid-range of the World Bank's lower-middle-income economies category. Additionally, Uganda presents an opportunity to examine the extent to which electoral incentives drive policy in hybrid regimes. On one hand, Uganda has a weak democracy (a score of −1 on the Polity IV scale) with a strong executive branch and a relatively weak parliament, both dominated by a single party; in the last election the ruling NRM party won 70% of parliamentary seats and won the presidency by a wide margin. On the other hand, Uganda has several features of genuine, if incomplete, democracy common to many developing countries in Africa and beyond. For example, domestic and international observers considered recent national elections to be relatively free and fair, local elections are generally quite competitive,Footnote 15 and the judiciary and legislature often assert independence from the executive in shaping legislation and conducting oversight (Kasfir and Twebaze Reference Kasfir, Twebaze and Barkan2009; Stasavage Reference Stasavage2005).
Uganda's Decentralization Reforms
While Uganda's early independence period had been characterized by the attempts of new post-colonial governments to consolidate power through centralization,Footnote 16 the rise to power of the National Resistance Movement (NRM) in 1986 ushered in a new phase of empowered local governments. The fledgling NRM government enacted major governance reforms, most importantly extending throughout the country its Resistance Councils (RCs), later re-named Local Councils (LCs), a system of local governance that the NRM had developed as a rebel group in western and central Uganda in the mid-1980s.Footnote 17 The Local Councils system was formalized and strengthened throughout the 1990s, and it persists today as a five-tiered system with districts (LC5) as the highest level of local government, followed by counties (LC4), subcounties (LC3), parishes (LC2), and villages (LC1).
Uganda's LC system created a complex set of new linkages between the central government and the periphery, and was accompanied by an extensive devolution of power to the new five tiers of local governments (Awortwi Reference Awortwi2011). A phased fiscal decentralization process was implemented nationwide after 1993, during which responsibilities and resources were divided between the central and local governments and annual transfers of funds from the center to the LCs were formalized (Lambright Reference Lambright2011). Importantly, the district governments (LC5) became responsible for handling all funds from the central government and were granted powers to raise taxes and legislate by-laws. The Local Government Act of 1997 further increased the powers of the districts to generate local revenue and formalized processes of distributing district revenue to the other LC levels.
The Local Government Act of 1997 also entailed a rather dramatic political decentralization by making most LC executive positions either locally elected or appointed by elected local officials.Footnote 18 Those include the District Chairperson, who is elected by a simple plurality of district residents and is the political leader of the district, as well as the district councilors, who are elected at the subcounty level to serve on the District Council.Footnote 19 Though the District Council is the ultimate policy, planning, and political authority in a district, key intradistrict resource allocation decisions are made by the District Executive Committee (DEC), which the District Chairperson leads and selects its membership from among the district councilors.Footnote 20 The 1997 Act also empowered the District Chairperson to appoint the head of the LC bureaucracy, the Chief Administrative Officer (CAO). Following those reforms, a World Bank team (Obwona, Steffensen, Trollegaad, Mwanga, Luwangwa, Twodo, Ojoo and Seguya Reference Obwona, Steffensen, Trollegaad, Mwanga, Luwangwa, Twodo, Ojoo and Seguya2000, 16) concluded that “within a very short time, Uganda has achieved one of the most decentralized and stable systems of subnational government in the entire Sub-Saharan Region.”
District Proliferation in Uganda
After Uganda's extensive decentralization reforms were initiated, beginning in the mid-1990s the number of districts increased dramatically: from 39 in 1995 to 112 in 2011.Footnote 21 New districts are created when the district council passes a motion confirming that a majority of councilors approve the separation of one or more of its counties. Formal requests for a new district are then forwarded to the Ministry of Local Government, which determines whether to recommend a new district. Uganda's Parliament must approve the actual creation of a new district. According the Ministry of Local Government, it is extremely rare that the national executive turns down such requests. In accordance with the expectations of our theoretical argument, only three formal requests for a new district have been denied since 2000.Footnote 22
The creation of a new district entails building a new district headquarters complex, as well as the election and appointment of several officials. Every district also has 11 administrative departments, such as finance, education, and health, headed by an officer that is appointed by the District Council, and is staffed by several civil servants. Each new district is also granted a woman member of Parliament, 16 annual, government-sponsored scholarships for university students, and was mandated to have a district hospital and a paved road until 2006 when those mandates were dropped.Footnote 23
CORRELATES OF DISTRICT PROLIFERATION: EMPIRICAL EVIDENCE
In this section we present evidence from Uganda in support of the theoretical arguments we developed about the political dynamics that bring about administrative unit proliferation. After describing the data employed in this section, we provide evidence suggesting that citizens expect that new districts will improve their access to services, and that demand for new districts is more likely to emerge in politically, economically, and ethnically marginalized areas. We then turn to examine the electoral incentives faced by national politicians, providing evidence that the creation of new districts gives the incumbent president a significant boost in the elections immediately following a district split.
Unit of Analysis and Data Sources
While districts are the level of local government that has dramatically expanded in Uganda since the late 1990s, we use counties, the next lower level of local government, as our primary level of analysis. In contrast, as discussed above, the most prominent quantitative studies of administrative unit splitting rely, instead, on data at the level of the locality that splits (Green Reference Green2010; Kasara Reference Kasara2006; Pierskalla Reference Pierskalla2013; Malesky Reference Malesky2009). Using subdistrict data allows us to reveal intradistrict dynamics.
Another consideration in our selection of a unit of analysis is that district creation unfolds over time. Recall that our theoretical argument is based, in part, on forces driven by electoral outcomes and pressures. For example, the composition of district leadership, including the DEC, changes only with election cycles. Additionally, the central government has generally approved the creation of new districts just prior to elections. We therefore structure the temporal dimension of our dataset according to electoral cycles. National and local elections took place in Uganda in 1996, 2001, 2006, and 2011. We measure our key dependent variable, splinter (secession) status, in interelection period “waves,” with the first electoral wave from 1996 to 2000, a second wave from 2001 to 2005, and a third wave from 2006 to 2010. Thus, in our dataset, the unit of analysis is the “county-wave,” or county jt , where j indexes each of the 163 counties and t indexes the three interelection periods. The creation of new administrative units over interelection periods in Uganda is visualized in Figure 1.
Creation of New Districts By Interelection Period (Wave)
Note: County boundaries are shown. There were 50, 78, and 112 districts in Uganda, respectively, at the end of each wave.

Data for the empirical analysis come from a variety of sources. Qualitative information comes from newspaper articles and interviews that the authors conducted with citizens and district officials in eastern, northern, and western Uganda in 2009 and 2010. Data on demography and development come predominantly from Uganda's 2002 census.Footnote 24 We obtained presidential election voting data from the Ugandan Electoral Commission. Because data on local politics are not readily available, we collected these data ourselves, using local expert surveys. Specifically we collected information on the home county of district chairperson candidates, whether the majority of a county supported the district chairperson winner or the runner up candidate, and the representation of each county on the DEC over each interelection period. Additional information on our data collection can be found in the Online Appendix.
Political, Ethnic, and Economic Marginalization
We hypothesized in H 1 that outlying marginalized areas are more likely to split off and form a new district. Anecdotal evidence suggests that national politicians recognize the central role marginalization plays in the process of district formation. For example, when Hon. Kawegyere in 2005 presented a motion for the creation of 11 new districts, he argued that “some of the proposed districts have arisen because the mother districts have in some way neglected them.”Footnote 25 Similarly, when justifying granting districts to Pallisa and Butebo counties, Hon. Mallinga lamented that “there is unequal distribution of schools, health services, and all social services, based on tribal differences.”Footnote 26 In describing why he believed popular support exists for a new district, a local NGO leader from Soroti district also explained in an interview with one of the authors, “certain areas [within a district] feel ignored.” Numerous citizens from marginalized areas also conveyed a similar sentiment during our fieldwork.
Our theoretical argument hinges on the assumption that citizens in outlying areas expect new districts to improve their situation of marginalization. We find ample evidence suggesting that ordinary citizens equate new districts with better access to services. For example, a recent report on district creation in Uganda reaches the conclusion—based on 209 key informant interviews and 29 focus groups—that Ugandan citizens interpret literally the slogan the central government uses to explain its decentralization policy: “bringing services closer to the people” (DENIVA 2011, 15). When asked to identify benefits of district creation, the modal response of citizens was bringing administrative services closer to the people (36%), followed by opportunity for autonomy and self-identity (21%), and improved social services (10%) (DENIVA 2011, 21). Following this logic, over 17,000 residents in Bughendera county signed a petition requesting a district since the county “was geographically hard to reach, hard to stay in with extremely poor service delivery which had denied the people a chance to access services.”Footnote 27 Also tellingly, in an infamous incident, a man in Tororo county ate a live rat in the presence of President Yoweri Museveni, arguing that “it was imperative that they were given their own district in order to ensure that vital public services are more accessible to all people in the Tororo.”Footnote 28
Though locating a new district in an outlying area invariably shortens the distance to vital services, its impact on the quality and level of social services is more ambiguous. Nonetheless, a nationally representative survey administered in mid-2011 by one of the authors found that 73% of respondents expect that the creation of new districts will increase the quality of publicly provided services.Footnote 29 Naturally, citizens’ expectations that new districts will improve the quality of services do not necessarily mean that this is the case—indeed, much anecdotal evidence exists to the contrary. However, when considering the determinants of rapid administrative unit proliferation, the expected benefits for citizens are what influence ex-ante demand.
Political, symbolic (ethnic), and material marginalization are the study's key explanatory variables. To measure political marginalization at the county level, we look at the extent to which a county is represented on the district's key resource allocation body. Specifically, we calculate the ratio of a country j’s share of seats on the DEC to its population share in election wave t (DEC share ratio). We note that our results are robust to an alternative specification that simply uses the share of seats a county has on the DEC, controlling for its population size. We measure ethnic marginalization using an indicator that takes the value of one if and only if the largest ethnic group in county j in election wave t is different than the largest ethnic group in the larger district (that includes county j and other counties).
Table 2 provides descriptive statistics of the above measures broken down by the three split statuses (no split, mother, and splinter) and election waves. As Table 2 makes clear, in a given wave, counties that seceded from larger districts in the subsequent wave held a significantly smaller share of seats on the DEC and were two to three times more likely to be an ethnic minority. It is notable that the importance of political marginalization is much more pronounced in the first two election waves.
Political and Ethnic Marginalization by Electoral Wave

Since there is no reliable measure of GDP at the county level in Uganda, we use several proxies to measure each county's level of development. We operationalize development by grouping a number of related measures into a summary index, following Anderson (Reference Anderson2008).Footnote 30 This approach improves statistical power while being robust to overtesting because the summary index represents a single test. Moreover, summary indices minimize the risk that researchers cherry-pick certain measures as well as the risk that we misinterpret the importance of individual proxy measures that may be statistically significant simply due to chance. The development index combines three economic indicators with five indicators of service delivery inputs and outputs. The economic indicators are from 2002 census data and are (1) Non-poor, the share of county j residents that are not below the poverty line; (2) Paid employees, the share of adults who report being a “paid employee” in any sector; and (3) Non-agriculture employment, the share of county employees and self-employed residents in nonagricultural sectors.
The development index also includes five variables measuring the quality of social services. These include two output measures also from the 2002 census: (4) literacy, the share of adults reporting being literate; and (5) educational attainment, the share of adults with at least some secondary education. Measuring service delivery inputs is a more complicated task due to a dearth of reliable subdistrict budget data. To overcome this challenge, we use a unique GIS dataset of the location of all public schools and health clinics in Uganda from the Ugandan Bureau of Statistics and match each public school and clinic to its county. We use these data to generate three input variables, measured in number of service units per square kilometer:Footnote 31 (6) public primary school concentration; (7) public secondary school concentration; and (8) public health clinic concentration. Finally, we combine the economic indicators and the social service measures into a single development summary index. All eight variables are positively correlated with a Cronbach's alpha of 0.91. As Table 3 shows, splinter counties are, on average, more materially deprived than rump counties, whether measured using poverty, service delivery, or employment outcomes. That the level of social services is lower in splinter compared to rump counties is consistent with the fact that the latter control a disproportionate share of intradistrict resource allocation.
Level of Development by Electoral Wave

To examine these relationships more formally, we begin with fitting a series of random intercept multilevel models that take into account the panel structure of our data. Our basic model specification is
 \begin{equation}
y_{t\,j}= \beta _{0t} + \beta _{1}X_{1t\,j} + \beta _{3}t + e_{t\,j},
\end{equation}
 \begin{equation}
\beta _{0j} = \beta _{0} + \beta _{2}Z_{j} + u_{j},
\end{equation}
 \begin{equation}
y_{t\,j}= \beta _{0} + \beta _{1}X_{1t\,j} + \beta _{2}Z_{j} + \beta _{3}t + (u_{j} + e_{t\,j}),
\end{equation}
In model 2, we also control for time-varying political variables, including an indicator that takes the value of 1 if the majority of county j residents supported the losing candidate in the prior election for district chairperson, an indicator of whether the previous elections for district chairperson were contested, continuous variables measuring President Museveni's vote share in the past presidential election, and Museveni's vote share squared. In models 3–5 we add Zj , a vector of time-invariant sociodemographic controls that include log population size and ethnic fractionalization.Footnote 33 Model 5 includes continuous variables measuring the county's share of Bantu and Banyankole people—both identity groups of the president—which were previously found to be significant (Green Reference Green2010).
Results supporting H 1 are reported in Table 4 below. In all model specifications, the likelihood that a county secedes to form a new district is decreasing in its DEC share and in its level of development, and is increasing when a country's largest ethnic group is outnumbered by another group in its (former) district. In order to get a better sense of the magnitude of these effects, Figure 2 graphs the predicted probability that a county j became a new splinter district in electoral-wave (period) t, using model 4 of Table 4.
District Splits and Local Politics

Notes: Standard errors in parentheses. * p < 0.1, ** p < 0.05, *** p < 0.01. Table reports a series of random intercept logistic models in which the dependent variable indicates whether a county j became a new splinter district in electoral wave (period) t. All regressions include indicators for regions and electoral wave, with the central region and first wave (1996–2000) as the reference categories.
Figure Uses Model 4 to Graph the Relationship Between the Predicted Probability that a County j Became a New Splinter District in Electoral-Wave (Period) t Against its Level of Political Marginalization (Left) and Development Summary Index Score (Right).
Note: The fitted line and 95% confidence are derived from fractional polynomial regressions with two power terms.

Robustness Checks
We conduct four types of robustness checks. The first is a test of the robustness of the results to the usage of alternative proxy measures. The second test examines the sensitivity of the results to model specification, specifically to possible endogeneity of the county-level random effects. Third, we run separate random intercept logistic regressions for each wave rather than pool together observations from the three waves as in Table 4. Finally, we test the robustness of our results given possible spatial correlation not accounted for by the random effects models.
Table 5 reports results of robustness checks using alternative measures and the model specified above in Equation 3. In model 6, we proxy material marginalization using a social services summary index rather than the more aggregated development index. The social services index includes five input and output variables, described above, capturing the quality of the health and education sectors. All five variables are positively correlated, with a Cronbach's alpha of 0.85. In model 7, we use a different alternative measure of material marginalization, this time restricting ourselves to the three measures of economic wellbeing: share of non-poor, share of paid employees, and share of non-agricultural employment. We combined the three variables, which are positively correlated with a Cronbach's alpha of 0.85, into an economic activity summary index. In model 8, we use an alternative measure of control over local resources allocation, a county's share of seats on the DEC rather than the ratio of this measure to the county's share of the district's population. As Table 5 makes clear, our results are robust to the use of these alternative proxy measures.
Robustness Check I (alternative variables)

Note: Standard errors in parentheses. *p < 0.1, **p < 0.05, ***p < 0.01. Dependent variable: an indicator that takes the value of 1 if county j became a new splinter district in electoral wave (period) t. All models control for the number of counties in district and for lag of breakup status. Time-varying political controls include whether the county supported a losing candidate in the district chairperson (LC5) elections, whether those elections were opposed, Museveni's vote share in the prior election, and the quadratic of this vote share term. Demographic time-invariant controls include log of county's population and its ethnic fractionalization score, both derived from the 2002 census as well as regional indicators. An extensive table with coefficients for all control variables can be found in the Online Appendix.
We now turn to address possible endogeneity concerns. The multilevel random effect (intercept) model we use above offers greater flexibility and generalizability than fixed effects (FE) models, which do not allow for the estimation of time-invariant parameters. Such models are, however, commonly criticized for not meeting their key identification assumption that the residuals are independent of the included covariates. We thus follow Bell and Jones (Reference Bell and Jones2012), who offer a random effects solution to this endogeneity problem.Footnote 34 The solution, based on Mundlak (Reference Mundlak1978), simply adds the unit (county) mean to the model for each time-varying covariate, accounting for the between-county effect, and has the following functional form:
 \begin{eqnarray}
y_{t\,j}&=& \beta _{0} + \beta _{1}X_{t\,j} + \beta _{4}\bar{X}_{j} + \beta _{2}Z_{j} + \beta _{3}t\nonumber\\
&& +\, (u_{0j} + e_{0t\,j}),
\end{eqnarray}
 \begin{eqnarray}
y_{t\,j}&=& \beta _{0} + \beta _{1}(X_{t\,j} - \bar{X}_{j}) + \beta _{5}\bar{X}_{j} + \beta _{2}Z_{j} + \beta _{3}t\nonumber\\
&& +\, (u_{0j} + e_{0t\,j}).
\end{eqnarray}
Robustness Check II (demeaned variables)

Note: Standard errors in parentheses. *p < 0.1, **p < 0.05, ***p < 0.01. Dependent variable: an indicator that takes the value of 1 if county j became a new splinter district in electoral wave (period) t. All models control for the number of counties in the district and for lag of breakup status, whether the county supported a losing candidate in the district chairperson (LC5) elections, whether those elections were opposed, Museveni's vote share in the prior election, and the quadratic of this vote share term. Demographic controls include log of county's population and its ethnic fractionalization score as well as regional indicators. An extensive table with coefficients for all control variables can be found in the Online Appendix.
Finally, we test whether our main findings are robust to running separate regressions for each electoral wave; i.e., through different eras of Ugandan political development. As hypothesized, we find that political dominance and development levels are negatively correlated with district splits.Footnote 35 Importantly, we note that the decrease in the marginal effect of the development index over time is consistent with our theoretical argument, while also helping us understand the changing expectations of citizens and leaders over time. Finally, these regressions are also notable for the fact that the quadratic term on Museveni vote share is not robust across waves, which is consistent with the demand side of our theoretical argument. Results of those regressions are reported in Table 7.
Robustness Check III (Separate Regression for Each Wave)

Note: Standard errors in parentheses. *p < 0.1, **p < 0.05, ***p < 0.01. Dependent variable: an indicator that takes the value of 1 if county j became a new splinter district. All models control for the number of counties in the district, a lag of breakup status, whether the county supported a losing candidate in the district chairperson (LC5) elections, and whether those elections were opposed. Demographic controls include log of county's population, ethnic fractionalization score, and regional indicators. An extensive table with coefficients for all control variables can be found in the Online Appendix.
Robustness Check: Spatial Dependence
The above analyses do not preclude the possibility that a contagion effect or unobserved location-related effects are driving some of the variation in counties’ proclivities to split. While the REs and demeaned REs models above partially account for spatial dependencies by adding regional dummies, the inclusion of region indicators is a rather crude technique to account for spatial correlation. To address the possibility of spatial dependencies more rigorously, we test the robustness of our finding by adopting a solution proposed by Bhat and Sener (Reference Bhat and Sener2009), who propose a copula-based binary logit choice model for accommodating spatial correlation across observational units.Footnote 36 This technique allows us to use a direct maximum likelihood inference procedure for modeling the joint probability of choice across observational units. We provide a formalization of the homoskedastic version of the Bhat and Sener likelihood function in the Online Appendix. We find a positive but weak spatial correlation: a likelihood ratio test fails to reject the null hypothesis that spatial correlation is equal to zero (p value = 0.13). As the spatial correlation is weak, the results of the spatial regressions are very similar to ones obtained using the more parsimonious REs models.Footnote 37
Electoral Incentives Faced by the Central Government
What are the electoral implications of the central government's approval of new administrative units? We expect (H 2) that where the incumbent president agrees to supply new districts, he will be rewarded with increased electoral support. We provide both qualitative and quantitative evidence that the creation of new districts represents an alliance between the national executive and citizens and elites from marginalized outlying localities.
Museveni Vote Share and District Creation

Note: Standard errors in parentheses. *p < 0.05, **p < 0.01, ***p < 0.001. Dependent variable: President's Museveni's vote share in county j in the elections following wave t. Columns (A) and (B) report results from fixed effects regressions, whereas columns (C) and (D) report demeaned random effects models that correct for possible correlation between the error term and covariates and column (E) is a dynamic panel model that accounts for dependent and independent variable lags. σ u refers to between county variability, σ e is the estimated standard deviation of the overall error term.
As for elites in outlying areas, it is notable that the ruling party has captured most elected leadership positions in newly created districts—even in areas traditionally dominated by the opposition. Consider the case of the new district Serere, which split away from Soroti district in 2010. Serere's interim chairman, Joseph Opit, a former member of an opposition party, the Forum for Democratic Change (FDC), joined the NRM after successfully leading the mobilization for a new district in Serere.Footnote 38 Similarly, Alex Onzima, the longest serving MP in West Nile region and previously a member of the opposition, crossed to the NRM in 2010 on the day that his constituency, Maracha county, was granted district status. He announced his decision to switch parties (along with several other former FDC supporters) at the inauguration of the new district, where President Museveni was the chief guest.Footnote 39 These cases of party crossing illustrate our argument that the study of administrative units proliferation must account for the nature of alliances between certain local actors (those from outlying areas) and the national executive.
There is also a good deal of qualitative evidence consistent with our argument that the central government's position on district proliferation is guided by electoral considerations and awareness of the policy's popularity in certain areas. For example, according to a widely popular district chairperson, “the government is under pressure to approve requests for districts, since it is very popular. The government is very afraid to upset voters” (interview with authors, April 2009). Similarly, a district councilor in the east argued that, “the government is trying to please everyone. If the people are given a new district, they will give (the ruling party) their vote” (interview with authors, March 2009).
To test the national executive's electoral incentives hypothesis more explicitly, we fit a set of panel data regressions starting with the following basic specification:Footnote 40
 \begin{eqnarray}
y_{t\,j}&=& \beta _{0} + \beta _{1}X_{1t\,j} + \beta _{3}t + (u_{j} + e_{t\,j}) \nonumber\\
j&=&1 \ldots\,N \qquad t=1\ldots\,T
\end{eqnarray}
In the first two columns of Table 8 we report findings from fixed effects specifications.Footnote 41 In column (A) we report the base model, and in model (B) we add a lag of breakup status. In columns (C) and (D) we report within county estimates derived from demeaned REs models that allow us to control for contextual variables while correcting for possible correlation between the error terms and covariates, following Bell and Jones (Reference Bell and Jones2012), described above. In model (C) we fit a demeaned base model with no controls; in model (D) we add a categorical variable measuring the dominant ethnicity in county j to control for ethnic voting (Conroy-Krutz Reference Conroy-Krutz2013). Finally in model (E) we report linear dynamic panel-data estimation that accounts for the lag of the dependent variable as well as for lags of the key independent variables.
Across all specifications there is rather robust evidence that elevating marginal counties to a status of a district in a given interelection period leads to a significant increase in Museveni's vote share in those counties in the next presidential elections. Importantly, we also do not find evidence that Museveni suffers vote loss in rump counties—those that lost “splinter” counties in the period leading up to the presidential elections. In addition, this evidence does not suggest that the timing and location of district creation is supplied by the central government in a manner that aims to selectively target swing areas.Footnote 42 Instead the data seem to be more consistent with the notion that democratization processes in Africa are nudging ruling parties to address demand pressures from the rural majority, creating incentives that countervail long-standing urban bias. Specifically, central governments with weak capacity have particularly strong incentives to be responsive to popular demands where executive action is visible and verifiable, so that voters can attribute change to incumbents as the basis for an implicit reciprocal exchange (Mani and Mukand Reference Mani and Mukand2007; Keefer and Vlaicu Reference Keefer and Vlaicu2008). Museveni's government appears to have embraced a policy of district formation, at least in part because it meets those criteria.
ADMINISTRATIVE UNIT PROLIFERATION AND RECENTRALIZATION OF POWER
We complete our empirical analysis by examining evidence for our claim that administrative unit proliferation influences intergovernmental balance of power. While it is difficult to explicitly link these changes with district creation, our aim here is to build a sufficiently strong case to stimulate future research about this important potential implication of administrative unit proliferation. Building on Falleti (Reference Falleti2005), we operationalize intergovernmental power using three dimensions: (1) fiscal dependence, the extent to which local governments depend on the center to finance their activities; (2) administrative autonomy, the degree of autonomy of subnational officials in designing and implementing local policy; and (3) political dependence, whether subnational officials are elected or appointed by the center. We find ample evidence suggesting that along these three dimensions, districts in Uganda have lost power relative to the central government. The basic sequence of events in Uganda is consistent with our expectation that the rapid proliferation of districts diminished their bargaining power, contributing to a de-facto recentralization of fiscal, political, and administrative powers.
A clear indicator of fiscal independence is the share of local government revenue that is locally raised, since local governments can spend such revenues as they see fit. In the 1990s, districts in Uganda raised the vast majority of local revenue from what was known as the graduated tax. However, in 2001, after the first large wave of district splits, the per-capita amount of this tax that districts could collect was substantially limited. In 2005, amidst the second wave of splits and despite strong opposition from local government officials, the central government eliminated the graduated tax entirely. Cammack, Golooba-Mutebi, Kanyongolo and O'Neil (Reference Cammack, Golooba-Mutebi, Kanyongolo and O'Neil2007, 34) have argued that “The abolition (of the graduated tax) has virtually paralyzed local governments, which depended on it for general administration . . . districts are unable to service their debts, pay pensions and gratuity, hire new staff and, perhaps worst of all, pay the wages of locally recruited personnel.” As a result of the abolition of the graduated tax, districts now rely overwhelmingly on transfers from the central government; about 90–95% of districts’ revenues stem from central government transfers.Footnote 43
Administrative unit proliferation also coincided with significant loss of districts’ policy autonomy. Here we focus on two measures. First is the share of the overall central government annual budget allocated to districts. We assume that local governments strongly prefer that their budget share be as large as possible. It is noteworthy that diminished district share of the budget does not necessarily indicate reduced relative spending in localities, since the central government may spend in localities directly out of its own budget; doing so increases the center's control over how funds are spent and allows it to take credit for local projects and programs. In contrast, localities strongly prefer that programs, projects, and services in their jurisdiction be financed through their own budgets, even if the funding originates from a central government transfer. As Figure 3 makes clear, districts’ share of the national budget has declined steadily since the mid-2000s.Footnote 44
Districts’ Share of National Budget (2003–2011).
Notes: Figure provides information on the share of the national budget that is allocated to districts (2003–2011). Source: World Bank, Uganda country office.

The loss of districts’ policy autonomy is further evidenced by examining the changing portion of central government transfers to districts that is earmarked. Local governments, naturally, have an incentive to keep the earmarked share of central government transfers as small as possible. In contrast, the center's control increases with the earmarked portion of its transfers to local governments. As Figure 4 shows, the share of central government transfers that is unconditional (i.e., not earmarked) has significantly declined over time. This pattern is highly suggestive of weakening local intergovernmental bargaining power.
Central Government Transfers (1997–2009).
Notes: Figure provides information on the share of the central government transfers to districts that is not earmarked. Unconditional grants, unlike earmarked transfers, can be spent as the local government sees fit. Source: World Bank, Uganda country office.

Turning to political dependence, in recent years local government officials are increasingly appointed by the center, rather then being elected. Most dramatically, a 2008 amendment to the Local Government Act stripped from the directly elected District Chairperson the power to appoint the Chief Administrative Officer (CAO) and other senior level administrators. Instead the central government's Public Service Commission was granted the power to appoint senior level administrators, who are assigned to districts by the Ministry of Local Government. The 2008 amendment has, in effect, put the entire technocratic arm of the district under the purview of the central government rather than the district's elected political leadership. Further, the Local Government Act amendment disbanded tender boards comprised of local elected officials while creating, instead, a new committee to award local government contracts, composed of administrative and technical personnel and chaired by the CAO (Manyak and Katono Reference Manyak and Katono2009).
Furthermore, there exists considerable evidence that these changes have led to diminished district administrative capacity. As Cammack, Golooba-Mutebi, Kanyongolo and O'Neil (Reference Cammack, Golooba-Mutebi, Kanyongolo and O'Neil2007, 34) explains in describing the recentralization of power and resources in Uganda, “(L)ocal governments are unable to provide counterpart funding where donor-funded projects require them to do so, or even monitor and supervise the activities of lower-level staff and local project implementation.” Under such conditions, it is unlikely that localities can effectively provide services. For example, the Economic Policy Research Centre found in its study of drug delivery mechanisms in Uganda that, “Within the newly created districts, the weak institutional and human resource capacities have compromised the procurement, distribution and use of medicines.” They explicitly linked the weakened capacity with district creation, arguing that, “Uganda needs to put a break on the proliferation of districts” (EPRC 2010, xi).
In sum, we hold that the above changes amount to a transfer of intergovernmental power into the hands of the central government, a pattern also observed by other experts on Uganda (Tripp Reference Tripp2010; Awortwi Reference Awortwi2011). We note that our theoretical claims are agnostic about—and our empirical evidence cannot distinguish—whether or not Uganda's central government intentionally sought this recentralization when granting numerous new districts. As we demonstrated above, the central government had good reasons to approve new districts, even without the potential for change in intergovernmental balance of power. Further, recall from the survey evidence above that most Ugandan citizens believe that the creation of new districts will improve the quality of public services. This finding lends support to our claim that citizens’ expectations of such concrete improvements outweighs more abstract concerns about the potential for a loss of relative power vis-à-vis the center.
CONCLUSION
Since the late 1980s, key players in the international development community—such as the World Bank and USAID—have encouraged developing countries to implement far reaching decentralization reforms. A rapid proliferation of subnational administrative units has often followed or accompanied these reforms. Even though such unit proliferation can substantially alter a country's political landscape at the local levels and beyond, our understanding of the causes and implications of this phenomenon has been quite limited.
Existing studies on the determinants of administrative units proliferation focus primarily on the incentive of national political elites to instigate it and to do so in a manner that benefits their career or kin. However, by focusing on the central government's incentive to increase its patronage network or fragment the power of the opposition, past studies have had a hard time explaining the timing of splits, as well as why voters would broadly reward wasteful patronage. In addition, studies that conceive district formation as a top-down political process assume that the boundaries of local units, be they states, provinces, or districts, can be easily manipulated by the center at its whim. In reality, in democratizing countries the support of some local actors is typically needed in order to implement local governance reforms.
This article focuses, instead, on the importance of intradistrict heterogeneity, and especially on the confluence of interests between elites and citizens from marginalized outlying areas and the national executive. By doing so, this study is able to identify the local political dynamics that enable and encourage district splits as well as to account for the significant electoral boost to the incumbent president that occurs in newly formed districts. Moreover, our theoretical focus on the role that political, economic, and symbolic forms of marginalization play in local political dynamics is better positioned than past work to account for the dynamic process underlying the expansion of administrative units over time.
This study also makes several methodological contributions to the nascent administrative proliferation literature. Existing studies use an estimation strategy that makes it hard to account for intradistrict heterogeneity. By shifting the level of analysis from districts to subdistricts (counties), we are able to account for the conditions that bring about local demand for district splits. This shift allows us to demonstrate that, contrary to prior work's findings, marginalization of certain outlying areas fuels the demand to form new administrative units. In addition, this article offers a method for addressing spatial dependencies that can be applied beyond the study of administrative unit proliferation.
Though our study focuses primarily on the determinants of administrative unit proliferation, we also offer a theoretical framework and empirical evidence suggesting that when decentralization reforms are accompanied by district creation, the result may be a change in the intergovernmental balance of power that favors the central government. This is because newly created administrative units have low bargaining power and tend to be highly dependent on the center for resources, planning, and service delivery. Recent accounts of other African countries where decentralization has coincided with administrative unit proliferation, such as Nigeria (Okojie Reference Okojie2009) and Ethiopia (Chanie Reference Chanie2007), suggest similar political development patterns.
What are the policy implications of our findings? The article suggests that proponents of decentralization reforms should be wary of administrative unit creation, and perhaps more cognizant of the relationship between decentralization reforms and the pressure to create new administrative units. On one hand, district formation creates more homogenous administrative units, which is associated with better local service provision. In addition, the recentralization of fiscal authority may play a fundamental role in state building in countries that have suffered from instability, as Diaz-Cayeros (Reference Diaz-Cayeros2006) argues in the case of 20th century Mexico. On the other hand, we provide suggestive evidence that in Uganda, district proliferation resulted in the weakening of local governments’ capacity. Several analysts on Uganda have also voiced concern that the creation of new districts generates unnecessarily burdensome administrative costs and destabilizes interethnic relations (Green Reference Green2008).Footnote 45
Whether these dynamics result in net improvements in the level and quality of public goods and social services is a key open question for future study. We note that while there has been substantial work on how certain decentralization reforms and intergovernmental politics in developing countries influence national macroeconomic outcomes (Wibbels Reference Wibbels2000), there is a dearth of evidence regarding the effect of district creation on economic development and on the provision of local public goods and social services. Future work should also explore the conditions under which administrative units proliferation is more or less likely to accompany decentralization reforms. Notwithstanding the causal identification challenges that such analyses might face, we believe that addressing these gaps is of great importance if we are to fully understand how administrative unit proliferation mediates decentralization reforms and influences human welfare.
SUPPLEMENTARY MATERIALS
To view supplementary material for this article, please visit http://dx.doi.org/10.1017/S0003055413000567
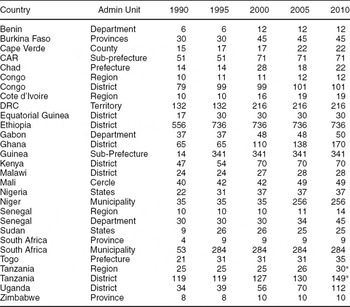
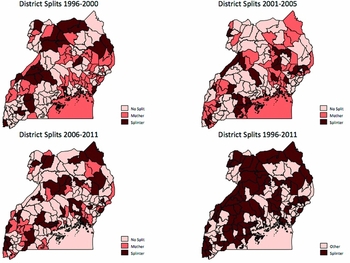
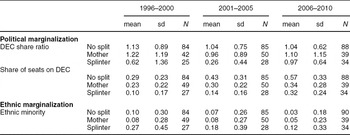
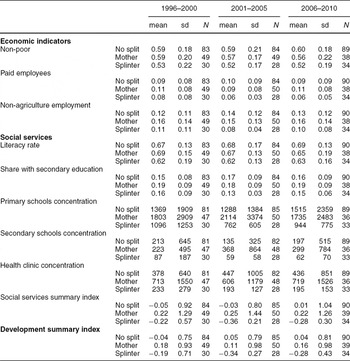
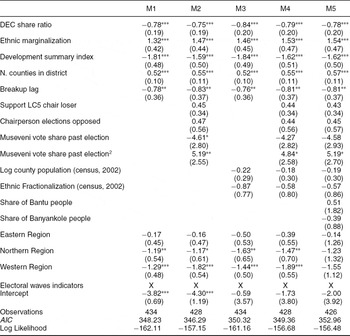
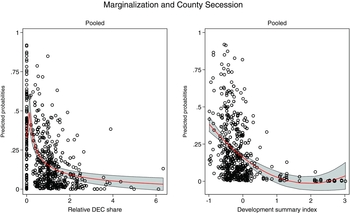
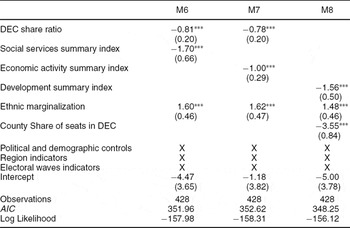
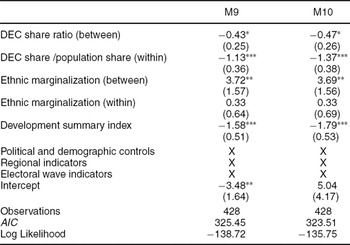
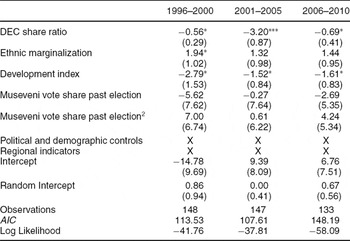
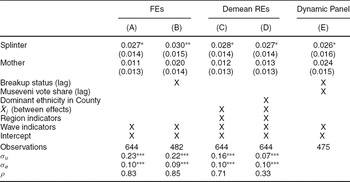
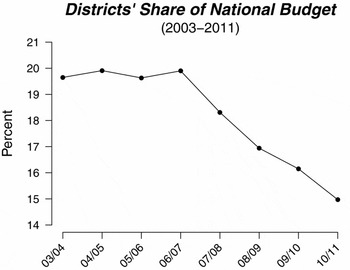
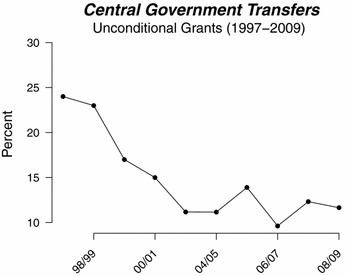




Comments
No Comments have been published for this article.