Introduction
Friction stir welding (FSW) is a most promising method of welding technology developed by a solid-state metal joining process and plays a crucial role in overcoming the shortcomings and the defects that are observed in the conventional fusion welding of high-strength aluminum alloys such as solidification cracks, slags, and porosity that are responsible for deterioration of weld joint properties [Reference Thomas, Nicholas, Needham, Murch, Templesmith and Dawes1, Reference Mishra and Ma2]. Aluminum and its alloys being light in weight and having low cost, high-level plasticity, malleability, and electrical or thermal conductivity are very widely and primarily used candidates for the structural parts in aircraft, automotive, and marine industries. Aluminum-based metal matrix nanocomposite (MMNC) fabricated with nanosized particles reinforcement has shown improvement in mechanical and tribological characteristics compared with aluminum alloys without reinforcement [Reference Yang, Lan and Li3, Reference GU4, Reference Carreño-Gallardo, Estrada-Guel, López-Meléndez and Martínez-Sánchez5]. In comparison with the unreinforced aluminum alloys, the bulk aluminum MMNC prepared by using SiCNP by ultrasonic dispersion fabrication method [Reference Yang, Lan and Li3] using the ball milling process with certain time period [Reference GU4, Reference Carreño-Gallardo, Estrada-Guel, López-Meléndez and Martínez-Sánchez5] shows improvement in ultimate tensile strength (UTS), yield strength (YS), and hardness in the MMNC. The composites prepared by ball milling and powder metallurgy (PM) technique with certain fixed wt% of SiC result in better metallurgical and mechanical properties [Reference Carreño-Gallardo, Estrada-Guel, López-Meléndez and Martínez-Sánchez5, Reference Min6, Reference Ma, Li, Liang, Zheng, Bi and Tjong7]. The fabrication of MMNC by PM and ball milling process [Reference GU4, Reference Carreño-Gallardo, Estrada-Guel, López-Meléndez and Martínez-Sánchez5, Reference Min6, Reference Ma, Li, Liang, Zheng, Bi and Tjong7, Reference Rahimian, Parvin and Ehsani8, Reference Rahimian, Ehsani, Parvin and Baharvandi37] which consist of pressing, sintering, and mixing of nanoparticles to the base metal powder is a lengthy and energy-consuming process. In the casting, a liquid metallurgy technique [Reference Rahimian, Parvin and Ehsani9, Reference Kawabe, Oshida, Kobayashi and Toda10] reports the defects due to agglomeration and clustering of nanoparticles [Reference Yang, Lan and Li3], inhomogeneous dispersion of ceramic particles of nanosize in the liquid metal due to poor wettability, and the thermal expansion (TE) difference between the reinforcement macro-/nanoparticles and molten metal matrix.
Several studies [Reference Don-Hyun, Yong-Il, Dae-Up and Seung-Boo11, Reference Akramifard, Shamanian, Sabbaghian and Esmailzadeh12, Reference Wang, Shi, Liu, Li and Li13, Reference Dolatkhah, Golbabaei, Givi and Molaiekiya14, Reference Azizieh, Kokabi and Abachi15, Reference Sathiskumar, Murugan, Dinaharan and Vijay16] report about the production of metal matrix composites (MMC) by friction stir processing (FSP). In all of these works, the composites were successfully fabricated by FSP on the metal surface but not focusing on joining. Many of the studies [Reference Abbasi, Abdollahzadeh, Bagheri and Omidvar17, Reference Bahrami, Dehghani and Givi18, Reference Tabasi, Farahani, Givi, Farzami and Moharami19, Reference Liu, Hu, Zhao and Fujii20, Reference Byung-Wook, Don-Hyun, Yong-Hwan and Seung-Boo21, Reference Pantelis, Karakizis, Daniolos, Charitidis, Koumoulos and Dragatogiannis22, Reference Sun and Fujii23, Reference Hamdollahzadeh, Bahrami, Nikoo, Yusefi, Givi and Parvin24, Reference El-Rayes and El-Danaf25, Reference Bahrami, Givi, Dehghani and Parvin26, Reference Salehi, Saadatmand and Mohandesi27] also report on fabricated MMC specimens via FSW by incorporating micro- and nanoparticles into the rectangular section edge groove of definite size between the two adjoining plates. FSW parameters such as tool rotation and traverse speed, tool geometry, and the number of FSW pass play a very important role in the homogeneous dispersion of nano or microsized particles in the weld nugget zone (WNZ) of FSW joints. Abbasi et al. [Reference Abbasi, Abdollahzadeh, Bagheri and Omidvar17] investigated the effect of tool rotation and traverse speeds in joining AZ31 magnesium alloy using FSW technique and by reinforcing the SiC particle of 55 µm in size into the plates having a groove in the adjoining faces, and report that the selection of proper FSW parameter condition leads to homogeneous dispersion of reinforcement in the WNZ. Bahrami et al. [Reference Bahrami, Dehghani and Givi18] in their investigation on the effect of reinforced SiCNP of size 45–65 nm with FSW single pass in fabricating FSW joint of 7075-O aluminum plates report that the high rotation speed, 1250 rpm, and traverse speed, 40 mm/min, result in fine dispersion of SiCNP and produce 31% superior UTS of FSW joint with SiCNP compared with the joints without SiCNP. Further, they report that an increase in UTS was a result of the pinning effect and increased nucleation sites caused by the inclusion of SiCNP. Similarly, Tabasi et al. [Reference Tabasi, Farahani, Givi, Farzami and Moharami19] report the effect of tool rotation speeds and traverse speeds on the fabrication of MMCs at the WNZ using FSW technique and by reinforcing SiCNP in between the adjoining surface of dissimilar alloy joints of AA7075 and AZ31 magnesium. Many studies [Reference Byung-Wook, Don-Hyun, Yong-Hwan and Seung-Boo21, Reference Pantelis, Karakizis, Daniolos, Charitidis, Koumoulos and Dragatogiannis22, Reference Sun and Fujii23, Reference Hamdollahzadeh, Bahrami, Nikoo, Yusefi, Givi and Parvin24, Reference El-Rayes and El-Danaf25] also report the effect of the number of FSW passes on the microstructure and mechanical properties of FSW joints fabricated with reinforcing particles at the WNZ. Byung-Wook et al. [Reference Byung-Wook, Don-Hyun, Yong-Hwan and Seung-Boo21] report that in producing SiC/AA5083 composites, the SiC particles were more uniformly distributed in the second pass compared with the first pass and pinning effect by SiC particles results in smaller grain size at WNZ. Similarly, Pantelis et al. [Reference Pantelis, Karakizis, Daniolos, Charitidis, Koumoulos and Dragatogiannis22] and Sun et al. [Reference Sun and Fujii23] also report the effectiveness of higher number of pass on the uniform distribution of nanosized particle reinforcement at the WNZ and higher UTS, % elongation, and hardness at the WNZ compared with the FSW joints fabricated with a single pass. Contrary to the study on FSW second pass [Reference Byung-Wook, Don-Hyun, Yong-Hwan and Seung-Boo21, Reference Pantelis, Karakizis, Daniolos, Charitidis, Koumoulos and Dragatogiannis22, Reference Sun and Fujii23], Hamdollahzadeh et al. [Reference Hamdollahzadeh, Bahrami, Nikoo, Yusefi, Givi and Parvin24] report that FSW second-pass-processed specimen results in inferior UTS and in an increase in the grain size compared with specimen prepared with FSW first pass. Further, they report that such a contradiction was due to the dominating “heat input” over the “pinning effect” by the SiC particles.
The literature review revealed that many investigations focus on obtaining FSW joints by introducing fixed concentration of reinforcement nano-/microparticles to develop composites at the WNZ and the role of relevant FSW parameters on the distribution of reinforcement particles. In the present study, the investigation is on the effect of varying percentage volume fractions of SiCNP reinforcement on the microstructure and mechanical properties of FSW joint specimens, although the recommendations were made from previous research [Reference Abbasi, Abdollahzadeh, Bagheri and Omidvar17, Reference Bahrami, Dehghani and Givi18, Reference Tabasi, Farahani, Givi, Farzami and Moharami19, Reference Byung-Wook, Don-Hyun, Yong-Hwan and Seung-Boo21, Reference Pantelis, Karakizis, Daniolos, Charitidis, Koumoulos and Dragatogiannis22, Reference Sun and Fujii23] suggesting the improvement in microstructure and mechanical properties for the fixed concentration of reinforcement. Nonetheless, the studies on the actual volume fraction of SiCNP after the FSW single pass (V fp) and actual volume fraction of SiCNP after the FSW second pass (V sp) in the MMNC considering the area of WNZ and its effect on microstructure and mechanical properties of fabricated FSW dissimilar joints were found to be scant. Accordingly, in the present study, an experimental investigation has been carried out to study the effect of varying vol% fractions of SiCNP at the WNZ in joining two dissimilar precipitation hardenable alloys 2024-T351/7075-T651 by FSW technique using the first pass and second pass, and its microstructural and mechanical properties have been investigated and compared with FSW dissimilar joint specimens prepared without the addition of SiCNP.
Results and discussion
Macro- and microstructure observation
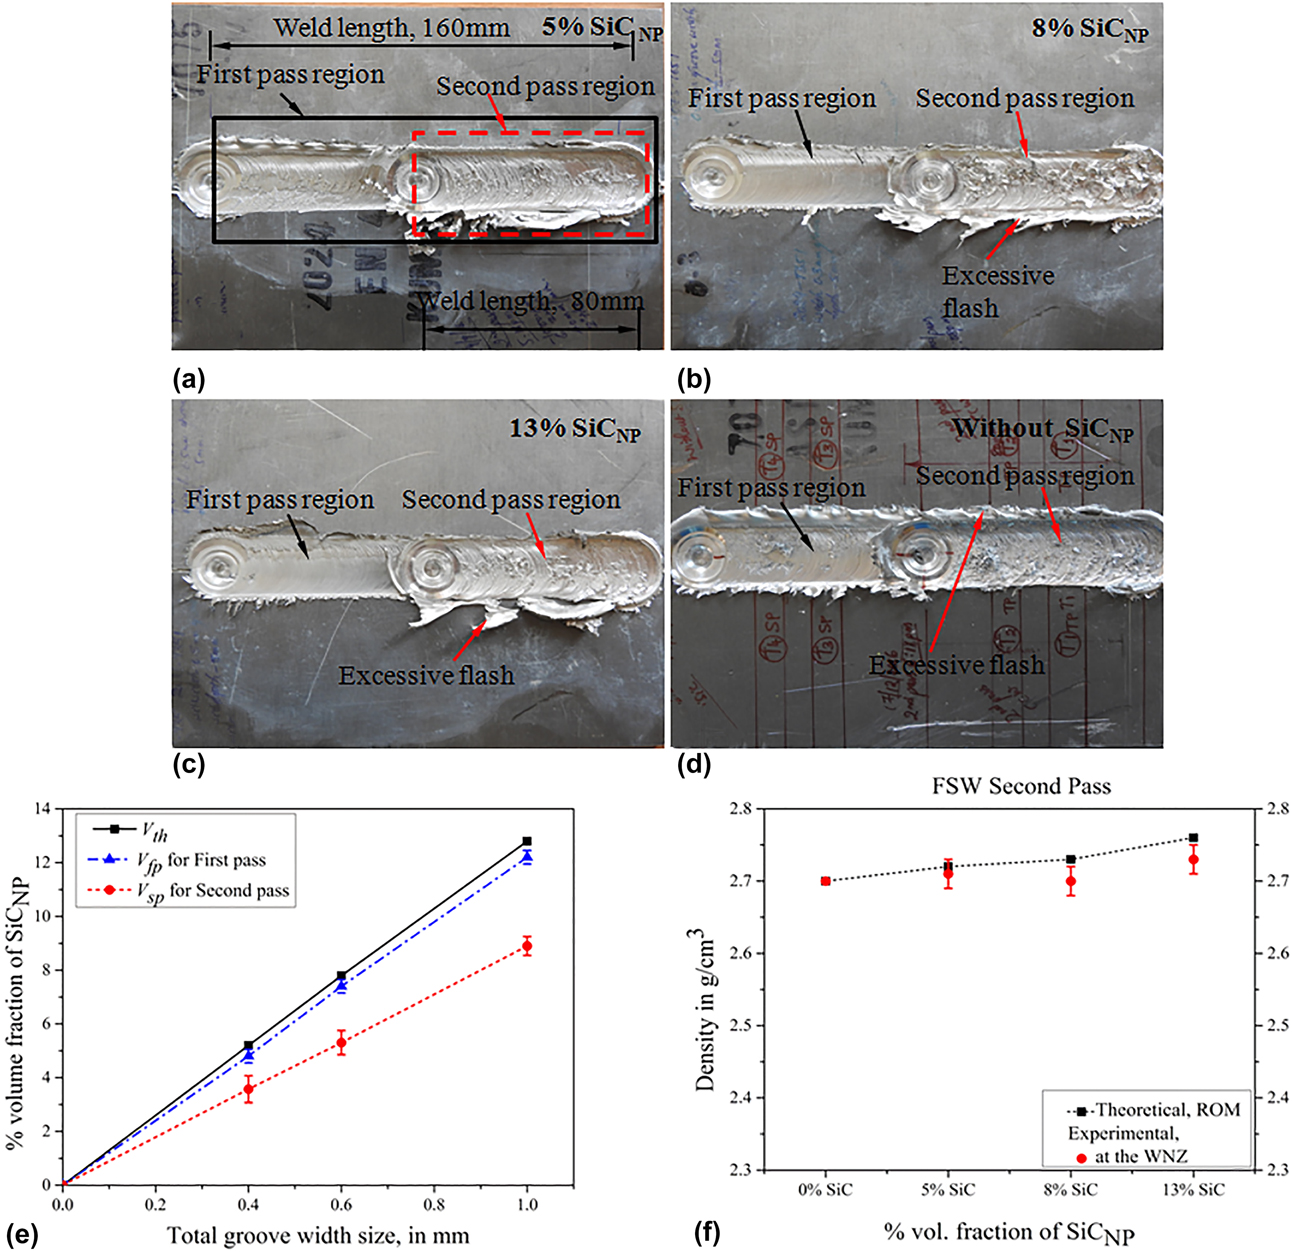
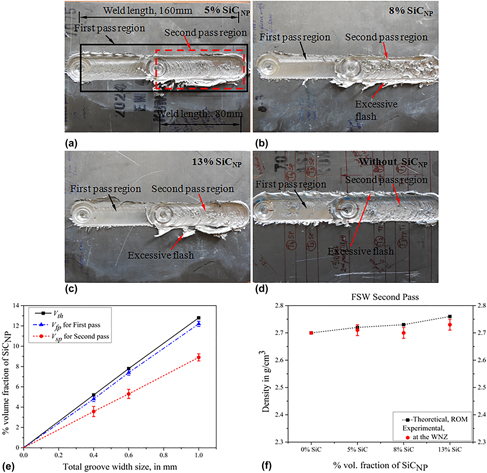
Referring to Figs. 1(a)–1(d), the surface morphology of the weld crown for the FSW first pass in all the experimental trials are evidenced with moderate flash, whereas the FSW second pass observes an excessive flash. The reason for excessive flash during the second pass was due to the increase in plunge depth from 6.20 mm of the FSW first pass to 6.30 mm in the second pass. In addition, the reversal in the rotation direction of the tool leads to an excessive flash on the weld crown.
(a)–(d) Photographs showing the surface morphology of FSW dissimilar joints with varying % volume fractions of SiCNP reinforcement. (e) Comparison of the V th with V fp, and V sp, after FSW processing. (f) Comparison of the density of the FSW specimen as a function of varying vol% fractions of SiCNP at the WNZ for the FSW second pass.

Effect of varying percentage volume fractions of SICNP on the weld nugget zone of MMNC for FSW first and second pass experiment
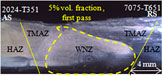
Table I presents the optical macrograph of the cross section of the weld region of the FSW dissimilar joint specimens produced with the varying vol% fractions of SiCNP (0, 5, 8, 13%) reinforcement at the WNZ and after performing the FSW first pass and second pass process. The macrographs exhibit the typical characteristics of FSW process consisting of WNZ, which experiences intense plastic deformation due to rotating FSW tool and consists of the highly recrystallized grain structure [Reference Mishra and Ma2, Reference Seighalani, Givi, Nasiri and Bahemmat28, Reference Mishra and Ma29, Reference Palanivel, Mathews, Murugan and Dinaharan35]. The thermomechanically affected zone (TMAZ) experiences both temperature and deformation during FSW but recrystallization does not occur at TMAZ. The heat-affected zone (HAZ) experiences only the thermal cycle because of the FSW process and does not contain any plastic deformation and grain refinement [Reference Mishra and Ma2]. It is evident from Table I, that the FSW specimen produced for FSW first pass and second pass observes the different shape of the WNZ. The FSW first pass observes defects caused by the agglomeration of SiCNP at some regions of the WNZ. In the FSW second pass, the WNZ of all the FSW joint specimens is defect-free as a result of increased stirring effect coupled with the change in tool rotation direction. With the shift in the tool rotation direction from the first pass to the second pass, the AS in the first pass will be the RS in the second pass and this will help in the uniform distribution of SiCNP across the WNZ [Reference Dolatkhah, Golbabaei, Givi and Molaiekiya14]. However, the detailed analysis of the WNZ is carried out using SEM to investigate the presence of microscopic-level defects such as agglomeration of SiCNP and the presence of pores around SiCNP which will be discussed in the following section.
Macrograph images of the FSW dissimilar joint specimens showing the weld nugget area of MMNC for the varying vol% fractions of SiCNP reinforcement and without SiCNP for FSW first and second pass. The vol% fraction of SiCNP present at the WNZ after the FSW first and second pass is mentioned above the WNZ.
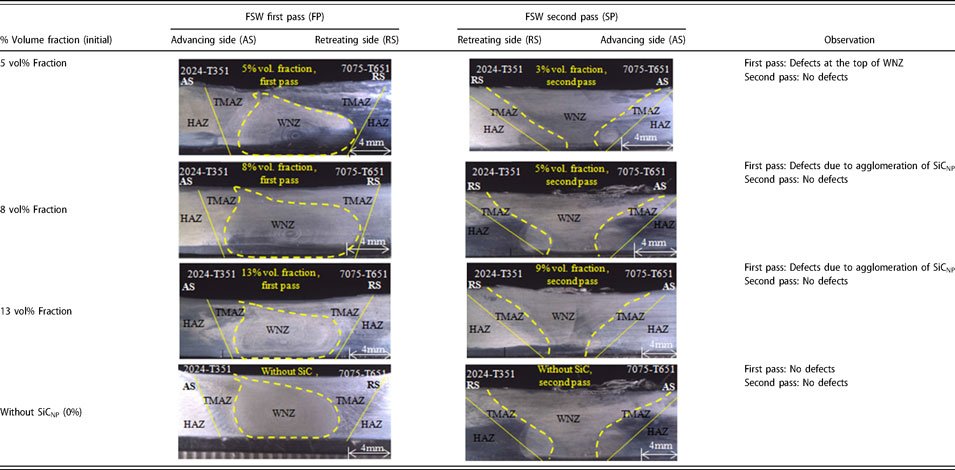
Further, it is observed from Table I that the WNZ for the FSW first pass appears to have the shape of the “onion ring” structure while the WNZ for the FSW second pass appears like “trapezoid” in shape. The FSW first pass and second pass influenced the area of WNZ, thereby changing the volume fraction of SiCNP in the WNZ. Sathiskumar et al. [Reference Sathiskumar, Murugan, Dinaharan and Vijay16, Reference Sathiskumar, Dinaharan, Murugan and Vijay30] in their study on the fabrication of surface composites report the theoretical and actual volume fractions of boron carbide (B4C) reinforcement present in the composite by measuring the area of composites for the various volume fractions of reinforcement. Similarly, in the present study the macrograph and SEM images of the WNZ for the FSW joint specimens produced with the varying vol% fractions of SiCNP are used to measure the actual volume fraction of SiCNP present at the WNZ using image analyzing software (ImageJ, National Institutes of Health, Bethesda, Maryland). The area of the WNZ considered for measuring the actual volume fraction of SiCNP for the FSW first pass and the second pass is shown in the dotted line in Table I. The area of WNZ is measured using the ImageJ software. In addition, the ImageJ analyses are carried out on the highly magnified SEM images of the WNZ for finding the actual volume fraction of SiCNP at the WNZ and compared with WNZ area calculation. The theoretical volume fraction (V th), actual volume fraction SiCNP at WNZ after FSW first pass (V fp), and actual volume fraction SiCNP at WNZ after FSW second pass (V sp) are computed as follows [Reference Sathiskumar, Murugan, Dinaharan and Vijay16, Reference Sathiskumar, Dinaharan, Murugan and Vijay30]:
 $$\eqalign{{\rm{Theoretical}}\;{\rm{volume}}\;{\rm{fraction}}\;\left( {{V_{{\rm{th}}}}} \right)\;{\rm{of}}\;{\rm{Si}}{{\rm{C}}_{{\rm{NP}}}} \cr= \left( {{{{A_{\rm{g}}}} / {{A_{\rm{P}}}}}} \right) \times 100\quad ,$$
 $$\eqalign{{\rm{Actual}}\;{\rm{volume}}\;{\rm{fraction}}\;{\rm{of}}\;{\rm{Si}}{{\rm{C}}_{{\rm{NP}}}}\;{\rm{at}}\;{\rm{WNZ}}\;{\rm{after}}\;\cr{\rm{FSW}}\;{\rm{first}}\;{\rm{pass}}\;\left( {{V_{{\rm{fp}}}}} \right) = \left( {{{{A_{\rm{g}}}} / {{A_{{\rm{fp}}}}}}} \right) \times 100\quad ,$$
 $$\eqalign{{\rm{Actual}}\;{\rm{volume}}\;{\rm{fraction}}\;{\rm{of}}\;{\rm{Si}}{{\rm{C}}_{{\rm{NP}}}}\;{\rm{at}}\;{\rm{WNZ}}\;{\rm{after}}\;\cr{\rm{FSW}}\;{\rm{second}}\;{\rm{pass}}\;\left( {{V_{{\rm{sp}}}}} \right) = \left( {{{{A_{\rm{g}}}} / {{A_{{\rm{sp}}}}}}} \right) \times 100\quad ,$$
 $$\eqalign{{\rm{Total}}\;{\rm{area}}\;{\rm{of}}\;{\rm{the}}\;{\rm{groove}}\;\left( {{A_{\rm{g}}}} \right) = {\rm{Total}}\;{\rm{groove}}\;{\rm{width}}\;\left( {{G_{\rm{w}}}} \right) \cr\times\,\, {\rm{Groove}}\;{\rm{depth}}\left( {{G_{\rm{d}}}} \right)\quad .$$
The projected area of the taper threaded tool pin (A p) in the calculation is equal to 39.16 mm2 which remains same irrespective of vol% fraction of SiCNP reinforcement in each groove. The calculated V th of SiCNP for each experiment varies because the total area of the groove (A g) size considered is of the different dimension in each experiment. The V fp is obtained by measuring the area of WNZ of the MMNC after FSW first pass (A fp). The V sp is obtained by measuring the area of WNZ of the MMNC after FSW second pass (A sp). The WNZ of the MMNC considered for FSW first pass, A fp, and FSW second pass, A sp, is shown by the dotted lines in Table I. The WNZ of the MMNC for FSW first pass was found to be ∼40 mm2 and it is almost same for all the vol% fractions of SiCNP (5, 8, 13%) reinforcement at the WNZ. The change in the vol% fraction of SiCNP at the WNZ did not have much influence on the area of WNZ of the MMNC. Similarly, the area of WNZ of the MMNC for the FSW second pass was found to be ∼56 mm2 and it is almost the same for all the vol% fractions of SiCNP reinforcement at the WNZ. Also, the results of V fp and V sp obtained from the Eqs. (2) and (3) are compared with the actual volume fraction measured from the SEM images of the WNZ from both the first pass and the second pass using ImageJ analysis software. These results are found to be in good agreement with the calculation done using Eqs. (2) and (3). Figure 1(e) shows the comparison of the actual volume fraction of SiCNP for V th, V fp, and V sp. As observed in Fig. 1(e), the decreasing trend in the vol% fraction of SiCNP from the FSW first pass to second pass is attributed to the corresponding increase in the area of WNZ of the MMNC from the FSW first pass to the second pass [Table I]. Considering the area of WNZ of MMNC [Table I] for each experimental case, the calculated V fp after performing the FSW first pass was found to be ∼5, ∼8, ∼13 vol% fraction and almost equal to V th. Similarly, considering the area of WNZ of MMNC after the second pass, the calculated V sp on the same specimen was ∼3, ∼5, and ∼9 vol% fraction.
In addition, an attempt is made to find the density of the MMNC at the WNZ using the rule of mixture (ROM) and compared with experimental data of the FSW joint specimen produced after FSW second pass. The ROM considers the properties (density or YS) of the composite as the volume weighted averages of the component properties assuming the components are noninteracting during deformation [Reference Scudino, Liu, Prashanth, Bartusch, Surreddi, Murty and Eckert42, Reference Wang, Qu, Scudino, Sun, Prashanth, Louzguine-Luzgin, Chen, Zhang and Eckert49]. The ROM describes the effect of varying vol% fractions of reinforcement on the properties of MMNC at the WNZ and is calculated as follows [Reference Scudino, Liu, Prashanth, Bartusch, Surreddi, Murty and Eckert42, Reference Wang, Qu, Scudino, Sun, Prashanth, Louzguine-Luzgin, Chen, Zhang and Eckert49, Reference Markó, Prashanth, Scudino, Wang, Ellendt, Uhlenwinkel and Eckert50]:
 $${P_{\rm{c}}} = {V_{\rm{m}}} \cdot {P_{\rm{m}}} + {V_{\rm{f}}} \cdot {P_{\rm{f}}}\quad ,$$
where P is the property (YS or density) of the material, V is volume fraction, and c, m, and f represent composite, matrix, and reinforcement at the WNZ. Figure 1(f) shows the comparison between the theoretically calculated densities using ROM of Eq. (5) with the experimental data. The Fig. 1(f) is plotted for the FSW second pass, which ensures homogeneous dispersion of SiCNP compared with FSW first pass. To find the experimental results, the specimens of equal dimensions are carefully extracted from the WNZ from each FSW joint specimens. In Fig. 1(f), the experimental density of the specimens with 5% SiCNP at the WNZ shows a relative density of 99% confirming homogeneous distribution of reinforcement at the WNZ during FSW second pass. However, the increase in the vol% fraction of SiCNP at the WNZ to 8 and 13% shows a decrease in the relative density to 98 and 97.5%, respectively. Increase in the vol% fraction of SiCNP leads to the inhomogeneous distribution of reinforcement and porosities are formed at the WNZ. These differences in the densities are validated by density measurement shown in Fig. 1(f). The particle density at the WNZ decides the mechanical behavior of the MMNC at the WNZ. The high particle density at the WNZ results in fine grains which exerts a strong pinning effect on the boundaries, hinders the grain growth, and helps in strengthening mechanism by dislocations moving along the boundaries of the grains which is the main densification mechanism [Reference Markó, Prashanth, Scudino, Wang, Ellendt, Uhlenwinkel and Eckert50, Reference Kumar, Yadav, Perugu and Kailas52]. On the other hand, a low particle density observed in Fig. 1(f) for the FSW joint specimen with high vol% of SiCNP (8, 13%) at the MMNC increases the porosity around the SiCNP, and this results in interface debonding between matrix-SiCNP leading to premature failure of the specimens [Reference Markó, Prashanth, Scudino, Wang, Ellendt, Uhlenwinkel and Eckert50].
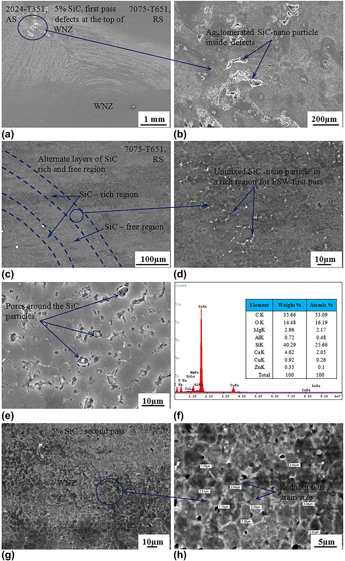
Figures 2(a)–2(e) show the SEM images of the FSW specimen fabricated after performing the FSW first pass and having 5 vol% fraction of SiCNP initially in the groove width of 0.4 mm at the WNZ. Figures 2(g) and 2(h) show the specimen after performing the FSW second pass on the same specimen. Figures 2(a) and 2(b) reveal the nonhomogeneous distribution of SiCNP for FSW first pass with agglomeration of SiCNP and defects are observed at the top of WNZ. The distribution of SiCNP at the WNZ depends on the number of passes [Reference Byung-Wook, Don-Hyun, Yong-Hwan and Seung-Boo21, Reference Pantelis, Karakizis, Daniolos, Charitidis, Koumoulos and Dragatogiannis22]. Further, in Figs. 2(c) and 2(d), the WNZ is distinguished by the presence of alternate layers of SiCNP-rich and SiCNP-free region. Also, these SiCNP-rich regions are surrounded by the SiCNP-free regions, indicating that the material stirring is incomplete during the FSW first pass [Reference Abbasi, Abdollahzadeh, Bagheri and Omidvar17, Reference Bahrami, Dehghani and Givi18]. In addition, the higher magnification SEM image [Fig. 2(e)] reveals SiCNP-rich region surrounded by pores at the WNZ. Thus, the inadequate stirring of the material during the FSW first pass results in porosities in the WNZ and leads to weak interface bonding between the SiCNP and the aluminum matrix. Bodaghi and Dehghani [Reference Bodaghi and Dehghani38], and Sun and Fujii [Reference Sun and Fujii23] report similar observation in their investigations and the presence of agglomeration of SiC particles during fabrication of FSW joints using FSW one pass. Further, they report that the difference in physical properties between the SiC and the base materials is the reason for the observation of pores around the particle. Considering Figs. 2(a) and 2(b), it is observed that during the FSW first pass, the SiCNP along with the material migrates towards RS of the WNZ, which exposes the material flow pattern during FSW and FSP [Reference Dolatkhah, Golbabaei, Givi and Molaiekiya14, Reference Tutunchilar, Haghpanahi, Givi, Asadi and Bahemmat31]. The EDS analysis shown in Fig. 2(f) confirms the presence of agglomerated nanoparticles in the SiCNP-rich region in the RS of the WNZ. In the FSW second pass, the tool rotation applied is in the opposite direction and results in more heat input, enhanced plasticized flow of material, severe plastic deformation, and continuous dynamic recrystallization (CDRX) in the WNZ [Reference Mishra and Ma2]. In the FSW, the grain refinement at the WNZ is achieved by the combined effect of CDRX mechanism and SiCNP reinforcement. The presence of SiCNP pins the grain growth and acts as an additional reason for dislocation generation [Reference Kumar, Yadav, Perugu and Kailas52]. As a result, at the WNZ new fine grains are formed which are strain-free grains [Reference Mishra and Ma2, Reference Kumar, Yadav, Perugu and Kailas52]. Comparing Figs. 2(a)–2(e), 2(g), and 2(h) at the WNZ, the change in the tool rotation direction and the FSW second pass results in the homogenous distribution of SiCNP at the WNZ. Thus, the pores observed around the SiCNP [Fig. 2(e)] during the first pass are not seen after the second pass. Many studies [Reference Byung-Wook, Don-Hyun, Yong-Hwan and Seung-Boo21, Reference Pantelis, Karakizis, Daniolos, Charitidis, Koumoulos and Dragatogiannis22, Reference Sun and Fujii23] report similar observations of improvement in particle distribution and properties of the FSW joints with the increase in the number of FSW pass. The average grain size of the FSW specimen with MMNC at the WNZ after performing the second pass is in the range 2–3.5 µm [Fig. 2(h)]. The SEM image in Fig. 2(h) reveals that the SiCNP is homogeneously distributed and occupies the grain boundaries along with the other precipitates. The presence of these nanoparticles placed along the grain boundaries helps in hindering the grain growth [Reference Azizieh, Kokabi and Abachi15].
SEM images showing the distribution of 5 vol% fraction SiCNP in the WNZ for FSW first pass (a) defects at the top of WNZ, (b) agglomerated SiC nanoparticles, (c) alternate layer of SiC-rich and SiC-free region, (d) magnified image of (c), (e) pores around SiC particles at the top surface of WN region, (f) EDS peaks of SiC-rich region, (g) homogeneous distribution of SiCNP after the FSW second pass, and (h) magnified image showing grain size range 2–3.5 µm.

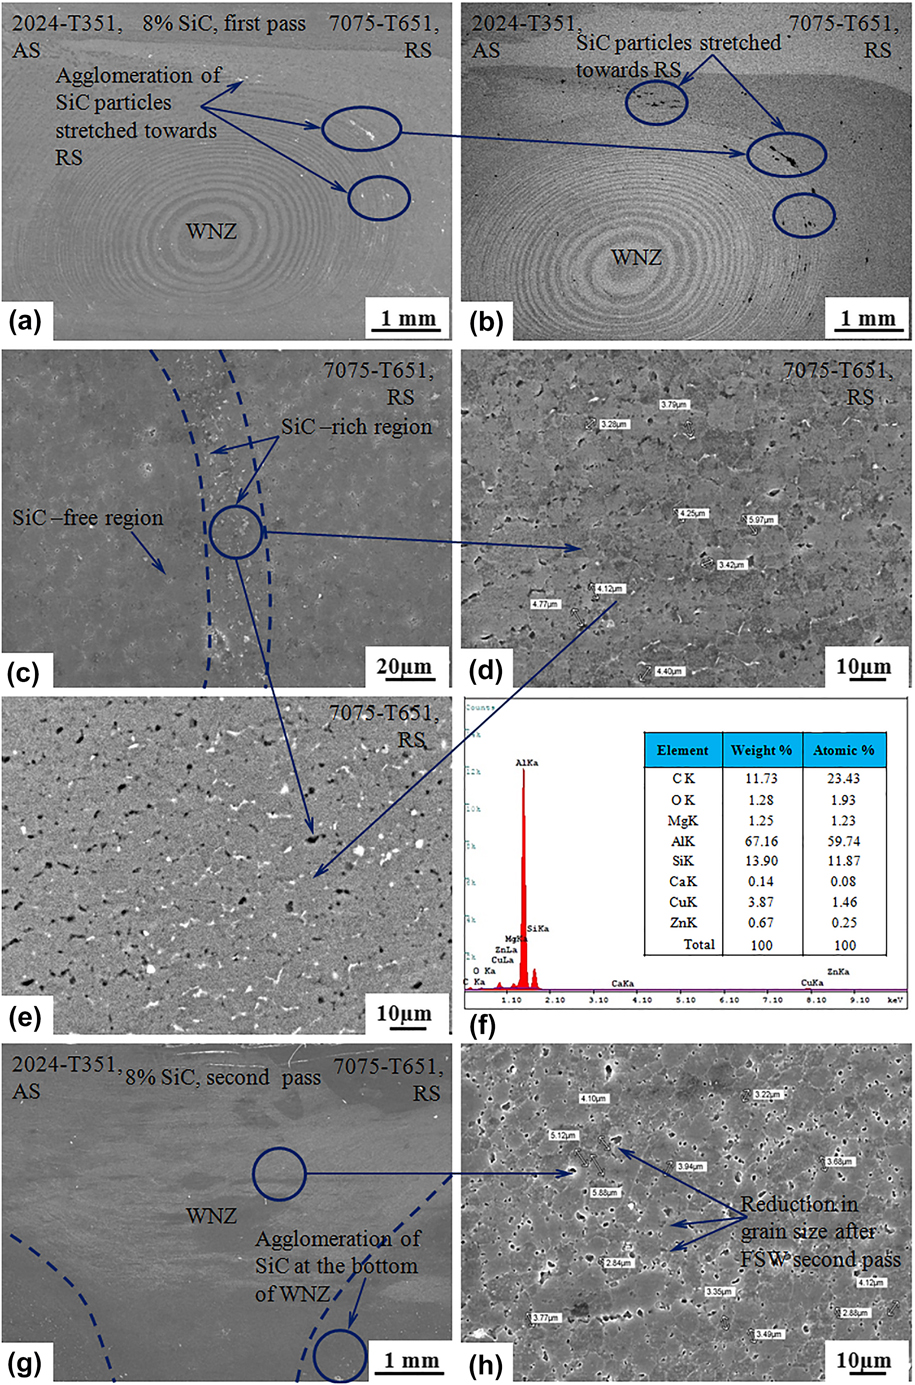
Figure 3 presents the SEM images of the FSW joint specimen produced after performing the FSW first pass and second pass having 8 vol% fraction of SiCNP at the WNZ. In Figs. 3(a) and 3(b), the SiCNP shows nonhomogeneous distribution, severe agglomeration of SiCNP at the RS and these reinforcements near the shoulder traveling towards the RS of the weld region. These SiCNP agglomerations at the RS and near the top regions of WNZ [Figs. 3(a) and 3(b)] are the result of part of the material being stretched towards RS due to the frictional shear force induced by the tool shoulder [Reference Tutunchilar, Haghpanahi, Givi, Asadi and Bahemmat31]. The observation is in good agreement with simulation and experimental investigation by Tutunchilar et al. [Reference Tutunchilar, Haghpanahi, Givi, Asadi and Bahemmat31]. The presence of SiCNP-rich and SiCNP-poor region is also observed in Fig. 3(c). The surface EDS analysis [Fig. 3(f)] shows the peaks of Si during the FSW first pass. Compared with the FSW first pass, the second pass results in more homogeneously distributed SiCNP at the WNZ [Fig. 3(g)] with an average grain size at the WNZ in the range 3–5 µm [Fig. 3(h)]. However, even after applying for the FSW second pass, some areas at the lower portion of the WNZ are found with the agglomerated SiCNP [Fig. 3(g)] surrounded by pores. The similar observation of agglomeration of SiCNP at WNZ was also reported by Pantelis et al. [Reference Pantelis, Karakizis, Daniolos, Charitidis, Koumoulos and Dragatogiannis22].
SEM images showing the distribution of 8 vol% fraction SiCNP in the WNZ for FSW first pass and second pass. (a) Agglomeration of SiC towards RS, (b) BSE image of (a), (c) alternate layer of SiC-rich and SiC-free region, (d) magnified image of (c), (e) BSE images of (d), (f) EDS peaks of SiC-rich region, (g) agglomeration at the bottom of WNZ after FSW second pass, and (h) magnified image of (g) showing reduction in grain size range 3–5 µm in the WNZ.

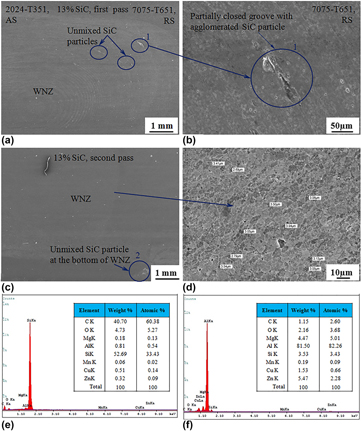
Figures 4(a), 4(b) and 4(c), 4(d) present the SEM images of the FSW specimen fabricated after performing the FSW first pass and second pass, respectively, with 13 vol% fraction of SiCNP at the WNZ. Comparing the SEM images of Figs. 3(a) and 4(a), it is found that the amount of agglomeration of SiCNP also increases owing to the increase in the vol% fraction of SiCNP and due to the insufficient stirring at the WNZ. As a result, a defect at the WNZ mainly towards the RS (marked as 1) was observed [Fig. 4(b)]. This indicates that as the amount of reinforcement particles increases, it leads to a higher flow stress for the composite materials and offers resistance to the flow of plasticized material from RS to the AS [Reference Sathiskumar, Murugan, Dinaharan and Vijay16]. Figure 4(e) documents this effect, showing EDS peaks of the SiCNP agglomerated region marked as 1 in Fig. 4(b). The FSW second pass helps in breaking of the reinforcement by the tool and results in the homogeneous distribution due to good stirring effects. However, Fig. 4(c) illustrates the presence of two distinct regions: middle of the WNZ where no agglomeration of particles was observed, and the lower portion of the WNZ (marked as 2) indicator of a nonhomogeneous distribution of the SiCNP with lack of stirring of the material. Figure 4(f) shows the EDS peaks of Si and confirms the presence of agglomeration of SiCNP at the lower portion of the WNZ (marked as 2). In addition, a good consolidation of Al/SiCNP composites at the WNZ can be seen from Fig. 1(f) for the FSW joint specimen produced with 5% SiCNP resulting in high particle density and in the fine grains [Fig. 2(h)]. On the other hand, the higher vol% of SiCNP (8, 13%) at the MMNC increases the porosity around the SiCNP and results in low particle density [Fig. 1(f)] and interface debonding between matrix and SiC [Figs. 3(g) and 3(h)] leading to premature failure of the specimens [Reference Markó, Prashanth, Scudino, Wang, Ellendt, Uhlenwinkel and Eckert50].
SEM images showing the distribution of vol% fraction SiCNP in the WNZ for (a) 13% SiC for FSW first pass and (b) partially closed groove. (c) FSW second pass specimen showing agglomeration at the bottom of WNZ, (d) reduction in grain size range 3–4 µm in the WNZ, (e) spot EDS analysis showing agglomeration for the region 1 of (b), (f) surface EDS for the region 2 of (c).

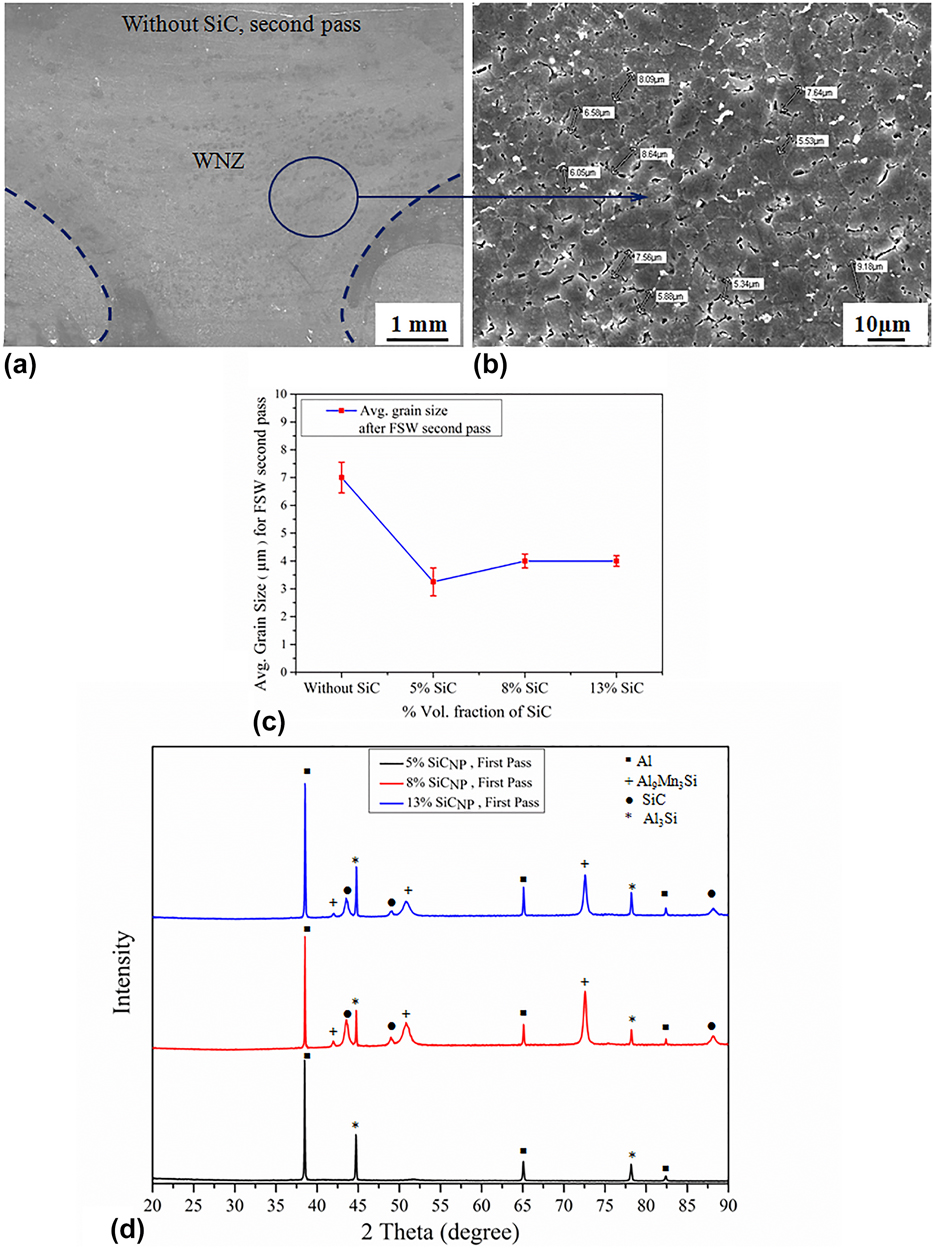
Figures 5(a) and 5(b) show the SEM images of the FSW second pass specimen produced without SiCNP (0%) and show an average grain size in the range between 6 and 8 µm. The increase in the grain size is attributed to the higher frictional heat generation during the FSW second pass accompanying with the lower traverse speed [Reference El-Rayes and El-Danaf25, Reference Khodir and Shibayanagi39] of 40 mm/min and a higher rotation speed of 1000 rpm. On the other hand, in the case of the experiment trials conducted for the fabrication of FSW specimen after the FSW second pass with the addition of SiCNP, although the heat generation is high, the presence of SiCNP reinforcement acts as an obstacle to the grain growth and grain boundary movement and results in decreased grain size range 2–3.5 µm. This shows that the addition of SiCNP and heat input have opposite effects on grain size [Reference Hamdollahzadeh, Bahrami, Nikoo, Yusefi, Givi and Parvin24]. In the present study, the pinning effect by SiCNP dominates the heat input by selected FSW parameters. The presence of SiCNP restricts the grain growth because of pinning effect on grain boundaries and also by increasing the nucleation sites [Reference Abbasi, Abdollahzadeh, Bagheri and Omidvar17, Reference Liu, Hu, Zhao and Fujii20, Reference Byung-Wook, Don-Hyun, Yong-Hwan and Seung-Boo21, Reference Guo, Lee, Du, Bi, Tan and Wei32, Reference Barmouz, Asadi, Givi and Taherishargh40, Reference Morisada, Fujii, Nagaoka and Fukusumi41]. Figure 5(c) demonstrates the comparison in the average grain size for the FSW specimens produced for varying vol% fractions of SiCNP and without SiCNP at the WNZ for FSW second pass. Thus, it can be concluded from these microstructural analysis and SEM images [Figs. 2–5] that the FSW specimens prepared with the addition of varying vol% fractions of SiCNP after the FSW second pass show considerable outcomes in a homogeneous distribution of SiCNP at the WNZ and reduction in grain size when compared to the FSW specimen produced without SiCNP. Figure 5(d) shows the XRD patterns of FSW dissimilar joints produced for a varying vol% fractions (5, 8, and 13%) of SiCNP reinforcement during FSW first pass only. Since the vol% fraction of SiCNP is less compared with the aluminum in the MMNC at the WNZ, the SiC peaks of the FSW specimens observe less intensity for 8 and 13 vol% fractions. However, no SiC intensity peaks were identified for the FSW specimens fabricated for 5 vol% fraction.
(a) SEM images of the FSW specimen without SiCNP for FSW second pass at the WNZ region, (b) higher magnified image of (a) showing grain size range 6–9 µm, (c) average grain size after performing FSW second pass on the specimen with different vol% fractions of SiCNP (5, 8, 13%) and without SiC, (d) XRD images showing the intensity peaks in the MMNC at the WNZ for FSW first pass specimen.

The theoretical grain size at the MMNC of the WNZ is calculated by using the Zener–Holloman parameter:
 $${\rm{d}}z = {{4r} \over {3{v_{\rm{f}}}}}\quad ,$$
where dz is Zener limiting grain size and r and v f are the radius and volume fraction of the reinforcing particles. Considering the Eq. (6), the grain size decreases with increasing v f and decreasing r. In the present study, after performing the FSW second pass and having presence of the vol% fraction of SiCNP (i.e., 3, 5, 9%) at the WNZ, the calculated theoretical dz should be 2.2 µm for 3%, 1.3 µm for 5%, and 0.7 µm which is much smaller than the actual grain size. The actual grain size is in the range 2–3.5 µm for 3%, 3–5 µm for 5% and 9%. This difference between theoretical dz and actual grain size indicates that increasing the vol% fraction of SiCNP not all the SiCNP contributes to hindering the grain growth but it results in agglomeration at the WNZ. However, it can be concluded from the result that FSW joint specimen after performing the FSW second pass exhibits reduced grain size in the WNZ compared with the FSW joint specimens produced without SiCNP. From the above observations, the homogeneous distribution of SiCNP to produce a defect-free MMNC at the WNZ depends on the three factors: (i) the number of FSW pass, (ii) the vol% fraction of SiCNP at the WNZ, and (iii) the area of WNZ of the MMNC. In the first case, an increase in the number of FSW pass helps proper stirring of the material and powder distribution becomes homogeneous at the WNZ [Reference Dolatkhah, Golbabaei, Givi and Molaiekiya14]. The second case suggests that there is a limit for the vol% fraction of SiCNP reinforcement to be incorporated at the WNZ to produce MMNC without any defects and with the best possible uniform distribution of SiCNP [Reference Wang, Song, Sun and He33, Reference Slipenyuk, Kuprin, Milman, Goncharuk and Eckert34]. In the third case, an increase in the area of WNZ of the MMNC [Table I] from the FSW first pass to the second pass allows the flow of more amount of plasticized material from both the AS and RS, which occupy the WNZ composite area.
Mechanical properties
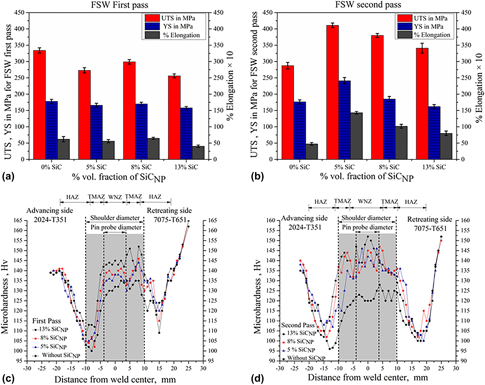
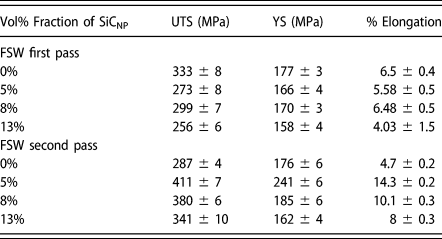
The effect of varying vol% fractions of SiCNP (0, 5, 8, 13%) on the tensile strength of the FSW joint specimens fabricated for FSW first and second pass experiment is shown in Figs. 6(a) and 6(b), respectively, and the same is presented in Table II for UTS, YS, and % elongation for tested specimens. As can be seen in Fig. 6(a) and Table II, during the FSW first pass, lower tensile properties are observed for the FSW joint specimens with varying vol% fractions SiCNP (5, 8, 13%) compared with the specimens without SiCNP (0%). The FSW joint specimens without SiCNP for the first pass have shown maximum UTS of 333 ± 8 MPa, YS of 177 ± 3 MPa, and % elongation of 6.5 ± 0.4. Further, FSW joint specimens with 5 vol% fraction of SiCNP at the WNZ observes lower tensile properties, UTS of 273 ± 8 MPa, YS of 166 ± 4 MPa, and % elongation of 5.58 ± 0.5. Similarly, a lower UTS of 299 ± 7 MPa and 256 ± 6 MPa, YS of 170 ± 3 MPa and 158 ± 4 MPa, and % elongation of 6.48 ± 0.5 and 4.03 ± 1.5 are observed for the FSW specimen with 8 and 13 vol% fraction SiCNP, respectively. This can be attributed to the presence of nonhomogeneous distribution and agglomeration of reinforcement SiCNP at the WNZ during the FSW first pass as discussed in the preceding sections. Also, the measured area of WNZ of 40 mm2 having accommodated the different V fp for varying vol% fractions of SiCNP dictates the final tensile properties of the MMNC at the WNZ. The tensile properties depend on the factors such as the amount of SiCNP agglomeration in the WNZ, grain size, amount of dislocation and porosities, and the bonding between the reinforcement particle and the alloys [Reference Rahimian, Ehsani, Parvin and Baharvandi37, Reference Barmouz, Asadi, Givi and Taherishargh40]. The results were in good agreement with Sun and Fujii [Reference Sun and Fujii23] in their investigation on the fabrication Cu/SiC composites during first pass FSP. For the FSW first pass, an increase in the vol% fraction of SiCNP in the WNZ from 5 to 8% results in an increase in the tensile properties of the joints, while further increasing the vol% fraction from 8 to 13% the tensile properties are decreased. These differences in tensile properties may be due to the influence of “heat input” and “pinning effect” in controlling the grain size as reported by Hamdollahzadeh et al. [Reference Hamdollahzadeh, Bahrami, Nikoo, Yusefi, Givi and Parvin24]. In the present study, selected two FSW parameters, tool rotation speed, 1000 rpm, and traverse speed, 40 mm/min, resulted in the higher heat generation at the WNZ. In the FSW specimens fabricated with the 8 vol% fraction, the “pinning effect” dominates the “heat input,” whereas the same is not true in the case of FSW specimen with 5 and 13 vol% fractions, in the former the “heat input” being dominating and the later resulting in the severe agglomeration of SiCNP at the WNZ.
Comparison of UTS, YS, and % elongation for varying % volume fractions of SiCNP (5, 8, 13%) and without SiCNP (0%) for the MMNC at the WNZ (a) after the FSW first pass and (b) after FSW second pass. Note that % elongation is scaled to 10. Microhardness profile for varying % volume fractions (0, 5, 8, and 13%) (c) after FSW first pass and (d) after FSW second pass.

Tensile properties of FSW joint specimen fabricated with varying vol% fractions of SiCNP (5, 8,13%) and without SiCNP (0%) at the WNZ for FSW first pass and second pass.

Figure 6(b) and Table II present the effect of varying vol% fractions of SiCNP (0, 5, 8, 13%) and FSW second pass on the tensile properties of FSW dissimilar joint specimens. It is observed from Fig. 6(b) that for the FSW second pass, the FSW dissimilar joint specimen fabricated without SiCNP observes a decreasing trend with UTS of 287 ± 4 MPa, YS of 176 ± 6 MPa, and % elongation of 4.7 ± 0.2 compared with the FSW specimen produced without SiCNP for FSW first pass [Fig. 6(a)]. This is due to the softening effect of the WNZ because of an increase in the number of passes [Reference Barmouz, Asadi, Givi and Taherishargh40]. On the other hand, compared with the FSW first pass [Fig. 6(a)], the FSW joint specimens fabricated after performing FSW second pass having 5 vol% fraction of SiCNP at the WNZ observe an increasing trend and result in the maximum UTS of 411 ± 7 MPa, YS of 241 ± 6 MPa, and % elongation of 14.3 ± 0.2. Similarly, compared with the FSW first pass, the FSW joint specimens fabricated after performing the FSW second pass having 8 and 13% SiCNP in the WNZ observe an increasing trend in the tensile properties. However, the FSW joint specimens with 5% SiCNP yield higher tensile properties compared with the specimen with 8 and 13% SiCNP. The increase in the tensile properties of the FSW joint specimens tested for varying vol% fractions of SiCNP at the WNZ and for the FSW second pass is the result of the homogeneous distribution of SiCNP [Reference Byung-Wook, Don-Hyun, Yong-Hwan and Seung-Boo21, Reference Hamdollahzadeh, Bahrami, Nikoo, Yusefi, Givi and Parvin24]. Thus, it can be concluded that irrespective of the varying vol% fractions of SiCNP (5, 8, 13%) reinforcement in the WNZ and compared with the first pass, the tested tensile specimens of FSW dissimilar joint specimens produced after the FSW second pass on the same specimens show an increasing trend in the tensile properties. Also, the increase in the area of WNZ measuring 40 mm2 from FSW first pass to the area of 56 mm2 after performing FSW second pass contributes to having accommodated the homogeneous distribution of different vol% fractions of SiCNP which is responsible for the higher tensile properties of the FSW joint specimen.
Figures 6(c) and 6(d) depict the microhardness profile for the FSW dissimilar joint specimens fabricated with varying vol% fractions of SiCNP and without SiCNP at the WNZ after the FSW first pass and second pass experiment, respectively. As shown in Fig. 6(c), after FSW first pass, the specimens exhibit a nonhomogeneous microhardness profile from the AS to RS covering the WNZ and TMAZ. As it can be observed in Fig. 6(c), the TMAZ of RS observes higher hardness for all the FSW joint specimens produced with varying vol% fractions of SiCNP (5, 8, 13%) at the WNZ. The specimens with 13% SiCNP for the first pass have shown the maximum hardness of 152 ± 2 at the TMAZ of RS. However, for all the specimens and first pass, the TMAZ and HAZ of AS observe a significant reduction in hardness. These nonhomogeneous distributions of hardness are due to lack of stirring and migration of SiCNP towards RS of the TMAZ during the FSW first pass [Reference Dolatkhah, Golbabaei, Givi and Molaiekiya14, Reference Hamdollahzadeh, Bahrami, Nikoo, Yusefi, Givi and Parvin24]. The observed lower and higher hardness in some local area of the WNZ and TMAZ of the RS corresponds to the alternate layers of SiCNP-free and SiCNP-rich region [Figs. 2(c) and 3(c)]. As shown in Fig. 6(d), the FSW second pass coupled with the change in the tool rotation direction helps in the uniform distribution of SiCNP and observes homogeneity in the hardness profile in the WNZ and TMAZ of both AS and RS. However, because of the high heat generation in the second pass, the HAZ of all the specimens observes a significant reduction in the hardness. In the present study, higher microvickers hardness of 150 ± 2 Hv was observed at the weld interface of WNZ for the FSW specimen produced with 13 vol% fraction of SiCNP and after the second pass. The hardness of these specimen records an increase of 12 Hv compared with the base metal AA2024-T351 hardness of 138 Hv and remains at lower hardness by 25 Hv compared with the base metal AA707-T351 hardness of 175 Hv. The FSW dissimilar joint specimens fabricated without SiCNP shows much lower hardness of 125 Hv and 115 Hv for FSW first pass and second pass experiment, respectively, compared with the base metal AA2024-T351 and AA7075-T651.
Strengthening mechanism
There are various potential strengthening mechanisms, which are effective in determining the strength of MMC reinforced with nano- or microparticles. The major strengthening mechanisms are (i) Orowan strengthening [Reference Dieter and Bacon36, Reference Ashby43] from dislocation bowing by reinforcing particles, (ii) strengthening from coefficient of thermal expansion (CTE) [Reference Scudino, Liu, Prashanth, Bartusch, Surreddi, Murty and Eckert42, Reference Hansen44, Reference Vogt, Zhang, Li, Bonds, Browning, Lavernia and Schoenung51], (iii) Hall–Petch strengthening (grain refinement strengthening) [Reference Dieter and Bacon36, Reference Hall45], (iv) ROM strengthening mechanism [Reference Scudino, Liu, Prashanth, Bartusch, Surreddi, Murty and Eckert42, Reference Kim46, Reference Wang, Qu, Scudino, Sun, Prashanth, Louzguine-Luzgin, Chen, Zhang and Eckert49], and (v) load bearing mechanism [Reference Kim, Sohn, Nezafati, Ferguson, Schultz, Bajestani-Gohari, Rohatgi and Cho47].
The strength from CTE mismatch mechanism, σthe, depends on the density of dislocations (ρCTE) occurring due to CTE mismatch between matrix and reinforcement, ∆α [Reference Scudino, Liu, Prashanth, Bartusch, Surreddi, Murty and Eckert42, Reference Hansen44, Reference Kim, Sohn, Nezafati, Ferguson, Schultz, Bajestani-Gohari, Rohatgi and Cho47]. When the particles are in micron size, the contribution of σthe to the YS is much larger compared with Orowan strengthening (σOrowan) [Reference Scudino, Liu, Prashanth, Bartusch, Surreddi, Murty and Eckert42]. However, as reported in the investigation by Kim et al. [Reference Kim, Sohn, Nezafati, Ferguson, Schultz, Bajestani-Gohari, Rohatgi and Cho47], Redsten et al. [Reference Redsten, Klier, Brown and Dunand48], and Vogt et al. [Reference Vogt, Zhang, Li, Bonds, Browning, Lavernia and Schoenung51], the strengthening due CTE mismatch is negligible and can be ignored in the composites having particles size below the range 70–80 nm. Further, they report that in the MMNC, the strengthening contribution from CTE mismatch is minor compared to Orowan-strengthening (σOrowan) and Hall–petch [Reference Kim, Sohn, Nezafati, Ferguson, Schultz, Bajestani-Gohari, Rohatgi and Cho47, Reference Redsten, Klier, Brown and Dunand48]. In the present study, as the SiCNP reinforcement particles size is ∼50 nm, the strengthening from CTE mismatch is ignored.
The YS through the ROM (σy) depends on the YS of matrix, σOrowan, σthe, and stress contribution due to strain gradient effect (σgeo). As reported by Scudino et al. [Reference Scudino, Liu, Prashanth, Bartusch, Surreddi, Murty and Eckert42] in their investigation on the mechanical properties of Al-based MMC reinforced with Zirconium (Zr)-based glass particles produced by PM technique, the strength, σy, cannot be accurately measured and explained for the composites having higher volume fraction of reinforcement with relatively large size particles due to particle contiguity. In the present study, increase in the vol% fraction of SiCNP results in the particle agglomeration. In addition, the σy through ROM considers the σthe from CTE mismatch. In the present study, the particle size is ∼50 nm and the strength from CTE mismatch is ignored. This indicates that strength increase through ROM cannot be explained by considering only dislocation strengthening by σOrowan and σgeo. Thus, the strengthening from ROM is not suitable in the present study.
The contribution of small vol% fraction of nanosized particles towards strength improvement by the load, ∆σload, in load bearing mechanism can be ignored [Reference Kim, Sohn, Nezafati, Ferguson, Schultz, Bajestani-Gohari, Rohatgi and Cho47, Reference Redsten, Klier, Brown and Dunand48], because the strength improvements in the ∆σload by nanoparticles are estimated in the range of 0.5–2.5% of the original YS of the matrix [Reference Kim, Sohn, Nezafati, Ferguson, Schultz, Bajestani-Gohari, Rohatgi and Cho47, Reference Redsten, Klier, Brown and Dunand48]. Considering all the above facts and nanoparticles of SiC size ∼50 nm, the strengthening from σOrowan and Hall–Petch is found to be suitable for the composites produced using nanoparticles as a reinforcement.
In the present study, the net change in the YS for varying vol% fractions of SiCNP (5, 8, 13%) and after the FSW second pass is calculated as follows from Orowan–Ashby Eq. (7):
 $${\sigma _{{\rm{orowan}}}} = {{0.13{G_{\rm{m}}}b} \over \lambda }\ln {r \over b}\quad ,$$
where G m is the shear modulus of the matrix, b is the burgers vector, r is the radius of reinforcement particles, and λ is the mean interparticle spacing. The λ for the varying vol% fractions of SiCNP (5, 8, 13%) is calculated as follows from Eq. (8):
 $$\lambda = {d_{\rm{p}}}\left[ {{{\left( {{1 \over {2{v_{\rm{p}}}}}} \right)}^{1/3}} - 1} \right]\quad ,$$
where d p is the diameter of SiCNP and v p is volume fraction of the reinforcement [Reference Dieter and Bacon36]. Thus, the calculated λ is 57.5 nm, 42.1 nm, and 28.3 nm for v p of 5, 8, and 13 vol% fraction of SiCNP, respectively. Accordingly, the σOrowan predicts a YS of 78 MPa, 106 MPa, and 158 MPa for λ of 57.5 nm, 42.1 nm, and 28.3 nm, respectively. The experimental YS is 176 ± 6 MPa for the specimen without SiCNP, 241 ± 6 MPa for 5% SiCNP, 185 ± 6 MPa for 8% SiCNP, and 162 ± 4 MPa for 13% SiCNP. It must be noted that σOrowan prediction in YS is based on the facts that there are no agglomeration defects of SiCNP in the WNZ [Reference Kim, Sohn, Nezafati, Ferguson, Schultz, Bajestani-Gohari, Rohatgi and Cho47]. In the present study, such a situation of defect-free WNZ was observed for the FSW joint specimen having 5 vol% fraction of SiCNP. Hence, the FSW joint specimen without SiCNP yields YS of 176 ± 6 MPa and specimen with 5 vol% fraction of SiCNP results in YS of 241 ± 6 MPa. Thus, the difference in YS between these two specimens is 65 ± 6 MPa which is in good agreement with the predicted YS of 78 MPa contribution from σOrowan. However, predicted YS from σOrowan for the specimen with 8 and 13 vol% fractions of SiCNP is not in agreement with the experimental YS. The lower YS observed in the experimental data tested FSW joint specimens with 8 and 13% of SiCNP is mainly due to the increase in the vol% fraction of SiCNP which results in agglomeration of SiCNP in some regions of the WNZ. Scudino et al. [Reference Scudino, Liu, Prashanth, Bartusch, Surreddi, Murty and Eckert42] in their study report self-consistent effective medium approximation (SCEMA) method as one of the potential strengthening mechanisms, which accurately predicts the behavior of the composites by considering the particle cracking which occurs when large volume fraction reinforcement is used. Further, they report that experimental results are in good agreement with that of calculation by SCEMA method.
On the other hand, the Hall–Petch strengthening mainly due to the grain refinement at the WNZ also contributes to the strengthening of the MMNC. Hall–Petch [Reference Dieter and Bacon36] (grain refinement strengthening) model is expressed as
 $$\left( {{\sigma _{\rm{o}}} = {\sigma _{\rm{i}}} + \kappa {D^{ - {1 \over 2}}}} \right)\quad ,$$
where σo is the yield stress which depends on the grain size diameter (D), friction stress (σi) resulting from resistance to the crystal lattice dislocation movement and hardening contribution parameter (κ). In the present study, FSW specimens produced with SiCNP reinforcement for the second pass show much smaller D, and these specimens have higher tensile properties compared with the FSW specimens without SiCNP. However, the Eq. (9) assumes that other Hall–Petch parameters, κ and σi, cannot be predicted experimentally and must be considered as constants during changes in the processing [Reference Kim, Sohn, Nezafati, Ferguson, Schultz, Bajestani-Gohari, Rohatgi and Cho47]. Thus, only grain size, D, must be considered for the calculation of σo. Thus, in the present study strength contribution from the σOrowan is more suitable and same is considered.
Fractography
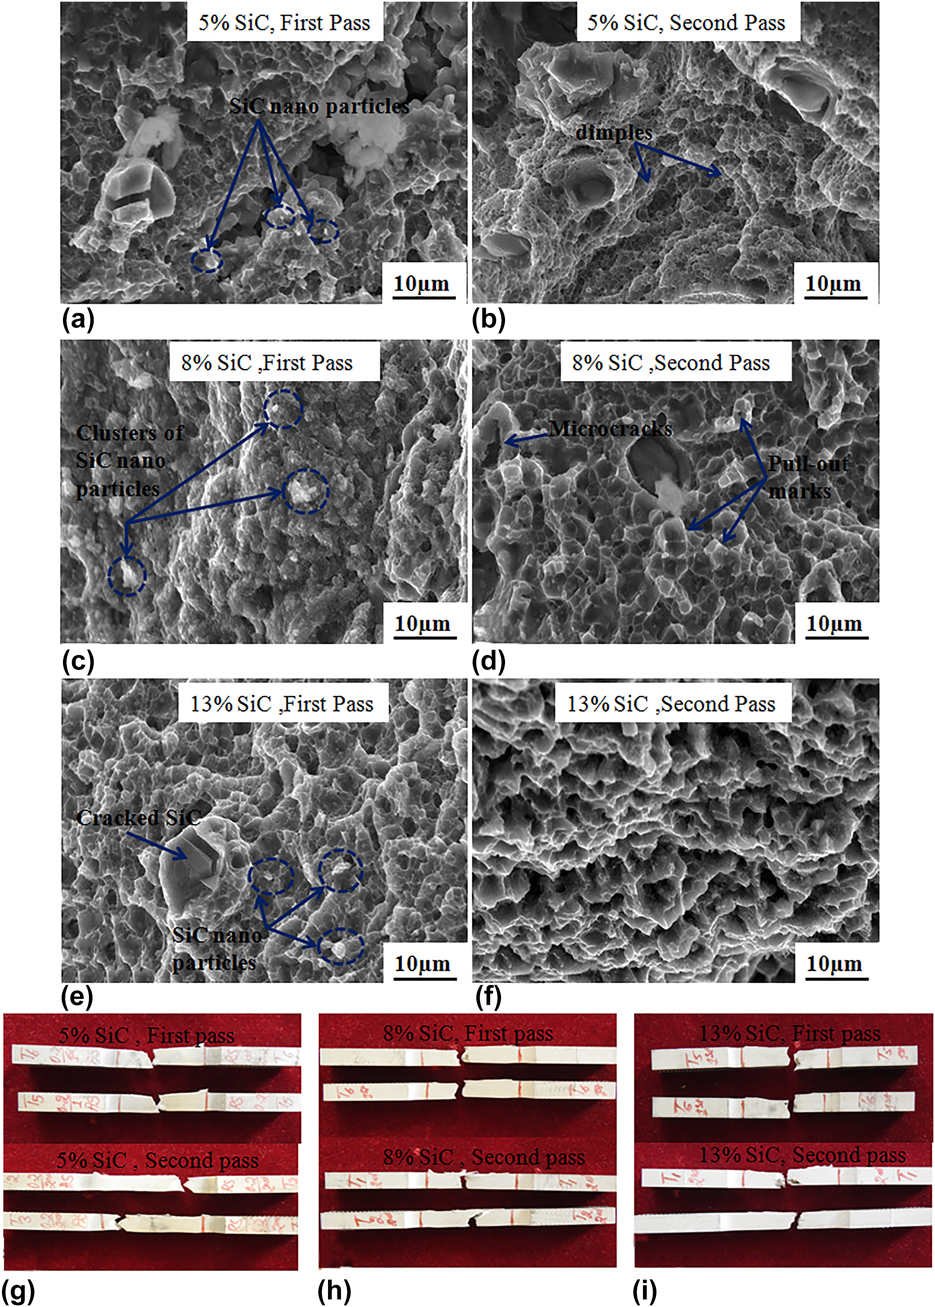
Figure 7(a) shows the SEM image of the FSW specimen fabricated with 5 vol% fraction of SiCNP reinforcement for FSW first pass, consisting of clusters and cracked SiCNP, resulting in lower UTS, YS, and % elongation and the failure occurs at WNZ [Fig. 7(g)]. In Figure 7(b) for the specimen with 5 vol% fraction after the FSW second pass, the fracture took place in the HAZ of either AS or RS indicating the homogeneous distribution of SiCNP and its good interfacial bonding with aluminum alloy matrix at the WNZ. Also, the SEM images shown in Fig. 7(b) consist of a large number of small-sized fine dimples and these features result in higher tensile properties and specimen failure exhibits ductility nature. The location of the failure of both the tensile test specimen produced with 8 vol% fraction of SiCNP and after FSW first pass and the second pass was found at WNZ as shown Fig. 7(h). Increase in the vol% fraction results in the more clusters of the SiCNP and segregation of the nanoparticles from the matrix [Fig. 7(c)]. On the other hand, fracture surface SEM images [Fig. 7(d)] of the tested specimen after FSW second pass exhibits a much refined and good interfacial bonding between matrix and SiCNP evidenced with pull-out marks. The SEM fractography images for the FSW first pass [Fig. 7(e)] and second pass [Fig. 7(f)] specimen with 13 vol% fraction of SiCNP observe a severe agglomeration and fracture location was found to be at WNZ.
SEM images showing fracture features of FSW specimens for varying vol% fractions of SiCNP 5% (a) first pass and (b) second pass; 8% (c) first pass and (d) second pass; and 13% (e) first pass and (f) second pass. The tested tensile specimen and fracture location corresponding to each volume fraction and FSW pass (g) 5 vol% fraction, (h) 8 vol% fraction, (i) 13 vol% fraction.

Conclusions
The effect of varying vol% fractions (5, 8, 13%) of SiCNP reinforcement in the WNZ and its microstructure, and the mechanical properties of dissimilar friction stir weld joints of AA2024-T351 and AA7075-T651 with first and second pass have been investigated experimentally. The important conclusions drawn from the results are as follows:
(1) For all the FSW dissimilar butt joint specimens AA2024-T351 and AA7075-T651 fabricated with varying vol% fractions of SiCNP (5, 8, 13%), compared with the FSW first pass, the FSW second pass experiment results in a much homogeneous dispersion of SiCNP in the WNZ and yields higher mechanical properties with better metallurgical characteristics compared with the FSW specimen without SiCNP.
(2) Higher UTS of 411 ± 7 MPa, YS of 241 ± 6 MPa, and % elongation of 14.3 ± 0.2 were gained for the FSW specimen with 5 vol% fraction SiCNP and after performing FSW second pass. The specimens without SiCNP result in lower UTS of 287 ± 4 MPa, YS of 176 ± 6 MPa, and % elongation of 4.7 ± 0.2.
(3) The presence of varying vol% fractions (5, 8, 13%) of SiCNP in the WNZ after FSW second pass results in a decrease in the grain size range 2–4 µm compared with the specimens without SiCNP having grain size range 6–8 µm.
(4) The higher hardness of 150 Hv was observed for the FSW specimens fabricated with 13 vol% fraction SiCNP for the FSW second pass. On the other hand, a lower hardness of 115 Hv was recorded for the FSW specimens fabricated without SiCNP and for the second pass.
(5) The failure location of the specimen with 5 vol% fraction of SiC particles for FSW second pass is at HAZ away from WNZ, and fracture surface specimens exhibit the features consisting of pull-out marks, equiaxed dimples, and good interfacial bonding between SiC particles and matrix.
Experimental procedure
Materials and methods
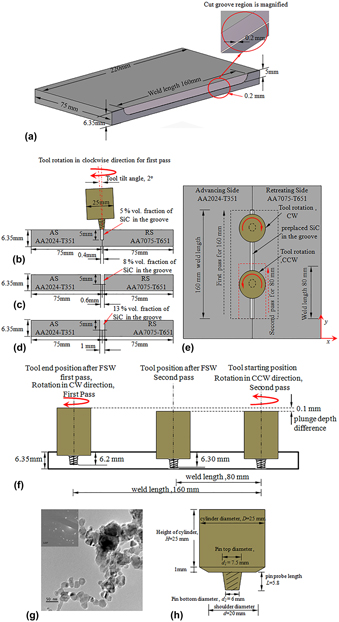
In this study, aluminum alloy plates, typically AA2024-T351 and AA7075-T651, are used in producing dissimilar joints by the FSW process. In the base material AA 2024-T351, T refers to “age hardened” and the temper designation T351 denotes that alloys are tempered to a T3 condition by solution treatment, quenching, tensile deformation, and natural aging. Similarly, for 7075-T651 the T651 refers to alloys tempered to a T6 condition by solution treatment followed by artificial aging [Reference Mishra and Ma2]. The chemical compositions and mechanical properties of AA2024-T351 and AA7075-T651 are given in Supplementary material Table SI. Microvickers hardness of base materials of AA2024-T351 and AA7075-T651 is found to be 138 Hv and 175 Hv, respectively. The higher hardness of both the materials is the result of peak age hardening heat treatment performed on the base metals. The dimensions of the plate thickness, 6.35 mm, width, 75 mm, and length, 220 mm, are considered in the experiments. Three pairs of test plates are fabricated with butt joints. Before the FSW process, each plate is machined on the adjoining side face with typical rectangular section edge groove as shown in Fig. 8(a). Three rectangular section edge groove dimensions width, 0.2, 0.3, and 0.5 mm, and constant depth, 5 mm, and length, 160 mm, are considered. Figures 8(b)–8(d) shows the schematic of aluminum alloy plates in butt configuration having rectangular section edge grooves of three different dimensions formed with the total width of 0.4, 0.6, and 1 mm. The SiCNP with varying vol% fractions (5, 8, 13%) is reinforced into these rectangular section edge grooves and pressed tightly before FSW operation. Commercially available Beta (β)-Phase SiCNP powder (purity ∼98.5%, supplier Alfa Aesar, Lancashire, U.K.) with a mean particle size in the range of 40–50 nm is used as a reinforcement to produce MMNC at WNZ. Figure 8(g) shows transmission electron micrograph (TEM) with selected area electron diffraction (SAED) of the SiCNP powder. The FSW dissimilar joints are fabricated using an FSW tool of cylindrical shape with taper threaded pin, and its dimensions are shown in Fig. 8(h). The tool is made of hot die steel (HDS)-grade steel in the hardened condition of 55 HRC. A custom designed 5-axis FSW machine (BISS Pvt. Ltd., Bangalore, India) was used for the fabrication of the dissimilar joints reinforced with or without SiCNP. The dissimilar butt joint configuration of two aluminum plates and tool traverse and rotation direction for the FSW first and second pass is shown in Fig. 8(e). In all the experimental tests, the tool rotation speed of 1000 rpm and traverse speed of 40 mm/min are considered for fabricating the FSW dissimilar joint specimens. Figure 8(f) illustrates the increment of plunge depth from 6.20 mm during the first pass to 6.30 mm in the second pass. The tool tilt angle was kept at 2° for all the experimental trials. The positions of both the plates were kept in the x-direction and tool traverse in the y-direction.
(a) An example of schematic of plate with rectangular section edge groove. AA2024-T351 and AA7075-T651 in butt configurations having a rectangular section edge groove of total width (b) 0.4 mm, (c) 0.6 mm, and (d) 1 mm, and (e) top view showing the tool traverse and rotation direction for FSW first and second pass (f) increment in the plunge depth with difference of 0.1 mm from first pass to second pass. (g) TEM images and SAED pattern of SiC nanoparticles showing the average size of the nanoparticles between 40 and 50 nm. (h) Taper threaded cylindrical used for FSW process.

Production of FSW dissimilar butt joints with and without SICNP and extraction of specimens
Two aluminum alloy plates are arranged in such way that adjoining end faces containing the rectangular section edge grooves were kept intact [Figs. 8(b)–8(d)] and total empty space created in rectangular section edge grooves was filled with different vol% fraction of SiCNP. For all the experiments, the FSW dissimilar joints were prepared with AA2024-T351 being kept on the advancing side (AS) and AA7075-T651 on the retreating side (RS). At the beginning of each experimental trial, a single-plane FSW pass is given using a pin-less tool along the weld joint interface to ensure that reinforced SiCNP (5, 8, 13%) should not spill out of the grooves and all the particles embedded completely inside the grooves. During the plane pass, the rotation of the tool shoulder (without pin) helps in removing a layer of base material from the faying surface of two plates kept in butt joint and deposit it on the groove, thus helping in closing the grooves and avoiding loss of reinforcement particles from the grooves. Then, the FSW first and second pass is performed by taper threaded tool to obtain SiCNP-based reinforcement at the WNZ ensuring the MMNC. Figure 8(e) illustrates the weld length and direction of tool traverse for FSW first and the second pass. Figures 1(a)–1(d) show the photographs of the FSW dissimilar joint specimens obtained by reinforcing SiCNP with varying vol% fractions (0, 5, 8, 13%) and without SiCNP for FSW first and second pass conditions. A total of four tensile specimens are extracted from the first pass and second pass region perpendicular to the welding direction (y-direction) from FSW dissimilar joint specimens produced by reinforcing varying vol% fractions of SiCNP (0, 5, 8, 13%) at the WNZ. Similarly, a total of four rectangular specimens from FSW first pass and second pass are also extracted for metallographic analyses as well as the evaluation of material hardness using micro-vickers hardness tester.
For the microstructural analysis, the specimen faces are polished using SiC emery paper with grade range 400–3000 sizes followed by polishing on the machine using velvet cloth and alumina powder having particle size of 1 µm. The standard Keller’s reagent (1 mL of HF, 2.5 mL of HNO3, 1.5 mL of HCl, 95 mL of H2O) is used for etching the samples. The macrostructures of the cross section welded region are studied by a stereo zoom microscope having a low magnification of 10×. The detailed microstructural studies on the prepared specimens are carried out using JEOL JSM-6380 LA model (JEOL Ltd., Tokyo, Japan) scanning electron microscopy (SEM) machine provided with energy dispersive spectroscopy (EDS) microprobe. Further, to investigate the possible effects of FSW first and second pass on the WNZ and SiCNP distribution at the WNZ, the image analyses are carried out using ImageJ software on SEM images of WNZ and macrograph images obtained from stereo zoom microscope. The X-ray diffraction technique (XRD) analyses are conducted by using PANalytical X-ray diffractometer (Malvern Panalytical Ltd., Almelo, the Netherlands) to study the intensity of SiCNP peaks after FSW first pass and second pass. The fractured surface of the tensile test specimens with varying vol% fractions (0, 5, 8, 13%) of SiCNP is also examined by SEM.
The tensile specimens extracted from FSW joints produced with and without SiCNP for FSW first pass and second pass experiments are evaluated for UTS, YS, and % elongation. The specimens are prepared according to the ASTM: E8M-04. Tests are performed in as-welded (AW) condition at room temperature using SHIMADZU (type AGS-X series, SHIMADZU Corporation, Tokyo, Japan) servo-hydraulic testing machine with the capacity of 100 kN at a strain rate of 0.001 s−1. The average UTS, YS, and % elongation of the tested tensile specimen is plotted, and these values are considered for comparison with the each FSW specimens tested for varying vol% fractions of SiCNP and without SiCNP for FSW first and second pass experimental conditions. The SHIMADZU (type HMV-G20-S7, SHIMADZU Corporation, Tokyo, Japan) microvickers hardness testing machine is used for measuring the hardness of the specimens at 3 mm below from the top surface of the specimen and across the cross section. A load of 1 kgf and 15 s holding time were considered for the hardness testing.
Supplementary material
To view supplementary material for this article, please visit https://doi.org/10.1557/jmr.2018.445.
Acknowledgments
The authors would like to thank Prof. Sathish V. Kailas, Department of Mechanical Engineering, Indian Institute of Science (IISc.), Bangalore, for his support and providing the FSW machine and facilities available at Surface Interaction and Manufacturing (SIAM) Lab for experimentations.