Implications
This model of lifetime performance of dairy cattle provides a basis for predicting nutrient partitioning across different physiological states and genotypes. The model has two tightly linked parts: a conceptual framework that focuses on priorities for life functions, and rules for modifying the outcomes when nutritional supply is inadequate. The conceptual framework described in this paper provides a holistic view of growth, reproduction and nutrition and scaling parameters allowing the simulation of different animal genotypes.
Introduction
The objective of farm animal nutrition has evolved from the meeting of nutrient requirements, through the realization of genetic potential, to the prediction of multiple performance characteristics of a particular genotype in a particular environment (Sauvant, Reference Sauvant1992). The animal is no more considered as a passive production unit but rather as an active living system elaborating performance through the complex interaction between physiological functions, mainly growth, reproduction and nutrition, and orchestrating nutrient partitioning. As stated by Friggens and Newbold (Reference Friggens and Newbold2007), ‘prediction of nutrient partitioning is a long-standing problem of animal nutrition that has still not been solved. Another substantial problem for nutritional science is how to incorporate genetic differences into nutritional models. These two problems are linked as their biological basis lies in the relative priorities of different life functions (growth, reproduction, health, etc.) and how they change both through time and in response to genetic selection’. This statement highlights the importance of being able to describe the changing priorities of an animal as it ages, through repeated reproductive cycles and over successive generations, and also in response to feeding and reproduction management practices. For the future, animal science needs models suitable for in silico experiments exploring changes in animal performance resulting from the interactions between genetic and environmental factors.
The question we address in this study is how to represent in animal models (1) dynamic changes of performance throughout the lifespan, (2) genetic differences between individuals and breeds and (3) modulations of performance in response to nutritional challenges.
The pioneering work of Baldwin et al. (Reference Baldwin, France and Gill1987a, Reference Baldwin, Thornley and Beever1987b and Reference Baldwin, France, Beever, Gill and Thornley1987c) has shown that animal models can provide suitable tools for quantitative evaluation of concepts, hypotheses and data regarding nutrient partition. Later, several other models of lactating animals, mainly in cattle, have been published in the last 20 years (e.g. reviews in Sauvant, Reference Sauvant1992 and Reference Sauvant1996; Chalupa et al., Reference Chalupa, Boston and Munson2004; Tedeschi et al., Reference Tedeschi, Fox, Sainz, Barioni, Raposo de Medeiros and Boin2005). The main objective of Baldwin’s work was to provide, at the level of metabolic pathways and throughout the lactation cycle, a modelling framework to embed knowledge and a simulation tool to aid interpretation of experimental data. His model was structured on the basis of biochemical and stoichiometric arguments. Regulations were formalized by way of the effect of plasma glucose concentration, capturing hormonal effects (catabolic and anabolic hormones), on the velocity of metabolic transactions such as lipogenesis, lipolysis and gluconeogenesis. Through this mechanistic representation, variations of whole-animal performance emerged from the aggregation of several points of biochemical regulation. Similar attempts to incorporate regulation rules in animal models through control variables driving physiological processes were performed in several other studies, for example, ‘lactation hormone’ (Neal and Thornley, Reference Neal and Thornley1983; Baldwin et al., Reference Baldwin, France, Beever, Gill and Thornley1987c), ‘anabolic and catabolic hormones’ (Sauvant and Phocas, Reference Sauvant and Phocas1992; Baldwin, Reference Baldwin1995; Martin and Sauvant, Reference Martin and Sauvant2007) and ‘growth hormone and insulin’ (Danfaer, Reference Danfaer1990).
Aggregative models are based on the gathering of quantitative knowledge of underlying biological processes and are developed with the aim of reproducing complex interactions. In attempting to describe all the mechanisms involved, they frequently come to be exhaustive encyclopaedic compilations (Baldwin, Reference Baldwin1995) that themselves become complex objects, difficult to manipulate and use for prediction. In a reverse approach, we propose to explicitly model a centralized regulating sub-system structured on the basis of teleonomic arguments. This approach is integrative rather than aggregative, intended to be predictive rather than explicative, and suitable for easy use. In our model, the different levels of performance variability, that is, through time, according to genotype and in response to diet, are described with separate specific components: dynamic changes in performances are driven by goal-directed trajectories of life function priorities; genetic differences between individuals and breeds are defined by genetic scaling parameters; and modulations of performance in response to nutritional challenges are controlled by a theoretical model of energy partitioning regulation.
The whole model simulates, on a daily basis, food intake, milk yield and composition, foetal growth, calf birth weight and body weight (BW) and composition changes in dairy cows throughout the lifespan, that is, during growth, over successive reproductive cycles and through ageing.
The model is described in two companion papers. Paper 1 focuses on the simulation of a genetically scaled reference pattern of performance. Paper 2 focuses on the part of the model allowing simulation of a nutritionally altered pattern of performance. The objective of the present paper is to evaluate the efficacy of using teleonomic arguments and genetic scaling parameters in an integrated whole-animal model designed to describe performance throughout the lifespan of various genotypes of dairy cows.
Model description
Rationale
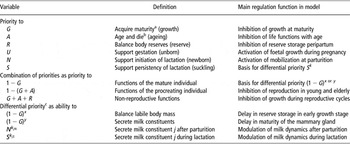
The model consists of two connected sub-models, representing the regulating and operating parts of the model. The regulating sub-model describes, throughout the lifespan of dairy cows, the dynamic partitioning of relative priorities to elementary life functions (growth, reproduction, ageing and balance of reserves) and is structured on a teleonomic basis (Table 1), embodying the idea that the coordination of life functions is goal directed towards the preservation of life for the reproduction of life form (Bricage, Reference Bricage2002). The operating sub-model describes the dynamics of performance (body, milk and intake) and is structured on the partitioning of metabolizable energy intake with genetic parameters scaling individual performance (mature weight, milk potential, milk composition and body reserves lability). Performance, denoted by the generic term Q (daily material flow), is converted into energy denoted by the generic term E (daily energy flow) with appropriate conversion coefficients (eQ = E/Q, energy/material). At any time, priorities to life functions together with genetic scaling parameters are used to define a reference pattern of performance Q*, which determines a reference energy requirement E* = eQ × Q*. Given the actual intake, the difference between energy supply and requirement is apportioned between energy flows, giving energy deviation ∂E. The actual energy flow is thus calculated such that E = E* + ∂E, leading to the actual performance Q = E/eQ, which expresses a deviation from the reference performance such as ∂Q = Q − Q*. In this paper, the model deals with a non-challenged feeding context such as ∂E = 0, E = E*, Q = Q* and ∂Q = 0, that is, assuming that intake supplies the realization of the genetically scaled reference pattern of performance (description of the deviations ∂E and ∂Q is given in Martin and Sauvant, Reference Martin and Sauvant2010).
Teleonomic-based priority control: use of priorities, combination of priorities and differential priorities to elementary life functions for model regulation

aMaturity is considered as the achievement of a mature non-labile body mass.
bPriority A to ageing represents a loss of other priorities.
cWith exponent parameters x, y and kjN and kS for milk constituent j (fat j:F; protein j:P; lactose j:L; water j:H).
Structure of the regulating sub-model
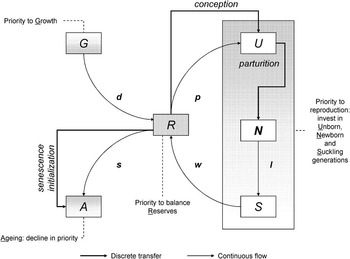
The regulating sub-model (Figure 1) describes the partitioning of a mammal female’s priority over lifetime t (d) between six components of the goal of maximizing the generation of viable offspring:
Regulating sub-model diagram. Compartments refer to animal priorities G: growth, A: ageing, R: balance of body reserves, U: ensuring survival of the unborn calf, N: ensuring survival of the newborn calf and S: ensuring survival of the suckling calf.

(i) G achieve growth to maturity by body mass accretion during the developmental stage of life;
(ii) A undergo ageing by reducing investment in repair processes resulting in a decline of the ability to perform vital functions;
(iii) R balance body reserves by storage or mobilization to maintain favourable reproductive conditions;
(iv) U achieve foetal development of the unborn calf during pregnancy;
(v) N supply nutrients to the newborn calf by initiation of lactation and body reserve mobilization at the transition time between gestation and lactation;
(vi) S supply nutrients to the suckling calf (substitute by the milking machine in dairy production context) by lactation persistency.
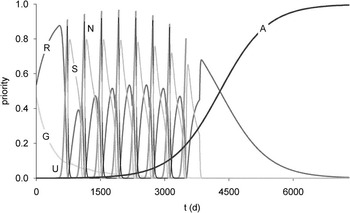
The so-called priorities to the unborn, newborn and suckling correspond to stages of maternal investment in reproduction, soliciting different physiological functions to ensure offspring survival: gestation, lactation and the transition phase between them, which involves mobilization of body reserves and initiation of lactation. At parturition, the function of supplying nutrients to the offspring is transferred from the placental uterine unit to the mammary gland. Priority N represents the priority to this transfer. Priority is formalized as a dimensionless quantity flowing through these compartments: from G to R during growth, from R to A with ageing, and cyclically through R, U, N and S during reproductive cycles (Figures 2 and 3). An essential feature of the model is that it describes the pattern of relative priorities of different life functions, the sum of which always remains equal to 1:

Trajectories of priorities G: growth, A: ageing, R: balance of body reserves, U: ensuring survival of the unborn calf, N: ensuring survival of the newborn calf and S: ensuring survival of the suckling calf over 20 years of life.

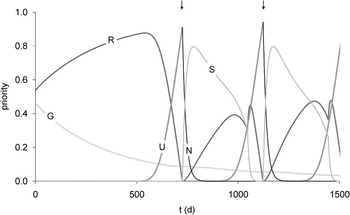
Trajectories of priorities G: growth, A: ageing, R: balance of body reserves, U: ensuring survival of the unborn calf, N: ensuring survival of the newborn calf and S: ensuring survival of the suckling calf over 1500 days of life. Arrows indicate parturition times of two successive reproductive cycles.

Formalism of the regulating sub-model
Full details are given in Appendixes A to G in the supplementary online appendix available at: http://www.animal-journal.eu/.
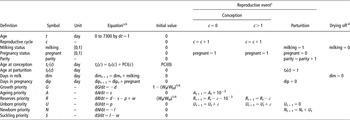
The list of equations used to define priority components G, A, R, U, N and S is given in Table 2. These equations are described in detail in Appendix A.
Compendium of regulating sub-model equations giving the dynamics of priorities G, A, R, U, N and S

aW: non-labile body mass; WB: W at birth; X: labile body mass; WM: scaling parameter of mature W; PCI(0): age at first conception; PCI(c > 0): parturition to conception interval; (π,α,ω): pregnancy scaling parameters; (μ,λ 0,1,γ,τ,σ): fractional rates; (χM,χS): body reserves threshold parameters.
b
cConception if A < 0.2 at t = tC(c); parturition triggered when U ⩾1 − (G + A) − ε.
dDrying off at dim ⩾ 320.
Growth
Priority G to growth represents the investment in the construction of a mature individual and is linked to the level of achievement of a mature structural body mass, assumed to be an individual genetic trait. The main component of this investment is the allocation of available energy to build tissue. In a general model for ontogenetic growth, West et al. (Reference West, Brown and Enquist2001) defined the quantity 1 − (current weight/mature weight)1/4 as the proportion of total available metabolic energy fuelling the production of new biomass, the remaining quantity (current weight/mature weight)1/4 being the proportion of total available metabolic energy allocated to maintenance and other functions. This formalism is used to describe the priority to grow and the differential equation for G (see Table 2) is defined consistently with the analytical rule given by

where W and WM are, respectively, the current and mature non-labile body mass weights (see Table 3). The flow d (development) from G to R is defined to update G according to changes in W with respect to
(2).
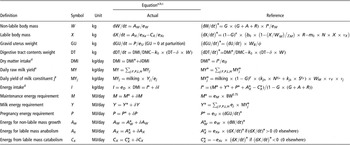
Compendium of operating sub-model equations giving reference and actual performance and energy flows for age t ranging from 0 to 7300 days where G, A, R, U, N and S are priorities defined in the regulating sub-model

aParameters: δ, χM, βW, βX, φ: body mass composition; WM, νY, νX, νj: genetic scaling; b 0, m 0, k 0: BW change; x, y, yjN, yjS: scaling exponents of differential priority; kjN, kjS: milk constituents secretion; DMC: diet DM content; eD, eU, eM, eW, eXa, eXc, ej: ME conversion factors.
bBirth value:  .
cLeading to: body weight (kg): BW = EBW + GU + DT; empty body weight (kg): EBW = W + X; empty body fat (kg):  body condition score (0–5):
 milk constituent j content (kg/kg): MCj = MYj/MY if MY > 0.
dAssumption of non-challenged feeding: δDMI = 0 and δI = δM = δY = δP = δAW = δAX = δCX = 0 v. challenging feeding in Martin and Sauvant (Reference Martin and Sauvant2010).
eMilk fat: j:F; milk protein: j:P; milk lactose: j:L; milk water : j:H; milking: milking status.
Ageing
Priority A to ageing represents the relative loss in other priorities. The increase in A with time relies on the progressive decline with age of the ability to perform the work of life, including survival and reproduction (Brody, Reference Brody1924). The flow s (senescence) from R to A is arbitrarily formalized to induce a sigmoid shape for A (Figure 2) and to cause the integral transfer of the sum of relative priorities to A (A→1 and G + R + U + N + S→0 with age).
Reserves
Priority R concerns the goal of balancing body reserves assuming the existence of an optimal target level of body reserves (Friggens, Reference Friggens2003) maintained by physiological processes of storage and mobilization. Accumulation of body reserves to reach this target level occurs during the developmental stage of life, and also for the reconstitution of this target level during reproductive cycles. Mobilization occurs at parturition as part of the lactation process and is targeted by N (see Newborn section) but also takes place for the deconstruction of excessive levels of body reserves constituted during periods of overfeeding (see Martin and Sauvant, Reference Martin and Sauvant2010). Relying on Friggens (Reference Friggens2003), the view taken here is that the changes in body reserves are to a large extent genetically driven and follow a trajectory that is a natural component of the reproductive cycle to support the evolutionary goal of maximizing reproductive success. The body reserve reconstitution at the end of a reproductive cycle has the goal of safeguarding the subsequent reproductive cycle. From that standpoint, through the balance of a body condition compatible with reproduction, priority R expresses a potential maternal investment in reproduction: R is charged (using the analogy of a battery) during the developmental stage of life (flow d), progressively discharged by senescence (flow s) and cyclically discharged (flow p, pregnancy) and recharged (flow w, weaning) during reproductive cycles (Figure 2). Since U + N + S = 0 during the non-reproductive stages of life, priority R = 1 − (G + A), quantifies the level of potential investment in reproduction, that is, a ‘quantity of priority’ potentially conveyable from R to U, which increases during development and decreases in older animals. The key role of R as a source for priority to reproduction in the model reflects the crucial importance of energy storage in body tissues in reproduction of mammals (Pond, Reference Pond1984; Oftedal, Reference Oftedal2000). As seen in Figure 2, priority R oscillates during the reproductive stages of life defining ‘opportunity peaks’ for reconstitution of body reserves between reproductive cycles. During the non-reproductive stages, R shows a continuous and undisturbed pattern implying a priority to stabilize body reserves at an optimal level.
Unborn
Priority U to the unborn represents the maternal investment to complete successfully the current pregnancy. The flow p (pregnancy) from R to U is derived from a model of foetal growth (Laird, Reference Laird1966) with the assumption that priority U to pregnancy is proportional to foetal growth (see Appendix B). The equation for p is designed to yield R = 1 after π days of pregnancy and the time of parturition is defined as the integral transfer of U to N, that is, the time of maximal investment in the current reproductive cycle (Friggens, Reference Friggens2003).
Newborn
Priority N to the newborn represents the maternal investment in physiological functions allowing the initiation of lactation to provide nutrients for the neonate’s requirements. The expression of this investment is the mobilization of body reserves of the mother and lactogenesis. Structurally, N can be seen as an intermediary compartment that ensures continuity between gestation and lactation within the reproductive cycle. The flow l (lactation) from N to S describes, with a simple mass action, the transfer of maternal investment from N (priority, inherited from U at parturition, to initiate lactation) to S (priority to maintain lactation).
Suckling
Priority S to the suckling calf represents the maternal investment in physiological functions allowing lactational persistency. As previously mentioned, both N and S are priorities to the survival of the same physical calf through lactation, but N and S are priorities to specific components of this process, namely its short-time initiation and its long-time course, respectively. The flow w (weaning) describes the trade-off between priorities S and R, that is, the shift between the priority to continue to invest in the lactation (the current reproductive cycle) and the priority to restore body reserves to start a new reproductive cycle. The flow w is influenced by the effect of the level of body reserves, the effect of pregnancy and the effect of mammary gland stimulation. First, when body reserves are low, the transfer from S to R is accelerated and priority to maternal investment in the suckling calf is decreased to support the priority to reconstitution of maternal body reserves (Wade and Schneider, Reference Wade and Schneider1992). In challenging contexts such as food restriction, ‘homeostatic controls for survival can overwhelm homeorhetic mechanisms’ (Bauman and Currie, Reference Bauman and Currie1980), so that the priority of staying alive prevails. Formally, this effect represents the synchronization of the regulating sub-model with the operating sub-model according to the level of body reserves. An emerging property of this formalism is that as the level of body reserves is higher before the first reproductive cycle (O. Martin, unpublished results), the transfer of S to R is slower in the first reproductive cycle, which induces a better persistency of the priority to lactation in primiparous cows, which is a known feature of lactation. Second, the start of a new reproductive cycle induces a decrease in priority to the suckling generation in favour of the next generation to be born (Coulon et al., Reference Coulon, Perochon and Lescourret1995). Third, the transfer from S to R is accelerated when the young are no longer suckling after weaning or death, or when the animal is no longer milked after drying off in the dairy production context.
Structure of the operating sub-model
The performance measures considered in the operating sub-model concern BW(kg), body condition score (BCS, 0 to 5 scale defined by Mulvany, Reference Mulvany1977), milk yield (MY, kg/day), milk fat (j: F), protein (j: P), lactose (j: L) and water (j: H) yields (MYj :F ,P ,L ,H, kg/day) and content (MCj :F ,P ,L ,H, g/kg), and dry matter intake (DMI, kg/day). The daily raw milk yield is defined as the sum of yields of milk lactose, protein, fat and water, such that: MY = Σj :F ,P ,L ,HMYj. BW (kg) is given by BW = EBW + GU + DT, where EBW (kg) is the empty BW given by EBW = W + X, where W (kg) is the weight of the non-labile body mass, X (kg) is the weight of the labile body mass (body reserves), DT (kg) is the weight of the digestive tract contents and GU (kg) is the weight of the gravid uterus including the foetus and products of conception (placentome, membranes and fluids).
The operating sub-model describes the metabolizable energy flows associated with material flows expressing intake, growth and milk production. The central energy compartment of the model is the zero pool of metabolizable energy (ME, MJ), which links the inflow and outflow of energy.
The differential equation for ME is

where I (MJ/day) is the energy inflowing from diet, AW (MJ/day) is the energy for growth in W, AX (MJ/day) is the energy for anabolism of X, CX (MJ/day) is the energy from mobilization of X, P (MJ/day) is the energy for pregnancy, Y (MJ/day) is the energy for milk secretion and M (MJ/day) is the energy for maintenance. The principle of energy conservation (dME/dt = 0) implies I + CX = M + AW + AX + P + Y.
The diagram of this operating sub-model linking energy flows to performance (material flows) is presented in the companion paper. The generic term Q for performance refers to any one of {DMI,W,X,DT,GU,MY,(MY,MC)j :L ,F ,P ,H} and the generic term E for energy flows refers to any one of {I,M,AW,AX,CX,P,Y}.
Formalism of the operating sub-model
Equations
Given the terms of body composition W and X at any time t (age in days) and the so-called GARUNS pattern of priority defined with the formalism given in Table 2, the reference pattern of performance (Q* and associated E*) is calculated with the formalism given in Table 3 and detailed in Appendixes C and D (energetics of body tissues). This formalism involves (1) a teleonomic-based priority control and (2) genetic scaling parameters.
The resulting reference energy flow I* = M* + AW* + AX* − CX* + P* + Y* corresponds to the energy required to realize the reference pattern of performance. In the present paper, energy intake is assumed to cover reference requirements (non-challenged feeding) such that DMI = DMI* and I = I*. This leads each energy flow to its reference level (E = E*) and to the full expression of the reference performance (Q = Q*). The alternative situation where DMI ≠ DMI* and I ≠ I* leads to a deviation from the reference pattern (E = E* + ∂E and Q = Q* + ∂Q) and implies deviations of the trajectories of priorities. This situation is dealt with in the companion paper (Martin and Sauvant, Reference Martin and Sauvant2010).
Teleonomic basis
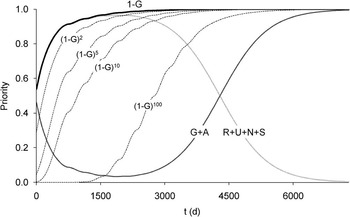
Priorities to functional goals are used to drive physiological functions. This control, summarized in Table 1, is formalized by way of (1) priorities, (2) combinations of priorities and (3) differential priorities. Combinations of priorities to elementary functions allow the construction of specific regulation rules. For instance, U + N + S is the priority to reproductive functions and the complementary U + A + R = 1 − (U + N + S) is the priority to non-reproductive functions, which is used to inhibit growth during reproductive cycles. The notion of differential priority embodies the idea that a given physiological process, though contributing to a priority goal, may be only partially effective according to the level of that priority. The formalism of a priority raised to the power of a given exponent is used to capture this idea (Figure 4). It allows the construction of the so-called ability indexes aimed at regulating physiological functions. For instance, given 1 − G, which is the priority to functions of the fully developed individual, the differential priority (1 − G)x is defined as the ability to store and mobilize body reserves, where x is the exponent parameter. During development, the differential priority (1 − G)x increases at a proportionally lower rate than the priority 1 − G. This formalism accounts for the delayed deposition of fat during growth (allometry).
Trajectories of global priorities (1 − G, G + A and R + U + N + S), and differential priority (1 − G)K for K = {2,5,10,100} over 20 years of life (with priorities G: growth, A: ageing, R: balance of body reserves, U: ensuring survival of the unborn calf, N: ensuring survival of the newborn calf and S: ensuring survival of the suckling calf).

The priority control allows the formalization of the following physiological phenomena concerning BW and milk yield. Increase in W is inhibited during reproductive cycles, when gestation and lactation prevail. Changes in X during its lifetime are defined through the balance of a target equilibrium level of body fatness (Friggens et al., Reference Friggens, Ingvartsen and Emmans2004) and the mobilization of body reserves. The constitution of body reserves is postponed relative to the growth of the non-labile body mass in early developmental stages (Owens et al., Reference Owens, Dubeski and Hanson1993; Vernon et al., Reference Vernon, Barber and Travers1999). The balancing of labile body reserves to an optimal level prevails during the developmental stages of life (constitution of body reserves) and during the transition between the lactational and gestational stages of two successive reproductive cycles (reconstitution of body reserves by mobilizing surplus or filling deficit). The balancing of body reserves is also inhibited at the onset of lactation, consistently with the fact that anabolism of body tissues is known to be hindered in early lactation (Vernon and Flint, Reference Vernon and Flint1984; Chilliard and Robelin, Reference Chilliard and Robelin1985; McNamara, Reference McNamara1997). Mobilization of X at parturition contributes to the supply of energy for milk secretion dedicated to the survival of the neonate, which is the main feature in mammals (Pond, Reference Pond1984; Oftedal, Reference Oftedal2000). Moreover, mobilization is assumed to be proportional to the level of body reserves (Broster and Broster, Reference Broster and Broster1998; Martin and Sauvant, Reference Martin and Sauvant2002). Milk yield increases with age (Brody et al., Reference Brody, Ragsdale and Turner1923) as the mammary gland reaches maturity.
Genetic scaling
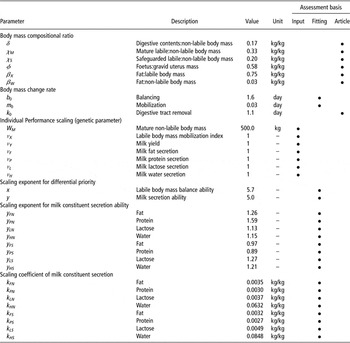
Given the dynamics incorporated by the GARUNS pattern of priority, genetic parameters are used to scale individual body and milk performance. Animal size is scaled with the genetic parameter WM (kg) defined as the non-labile body mass weight at maturity and set to 500 kg during model development. Mobilization of labile body mass is modulated by the dimensionless genetic parameter νX scaling mobilization of body reserve. The yield of each milk constituent j is modulated by the dimensionless genetic parameter νj:F,P,L,H. Moreover, milk yield is modulated by the dimensionless genetic parameter νY scaling milk production potential. Genetic parameters νX, νj:F,P,L,H and νY were set to 1 during model development.
Parameters
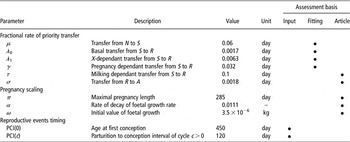
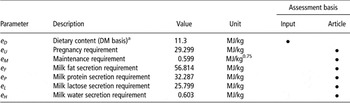
The list of parameters of the regulating sub-model is given in Table 4 and the list of parameters of the operating sub-models is given in Tables 5 and 6. Numerical values were either fixed as user-defined input (genetic parameters, timing of reproductive events and diet energy content) or assessed on a literature basis or estimated through a fitting procedure (see Methods section). A detailed description of the literature-based assessment of parameter values is given in Appendix E.
Parameters of the regulating sub-model describing the dynamics of priorities G, A, R, U, N and S

Parameters of the operating sub-model: performance

Parameters of the operating sub-model: metabolizable energy conversion factors

aDiet DM content : DMC = 0.6 kg DM/kg.
Methods
Implementation
The model was implemented with the Modelmaker 3.0 software (Cherwell Scientific Ltd, 2000) using the Runge–Kutta 4 numerical integration procedure and a fixed integration step of 1 day for t ranging from 0 to 7300 days (∼20 years, arbitrary long-term horizon).
Evaluation of performance dynamics
Our first specific objective was to evaluate the efficacy of using teleonomic arguments to describe performance throughout the lifespan of dairy cows. To address this issue, a fitting procedure was achieved on literature data to capture an average profile of dairy cow performance (15 references, see Calibration data sets in the Literature resources section). Numerical values of parameters of the operating sub-model (b 0, m 0, x, y and {kjn, yjn, kjs, yjs}j :L ,F ,P ,W) together with parameters of the regulating sub-model (μ, λ 0, λ 1 and γ) were thus simultaneously estimated through a least square procedure performed with the simplex algorithm of the Modelmaker 3.0 software with default parameter values and 100 convergence steps. These parameters define the reference dynamic pattern of performance. In addition, the realism of the resulting reference dynamic pattern of intake was evaluated. Model simulation of DMI* was generated with default values of genetic parameters to produce an average intake curve from birth to 2000 days of life, focusing on a 5-year productive lifetime. This curve was graphically compared with curves produced with literature models of intake (21 references, see Intake models in the Literature resources section).
Evaluation of performance diversity
Our second specific objective was to evaluate the efficacy of using genetic scaling parameters to describe the performance of various genotypes of dairy cows. To address this issue, model simulations were generated with different values of parameters scaling individual size (WM = {300; 450; 600}) and performance (νX = {0.2; 1.0; 1.8}, νY = {0.5; 1.0; 1.5}, νj :F ,P ,L = {0.9; 1.0; 1.1}) to produce a set of curves expressing the model variability relying on genetic diversity. These curves were graphically compared with curves produced with literature models on body, milk and intake performance (37 references, see Performance models in the Literature resources section).
Literature resources
Calibration data sets
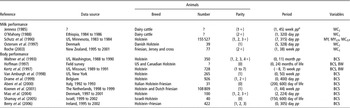
The data sets (15 references, 696 records) used for model calibration concerned BW changes during growth (2, 81), BCS changes during growth and over successive gestation/lactation cycles (10, 355) and milk yield (1, 63) and composition (5, 197) over successive lactations in dairy cows (mainly of the Holstein–Friesian type). References of literature data are detailed in Table 7.
References of data used for model calibration

app = post partum.
Intake models
A series of 21 intake models published between 1965 and 2007, listed in Appendix F and discussed in Faverdin (Reference Faverdin1992), Ingvartsen (Reference Ingvartsen1994) and Roseler et al. (Reference Roseler, Fox, Chase, Pell and Stone1997), was considered. Each literature model was applied to calculate an estimated intake pattern with specific input variables provided by model output performance Q*. Predictors used in these empirical models relate to BW and milk production (MY*, MY*j :F ,P, MY*F, MY4* = MY* × (0.4 + 15 × MYF*), BW*, (dBW/dt)* and BCS*), physiological times (day in milk: dim; week in milk:  , where
 is the integer part of x; day in pregnancy: dip; week in pregnancy:
 ; age at parturition of the reproductive cycle c: tp(c)*), and feed characteristics set to an average standard diet (concentrate: DMCO = 0.40 kg/kg DM, crude fibre: CF = 0.26 kg/kg DM, acid detergent fibre: ADF = 0.31 kg/kg DM, neutral detergent fibre: NDF = 0.43 kg/kg DM), digestible energy: DE = 3.3 MJ/kg DM).
Performance models
A survey of 37 articles published between 1928 and 2007 provided parameter values of different empirical models for BW, BCS, MY, MCF and MCP fitted by authors to successive lactation data recorded worldwide on cows of various dairy cattle breeds (see Appendix G). Published models simulating the growth pattern of dairy cattle from birth to maturity without particular representation of BW changes during reproductive cycles were also considered.
Results
Evaluation of performance dynamics
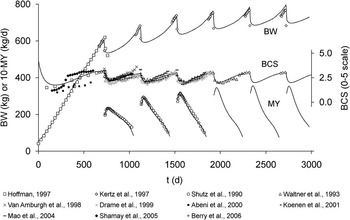
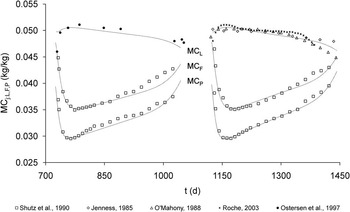
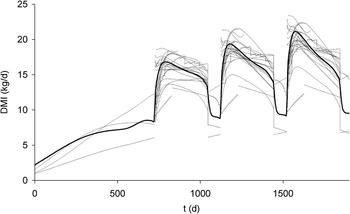
Model simulations of BW*, BCS* and MY* from birth to 3000 days of life and MC*j :F ,P ,L over the first three lactations are plotted with data used in the global fitting procedure in Figures 5 and 6. The goodness of fit is given through reported root mean square errors: BW*: 15.0 kg (2 references, 81 records); BCS*: 0.3 unit of the 0 to 5 scale (10, 355); MY*: 0.8 kg/day (1, 63); MCF*: 1.2 × 10⁻³ kg/kg (1, 63); MCP*: 1.0 × 10⁻³ kg/kg (1, 63); MCL*: 0.8 × 10⁻³ kg/kg (4, 71). Model efficacy to simulate BW and condition changes during growth and reproductive cycles and milk yield and composition during lactation was found to be satisfactory. In particular, the increase in peak milk yield and the associated change in milk persistency along the lactation course from the first to the third parity are well represented. Model simulations of DMI are plotted in Figure 7 together with predictions of literature models from birth to 2000 days of life. The lifetime shape of intake simulated by the model falls in the range of predictions of these models: 45% of literature model-based predictions of intake are within the reference pattern DMI* ± 1.0 kg/day; 72% are within DMI* ± 2.0 kg/day; 87% are within DMI* ± 3.0 kg/day. The early lactation period (3 months post partum) is the period of maximal deviation between the reference model and literature models (average overestimation of 1.0 kg/day).
Model simulations of body weight (BW, kg), body condition score (BCS, 0 to 5 scale), and milk yield (MY, kg/day) from birth to 3000 days of life plotted with data used for model calibration.

Model simulations of milk fat (MCF, kg/kg), protein (MCP, kg/kg) and lactose (MCL, kg/kg) contents (kg/kg) during the first and second parities plotted with data used for model calibration.

Model simulations of dry matter intake (DMI, kg/day) from birth to 2500 days of life plotted with simulations of published models.

Evaluation of performance diversity
BW and condition
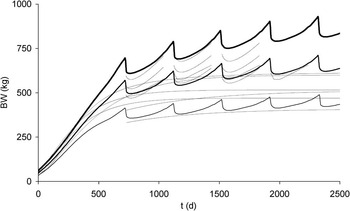
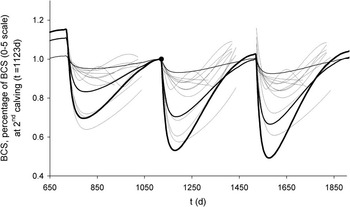
Model simulations of BW* from birth to 2500 days of life generated with three different values of the genetic parameter scaling body size (WM = {300; 450; 600}) are shown in Figure 8. The generated diversity of patterns during growth and throughout the reproductive cycles is consistent with the range of variation of literature models. The range of variation of the scaling size parameter WM allows simulation of growth pattern differences within breeds (between animals of different strains) and between breeds. The model was additionally fitted to curves derived from the models proposed by Turner (Reference Turner1928) and Rotz et al. (Reference Rotz, Mertens, Buckmaster, Allen and Harrison1999) to determine values of the scaling parameter WM to simulate growth patterns for the Jersey (WM = 275) and Guernsey (WM = 340) breeds and for animals of small (WM = 440), average (WM = 500) and large (WM = 560) sizes within the Holstein breed. The variability of BCS at calving results from previous feeding regimens (Garnsworthy and Topps, Reference Garnsworthy and Topps1982; Ruegg and Milton, Reference Ruegg and Milton1995). The current version of the model produces a reference pattern BCS*, nutritionally non-challenged, and the parameter νX only governs the intensity of body reserves mobilization post partum. Consequently, to evaluate the model simulations v. previously modelled dynamics of BCS during lactation, all curves are expressed in percentage of the 2nd parity post-calving BCS and are shown in Figure 9. The generated diversity of patterns with three different values of the genetic parameter scaling body reserves mobilization potential (νX = {0.2; 1.0; 1.8}) is consistent with the range of variation of literature models.
Model simulations of BW (kg) for increasing values of the input parameter scaling body size (WM = {300,450,600} kg) plotted with simulations of literature models for different dairy cattle breeds and sizes within breeds.

Model simulations of BCS (0 to 5 scale) expressed in % of BCS at second calving (t = 1121 day of age) for increasing values of the input genetic parameter scaling individual body reserves mobilization potential (νM = {0.2,1.0,1.8}) plotted with simulations of literature models.

Milk performance
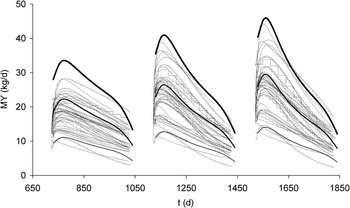
Model simulations of MY* generated with three different milk potential values (νY = {0.5; 1.0; 1.5}) are shown in Figure 10. The raw milk yield shape and scale changes with parity are consistent with the previously published models and genetic parameters allow the simulation of the variability of milk production levels. For a reference third parity Holstein cow (WM = 500), peak milk yields of 15 and 50 kg/day are generated with νY = 0.5 and νY = 1.5, respectively. These values are associated with 305-day milk, milk fat, milk protein and milk lactose yields of 3215, 123, 106, 159 and 10 151, 389, 338, 501 kg, respectively, for the 15 and 50 kg/day peak milk, with the average milk fat, protein and lactose contents remaining stable at 38, 33 and 49 g/kg, respectively. The same conclusion on the ability of the model to produce a realistic diversity of milk composition pattern is drawn for model simulations of MC*j :F ,P generated with three different values of milk composition genetic parameters (νj :F ,P = {0.9; 1.0; 1.1}). This range of variation produces average milk fat contents ranging from 35 to 43 g/kg, milk protein content ranging from 31 to 38 g/kg and milk lactose ranging from 44 to 54 g/kg. Genetic parameters WM, νX and νj :F ,P,L can thus be used to specify a particular genotype of a given dairy breed.
Model simulations of milk yield (MY, kg/day) in first to third parity for increasing values of the input genetic parameter scaling individual milk yield potential (νY = {0.5,1.0,1.5}) plotted with simulations of literature models.

Discussion
The results presented in this paper illustrate the capacity of the model to describe the dynamics and diversity of dairy cows’ performance during growth and over repeated reproductive cycles throughout their lifespan, which indicates the potential of basing a model on teleonomic arguments and genetic scaling parameters.
Teleonomic arguments
The teleonomic basis was to consider the animal ‘as an active biological entity with its own “agenda” ’ (Friggens and Newbold, Reference Friggens and Newbold2007). Following this idea, the modelling of a trajectory, that is, a schedule of priority of life functions, was the starting point (Friggens et al., Reference Friggens, Ingvartsen and Emmans2004). Ultimately, relative priorities change to ensure the survival of the individual and to maximize the production of viable offspring. Trajectories of life function priority pertain to a schedule of changing dominance of the following main goal-directed functions: growth to reach maturity, investment in reproduction to produce and rear offspring, and modulation of body reserves to safeguard physiological requirements for future reproduction and counter seasonal changes in food availability. Homeorhesis is the tendency to home on to such a physiological dynamic process (Kennedy, Reference Kennedy1967) and refers to the orchestrated changes in metabolism necessary to support a dominant physiological state (Bauman and Currie, Reference Bauman and Currie1980). The term homeorhesis (‘similar flow’) was introduced by Waddington (Reference Waddington1957) to expand the concept of homeostasis (‘similar state’; Bernard, Reference Bernard1865; Cannon, Reference Cannon1929) and to capture the idea that what living things really hold ‘constant is not a single parameter, but a time-extended course of change, that is to say, a trajectory’. Waddington introduced the term chreod (‘necessary path’) to describe the trajectory itself.
From the modelling standpoint, this distinction between the end and the means-to-the-end is an essential point, and has motivated the explicit modelling of a trajectory compatible with life, genetically determined and evolutionarily targeted to ensure species continuation. Relying on Waddington’s concept of chreod, it was assumed that from birth to death, relative priorities of life functions follow a specific dynamic pattern of changes adapted to the realization of the work of life. The introduction of the idea of goal-directed process as a driving force referred to the teleonomy concept of Monod (Reference Monod1970): ‘organisms are endowed with a purpose which is inherent in their structure and determines their behavior’. This deterministic point of view focuses on the biological significance of physiological processes giving rise to performance rather than focusing on their biochemical determinants, which is the basis of aggregated mechanistic models such as Baldwin’s model (Baldwin et al., Reference Baldwin, France and Gill1987a, Reference Baldwin, Thornley and Beever1987b and Reference Baldwin, France, Beever, Gill and Thornley1987c; Baldwin, Reference Baldwin1995). The proposed model falls into the category of ‘teleonomic models’ according to the typology of Thornley and France (Reference Thornley and France2007), that is, explicitly incorporating an apparent goal-directed process.
The main originality of this approach is to describe lifetime performance over successive reproductive cycles, allowing the focus on long-term residual effects, mainly by way of body reserves. The use of teleonomic arguments involves a reference pattern of performance, expressing a potential. The notion of potential refers to an optimal equilibrium between life functions rather than a maximum possibility, which is the classical view used for instance by Faverdin et al. (Reference Faverdin, Delaby and Delagarde2007) for milk production potential. The trajectory involves an optimal body condition balanced during the transition between successive reproductive cycles and safeguarded to ensure individual survival. This idea was already captured by Friggens et al. (Reference Friggens, Ingvartsen and Emmans2004) in developing a genetically driven pattern of body lipid change through pregnancy and lactation in dairy cattle, seen as a trajectory-safeguarding reproductive success (Friggens, Reference Friggens2003), and used in a model of feed intake regulation in dairy cows (Petruzzi and Danfaer, Reference Petruzzi and Danfaer2004). Published models considering lifetime performance were mainly built with a herd level perspective with a simple and operational representation of nutrient partitioning at the animal level (Blackburn and Cartwright, Reference Blackburn and Cartwright1987; Sorensen et al., Reference Sorensen, Kristensen and Thysen1992; Tess and Kolstad, Reference Tess and Kolstad2000). Several models of dairy animals have already incorporated an explicit representation of a ‘driving force’ underlying physiological processes. The first attempt was performed by Neal and Thornley (Reference Neal and Thornley1983) by way of a theoretical hormone controlling the division rate of basic udder cells to provide active secretory cells in the mammary gland. Further developments were carried out by Dijkstra et al. (Reference Dijkstra, France, Dhanoa, Maas, Hanigan, Rook and Beever1997), Vetharaniam et al. (Reference Vetharaniam, Davis, Soboleva, Shorten and Wake2003a and Reference Vetharaniam, Davis, Upsdell, Kolver and Pleasants2003b) and Pollott (Reference Pollott2004). This principle of modelling was also used to direct adipose tissue anabolism and catabolism (Sauvant and Phocas, Reference Sauvant and Phocas1992; Baldwin, Reference Baldwin1995; Martin and Sauvant, Reference Martin and Sauvant2007) or to provide kinetics of plasma growth hormone and insulin driving exchanges between the tissues and udder (Danfaer, Reference Danfaer1990). However, none of these approaches focused on a centralized regulating model. The model presented here is a generalization of the approach proposed in Puillet et al. (Reference Puillet, Martin, Tichit and Sauvant2008) in which the modelling of dynamic drives for gestation and lactation was considered within a dedicated sub-model in dairy goats.
The main strength of the centralized regulating system is that it formalizes a coordination of functions. Thus, gestation and lactation are naturally stages of the same reproductive cycle and the elasticity of body reserves is considered as a full-fledged component of reproductive success.
The integration of teleonomic arguments is nevertheless only one way to develop a usable model and is not intended to formalize a biological theory of nutrient partitioning. The model can be used as a ‘virtual cow’ to simulate individual lifetime performance, formalize hypotheses and provide inputs to run scientific models focusing on particular physiological aspects, such as the control of fertility or the description of main metabolic pathways associated with performance (Martin and Sauvant, Reference Martin and Sauvant2007). For instance, a model of reproduction predicting conception times could use simulations of milk yield, intake and body reserves as predictors and in turn set the timing of reproductive events. However, by its nature, the regulating sub-model of priority cannot be directly fit or fed with experimental data.
The priority formalism applied here to drive performance could be extended to directly drive a reference pattern of hormone kinetics and/or metabolite transactions in a mechanistic whole-animal model, and thus give quantitative milestones for aggregative modelling approaches. The ability of the GARUNS pattern to control underlying processes such as lipolysis and lipogenesis, gluconeogenesis or mammary gland amino acid uptake, for instance, would have to be explored to do so.
Scaling parameters
The incorporation of scaling parameters is proposed as a way to formalize individual patterns of performance, interpreted as genetic profiles. This feature is intended to open perspectives of connecting this approach with works focusing on genetic aspects of animal performance and their elaboration from genotypes to animal products (Bryant et al., Reference Bryant, Lopez-Villalobos, Holmes and Pryce2005; Doeschl-Wilson et al., Reference Doeschl-Wilson, Knap, Kinghorn and Van der Steen2007). These so-called genetic parameters have been conceived as command buttons allowing the use of the model as a simulation tool for differentiated profiles of performance. Each genetic parameter modulates a particular trait, the structure of the model being preserved. The model is thus flexible and suitable for simulations of a large range of variability, between individuals within a breed as well as between individuals of different breeds.
Nevertheless, the ability of the model to describe individual performance has to be evaluated. Do these genetic parameters provide sufficient flexibility? Does ad libitum recorded performance correspond to the reference pattern of performance? Which profiles among the possible combinations of genetic parameters are realistic patterns of performance? These questions will have to be addressed to corroborate these first promising results. Moreover, for simplicity and to preserve the generic feature of the regulating sub-model, these parameters have only been incorporated into the operating sub-model. Further work will be necessary to evaluate the need to incorporate deformations of the regulating sub-model pattern of priorities pertaining to genetics. Although such questions remain to be answered, this model has been found to have the necessary structure to reproduce genetic differences in a biologically meaningful way. In the future, the model could be specifically designed as a generic tool to simulate genetic selection effects on dairy livestock performance.
Conclusion
We propose a conceptual framework for modelling lifetime performance of dairy livestock based on the dynamic partitioning of life function priorities. This approach formalizes performance as the realization of a goal-directed and genetically scaled trajectory. We applied this framework to dairy cows to build a whole-animal and lifetime predictive tool. As such, it provides a dynamic pattern of the body, milk and intake performance in which the monitoring of body reserves is considered as a full-fledged function. The conceptual framework, based on teleonomic arguments and incorporation of genetic scaling keys, is proposed as a way to tackle the question of nutrient partitioning prediction in nutritional models and as a postulate to be tested in other lactating species. The companion paper contains the description of nutritional effects implying deviations from the reference pattern of performance.
Acknowledgements
The authors are indebted to the reviewers for their constructive criticism and comments, which helped in improving the manuscript, and also thank Laurence Puillet and Muriel Tichit for stimulating discussions relating to the ideas contained in this paper.