1. INTRODUCTION
The purpose of this paper is to present the concept of clustering of large sets of bathymetric data in a reduction process, which is especially useful for delivery of reduced data sets for the production of precise bathymetric and port Electronic Navigational Charts (ENCs) and also for large-scale bathymetric maps resulting from hydrographic surveys. For precise plan and chart production it is very important to use the most accurate data possible. Aspects of ENC production planning and navigational data evaluation have been examined by many researchers, e.g. Hyla et al. (Reference Hyla, Wawrzyniak and Kazimierski2015), Janowski et al. (Reference Janowski, Nowak, Przyborski and Szulwic2014), Liu et al. (Reference Liu, Zhao and Pan2014), Kazimierski and Stateczny (Reference Kazimierski and Stateczny2015), Przyborski (Reference Przyborski2002), Tsou (Reference Tsou2010), Ye et al. (Reference Ye, Meng, Yang and Anand2014). ENCs are produced according to the strict S-57 standard enforced by the International Hydrographic Organization (IHO) and are visualised by means of the Electronic Chart Display and Information System (ECDIS).
Bathymetric data are usually gathered by Multi-Beam Echosounder (MBES), which acquires a large number of data points. Bathymetric data processing is performed in several stages. Suitable gathering, preparation and presentation of data is a long and laborious process. The gathering and processing of bathymetric data have been discussed by several authors, e.g. Lubczonek (Reference Lubczonek, Rutkowski, Siekmann and Tadeusiewicz2004), Lubczonek and Stateczny (Reference Lubczonek, Stateczny, Rutkowski and Kacprzyk2003), Maleika (Reference Maleika2015a; Reference Maleika2015b), Stateczny (Reference Stateczny, Brebbia and Olivella2000; Reference Stateczny, Brebbia and Sciutto2002a).
One of the problems connected to bathymetric measurements is registering a large amount of data. The main objective of the authors' research is the compilation of a new reduction algorithm for bathymetric data to be used for the production of electronic navigational charts. Data reduction is a procedure by which the size of a data set is reduced, in order to make the analysis easier and more effective. For navigation safety it is very important to retain points of minimum depth. There are several methods to execute data reduction. One of them is to transform a large quantity of variables into a single, common value. Another way to reduce data is to use advanced statistical methods that make it possible to decrease the size of a data pack by breaking it down into basic factors, dimensions or concentrations, pinpointing the basic relations between the analysed instances and variables. Another method is to deduct a given number of instances from a large array, while maintaining its overall suitability for the analysed population. Frequently, hydrographic systems generate a grid by using means or weighted means (Stateczny and Wlodarczyk-Sielicka, Reference Stateczny, Wlodarczyk-Sielicka and Kryszkiewicz2014).
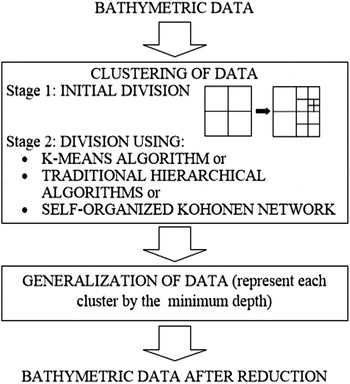
The main purpose of the authors is the creation of a new reduction algorithm for bathymetric data. Spatial clustering consists of grouping together similar features. All clustering algorithms aim to minimise the measure of dispersion within the clusters. The clustering of data is the first part of the search algorithm, as shown in Figure 1. The next step is the generalisation of bathymetric data.
Proposed algorithm for bathymetric data reduction.

The authors aim to categorise a set of points into groups and then represent each group by a single point (the minimum depth) depending on the compilation scale. It should be emphasised that, in their reduction method, measuring points of minimum depth will be presented regardless of the scale used, and they will remain in their actual position. The position of such a measuring point and the depth at this point will not be an interpolated value.
Another approach to navigational data processing is multisensory data fusion. Aspects of navigational data fusion have been presented by many researchers, e.g. Kazimierski and Stateczny (Reference Kazimierski and Stateczny2015), Stateczny and Bodus-Olkowska (Reference Stateczny, Bodus-Olkowska and Mikulski2014; Reference Stateczny, Bodus-Olkowska and Rohling2015), Stateczny and Kazimierski (Reference Stateczny, Kazimierski and Rohling2013), Wawrzyniak and Hyla (Reference Wawrzyniak and Hyla2014).
In this article the authors present the results of comparison and analysis of clustering bathymetric data using the following selected methods: K-means clustering algorithm, traditional hierarchical clustering algorithms and Self-Organising Map (SOM) using artificial neural networks. This comparison allows the choice of clustering methods, which will be used in the next stage of research into finding a reduction method for bathymetric data.
2. THE THEORETICAL BASIS OF TEST METHODS
It is well known that the diversity of the final division of data depends on the method used to cluster the samples. This article presents a comparison and analysis of results of clustering bathymetric data using the following selected methods: non-hierarchical K-means method, classical hierarchical clustering algorithms and self-organising feature map using artificial neural networks. These methods are often used for grouping data. The authors focus on the use of these methods for grouping high-density bathymetric data.
2.1. K-means Clustering Algorithm
The K-means clustering algorithm is probably the best-known non-hierarchical method.
In general, there are n data points x i , i = 1…n that have to be partitioned into k clusters. The purpose is to appropriate a cluster to each data point. K-means is a method that tends to find the positions u i , i = 1…k of the clusters that minimise the distance from the data points to the cluster. K-means clustering solves:
 $$\mathop {arg\;min}\limits_c \sum\limits_{i = 1}^k {\sum\limits_{x \in c_i} {d(x,u_i ) =}} \mathop {arg\;min}\limits_c \sum\limits_{i = 1}^k {\sum\limits_{x \in c_i} { \vert \vert x - u_i \vert \vert _2^2 \vert}} $$
where c i is the collection of samples that belong to cluster i. K-means clustering uses the square of the Euclidean distance:
 $$d(x,u_i ) = \vert \vert x - u_i \vert \vert _2^2 $$
The procedure starts by determining the number of clusters, k. In the next step the algorithm designates a point as the cluster centre for each of the clusters: u i = a certain value, i = 1…k. In the third step all the samples are compared with each centre and assigned to the nearest cluster centre:
 $$c_i = \left\{ {\,j:d(x_j, u_i ) \le d(x_j, u_l ),\;l \ne i,j = 1, \ldots, n} \right\}$$
In the fourth step the centres of each cluster are recalculated by using the average vector of the samples assigned to the cluster:
 $$u_i = \displaystyle{1 \over { \vert c_i \vert}} \sum\nolimits_{\,j \in c_i} {x_j, \forall i} $$
where |c| is number of elements in c. The procedure is repeated until the centres no longer move around significantly (Li, Reference Li2007).
2.2. Hierarchical Clustering Algorithms
The agglomerative hierarchical algorithms fundamentally work in the following way. In the first step each of the samples to be clustered is examined as a unique cluster. The next step is to find the similarity or dissimilarity between every pair of samples in the data set. In this step the samples are compared using a selected measure of distance: Euclidean distance, standardised Euclidean distance, Minkowski distance, Mahalanobis distance, Chebychev distance or other. Next, the two clusters with smaller distance are linked. Only two clusters can be linked in each step (Mignoti and Lima, Reference Mignoti and Lima2006). A linkage method is used to compare the clusters in each step and to decide which should be grouped. There are several procedures for computing distance between clusters:
-
• average (uses the average distance between all pairs of objects in any two clusters):
(5) $$d(r,s) = \displaystyle{1 \over {n_r n_s}} \sum\limits_{i = 1}^{n_r} {\sum\limits_{\,j = 1}^{n_s} {dist(x_{ri}, x_{sj} )}} $$
-
• centroid (uses the Euclidean distance between the centroids of the two clusters):
(6)where
$$d(r,s) = \vert \vert \bar x_r - \bar x_s \vert \vert _2 $$
(7)
$$\bar x(r) = \displaystyle{1 \over {n_r}} \sum\limits_{i = 1}^{n_r} {x_{ri}} $$
-
• complete (uses the largest distance between objects in the two clusters):
(8)
$$d(r,s) = max\left( {dist(x_{ri}, x_{sj} )} \right),\quad i \in (1, \ldots, n_r ),\;j \in (1, \ldots, n_s )$$
-
• median (uses the Euclidean distance between weighted centroids of the two clusters):
(9)
$$d(r,s) = \vert \vert \widetilde{{x_r}} - \widetilde{{x_s}} \vert \vert _2 $$
-
• single (uses the smallest distance between objects in the two clusters):
(10)
$$d(r,s) = min\left( {dist(x_{ri}, x_{sj} )} \right),\quad i \in (1, \ldots, n_r ),\;j \in (1, \ldots, n_s )$$
-
• wards (uses the incremental sum of squares):
(11)
$$d(r,s) = \sqrt {\displaystyle{{2n_r n_s} \over {(n_r + n_s )}}} \vert \vert \bar x_r - \bar x_s \vert \vert _2 $$


where: r,s are clusters, n is the number of samples in a cluster, x is a sample in the cluster,
 $\bar x$
is the centroid of the cluster, and
 $\tilde x$
is the weighted centroid of the cluster.
As samples are paired into binary clusters, the newly formed clusters are grouped into larger clusters until a hierarchical tree is formed. The procedure is repeated until the desired number of clusters is achieved.
2.3. Self-Organising Map (SOM)
A new idea to solve computational problems associated with processing abundant amounts of bathymetric data is to use Artificial Neural Networks (ANN). Various aspects of ANN solutions for navigation purposes have been described by several authors, e.g. Balicki et al. (Reference Balicki, Kitowski and Stateczny1998), Stateczny (Reference Stateczny and Katebi2002b; Reference Stateczny, Rutkowski, Siekmann and Tadeusiewicz2004). A very interesting idea is to cluster data by using a self-organising Kohonen network (Ciampi et al., Reference Ciampi, Lechevallier and Clustering2000; Kohonen, Reference Kohonen1982).
In the process of network learning there is no association between input signals and the output of the network. In the case of Kohonen networks, competition between neurons provides the basis for updating values assigned to weights. Put mathematically, it can be assumed that k is the number of clusters, x = (x 1, x 2, …, x p )′ is the input vector in the training case, where p is the number of variables, and w l = (w l1, w l2, …, w lp )′ is the weight vector associated with the node l, where w lj indicates the weight assigned to input x j to the node l. Several objects of the training data set are presented to the network in random order. During the competition between neurons, the neuron closest to the input sources, in the meaning of the chosen distance method calculation, is a winner for the input data set. The degree of adjustment depends on the distance of the neuron from the input data. The node l is moved some proportion of the distance between it and the training case. The proportion is determined by the learning rate. For several objects i in the training data set, the distance d i between the weight vector and the input signal is calculated. Then the competition begins, and the node l with the smallest distance d i is the winner. The weights of the winner are then updated using the learning rule. The weights of the non-winner are not modified. In general, the Euclidean distance is used to compare several neurons with several samples though any other metric could be chosen. The Euclidean distance between an object with observed vector x and the weight vector w l is:
 $$d(x,w_l ) = {\left\lceil {\sum\limits_{\,j = 1}^p {(x_j - w_{lj} )^2}} \right\rceil}^{1 \over 2}$$
The weight vector for the lth node in the sth step of the algorithm can be represented as
 $w_l^s $
, X
i
is the input vector for the ith training case and αs
is the learning rate for the sth step of training. After several steps, a training case X
i
is selected and the index q of the winning node is determined:
 $$q = \mathop {arg\;min}\limits_l \vert \vert w_l^s - X_i \vert \vert $$
The Kohonen update rule for the winner node is:
 $$w_q^{s + 1} = w_q^s (1 - \alpha ^s ) + X_i \alpha ^s = w_q^s + \alpha ^s (X_i - w_q^s )$$
It should be noted that for all non-winning nodes l,
 $w_l^{s + 1} = w_l^s $
(Mignoti and Lima, Reference Mignoti and Lima2006). SOMs learn to cluster data based on similarity and topology, with a preference (but no guarantee) of assigning the same number of instances to each class. In Matlab software, SOMs take these arguments: layer topology function, row vector of dimension sizes, number of training steps for initial covering of the input space, initial neighbourhood size and neuron distance function.
3. EXPERIMENTS
All test methods were implemented using Matlab software, developed by MathWorks. To collect bathymetric data the floating laboratory Hydrograf XXI, with GeoSwath Plus 250 kHz sonar and supplementary equipment such as GPS/RTK, satellite compass and motion sensor installed, was used.
3.1. Test Area
For collecting bathymetric data the authors used the interferometric sonar system GeoSwath Plus 250 kHz. The measurement profiles were realised maintaining 100% coverage of the measured body of water. Test data were collected within Szczecin Harbour, near the Babina Canal, on 23 May 2010. During the survey a large amount of data was collected. Nowadays typical data sets for hydrographic surveys might contain in the order of several hundred million to a billion or more soundings, spread over a hectare of surface area. Very high-density data present the main operational limitation when using a standard computer. In order to solve this problem, the authors divided the original data point sets into smaller subsets, which could be trained separately. In the next stages of the research, the authors will use the selected method over several differing test areas.
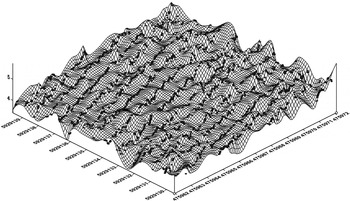
The test data set included 3,760 samples of three elements (x,y,z), as shown in Figure 2. Each point has three attributes: latitude, longitude, and a predetermined depth at a given point. The minimum depth is 3·60 m, the maximum is 5·23 m and the mean depth is 4·42 m.
Test data from an area of 100 m2 (Wlodarczyk-Sielicka and Stateczny, Reference Wlodarczyk-Sielicka, Stateczny and Rohling2015).

The data positions are given by the Universal Transverse Mercator (UTM) coordinate system, an international locational reference system.
3.2. Test Procedure
The main criterion for evaluating each method for reduction of bathymetric maps is the legibility of the maps. Therefore, at this stage of the research several populations were generated with number of clusters k = 9, 25, 49, 100. For the purpose of clustering, the K-means clustering algorithm, traditional hierarchical clustering algorithms and SOM were applied.
In the K-means algorithm, the Euclidean distance was used to measure similarities among clusters. In hierarchical clustering algorithms, four methods of grouping samples were selected: single, average, centroid and complete. In each method the Euclidean distance was used to calculate the distance between every pair of objects in a data set. In a data set made up of n objects, there are n(n − 1)/2 pairs. After selection of a hierarchical method, the number of clusters was specified. In the last method, during the training the network applies the rule Winner Take Most (WTM) according to which weight vector associated with each neuron moves to become the centre of a cluster of input vectors. In addition, neurons that are adjacent to each other in the topology are also moved close to each other in the input space. The authors decided to select the hexagonal network topology, where each of the hexagons represents a neuron. The numbers of rows and columns was set to 3 × 3, 5 × 5, 7 × 7 and 10 × 10, which provided 9, 25, 49 and 100 neurons, respectively. The initial neighbourhood size was set at three and the number of training steps for initial coverage of the input space was set at 100. Distances between neurons are calculated from their positions by means of a link distance function. The link distance from one neuron is the number of links or steps that must be taken to get to the neuron under consideration. The number of epochs was set at 200 based on recent research (Stateczny and Wlodarczyk-Sielicka, Reference Stateczny, Wlodarczyk-Sielicka and Kryszkiewicz2014). The total yield of 24 different sets of clusters was analysed. During the research the authors adopted the precision of two decimal places.
3.3. Results
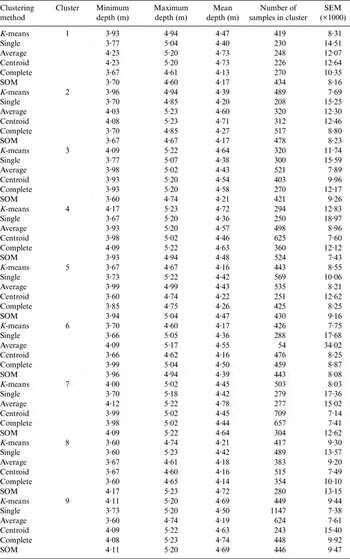
In this study the authors adopted the following evaluation criteria: possibility of automation, time taken for calculations, and regular distribution of data in each cluster. Each of these criteria was considered in relation to the use of clustering for bathymetric map production, which could include ENCs. The results for nine clusters are presented in this article. The results for different numbers of clusters are comparable. The authors focused on depth values, which are of significant importance for the safety of navigation. Table 1 presents the results for nine clusters.
Results for nine clusters.

Table 1 includes minimum, maximum and mean values of depth, number of samples in each cluster and Standard Error of the Mean (SEM) for each cluster. SEM is the standard deviation of the sampling distribution from the mean. SEM is calculated as the sample estimate of the population standard deviation divided by the square root of the sample size. In order to facilitate analysis, SEM was multiplied by 1000. The authors assumed that a small value of SEM is closely related to a regular distribution of bathymetric data in each cluster. It should be mentioned that this parameter is taken into account only for evaluation criteria relating to regular distribution of data points in each group.
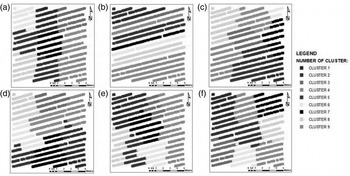
Figure 3 shows a spatial representation of the results for nine clusters obtained by the test algorithms.
Results for nine clusters obtained by algorithms: K-means (a), single (b), average (c), centroid (d), complete (e), SOM (f).

It should be remembered that the application of different test methods results in different nomenclature for clusters. However, this is not important in reduction of bathymetric data. Spatial representation of results facilitates visual assessment.
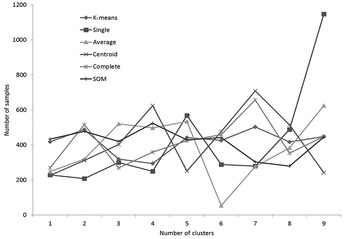
As previously mentioned, the legibility of the bathymetric map will be one criterion for evaluating each reduction method; therefore, in order to facilitate the analysis, comparable numbers of samples in clusters are made for each method. It can be assumed that the average number of points in each cluster (in the case of nine clusters) is approximately 418 samples. This comparison is shown in Figure 4.
Distribution of the number of samples in each cluster.

The horizontal axis represents the number of clusters and the vertical axis shows the number of bathymetric data points. This comparison facilitates regular distribution analysis of data in each cluster.
The next criterion used in this research is the regular distribution of data in each cluster. It can be seen that the best result was obtained with the K-means and SOM methods. When using the single algorithm method, a very patchy distribution was obtained: the minimum number of points in the cluster was 208 and the maximum number of points in the cluster was 1,147. Figure 4 shows that other hierarchical algorithms may be considered acceptable.
With regard to the possibility of automation, the best method is the K-means algorithm. This is due to the fact that implementation and change of individual settings are not difficult. Other test algorithms are more difficult to implement as changing the settings of individual functions is more time-consuming.
As regards the time required for calculations, traditional hierarchical clustering algorithms are the worst. Hierarchical algorithms are the slowest because they involve calculation of the distance between every pair of objects in a data set. With such large volumes of data this takes a very long time.
4. CONCLUSIONS
Knowledge of the depth of an area of water is crucial for its safe navigation. Depth is therefore one of the most important components of an ENC. Generally, hydrographic systems generate a grid with use of means or weighted means. The main aim of the authors was to create a new data reduction algorithm applicable to the production of ENCs. The authors categorise a set of points into a cluster and then represent each group by a single point (the minimum depth) depending on the compilation scale of the ENC. Analysis of the results shows that the worst results are given by the single algorithm method. Average, centroid and complete algorithms may be considered acceptable. The best results for clustering bathymetric data are obtained using the K-means and SOM methods.