

1. Introduction
One notorious consequence of rapid industrialisation in parts of nineteenth-century Europe was severe urban overcrowding, as demand for accommodation outstripped supply. In Germany, for example, heavy in-migration and immigration into the principal industrial centres led to the rise of Mietkasernen or ‘renting barracks’ – densely built four- or five-storey tenements where accommodation was rented room by room off common landings and subletting of even this cramped space was common. This gave rise to new social practices, such as Schlafgänger – where a lodger would rent a bed, or a share of a bed, in a room used by another family. Publicity regarding the conditions in which tenement dwellers lived in turn led to mounting popular concern, regarding both the moral and health consequences of tenement living. For example, links were established between the lack of ventilation and sunlight and medical and sanitary problems (Bullock and Read Reference Bullock and Read1985, pp. 22–3, 56–9; Power Reference Power1993, pp. 102–3).
Victorian Britain was also notorious for urban overcrowding, though by the turn of the twentieth century levels varied considerably, from under 2 per cent of the population in towns as diverse as Burton-on-Trent, Crewe, Derby, Grimsby, Ipswich, Lincoln and Portsmouth (among others), to over 30 per cent in Gateshead, Jarrow, Newcastle, South Shields and Sunderland.Footnote 1 We estimate even higher levels in the principal towns and cities of Scotland. These variations cannot be fully explained in terms of differentials in local rents, wage rates, or other indices of prosperity. Scotland presents a particular problem, as its higher rates of overcrowding occurred despite real income levels which – while below the British average – were higher than for some English regions with much lower overcrowding rates.
The conventional explanation of Anglo-Scottish differentials in overcrowding and rooms per dwelling emphasises market institutions, in particular Scotland's separate tenure and legal systems for rented property, interacting with demand factors such as lower and more variable incomes. We give evidence consistent the impact of these institutions, though our data consist mostly of workers who are not in especially insecure employment. We also offer an additional explanation, emphasising differences in household budgeting priorities between accommodation and other expenditure north and south of the border. These, in turn, were the result of the co-evolution of housing types and associated social mores and practices during the nineteenth century, which produced more communal patterns of living in Scotland – requiring fewer rooms to achieve perceived standards of ‘decency’ and ‘respectability’.
Our conclusions rest upon the empirical analysis of a newly discovered set of data on food and rent expenditures, wages, employment and family structure for just over 1,000 working-class families from a century ago. The original enquiry, involving nearly 2,000 working-class families, was carried out in 1904 by the Labour Department of the Board of Trade. The summary results and analysis of this enquiry were published in British Parliamentary Papers in 1905 (Cd 2337). This was the first large-scale official national survey of household expenditures in the British Isles.
This article uses the recovered Board of Trade data (hereafter BoTR) to investigate overcrowding in British urban areas in 1904. A fuller discussion of this dataset is provided in Gazeley and Newell (Reference Gazeley and Newell2010), which also investigates the incidence of poverty in Britain. Nearly half of the BoTR cases are Scottish households, most of whom were living in large cities (primarily Glasgow, Edinburgh, Aberdeen and Dundee). Contemporary investigators noted the high incidence of overcrowding amongst poor urban households. They also noted a clear correlation between overcrowding and higher morbidity and mortality levels. This was especially true of infant mortality rates. The most overcrowded households in the BoTR data are those from Scotland. It is very well known that Scottish cities were exceptionally overcrowded; see, for instance, Butt (Reference Butt and Cage1987), Gibb (Reference Gibb1983) and Rodger (Reference Rodger and Gordon1985, Reference Rodger and Pooley1992). Interestingly, as Gazeley and Newell (Reference Gazeley and Newell2010) show, the great majority of the Scottish families in the BoTR sample were not living below a contemporaneously defined poverty line, as they were overwhelmingly artisan-headed households.
This article is organised as follows. Section 2 briefly reviews the salient features of the BoTR data and reports our findings on the incidence of contemporaneously defined poverty. Section 3 examines the results of a number of contemporary attempts to ascertain the extent of overcrowding in British cities and we use the most sophisticated of these methods (due to Bowley and Burnett-Hurst Reference Bowley and Burnett-Hurst1915) to examine the extent of overcrowding in the BoTR data. We find a very marked difference in the incidence of overcrowding between Scotland and the rest of Britain and Ireland. Section 4 discusses the institutions of the Scottish housing rental market and provides the empirical evidence on the various hypotheses. We find little evidence in support of supply-led explanations for Scottish overcrowding. On the demand side, we do not find evidence for higher levels of income insecurity among the Scottish workers in our data. We present econometric evidence consistent with the idea that institutional differences relating to the legal framework governing the market for rental accommodation led to Scottish households choosing relatively overcrowded living conditions. We also show that these Scottish artisan households spent their rent reduction on food. In Section 5 we provide a review of the existing literature on housing conditions and overcrowding in Scotland. We argue that social custom, based on economic conditions prevalent a generation before the 1904 survey was undertaken, still exerted a powerful influence on consumption behaviour.
2. The 1904 Board of Trade data
The Board of Trade conducted an expenditure survey of working-class households for one week during July–September 1904, encompassing all parts of the British Isles, including southern Ireland. In total 2,283 returns were collected via workmen's organisations, co-operative societies and individuals, who in some cases were asked to obtain information from ‘fellow-workmen’.Footnote 2 This creates sampling biases; for instance, Newell and Gazeley (Reference Gazeley and Newell2010) find that households headed by skilled manual workers are over-represented. Despite these limitations, this survey provides the most thorough record available of economic life amongst working households in Britain at the turn of the twentieth century.
The enquiry made use of a fixed-format questionnaire. The forms provide information on: locality (often given very precisely); number and age of children; occupation and average weekly earnings of the father; average additional weekly family income; weekly house rent and number of rooms occupied. Fully half of the questionnaire is concerned with expenditures and quantities of food consumed by the household, but no details of non-food expenditures were requested (other than rent).Footnote 3
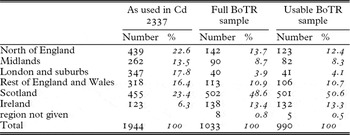
The full BoTR sample is 1,033, but as Gazeley and Newell (Reference Gazeley and Newell2010) show, this is not a random subsample of the 1,944 expenditure records used in Cd 2337. Other information on the provenance of the returns is provided by the annotations to the originals made by Board of Trade officials shortly after they were collected. Most of the records in the BoTR sample indicated whether the form was received in time for analysis, or whether it was too late. Officials sometimes also investigated and expanded on the information given by the household head with regard to income and rent. Finally, a proportion of the BoTR returns were rejected by the Board of Trade for being incomplete. Table 1 illustrates the strong presence of returns from Scotland and Ireland in the BoTR sample relative to the original survey. The fifth and sixth columns of Table 1 give the regional distribution of what we call the ‘usable BoTR sample’. These are selected on the basis of having reliable income and total food expenditure data.
Regional distributions of households

Source: Gazeley and Newell (Reference Gazeley and Newell2010, table 1).
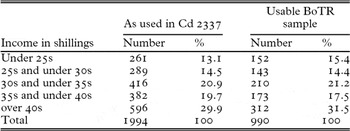
The weekly household income distributions of the Cd 2337 and usable BoTR samples are given in Table 2. The BoTR sample has a few more households at both extremes of the distribution, but otherwise the match between the samples is close.
Distributions of households by income

Source: Gazeley and Newell (Reference Gazeley and Newell2010, table 3).
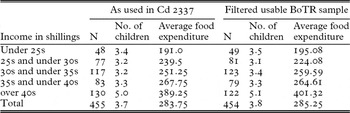
The recovered budgets comprise all, or very nearly all, of those originally compiled in Scottish cities, although the Scottish BoTR sample is not identical to that used in Cd 2337, as Table 3 reveals. From the 501 usable BoTR budgets for Scotland, we filtered out those that were marked as rejected or received late. Some 454 budgets remained, compared with 455 in Cd 2337. Despite the closeness in the total number of budgets, small differences remain between Cd 2337 and filtered BoTR samples for Scotland. There are minor differences in the numbers of households in the various income cohorts, as well as in average numbers of children and average total food expenditure by income class. Additionally, these differences may be due to transcriptional and arithmetical errors made in 1904.
Number of children and food expenditure by income class in Scotland

Source: Gazeley and Newell (Reference Gazeley and Newell2010, table 2).
In summary, there are differences between the BoTR data and the sample used to inform Cd 2337. In the BoTR data we only have about one-third as many households in England and Wales as in the original survey, and London is barely represented at all. Household size is larger in the BoTR than in Cd 2337, though this might be due to differences in the definition of children. We have defined children as those less than 16 years old. The Board of Trade might have used some other age threshold or defined children by their relationship to the head of household. When we compare results for Scotland, there are only minor differences between the results published in Cd 2337 and the BoTR sample.
3. Crowding and overcrowding in BoTR
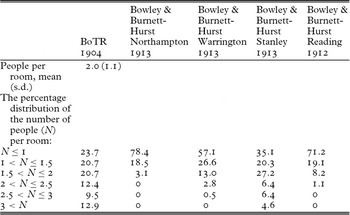
The BoTR survey asks two questions about accommodation. First it asks how many rooms are rented (almost no one in the survey is an owner-occupier) and secondly it asks what weekly rent is paid. Table 4 compares measures of crowding (people per room) in the BoTR sample with those given by Bowley and Burnett-Hurst in their study of northern English industrial towns (1915). The BoTR sample contains a much larger share of households with two of more people per room than any of Bowley and Burnett-Hurst's town surveys. In their study Bowley and Burnett-Hurst used two ‘overcrowding’ or ‘space poverty’ lines. First, they defined all households with two or more persons per room as overcrowded and they tabulated the percentage overcrowded alongside their poverty percentage by town. Secondly, Bowley and Burnett-Hurst constructed a more subtle overcrowding measure which weighted boys aged 14–18 and girls aged 14–16 at 0.75 of an adult, children aged 5–14 at 0.5 of an adult and infants at 0.25 of an adult. Their second definition defined an overcrowded household as having more than one equivalent adult per room. For reference, Bowley and Burnett-Hurst found 60 such cases among 693 households in Northampton in 1913 (8.7 per cent).
The distribution of crowding among households (per cent)

Source: Authors’ calculations from the BoTR data and derived from Bowley and Burnett-Hurst (Reference Bowley and Burnett-Hurst1915, table II, pp. 59, 102, 143 and 162).
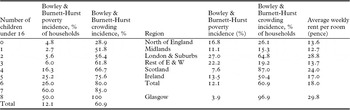
In Table 5 we compare the incidences among households of Bowley and Burnett-Hurst poverty, defined in the note to the table, and the Bowley and Burnett-Hurst equivalent-adult overcrowding index. The left-hand side of the table shows that income poverty and overcrowding both increase, quite predictably, with household size. Overcrowding is much more prevalent in these data than poverty, though. The right-hand side of the table gives regional data and illustrates why the BoTR data have much more overcrowding than Bowley and Burnett-Hurst recorded. The key is the large proportion of Scottish industrial workers in the 1904 BoTR sample. These Scottish workers’ households have the lowest income poverty, but much the highest overcrowding proportion.
Poverty and equivalent-adult overcrowding by household size and by region

Source and notes: Authors’ calculations from the BoTR data. Bowley and Burnett-Hurst's was a minimum needs definition of poverty, with a line drawn at 133 pence (d) for a couple, 57d for an additional adult, and smaller amounts, declining with age for children. See Gazeley and Newell (Reference Gazeley and Newell2010) for a fuller discussion. Rent per room includes estimated weekly rates for Scotland and is inclusive of rates for the rest of Britain and Ireland.
Urban Scottish workers lived in much more cramped conditions than workers in the rest of Britain at similar income levels; see, for instance, Gibb (Reference Gibb1983). Differentials were particularly wide in terms of the official overcrowding standard used in England and Wales (more than two persons per room) – a standard which, among other things, reflected contemporary standards of ‘decency’ regarding parents and children and/or children of both sexes having to sleep in the same room. Scotland's unusually cramped accommodation was not a simple reflection of differences in real incomes. The Board of Trade enquiry into working-class rents, housing and retail prices estimated that in 1905 skilled male real wages in Scotland were only 87 per cent of those in London. Yet Scotland was not at the bottom of the regional league table; the figures for the eastern and the southern counties of England each being estimated at 86 per cent of the London level.Footnote 4
Glasgow was especially overcrowded. To illustrate this, we have added, at the bottom of Table 5, poverty and overcrowding for the 132 households from within the Glasgow city boundaries in the 1904 BoTR survey. Almost none of these households are in poverty, yet almost all are overcrowded. Note that Scottish estimated rents per room are high. The main reason for this is that rents per room fall with the size of accommodation and are thus high for these small Scottish dwellings; see Table 7 for confirmation of this.
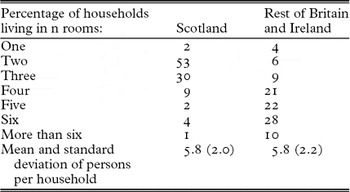
Table 6 shows that it is in the size of accommodation, rather than in household structures, that these Scottish households were unusual. In the last line of the table we see that the distribution of household size among Scottish households in the sample is almost identical to that of households from the rest of the British Isles. The major difference is in the size of accommodation. In the Scottish sample, 85 per cent of households lived in three or fewer rooms, compared to only 19 per cent in the rest of the BoTR sample. In the next section we discuss the distinctive features of Scottish urban working-class housing.
Summary of the distribution of accommodation and household size in BoTR

Source: Authors’ calculations from the BoTR data.
4. Working-class housing in Scottish cities
In the mid nineteenth century, the second round of highland clearances and the Scottish and Irish potato famines caused large-scale migration into Scotland's urban centres. The incomers would have been largely unskilled rural workers. Urban centres in England, London and Liverpool for instance, also experienced influxes, but Glasgow's population growth was probably the most rapid, making it the fourth largest city in Europe by the early 1900s: ‘by 1914 no fewer than 700,000 people resided within three square miles of Glasgow Cross and created the most densely populated, central-urban area in Europe’ (Pacione Reference Pacione1979, p. 397).
Nineteenth-century social investigators and health officials were concerned that overcrowded conditions caused increased morbidity and mortality:
Glasgow stands alone with the highest death-rate, the highest number of persons per room, the highest proportion of her population occupying one-apartment houses, and the lowest occupying houses of five apartments and upwards. . . These facts prove beyond doubt that the predominant factor in the health of cities is the proportion of house-space to inhabitant. (Russell Reference Russell1887, quoted in Gibb Reference Gibb1983, p. 136)
Cage (Reference Cage1994) finds a strong positive correlation across the districts of Glasgow in 1911 between the average number of people per room and infant mortality.
In 1911 only 26.5 per cent of Scottish houses had four rooms or more (compared to 73.8 per cent south of the border), while the apartment of two or fewer rooms still represented the majority of the national housing stock (Lee Reference Lee, Devine, Lee and Peden2005, p. 145; Rodger Reference Rodger and Rodger1989, p. 29). Conversely, Scottish tenements offered greater average space per room than their English counterparts, being around 50 per cent greater in terms of cubic capacity and 20–25 per cent larger in floor space (Rodger Reference Rodger and Rodger1989, p. 50).Footnote 5 They were also specifically designed for multifunctional use, as illustrated by the ‘bed-recesses’ or ‘bed-closets’ which were often included in kitchens so that they could be transformed into bedrooms at night; some kitchens having as many of two or three recesses.Footnote 6 In this respect, Scotland was more typical of the European pattern of working-class urban housing, characterised by tenement apartments with a few, large, non-specialised rooms.
In the Appendix we describe how we create estimates of floor space, from typical building types, for the BoTR sample. Of course, these are subject to error, but the aggregate regional differences are too large to be attributed to errors of estimation. We estimate that the average floor space per person in Scottish cities in BoTR was just less than 100 square feet. By contrast, we estimate average floor space at 133, 146 and 155 square feet, in northern England, the Midlands and the rest of England and Wales respectively. Thus despite the larger size of rooms, it seems that Scottish families had much less space to live in.
The response of housing supply to the rapid increase in population was mostly undertaken by the private sector. Butt (Reference Butt and Cage1987) paints a picture of Glaswegian retailers and other small businessmen commissioning the building of tenements, or buying them from builder-speculators, often to house their own workers. The builders typically retained the right to a fee, the feu, in perpetuity. Some argue this lead to dense tenement development, though the economics of the argument are not unambiguous (Rodger Reference Rodger and Pooley1992, p. 115). However, tenements themselves, that is, spatially dense housing, cannot be the cause of overcrowding, which reflects the use of building rather than the density of dwellings per hectare. It was the division of these tenement blocks which led to overcrowding. Some early tenements, for instance the closes of the High Street and Lawnmarket districts of Edinburgh, consisted largely of one-room apartments occupied by the poorest workers in subdivided and made-down buildings that ‘were once the residence of the most influential families in Scotland’ (Cd 3864, p. 509, para 3).
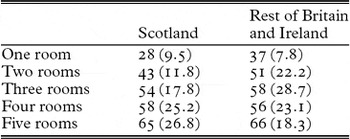
What caused this division? The immigration of predominantly low-skilled workers was likely to have lead to an increase in demand for very low-cost housing. If these demand pressures were combined with any kind of adjustment cost on the supply side, one might expect landlords to see division as a way of maximising profits from a development.Footnote 7 If these supply-side factors persisted, they could combine to cause overcrowding and high rents. However, it seems unlikely that excess demand would persist for the whole of the second half of the nineteenth century. One way to investigate whether supply constraints were causing overcrowding is to examine if there was excess demand for larger dwellings in Scotland in the BoTR data. Given the similarity of household structures in ScotlandFootnote 8 and the rest of Britain and the prevalence of small dwellings in Scotland, ceteris paribus there should be regional differences in the relative rents earned by dwellings of different sizes. In particular, if there was a relatively large supply of small dwellings in Scotland, one might expect this to be reflected in higher premia for rare, larger dwellings. Tables 7 and 8 give the evidence from the BoTR data on rent differences between Scotland and the rest of Britain and Ireland. In Table 7 we can see that rents for smaller dwellings were lower in Scotland on average, but these differences are not statistically significant.
Rent by region and number of rooms (each cell contains an average rent in pence with the standard deviation in brackets)

Source: BoTR as calculated by the authors.
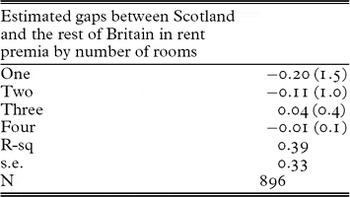
Hedonic rent equations for the BoTR (dependent variable: log rent, adjusted)

Notes: Authors’ calculations from the BoTR data, method of estimation, OLS; see text for a discussion of the adjustment made to rents, absolute robust t-ratios in brackets. The equation also included size of dwelling and regional indicator variables.
In Table 8 we test the hypothesis that the relationship between number of rooms and rent is different in Scotland using a hedonic rent regression. Rent premia may differ for many reasons, but the two key reasons are, first, the hypothesis of excess demand for larger dwellings in Scotland, which should be reflected in a steeper profile of rents in Scotland, and the larger size of rooms is Scotland, which should lower demand for rooms across the size spectrum. The dependent variable is the log of weekly rent for the dwelling, which is regressed on dummy variables indicating the number of rooms in the dwelling and also regional dummies; this allows the rent premia in Scotland to differ from the rest of the sample. These last coefficients are reported in the table. We find that rents of one- and two-room dwellings are lower in Scotland, but not significantly so. Similarly, rents for three- and four-room dwellings are not significantly higher in Scotland. Thus the profile of rents with respect to size of dwellings in Scotland is at best marginally different from that prevailing in the rest of the sample. This gives little support to the idea that the pattern of accommodation supplied in Scotland was strongly out-of-line with the pattern of demand. In other words, we find little statistical support for the theory that supply constraints played a major role in Scottish urban overcrowding.
Rodger (Reference Rodger and Gordon1985) sets out the two principal components of the standard demand-side explanation of Scottish overcrowding. First, there were important differences in rental law between Scotland and the rest of Britain and Ireland. The Scottish rental system required the vast majority of tenants to sign up for a year, committing four months before the beginning of the term with release only allowable with penalty payments. Secondly, there was a high concentration in urban Scotland of low-skill casual work, so that workers were faced with dealing with highly variable income streams. Workers with uncertain income flows, faced with long-term tenures, may have chosen to reduce the risk of eviction for non-payment by taking smaller and cheaper accommodation. In what follows, we explore these two arguments.
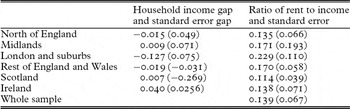
In the BoTR data most of the Scottish households are headed by skilled artisans. This makes it impossible for us to judge whether Scottish unskilled workers were particularly vulnerable to income variation. Nevertheless, these Scottish artisans lived in far more overcrowded conditions than would be expected given their income levels. In Table 9 we establish that Scottish households in the BoTR sample have almost identical average income, but with much lower variance, than those from the rest of Britain and Ireland. Workers with highly variable income over time would also be expected to demonstrate high cross-section income variance. This table also shows that the Scottish households spend a smaller share of their income on rent.
Regional variation in average household earnings and the ratio of rent to income

Source: Authors’ calculations from BoTR data.
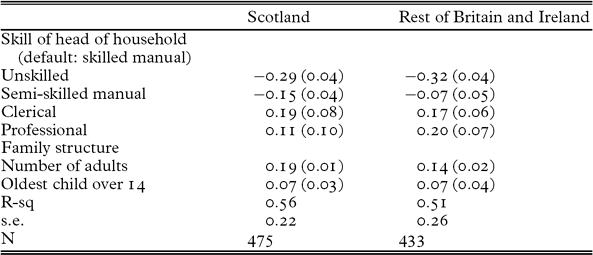
Is the lack of low and variable incomes in Scotland a product of the nature of our sample? In other words, are these Scottish artisan household incomes more variable, once we control for skill and household characteristics? Table 10 reports regressions of log household income on skill and household characteristics. The statistic of interest is the standard error of the regression equation, which is a little smaller for the Scottish data than it is for the rest of the sample. Thus, there is lower income variability in the Scottish households in the BoTR data than in the rest of the data, whether we take the raw data or we control for skill and household structure. We cannot find evidence consistent with the idea that the severe overcrowding in Scotland is due to especially high income variability.
Family income regressions (dependent variable: log household income)
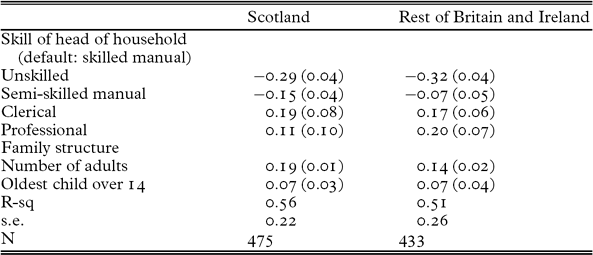
Notes: Method of estimation: OLS, robust standard errors in brackets, industry dummies included but not reported.
Many have argued that overcrowding was exacerbated by Scotland's relatively high rates of unemployment and underemployment, including severe problems of seasonal and cyclical unemployment (Lee Reference Lee, Floud and Johnson2004). In 1911, 27 per cent of workers in Glasgow, 24 per cent in Edinburgh and Aberdeen, and 20 per cent in Dundee were prone to frequently interrupted incomes on account of irregular work (Rodger Reference Rodger, Morris and Rodger1993, p. 102). As already mentioned, Rodger argues that this led workers to base accommodation choices on what could be supported by expected minimum incomes throughout the year, rather than earnings while in full employment. Such patterns were reinforced by the prevalence of the ‘long-let’ in Scotland – a yearly rental from Whitsunday, which had to be contracted up to four months before the lease commenced. This system, which covered around 80 per cent of all working-class houses, involved rents being paid monthly, quarterly, or half-yearly, thus further increasing the tenant's difficulties by requiring major payments at infrequent intervals, while breaking leases incurred substantial financial penalties (see below) (Rodger Reference Rodger and Rodger1989, pp. 39–40).
Scotland's framework of laws and customs governing the rental market for housing differed from the rest of Britain. While weekly or monthly rentals were fairly commonplace in the rest of the British Isles, that was not so in urban Scotland, except for properties whose annual rental value was below £5. Properties valued above £10 a year, about 80 per cent of the working-class housing stock, were all let by the year in Scotland. Properties rented at between £5 and £10 per annum were let monthly, quarterly, half-yearly or yearly. A unique feature of the Scottish market was the severe limitation, to only two days in the year, when rentals were allowed to start or finish, with the majority being yearly rentals commencing on 28 May.Footnote 9 This was not the case in England, where rental terms could start all year round.Footnote 10 As the Report of Committee on Letting of Working Men's Dwellings in Scotland makes clear, the rules governing letting in Scotland were an impediment to mobility:
occasions arise, from time to time, in a working man's life, warranting, or even requiring him, or, on this death, his family, to remove from one house to another between terms. The usual cause is change of employment, involving removal from one district of the same town to another or from one town to another.Footnote 11
Secondly, in Scotland, local taxes called rates were levied directly on the occupiers, and therefore not included in rent.Footnote 12 These taxes were legally due on 11 November each year.Footnote 13 In Scotland the occupiers’ rates were equal to about 5s in the pound of rental.Footnote 14 The imposition of yearly lump-sum payment of rates was seen as an exceptional financial burden on working-class households that was unique to Scotland (and dependent upon the annual rental of the property):
payment of rates is demanded from occupiers in November, at the period of the year when work in many occupations is slackest, when expenses in the way of extra clothing and fire and light are heaviest, and such payment is demanded in one sum . . . No doubt the best class of working men look forward through the year to the incidence of the rates in the end of the year, and provide for their payment by admirable plans are not systematically followed by the average working man, who, although respectable, lives to a large extent from hand to mouth, and they are, of course, unknown among the class whose habits are bad.Footnote 15
Thirdly, landlords were indemnified against non-payment of rent by an urban hypothec, which gave the landlord the legal right to sell the possessions of defaulters.
Thus in terms of rent and property-based taxes, Scottish workers were required to practise much greater medium-term financial discipline than their counterparts in the rest of Britain. If Scottish workers were risk averse, these institutional differences alone would generate incentives to economise more intensely on space. But even without invoking attitudes to risk, it is very likely, as noted above by the Report of Committee on Letting of Working Men's Dwellings in Scotland, that saving was quite difficult in the face of short-run exigencies.
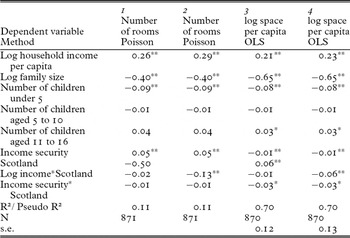
Table 11 reports tests to see whether differences in parameters help explain Scottish overcrowding. The preferred regressions are reported in the second and fourth columns. We find that demand for space, whether measured in estimated square feet, or by numbers of rooms, rises with income per capita and with family size, though less than proportionally, that is, inelastically, in both. Over and above this, household structure matters, with lower space requirements for younger children. Our measure of job security has the hypothesised positive effect (households with relatively secure occupations rented more space).Footnote 16 We interact both log income and the job security variable with the indicator variable for Scotland. Our hypothesis here is that the financially tough Scottish rental agreements made eviction-averse Scottish families likely to increase their housing less as income rises or as more secure work is found. We find both to be the case. As expected, the effect of income is smaller on housing demand for Scotland, and significantly so. The job security variable also takes the predicted sign, but only significantly in column 4. Columns 1 and 3 regressions inject a cautionary note. There we can see the key interaction terms are only significant if the Scotland indicator is omitted from the regression, otherwise collinearity makes all three coefficients insignificant. Among other results unreported in the table for brevity we find that mining households live, ceteris paribus, in smaller accommodation.Footnote 17
Modelling the demand for housing

Notes: *and **denote conventional significance at the 5% and 1% levels respectively, using robust standard errors. All regressions also contained controls for Ireland, and regions of England and Wales.
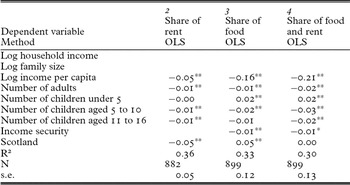
Columns 1, 2 and 3 of Table 12 report Working-Leser semi-log form Engels curves for rent, food and combined food and rent. Note that a 95 per cent confidence interval for the mean combined share of food and rent is contained between 0.75 and 0.78, so the vast bulk of spending is on these two items. We find that controlling for income and household characteristics, Scottish households tended to spend about 5 per cent less of their income on rent. They also tended to spend about 5 per cent more on food, so that, in column 5, we find no significant difference between Scottish households and the rest of the sample when the dependent variable is the combined share of food and rent. If these Scottish households were spending, on average, the rent reductions from taking smaller dwellings on food, then they were not saving them. This suggests that these predominantly artisan families were not rich enough to make medium-term financial plans.
Modelling demand for housing and food in BoTR

Notes: *and **denote conventional significance at the 5% and 1% levels respectively, using robust standard errors. All regressions also contained controls for Ireland, and regions of England and Wales.
5. Evidence from other sources
Contemporary budgetary information for 1904 indicates that a preference for lower expenditure on accommodation and smaller apartments (relative to English households with equivalent earnings) was evident even among relatively high-income households in stable employment. Further evidence of a lower household priority for accommodation expenditure is provided by a national household budget survey of 611 married railway clerks in 1911 – a group with particularly high occupational stability, but average incomes well within the range covered by the 1904 budget survey.Footnote 18
Expenditure on housing (which includes rents and rates, plus travelling costs to and from work, fuel and lighting, household equipment and furniture, and cleaning materials) represents 31.40 per cent of household budgets for clerks in England and Wales, but only 25.86 per cent for Scottish clerks; corroborating the general findings from the Board of Trade sample that households south of the border devoted roughly 5 per cent more of total expenditure to housing than was the case in Scotland.Footnote 19
The Ministry of Labour's 1937/38 working-class household expenditure survey provides the earliest detailed breakdown of non-food household spending by region. Non-agricultural Scottish working-class households were found to have slightly higher mean weekly household expenditures than the UK average (89s 7.25d, compared to 85s 0d), reflecting their larger household sizes (averaging 4.02 persons, compared to 3.77). Low accommodation costs (averaging 9.1 per cent of total expenditure compared to a UK average of 12.7 per cent) were matched by high clothing expenditures, 11.8 per cent compared to the UK average of 9.5 per cent. This concurs with the 1911 railway clerks’ survey, which found that Scottish clerks spent 12.5 per cent of their budgets on clothing, compared to 9.7 per cent for their English counterparts.Footnote 20 Food, clothing, heat and shelter are weak substitutes for each other and Scottish families appear to have traded shelter for clothing. This pattern had strong similarities with that of Northern Ireland, but less so with the northern region, where households spent an average of 11.7 per cent on accommodation and 10.4 per cent on clothing. Comparing fuel and power consumption is more complicated, as by 1937 Scottish households concentrated their spending on a cheap but inflexible fuel source, coal (spending 3s 3.25d per week compared to 3s 2d nationally), rather than gas and electricity (spending only 2s 10.75d on other fuel and light, compared to a UK average of 3s 3d).Footnote 21
Melling has argued that urban Scottish households were averse to devoting a higher proportion of household budgets to accommodation owing to a cultural preference towards prioritising other areas of consumption (Reference Melling and Rodger1989, p. 60). The explanation for this difference in budgetary priorities probably lies in the earlier co-evolution of housing types and associated social norms during the nineteenth century. The rapid population growth of major Scottish cities in the early and middle decades of the nineteenth century overwhelmed the capacity of the existing housing stock and led to a pattern of both more intensive development of new properties and of existing buildings (through subdivision). The wage gap between Scotland and Britain, which was markedly higher in the mid nineteenth century than the Edwardian period, also contributed to the preponderance of one- or two-bedroom apartments (Lee Reference Lee, Floud and Johnson2004, p. 435). In 1871, over three-quarters of Scotland's population lived in houses of three or fewer rooms, and some 82.6 per cent were in houses of four or fewer rooms (Rodger Reference Rodger and Rodger1989, p. 48). Thus the vast majority of adults at the time of the 1904 budget survey would have grown up in small tenements and would have taken the social norms and mores of tenement life for granted.
These involved the sharing of a wide variety of utilities, including toilets, water supplies, cooking, washing and laundry facilities, while the high costs of supplying gas to high-rise dwellings delayed the development of gas lighting and hot water. This added to the daily workload of the housewife, which was further compounded both by the necessity for most housewives to make frequent trips up and down the staircases of the multistorey tenement and by the need to change the layout of rooms on a daily basis so that one or two rooms could function for all the family's day- and night-time needs. Women adapted to this higher workload with strategies such as sharing child care in the inner courts and alleys (Rodger Reference Rodger and Rodger1989, p. 29). The smooth-running of such arrangements involved distinctive social routines, to ensure that the rights and obligations of each family were understood and observed (Rodger Reference Rodger, Glendenning and Watters1999, pp. 201–2). For example, use of the communal wash house, in the back court or basement, was organised on a rota basis and adhering strictly to the rota was key to peaceful coexistence (Wordsall Reference Wordsall1979, p. 34). Living arrangements within each tenement also necessitated distinct routines and norms. Flats of one or two rooms made it difficult to have segregated sleeping arrangements for parents and children and for male and female children. Indeed, Frank Worsdall argues that even many families occupying two-room ‘room and kitchen’ tenements effectively lived and slept in the kitchen, with the ‘room’ being reserved for special occasions, in a similar manner to the parlour of the English terraced property (1979, p. 46). Living in one or two rooms thus necessitated distinctive patterns of housework, child rearing, play, sleeping and sex, which made social expectations regarding privacy and sleeping arrangements very different from those south of the border (Rodger Reference Rodger and Doughty1986, p. 199).
This differentiated the ‘habitus’ of Scottish households from that of their southern counterparts, in terms of expected and acceptable patterns of social practices, ‘respectability’ and related consumption patterns. In particular, having sufficient bedrooms for the parents and for children of each gender to sleep in separate rooms did not assume the same importance for ensuring ‘decency’ and ‘respectability’ as was the case in England.
Corroboration of the hypothesis that a tradition of housing forms with few rooms and communal facilities led to continued acceptance of such arrangements among ‘respectable’ families in the Edwardian period can be gained by examining those British towns with the smallest proportions of houses with five or more rooms (the size threshold required to provide separate sleeping arrangements for parents and children of each sex using conventional bedrooms). Five English towns included in the 1908 Board of Trade survey had less than 30 per cent of their populations in such accommodation: the Tyneside towns of Gateshead, South Shields, Jarrow and Newcastle, and the Wearside town of Sunderland.Footnote 22 These bore some similarities to the principal Scottish cities – having experienced rapid expansion during the Victorian era, largely based around a coal/iron and steel/shipping industrial complex. Furthermore, all were characterised by a distinctive housing type – the Tyneside flat –which constituted around 60 per cent of the 1911 housing stock of south Tyneside (Ryder Reference Ryder and Daunton1984, p. 43). These were two-storey terraced properties with pairs of front doors; one leading to a flat on the ground floor and the other to a flat on the first floor.
Tyneside flats traditionally consisted of two rooms each, though larger flats of three or four rooms were developed from the 1880s. Shared backyards often contained toilets and wash houses for use by both families. As in Scotland, the smaller numbers of rooms was partially compensated for by an increase in cubic capacity per room, with floors typically of around 12 or 14 feet square (roughly similar to those for Scottish tenement rooms) and ceiling heights of 8.5–9 feet (Ryder Reference Ryder and Daunton1984, p. 43). Such housing differentiated these towns not only from their southern counterparts but from the five other towns in the northern region included in the survey, which had an average of 81.5 per cent of their populations in houses of four or more rooms, compared to only 43.0 per cent for the Tyneside/Wearside towns.
Earlier we referred to the evidence that shows a correlation between overcrowding and indicators of mortality, especially with the infant mortality rate. If the tenure system in Scotland was in part responsible for increased overcrowding, which is consistent with the empirical evidence we have presented here, then it is likely to be responsible, ceteris paribus, for higher rates of infant deaths. The most compelling evidence for this case relates to the coincidence of overcrowding in one-room apartments and higher infant mortality rates. There may be a number of factors contributing to this, but the lack of physical separation between eating, sleeping and toileting would have challenged even the most hygiene-conscious households. We have also shown that these overcrowded Scottish households spent their rent windfall on extra food, which may have led to improved nutrition and a greater resistance to disease among these early twentieth-century city dwellers. However, it is clear from the disaggregated data in contemporary reports on overcrowding, housing density and infant mortality by region in Glasgow that the negative health effects of overcrowding more than offset any possible positive nutritional impact of greater food expenditures.
6. Conclusion
The BoTR data confirm the familiar picture of Edwardian Scottish working families being crammed into relatively tiny dwellings. While this is very well known, our newly rediscovered household-level data enable us to re-examine explanations which have not, to our knowledge, been empirically tested. We investigate whether there was a constrained supply of large dwellings, caused by the building of tenement blocks in Scotland, and find little supporting empirical evidence in the structure of rents. Our results show that the profile of rents in Scotland is not strongly consistent with the idea of unsatisfied demand for larger dwellings.
There are two main demand-side arguments: on the one hand, the variable nature of incomes and on the other hand, the impact of laws with respect to rental contract durations and payment frequencies for rents and rates. In the BoTR data, the Scottish workers happen not to be casualised unskilled workers in the main, but better-off artisans, though they still live in overcrowded conditions. Since these workers do not have higher measurable income insecurity than others in BoTR data and they live in much smaller dwellings, the income insecurity argument is weakened as an explanation of generalised overcrowding. However, we do show that the effect of occupational security on demand for space is weaker among Scottish workers in the BoTR survey, which is consistent with the idea that the threat of eviction loomed large in Scotland, as is the lower estimated income elasticity of demand for space among Scottish BoTR workers. Our evidence is thus consistent with the idea that longer rental contracts and annual rates payments were the major influences, and we discuss how similar conclusions were reached by contemporary investigations into the housing conditions of Scottish workers.
Our final results show that Scottish workers spent their rent savings on food. These artisan households are not below contemporary poverty levels of income, yet they are still sufficiently poor to make their day-to-day lives a continued struggle for existence. If the difficulty of saving for exigencies through long-period rental contracts is the underlying explanation of Scottish overcrowding, then extra spending on a basic necessity like food is the predictable outcome.
As Paul Johnson has noted, household budgeting decisions were not taken in isolation, ‘but as part of a larger community or work group with its own customs, conventions, and codes of conduct, and an important aspect of many financial decisions was the potential social integration or alienation that might result’ (Reference Johnson1985, p. 6). Such considerations were particularly important for housing, which constituted a highly visible social statement – a major financial decision constantly exposed to public gaze (Bourdieu Reference Bourdieu2005, p. 18). The communal housing culture of Scottish (and, to a lesser extent, Tyneside and Pennine) towns made social practices which were inevitable in houses of fewer than five rooms acceptable to both manual and lower-paid non-manual workers, in contrast to other urban areas of Britain where the three-bedroom house set the minimum standard of ‘decency’ for the households of, at least, skilled and white-collar workers.
Acknowledgements
The data which are discussed in this article were found by the Archivist of the Library of the University of Bangor, Mr E. W. Thomas, in response to our questions about another of his holdings. We thank him and his team for all their help with this project. We also thank Gemma Mills and Theresa Jennings for invaluable research assistance and the Nuffield Foundation for their Social Science Small Grant SGS/1220, which funded the translation of the data into spreadsheet form.
Appendix: Estimating floor space in working-class dwellings in Britain
How much bigger were Scottish tenement rooms than those in English workmen's cottages? Cd 3864 contains a number of descriptions of one-, two- and three-room tenements in the discussions of ‘Housing and Rents’ for Scottish each city. What emerges from these discussions is that in general a single-room tenement was between 200 and 280 square feet, including bed-recesses, with more estimates at the lower end of the range. A two-room ‘kitchen and room’ is estimated to be between 320 and 360 square feet. If there is a third room, it tends to be smaller than the other rooms, so a three-room tenement might between 420 and 460 square feet. Additional rooms beyond that were usually also smaller, adding perhaps 100 square feet per room.
Because of the greater diversity of housing in England and Wales, the report usually does not give dimensions of typical dwellings for these countries. Studying estate agents websites for the dimensions of terraced cottages in England and Wales, we find a modal pattern of a basic structure with two rooms on the ground floor with one slightly larger than the other, summing to something of the order of 280 square feet, and a similar, though necessarily more restricted, pattern on the first floor adding perhaps 200 square feet. Again, additional rooms tend to be smaller, especially in back extensions added to provide kitchens, sculleries and bathrooms, though the large rooms become tend to be bigger in houses with more rooms. On the basis of these observations, we use the following estimates to convert rooms into floor space.
Estimates of usable floor area in dwelling

Applying these estimates to the households in the BoTR data we find: