1. INTRODUCTION
Southern European birth rates fell so rapidly in the 1970s and 1980s that in one generation the region went from Europe's highest fertility to its lowest. Unless total fertility increases substantially, the native-born population is destined to further age and shrink. This phenomenon has been noted by many scholars [Munoz-Perez (Reference Munoz-Perez1989) studies fertility in Italy, Greece, Portugal, and Spain in detail.] An aging and shrinking population has major economic implications, generating demand for young immigrant workers, and threatening the solvency of “pay as you go” social insurance funds. Italy and Spain are thus projected to have one retiree for each working age person by 2050. Increased morbidity due to an aging population will also strain the funding of publicly provided health care.
Understanding fertility trends in Southern Europe is important for projecting global population, especially if the trends reflect general consequences of economic development and social change. The consequences of policies concerning immigration, education, health, and retirement all depend upon population trends. Yet, demographers remain puzzled by the causes of European fertility decline, particularly since the decline has occurred without a rapid increase in female labor force participation [Bettio and Villa (Reference Bettio and Villa1998), Ahn and Mira (Reference Ahn and Mira2002), and Guetto et al. (Reference Guetto, Luijkx and Scherer2015)]. Southern Europe currently has historically low rates of both fertility and female participation. In Spain, Italy, and Portugal, total fertility remain below 1.4, despite female employment rates below European averages.Footnote 1 This pattern contradicts standard economic models [Becker and Lewis (Reference Becker and Lewis1973) and Becker (Reference Becker1991)], is unprecedented in the history of fertility transition, and cannot be explained by factors such as housing prices or women's education [Del Boca (Reference Del Boca2002)].
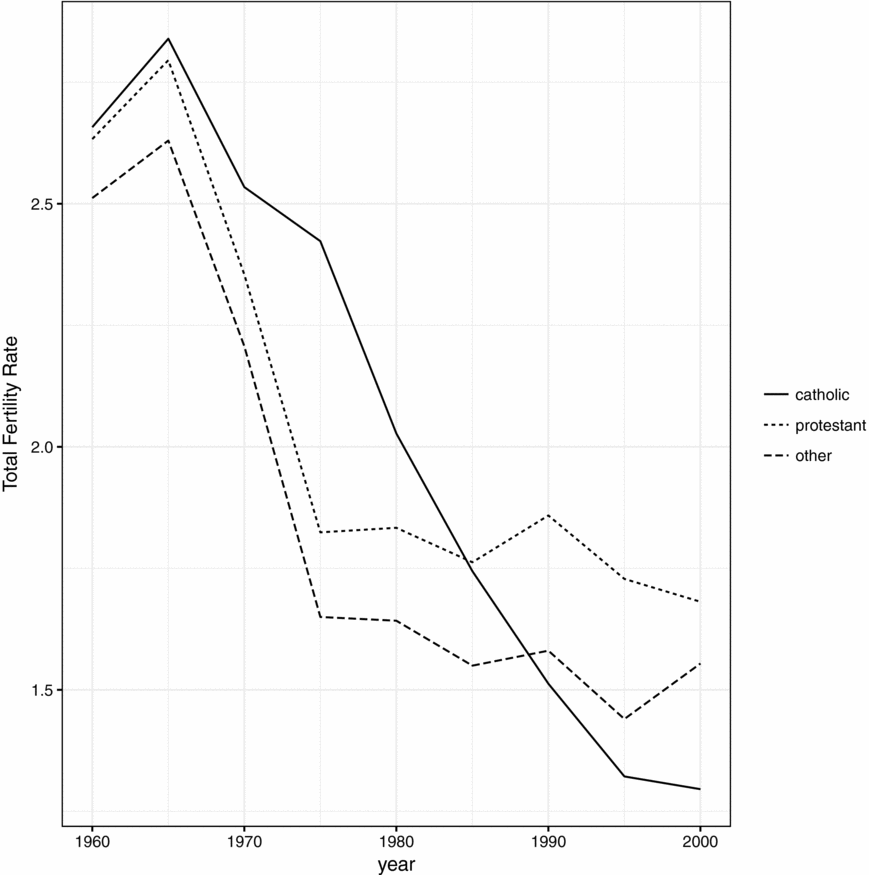
We argue that changes in the Catholic church, and especially changes in the church's provision of social services, are key to the observed decline in fertility. For an indication of Catholicism's possible relevance, see Figure 1, which plots total fertility rates (TFR) for three categories of Western European nations: the Catholic countries (with more than 70% of the population Catholic – Belgium, Ireland, Italy, Luxembourg, Portugal, Spain,); the Protestant (with 70% or more Protestants – Denmark, Norway, Sweden, and the UK); and other countries (with neither religion dominant or with a history of strong separation between religious and national institutions – France,Footnote 2 Germany, Greece, Netherlands, and Switzerland). In the 1970s, fertility rates in Catholic countries exceeded that of the non-Catholic countries by nearly half a child per woman. But by the 1990s, fertility in these same Catholic countries had declined so rapidly that it averaged half a child less than that of the Protestant countries – a gap that continues through the present.
Western European fertility.

Why did fertility decline so rapidly in highly Catholic countries? General declines in religiosity cannot provide the answer, since church attendance and other measures of religiosity declined more in Protestant countries than Catholic during the years in question. Nor can the explanation be a change in Catholic doctrine on birth control since these teachings have not changed. Nor do changes in personal compliance with those teaching supply the answer, since insofar as such changes have occurred, the changes have been as great or greater outside of Southern Europe.
We offer an alternative explanation: the Catholic church retreated in the mid-1960s from providing a variety of family-friendly services that had previously reduced the cost of Catholic childrearing. Nuns were key to the provision of those services, and the Second Vatican council of 1962–65 (known as “Vatican II”) led to a dramatic decline in the number of nuns (as well as priests) and thus raised the cost of childrearing.
Consistent with this explanation, our empirical results show that cross-country variation in the decline in nuns per Catholic is a strong predictor of differential fertility decline in European countries between 1960 and 2000. The variance underlying that inference comes from the interaction of cross-country variation in the pre-Council level of nuns per Catholic with post-Vatican II attrition of nuns, which has slightly different timing across countries.
Church attendance among Catholics also declined sharply after Vatican II. But this by itself would probably not have led to fertility decline, given that fertility is unrelated to attendance among Protestants. Among Catholics, the effect of reduced attendance seems to be particularly strong when service provision is high – a complementarity that is consistent with club models of religion. Within religious clubs, services are preferentially provided to members who participate more extensively – attending more, contributing more, demonstrating more belief and commitment, etc. Services provided by priests are a poorer predictor of fertility than those provided by nuns, suggesting that it is social services rather than theological services that most dramatically affect costs of childrearing. Indeed, nuns appear to increase fertility by a remarkable 300 to 400 children per nun.
These results have strong implications for public policy, as they indicate that the availability of relatively inexpensive, family-friendly services has sharp effects on fertility, with each additional service provider predicting hundreds more children born.
The paper proceeds as follows: Section 2 briefly surveys the literature on religion, economics, and fertility, and sets out our conjectures in detail. Section 3 describes institutional aspects of the Catholic church, including the Second Vatican Council. In Section 4, we provide a simple framework for estimation which allows religious institutions to affect fertility through both theological and service provision channels. Section 5 describes our data, Section 6 reports estimation results, and Section 7 concludes.
2. LITERATURE
Our approach combines insights from two literatures: economic demography and the economics of religion. Economic demography explains the importance of childhood mortality and female labor force participation [Becker and Lewis (Reference Becker and Lewis1973) and Becker (Reference Becker1991)]. Becker's quality–quantity theory emphasizes the role of rising female earnings in increasing the cost of raising numerous children relative to that of child “quality” (education, health, etc.), inducing mothers to give birth to fewer children while investing more resources invested in each child. Yet, female labor force participation is now associated with relatively high fertility across countries in Europe, contradicting the prediction of the Becker model. Childhood mortality rates are low and stable in Europe so they cannot explain falling fertility either.
Bongaarts (Reference Bongaarts1999) suggested that uniquely low European TFR in the 1990s may under-predict eventual fertility, and that women will compensate later in life for the low fertility of their 20s. Yet, no such recovery in TFR has been observed as those women have reached their 50s, making a subsequent fertility increase unlikely. Del Boca (Reference Del Boca2002, Reference Del Boca, Pasqua and Pronzato2003) has argued that Southern European labor market institutions are very unfavorable to working mothers, with poor provision of child care and few part time jobs available with benefits. She reasons that rather than work or raise children, young women wait (typically living with parents) until they obtain a job that accommodates motherhood. de Laat and Sevilla-Sanz (Reference de Laat and Sevilla-Sanz2006) offer an analogous explanation based on norms, arguing that Southern European fathers are less willing to care for children, increasing the shadow cost of child rearing for potential working mothers and augmenting the substitution effect of rising women's wages on fertility. Giuliano (Reference Giuliano2007) links the gender role attitudes of Southern Europeans to low labor force participation in both Europe and the United States. Our theory offers an alternative but complementary set of explanations grounded in the Catholic church's historic role as a major provider of institutional and normative support for fertility and childrearing.
Past studies find links between religiosity and fertility [Stolzenberg et al. (Reference Stolzenberg, Bair-Loy and Waite1995)], particularly in Southern Europe [Lehrer (Reference Lehrer1995, Reference Lehrer1996)]. Differential fertility among Catholics and Protestants in the United States have been studied extensively, and Westoff and Jones (Reference Westoff and Jones1979) showed that Catholics experienced an amplified baby boom – higher completed fertility in the 1950s (by about one child per family), followed by rapid fertility decline in the 1960s and 1970s that eliminated the Catholic/Non-Catholic fertility differential by the mid-1970s. Westoff and Jones also found that among Catholics, religiosity (as measured by rates of taking communion) was associated with higher fertility in the 1950s and 1960s but not in the 1970s. Rosenzweig and Schultz (Reference Rosenzweig and Schultz1985) found that Catholics have more children even after adjusting for other socioeconomic factors, such as maternal education. Sander (Reference Sander1992) takes issue with a causal interpretation of the effect of Catholicism on fertility, reporting evidence that couples who prefer large families are more likely to remain Catholic or convert to Catholicism.
Research by Adsera (Reference Adsera2006a, Reference Adsera2006b) examines the role of religion and religiosity in Spain. Using data from the 1985 and 1999 Spanish Fertility Surveys, she finds that fertility among practicing (church-going) Catholics of the mid-1980s was no higher than fertility among non-practicing Catholics. Yet, by the late-1990s, after 15 years of decline in attendance rates, the practicing Catholics did have higher fertility. A companion paper using International Social Survey Program (ISSP) data shows that Spain in 1985 may be an anomaly [Adsera (Reference Adsera2006a, Reference Adsera2006b)]. In the 13 OECD countries surveyed by the 1994 ISSP, higher church attendance is associated with significantly higher desired fertility in all countries for women and in all but two countries for men. This leaves open the possibility that a decline in religiosity has contributed to declining fertility in highly Catholic countries besides Spain.
Club-theoretic models drawn from the economics of religion predict that communally oriented “sectarian” religions will tend to have high fertility even in the absence of explicit pronatalist theology because they induce women to voluntarily adopt prohibitions that allow the group to effectively provide a set of local public (club) goods. Those prohibitions lower the opportunity cost of childrearing insofar by reducing women's access to secular consumption and labor markets.Footnote 3 Catholicism is not particularly sectarian, but if religiosity can strongly affect sectarian fertility through social service provision, it should not be surprising to see analogous effects in religions with less strict prohibitions and practices.
3. THE SECOND VATICAN COUNCIL AND FERTILITY
3.1. The Social Consequences of Communal Religion
Given that most religious groups encourage fertility, cross-group variation is more likely to reflect variation in a group's capacity implement fertility norms than variation in the norms themselves. Scholars have long recognized that religions are social phenomenon in which collective activities underpin religion's capacity to constrain behavior and maintain institutions. They have also recognized that some religions are more strongly collective than others. Smith (Reference Smith1965: 748–750) observed that “strict or austere” systems of morality are far more common in “little religious sects” than in government-regulated “established churches.” Subsequent generations of scholars developed insights like these into a full-blown theory of religious organization. Sociologist [Durkheim (Reference Durkheim and Swain1965: 62)] argued that collectivity explained how “religion,” but never “magic,” could sustain “moral communities” governed by “unified systems of beliefs and practices.”
For European sociologists of the 19th and early-20th centuries, a stronger communal orientation likewise distinguished Catholicism from mainstream (state-church) Protestantism. The social consequences of this difference ranged from lower rates of suicide among Catholics [Durkheim (Reference Durkheim and Swain1965) and Becker and Woessmann (Reference Becker and Woessmann2011)] to more rapid economic development among Protestants [according to Weber (Reference Weber, Gerth and Wright Mills1946)]. Despite lingering debate over these inferences [for example, Becker and Woessmann (Reference Becker and Woessmann2009)], most religious researchers broadly agree that the Catholic church traditionally promoted stronger group identity and sustained a broader array of institutions than did any Protestant state church. The scholarly consensus about Catholicism, communalism, and behavioral constraints suggests that fertility might well be another behavior sustained more effectively by Catholicism than Protestantism. Official Catholic doctrine favors fertility and opposes all forms of birth control and abortion, and Catholicism has traditionally been associated with large family size.
3.2. The Second Vatican Council and Declining Catholic Religious Activity
Yet, communalism requires institutions, and the Second Vatican Council (Vatican II) led to broad-based institutional decline within Catholicism. The losses included reductions in the number of people becoming or remaining priests, even larger reductions in the number of nuns, reduced mass attendance among the Catholic laity, and increased willingness among Catholics to question official doctrine, including prohibitions on divorce and birth control [Hout and Greeley (Reference Hout and Greeley1987), Greeley (Reference Greeley1989), Schoenherr and Young (Reference Schoenherr and Young1993: 10–12), and Stark and Finke (Reference Stark and Finke2000: 169–190)]. Although scholars continue to debate why Vatican II had these effects, the decline itself is universally acknowledged.
Scholars view the Second Vatican Council as a massive exogenous shock – more consequential than any other change to Catholicism in the past several centuries.Footnote 4 Both contemporaneous and historical accounts stress Vatican II's surprising character – particularly for parish priests, nuns, and ordinary Catholics [Dolan (Reference Dolan1985: 421–454) and Hoge and Wenger (Reference Hoge and Wenger2003: 7–12)]. The Pope (John XXIII) who initiated Vatican II was 77-years old when elected in 1958 and was widely expected to serve as an interim “caretaker” (and he did indeed die within 5 years of his election). Only one other general council had ever been called – in 1870 – and its effect had been to resist change and reaffirm church tradition. Thus, even those who applauded the Pope's decision to convene the Council in 1962 could not have known that his call for “updating” would eventually affect scores of doctrines and practices that for hundreds of years had distinguished Catholicism from Protestantism.
Likewise, the architects of Vatican II failed to anticipate the consequences of their reforms. Catholicism had been growing for a 100 years or more, and the 1946–1965 post-war period had witnessed especially rapid growth: in total number of Catholics, in church attendance rates, in the numbers of priests and nuns, and in Catholic schools and hospitals. To the great surprise and dismay of Catholics everywhere (and especially the Catholic hierarchy), all these growth trends reversed immediately after Vatican II. Among the hundreds of historians, sociologists, and religious scholars who have analyzed the Vatican II era with methods ranging from textual analysis to survey research, we encounter nearly unanimous agreement: the decline was unanticipated and precipitated primarily by changes initiated by the church hierarchy, rather than by external events or changes (such as trends in income, education, or female employment, or changes in the secular culture).
Liberals and conservatives within the Catholic church still disagree over the mechanism by which Vatican II caused attrition of clergy from the church. Liberals argue that by convening the Council the church created an expectation of even broader reforms, including allowing clergy to marry and laity to practice birth control – practices typical of Protestant denominations. When those expectations were dashed, goes the argument, nuns, priests brothers, and prospective clergy decided that the awaited reforms would not happen in their lifetimes, and reacted by either leaving the fold or declining to join in the first place.
Conservatives have a very different explanation for the attrition of clergy. They emphasize that prior the Second Vatican Council, Catholic doctrine accorded priests and nuns a status far above that of the laity. The Council ushered in a new era of theological egalitarianism – in which every Catholic enjoyed a similar status before God and in which a wide range of roles including education, care for the sick, and care of the poor, and many church services were opened to the laity. The unanticipated effect was to dramatically reduce the status of the clergy relative to the laity without reducing key costs (including vows of celibacy and obedience). Conservatives thus make the case that nuns and priests responded to their reduced status by renouncing their vows (or not taking them in the first place), serving as lay Catholics, and enjoying the benefits that come with marriage and secular careers.
Though the conservative story has come to be more widely accepted than the liberal, for our purposes, the important fact is that both explanations are exogenous to fertility.
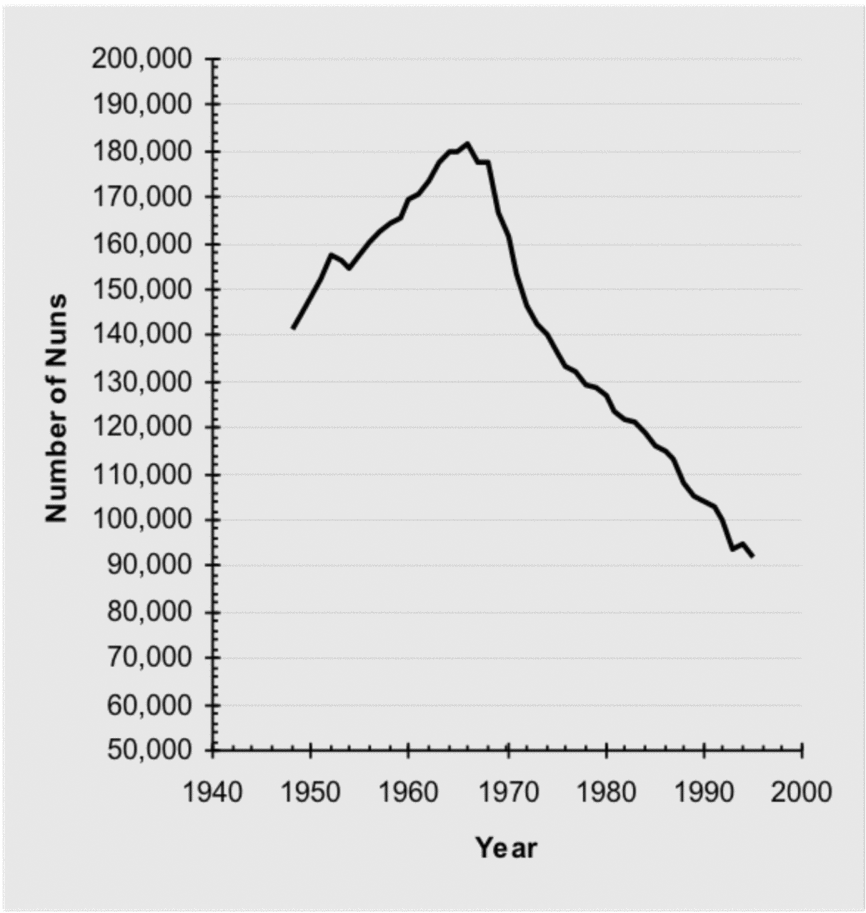
Official church statistics provide detailed evidence of institutional losses following Vatican II. These diminished the church's labor force, undermined its capacity to provide traditional services (most notably Catholic schools, day care, and hospitals), and reduced its visible presence in community life.Footnote 5 Stark and Finke (Reference Stark and Finke2000), using data from the Official Catholic Directory, report that the number of nuns in the United States rose steadily from about 140,000 in 1948 to 180,000 in 1966, the concluding year of Vatican II. Steady growth then immediately turns into precipitous decline, dropping to about 90,000 by 1995 and continuing downwards thereafter, as illustrated in Figure 2, which is reproduced from Starke and Finke (Reference Stark and Finke2000). Analogous turning points in the mid-to-late 1960s have been extensively documented in the United States, for the number of priests, average rates of mass attendance, contribution rates, and respect for church doctrine.
American nuns Since 1948 [Source: Official Catholic Directory, from Stark and Finke (Reference Stark and Finke2000)].

Post-Vatican II declines in clergy do not follow identical paths in all countries, but in every developed Western country, the number of priests and nuns began to decline dramatically within 5 years of 1965, as we will see below for Western Europe.
3.3. Catholic Social Services
Before Vatican II, the church played an important role in providing social services in strongly Catholic countries and communities. Nuns were instrumental in that provision. In Italy, for example, “until 1966 virtually all [pre-schools] were private [and] seventy percent of nursery and kindergarten children were cared for by religious sisters.” [Lee and piveteau (Reference Lee and Piveteau1967: 165)]. In the United States before Vatican II, about 50% of Catholic children attended Catholic schools in the 1950s, and Catholic hospitals provided about one-fifth of all hospital beds (while Catholics accounted for about one-fourth of the U.S. population) [Fialka (Reference Fialka2003: 3)]. Social life in Catholic communities routinely revolved around the Catholic parish and Catholic organizations.
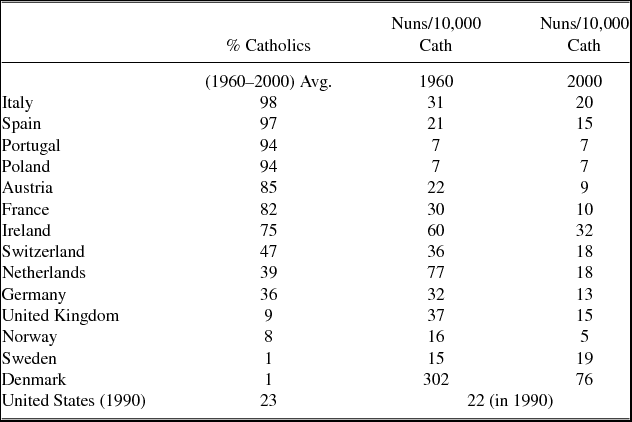
The number of nuns provides the best single index of Catholic social services, since nuns traditionally constituted the primary labor supply staffing Catholic schools, hospitals, and other church-related institutions. Table 1 reports on nuns per 10,000 Catholics in various countries in Europe, showing that the level of clergy-provided services varied widely across countries in the 1960s. (Data sources are documented in Section 5 below.) Examining the seven European countries with Catholic majorities, the number of nuns per 10,000 Catholics in 1960 ranged from seven in Portugal and eight in Poland to 60 in Ireland. By the year 2000 that range had narrowed considerably as the number of nuns per 10,000 declined to 32 in Ireland but remained at seven in Portugal. As a result, Irish Catholics, for instance, suffered much more clergy attrition per capita after Vatican II than did Catholics in other countries. As reflected in the rightmost column: Ireland lost 28 nuns per 10,000 Catholics, France 20, Austria 13, and Italy 11, while in Spain, Poland, and Portugal, the declines were much smaller: six, one, and zero respectively.
How important could these nuns have been as social service providers? For comparison, for each 10,000 people in the United States, there are 97 teachers (pre-kindergarten through elementary), 86 nurses, and 29 social workers. While the number of nuns/Catholic is less than that in these European countries, it is of a similar order of magnitude, especially considering that we have not counted brothers, priests, and volunteers, and that a parallel secular workforce exists in these occupations.
In the United States, extensive survey data on religious activity and religion-specific fertility stretch back to the 1940s. From the mid-1800s through the mid-1900s, the Catholic population, about one quarter of Americans, remained visibly distinctive – with its own schools, characteristic ethnicities, low intermarriage to non-Catholics, and a full complement of “parallel” institutions, including churches, social clubs, business associations, civic associations, and academic societies.
The strength and size of Catholic parallel institutions in the United States peaked in the 1950s [Greeley et al. (Reference Greeley1976) and Greeley (Reference Greeley, McCready and McCourt1977)]. By the late 1960s, most of these institutions had closed, shrunk, or became non-sectarian. A comprehensive study of religious orders found that between 1962 and 1992, orders of sisters shrank by 42%. The orders shut down 23% of their hospitals, 15% of their universities and colleges, and 42% of their elementary schools. By the end of the century, there were fewer than 81,000 sisters in America (compared to the 1968 peak of 180,000) and their median age was 69 [Fialka (Reference Fialka2003: 17)]. Overall, 40% of the Catholic high schools and 27% of elementary schools closed between 1964 and 1984. These closure rates underestimate the loss of nuns. In the schools that remained, the share of non-lay teachers rose from under 10% in the 1920s through 1950s to peak at 70% in the mid-1960s, but then declined to 46% in 1970, 26% in 1980, 12% in 1990, and 6% in 2000. Those most familiar with Catholic schooling data claim the decline was almost entirely induced by supply effects, as nuns left, were replaced by (much higher paid) lay teachers, and schools could no longer cover these higher staffing costs [Dolan (Reference Dolan1985:442) and Bryk, Lee and Holland (Reference Bryk, Lee and Holland1993: 52)].Footnote 6
Catholic church attendance and fertility in the United States also rose before Vatican II and fell afterwards. And as previously noted, Catholic fertility did not merely exceed Protestant fertility during the post war “baby boom” it experienced both a magnified rise and fall [Westoff and Jones (Reference Westoff and Jones1979)]. Since 1965, Catholic fertility has declined by about a child per woman more than Protestant fertility, mirroring the excess decline for Catholics in Europe [Hout and Greeley (Reference Hout and Greeley1987) and Greeley (Reference Greeley1989)]. Our primary concern is to understand why. In the following section, we will develop a general framework that allows us to test competing theories.
4. ECONOMIC FERTILITY AND RELIGION: A FRAMEWORK FOR ESTIMATION
To recap, we seek to explain why fertility declined so much faster for Catholics than it did for Protestants after 1965, as seen in Figure 1. As we have noted, Vatican II caused a sharp decline in clergy per Catholic in Europe, and that the decline in available clergy reduced both spiritual and tangible services supplied to Catholic communities. This section describes competing theories and draws out their testable implications.
Several plausible mechanisms linking religiosity to fertility are often discussed: First, religion could affect individual preferences for children or for use of birth control. Second, religion could influence social norms regarding childbearing or women's work. Third, religion could affect a mother's educational attainment and thus change the opportunity cost of raising children. Fourth, religion could affect national politics and thus the provision of child-friendly social services by government. A fifth alternative, which combines institutions and a Becker–Schultz approach, is that religious communities might reduce the effective price of raising children by providing child-friendly social services such as day care, schools, and medical care. A club model of denominations would generate a variant of that mechanism, in which families that demonstrate more religiosity obtain preferential access to family-friendly services. Finally, it is possible that religiosity and theology are merely symptomatic of attitudes toward fertility that change for other reasons.
4.1. Religion in a Fertility Model: Preferences and Service Provision
A theoretical framework helps clarify how religion might affect fertility. Assume a family maximizing a joint utility function for two adultsFootnote 7 and f children by optimally choosing consumption, C, and the number of children f:Footnote 8
 $$\begin{equation}
\mathop {\max }\limits_{c,\ f} \ U\left( {c,f,\mu} \right),\ \
\end{equation}$$
where
 $$\begin{equation*}
U\left( {c,f,\mu} \right) = \ u\left( {c,\ f)\ - \pi\left( a \right)\left( {f - \mu} \right)1(f < \mu } \right).
\end{equation*}$$
Here the family is concerned with consumption per family member  $c = \frac{C}{{2 + f}}$, in the tradition of a Becker (Reference Becker1991) quality–quantity model.Footnote 9 It also gains direct utility from fertility.
We also allow the possibility that fertility norms enter a family's utility, using a formulation from research on identity [Akerlof and Kranton (Reference Akerlof and Kranton2000, Reference Akerlof and Kranton2010)], in which the family experiences disutility associated with the distance between actual fertility, f, and some theological (or ideological) constant, μ, representing norms of desired fertility.Footnote 10 In that term, π is the weight associated with a religious identity, which is influenced by religiosity, a. This term could also be understood as reflecting the disutility associated with the use of birth control, to the extent that it affects fertility, the outcome of interest.
Denoting derivatives with subscripts, we assume that u 1, u 2, and πa are positive, that u 11, and u 22 are non-negative, that fertility and consumption per capita are weak complements, u 12 ≥ 0, and that both increasing in all their arguments, that u(.) is concave, and that u 1(0) = u 2(0) = ∞.
The family is subject to a budget constraint where a fixed time allocation, T, can be spent either on work hours, H, or raising children λf,
 $$\begin{equation}
C \le wH = w(T - \lambda f).
\end{equation}$$
In terms of consumption per capita, the budget constraint is
 $$\begin{equation}
c \le \frac{{wH}}{{2 + f}}\ = \ \frac{{w\left( {T - \lambda f} \right)}}{{2 + f}}\ .
\end{equation}$$
Religion can enter this budget constraint in three ways. Let q measure the quality of social services provided by church, and assume that both q and a affect the time cost of raising children λ = λ(a, q). The idea is that low cost schooling, daycare, and health services reduce the time required of parents in raising children. One mechanism is through service quality. As service quality improves (through longer hours or more attractive church-provided services), then the time cost of childrearing would decline in quality,  $\frac{d}{{dq}} < 0.\ $(A variant of that mechanism would be political, with churches successfully lobbying for public policy changes that lower the cost of childrearing.) A second effect of religion is through access. If access to social services is preferentially provided to individuals who publicly display religiosity, then
 $\frac{d\lambda}{{da}} < {0{\rm{\ when}}\ q} > 0$ and
 $\frac{{{\partial ^2 \lambda}}}{{\partial a\partial q}} < 0$. Conditioning service provision on religiosity by a religious institution is rationalized by a club model [Iannaccone (Reference Iannaccone1992, Reference Iannaccone1999) and Berman (Reference Berman2000)]. A third channel runs through wages. Religious norms and prohibitions tend to reduce the effective wage of women by restricting their access to labor and goods markets and reducing their productivity when working [as in Berman (Reference Berman2000) and Berman and Stepanyan (Reference Berman2003)], so that w = w(a), with
 $\frac{{dw}}{{da}} < 0$.
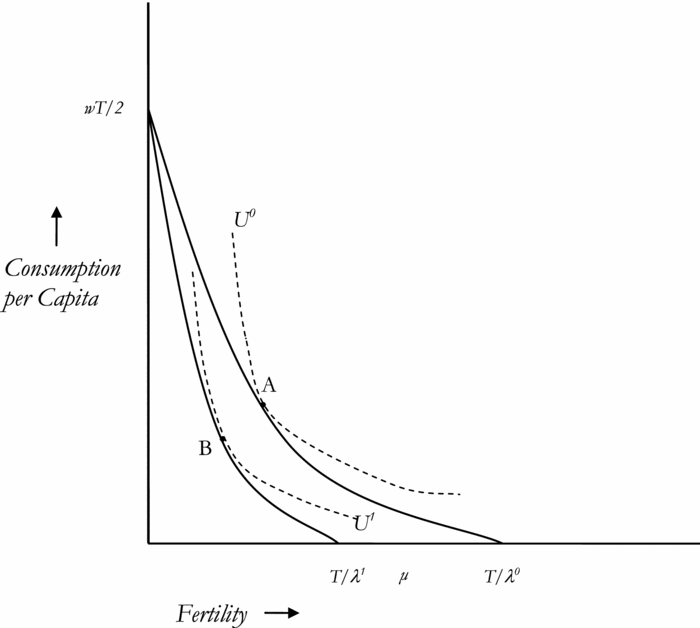
We solve for the optimal choice of consumption and fertility to derive a demand for fertility. That optimum is illustrated by point A in Figure 3. The budget constraint (2.1) slopes downward and is convex:
 $$\begin{eqnarray*}
&&\frac{{\partial c}}{{\partial f}} = \frac{{ - \lambda w( {2 + f} ) - w[ {T - \lambda f} ]}}{{{{( {2 + f} )}^2}}} = \frac{{ - w[ {2\lambda + T} ]}}{{{{( {2 + f} )}^2}}} < {0},\\
&& so\ \frac{{{\partial ^2}c}}{{\partial {f^2}}} = \frac{{2w[ {2\lambda + T} ]}}{{{{( {2 + f} )}^3}}} > 0.
\end{eqnarray*}$$
Fertility and childbearing costs.

Substituting (2.1) in (1) yields
 $$\begin{equation*}
\mathop {{\rm{Max}}}\limits_f u\Bigg( {\frac{{w\left( {T - \lambda f} \right)}}{{2 + f}},\ f\Bigg)\ -\pi( a )( {f - \mu} )1(f < \mu } ).
\end{equation*}$$
The first order condition is then
 $$\begin{equation*}
0 \ge \frac{{\partial U}}{{\partial f}} = \ - {u_1} {\frac{{w\left( {2\lambda + T} \right)}}{{{{\left( {2 + f} \right)}^2}}}\ + \ {u_{2\ }} + \pi\left( a \right)1(f < \mu } ).
\end{equation*}$$
The infinite marginal utility assumptions rule out solutions at f = 0 or c = 0, (f = T/λ), so that the derivative condition above holds with equality (except possibly for an unlikely solution where f = μ, because of a kink in the indifference curve in Figure 3).
The second-order condition assures that the optimum illustrated at A is a unique maximum for f ≠ μ,
 $$\begin{equation*}
\ \ \frac{{{\partial ^2}U}}{{\partial {f^2}}} = \ {u_{11}}\ {\left[\frac{{w\left( {2\lambda + T} \right)}}{{{{\left( {2 + f} \right)}^2}}}\right]^2} - {u_{12}}\frac{{w\left( {2\lambda + T} \right)}}{{{{\left( {2 + f} \right)}^2}}} - \ {u_1}\frac{{2w\left( {2\lambda + T} \right)}}{{{{\left( {2 + f} \right)}^3}}} + \ {u_{22\ }} < 0.
\end{equation*}$$
Intuitively, this is the result of the indifference curve being more convex than the budget constraint.
Solving for the optimal choice of consumption and fertility yields a derived demand for children in terms of wages, the weight placed on norms of fertility, and the cost of raising children,
 $$\begin{equation}
f\left( {w\left( a \right),\;\pi\left( a \right),\;\lambda\left( {a,q} \right)} \right).
\end{equation}$$
Proposition: Fertility increases in the weight on norms (π) when f < μ and decreases in childrearing costs (λ) when f ≠ μ.
Proof: Applying the Implicit Function Theorem,
 $$\begin{eqnarray*}
\frac{{df}}{{d\pi }} &=& \ \ {\raise0.7ex\hbox{${ - \frac{{{\partial ^2}U}}{{\partial f\partial \pi }}}$} \!
/ \!\lower0.7ex\hbox{${\frac{{{\partial ^2}U\ \ }}{{\partial {f^2}}}}$}} = {\raise0.7ex\hbox{${ - \ 1(f < \mu )}$} \!
/ \!\lower0.7ex\hbox{${\frac{{{\partial ^2}U\ \ }}{{\partial {f^2}}}}$}} > 0.\\
\frac{{df}}{{d\lambda }} &=& \ \ {\raise0.7ex\hbox{${ - \frac{{{\partial ^2}U}}{{\partial f\partial \lambda }}}$} \!
/ \!\lower0.7ex\hbox{${\frac{{{\partial ^2}U\ \ }}{{\partial {f^2}}}}$}}, \\
\frac{{{\partial ^2}U}}{{\partial f\partial \lambda }} &=& - {u_{11}}\frac{{ - wf}}{{2 + f}}\ \frac{{w\left( {2\lambda + T} \right)}}{{{{\left( {2 + f} \right)}^2}}} - \ {u_1}\frac{{2w}}{{{{\left( {2 + f} \right)}^2}}} + \ {u_{22\ }} < 0,
\end{eqnarray*}$$
 $$\begin{equation*}
so\ \ \frac{{df}}{{d\lambda }} < 0.
\end{equation*}$$
Figure 3 illustrates the fertility effect of increased childrearing costs, λ, which shifts the budget constraint inward, reducing full income and raising the opportunity cost of each child. The new equilibrium is illustrated at point B, where fertility is lower than at point A. Note that while fertility is unambiguously reduced, the effect on consumption is ambiguous. Likewise, the effect of increased wages on fertility is ambiguous because wages have both income and substitution effects, though the literature has emphasized the substitution effect [Becker and Lewis (Reference Becker and Lewis1973)], operating through the opportunity cost of a mother's time.
We do not observe w, λ, or π, but we can restate the demand for children in terms of religiosity, a, and quality of services, q, for which we observe proxies. A reduced form in terms of a, q, and an interaction (explained below) is f*
 $$\begin{equation}
f\left( {w\left( a \right),\;\pi\left( a \right),\;\lambda\left( {a,q} \right)} \right) = f^{*}\left( {a,\;q} \right)\!.
\end{equation}$$
4.2. Predictions for Fertility Demand
This equation implies three interesting predictions about how religiosity and service provision affect fertility.
First, examining the terms reveals that fertility likely increases in religiosity a, through each of three mechanisms:
 $$\begin{equation}
\frac{{df}}{{da}}\left|_{\smash{\raise-8pt\hbox{\scriptsize\it q}}} {\ = \frac{{\partial f}}{{\partial w}}\ \frac{{dw}}{{da}} + \frac{{\partial f}}{{\partial \pi }}\ \frac{{d\pi }}{{da}}\ + \frac{{\partial f}}{{\partial \lambda }}\ \frac{{d\lambda }}{{da}}} \right|_{q}.
\end{equation}$$
Starting with the rightmost term, if service provision is conditional on demonstrating religiosity, so that religiosity provides preferential access to lower cost childrearing services, as a religious club would do, then  $\frac{d\lambda}{{da}}$ < 0. Since childrearing costs lower fertility (see the proposition), the rightmost term is positive. The middle term is also positive if high religiosity increases the influence of norms or theology, π, on a woman's fertility behavior, since
 $\frac{{\partial f}}{{\partial \pi }}\ $ is positive (again, by the proposition). The left term measures the effect of religiosity on fertility through labor markets. If religiosity shifts a woman's norms away from a lifestyle that encourages human capital formation and active labor force participation, we can think of that as religiosity lowering market wages,
 $\frac{{dw}}{{da}}$ < 0. That term has ambiguous sign since the sign of
 $\frac{{df}}{{dw}}$ depends on whether a positive income effect of increased wages is dominated by a negative substitution effect (analogous to a possibly backward-bending labor supply curve). Empirically, the literature has found a dominant substitution effect,
 $\frac{{df}}{{dw}}$ < 0, leading us to cautiously predict an overall positive effect of religiosity on fertility in (4.2).
We have the ability to estimate  $\frac{{df}}{{da}}\big|_{q} \ $ holding labor force participation constant, allowing us to isolate the two rightmost terms, representing norms and the cost of raising children, which are unambiguously positive.
A second, and more distinctive prediction is that service quality, q, unambiguously increases fertility by lowering the cost of childrearing. Note that this effect is entirely through the budget constraint – not through preferences.
 $$\begin{equation}
\frac{{df}}{{dq}}\left|_{\smash{\raise-8pt\hbox{\scriptsize\it a}}} {\ = \ \ \frac{{\partial f}}{{\partial \lambda }}\ \frac{{d\lambda }}{{dq}} > 0} \right.\!.
\end{equation}$$
Third, if access to social services is preferentially provided to individuals displaying at least some religiosity, a, as a club would do, then social service quality and religiosity will be complements in fertility,
 $$\begin{equation}
\frac{{{\partial ^2}f}}{{\partial a\partial q}} = \ \frac{{\partial f}}{{\partial \lambda }}\frac{{{\partial ^2\lambda}}}{{\partial a\partial q}} > 0.
\end{equation}$$
To test those predictions, we will measure religiosity, a, using church attendance – present and past – allowing us to link observable religiosity to fertility. We will use nuns per Catholic as our measure of q, recalling that nuns provided much of the staffing of educational, health, and welfare services during the heyday of Catholic social service provision. We turn now to a description of data that will allow us to test these predictions.
5. DATA
We make use of data from three sources: administrative data from the Vatican, the ISSP, and the World Development Indicators (WDI).
The Vatican collects data for each diocese in the world, including the number of priests (diocesan and regular), nuns, churches, schools, hospitals, other institutions, Catholics, and new baptisms. These data are available dating back to 1959 on an annual basis.Footnote 12 Figure 4 reproduces a page from the 1960 Annuario Ponteficio describing entries for Agra in India and Agrigento in Sicily (the birthplace of our native Italian author).
Excerpt from the Vatican Statistical Annual (1960).

The ISSP provides standard household survey data comparable across countries (31 in the 1998 wave).Footnote 13 Critically, it includes a retrospective question on the religious participation of the respondents and their parents. The question asks “[W]hen you were around 11 or 12, how often did you/your parents attend religious service?” We use that as a measure of religiosity, a.
The ISSP is also our source for church attendance rates. Church attendance trends are those calculated by Iannaccone (Reference Iannaccone2007) using the same retrospective questions we used to build the religiosity measure. Using the 1991 and 1998 wave of the ISSP – the only two waves to ask the retrospective questions – Iannaccone builds a time series of church attendance rates for the 31 countries sampled by the ISSP. That time series covers the 1940s through the 1990s. By careful analysis and cross-validation, Iannaccone (Reference Iannaccone2007) finds that the patterns of attendance built from the retrospective questions are reliable and remarkably consistent.
From the WDI, we obtain TFR, population, education, and female labor force participation.Footnote 14
6. ESTIMATION
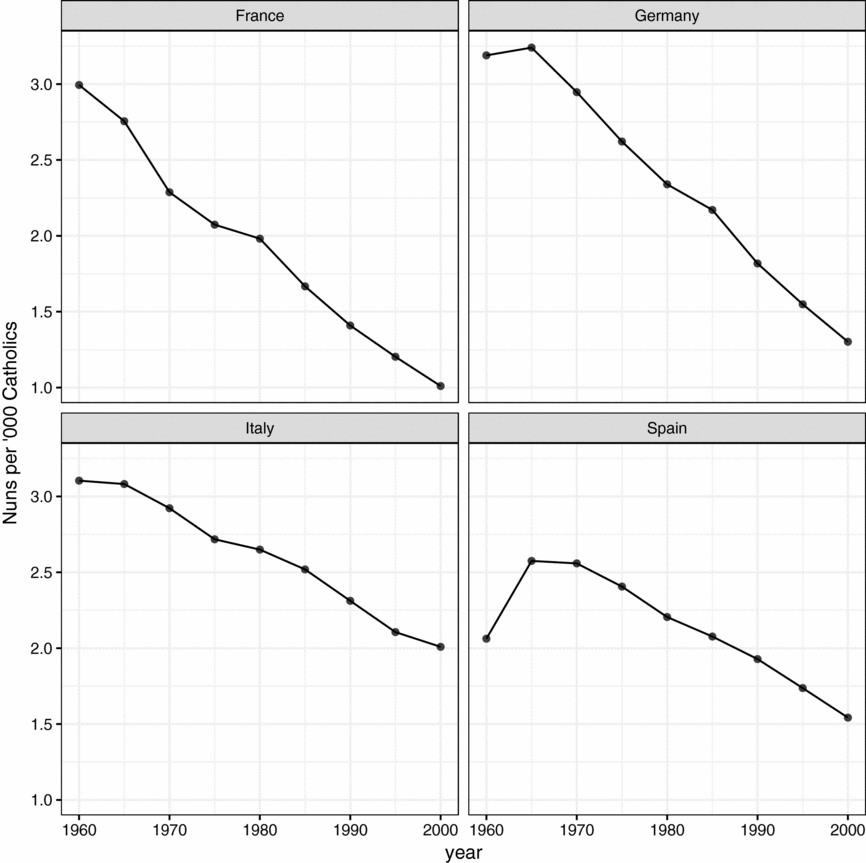
Before turning to estimates, a preliminary look at these data are instructive. Figure 5 reports on the number of nuns per Catholic in France, Germany, Italy, and Spain between 1960 and 2000, illustrating that the European pattern of attrition after Vatican II mimics that described in the literature for the United States. In Italy and Germany, the number of nuns clearly peaks in 1965, the last year of Vatican II, then declines sharply afterwards. France shows a peak in nuns in 1960 after a previous increase (not shown) and a sharp decline following 1965. In Spain, rapid growth through 1965 is followed by deceleration and then decline after 1970.
Nuns in France, Germany, Italy, and Spain (1960–2000).

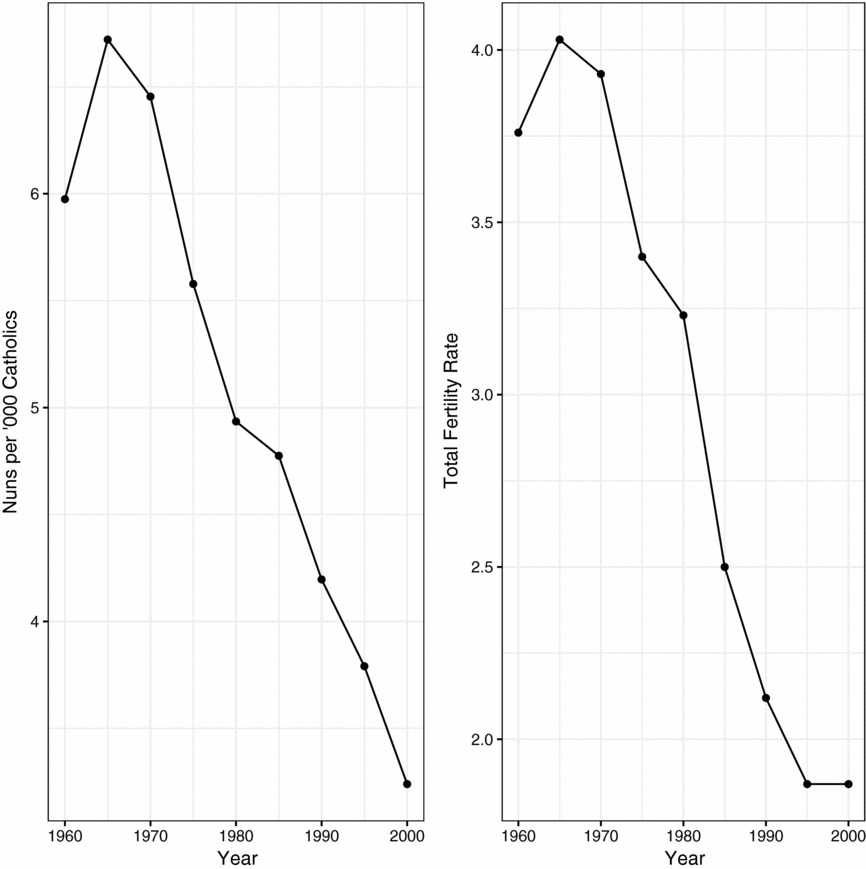
Figure 6 reports on both nuns per Catholic and fertility per capita for Ireland, foreshadowing the estimation results below. Ireland shows a clear peak in nuns in 1965 (mirroring Italy and Germany in the previous figure), which corresponds to a peak in TFR (shown in the right panel).
Fertility and nuns/Catholic, Ireland 1960–2000.

Note how rapid the onset of clergy attrition is in Italy, Spain, Germany, and Ireland, changing from persistent growth to rapid decline between 1965 and 1970 (Figures 5 and 6). This is a graphical illustration of the evidence we will use in estimation, indicating that the decline in clergy post Vatican II had an immediate effect, over and above any broad trend in the general culture's attitude toward fertility.
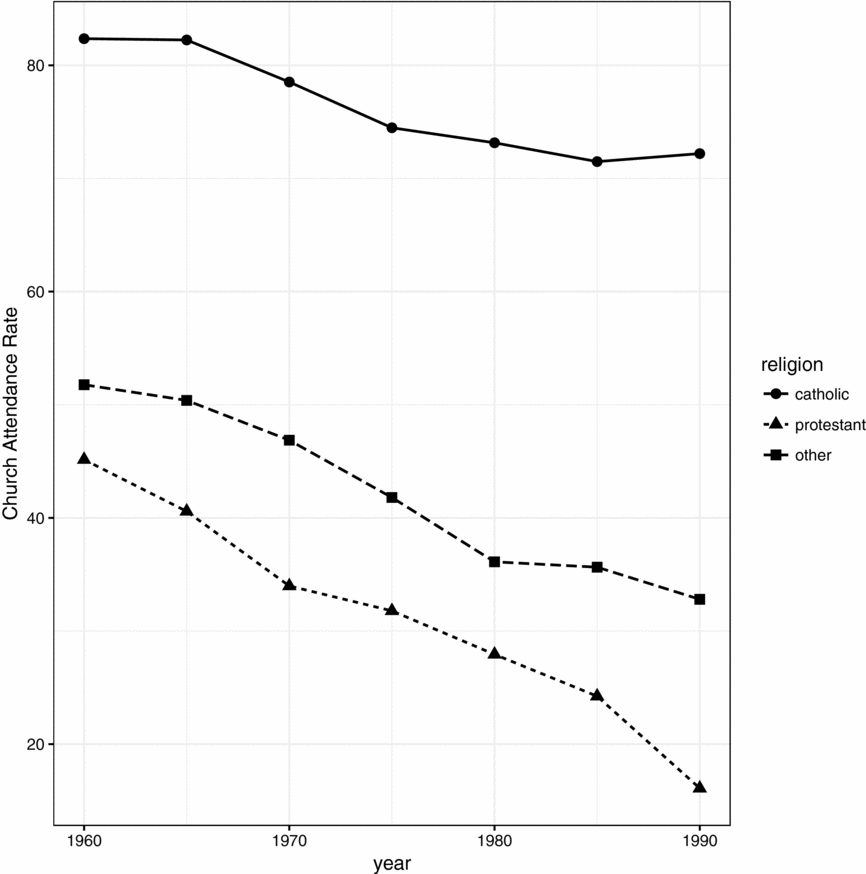
Figure 7 reports on church attendance rates, our measure of religiosity, for the same three categories of countries reported in Figure 1, between 1960 and 1990. Note that all European countries have experienced declines in church attendance (and in other indicators of religiosity – not shown). While attendance fell by over 20 percentage points in the Protestant countries, the decline in the Catholic countries was by only 10 percentage points over that 30-year period. Explanations for declining Catholic fertility, relative to that of Protestants, must come from some mechanism other than declining religiosity.
Church attendance by main religion: Catholic, Protestant, and Other European countries.

6.1. Estimating Equation
We begin by constructing an estimating equation for the demand for fertility derived in Section 4, then aggregate it to correspond to the country-level data we observe.
For an individual woman, i, we posit a linear version of (4), the demand for fertility,
 $$\begin{equation}
\ {f_{it}} = {\alpha _s} + {\beta ^r}{a_{it}} + {\theta ^r}{q_{st}} + \ {\gamma ^r}{a_{it}}{q^r_{st}}\ + {\delta _t} + {\eta _{it}},
\end{equation}$$
where the superscript r and the subscript s index religious groups, in our case Catholics and non-Catholics: r є (C,NC), s є (C,NC). Religiosity is an individual characteristic, while quality of service provision is common to co-religionists.
Restating the predictions of our framework (from Section 4.2) in terms of estimated coefficients, we have three items of interest. The attendance effect on fertility includes the effect of religiosity through opportunity costs, the effect of religiosity through norms, and the effect of religiosity through preferentially reduced costs of raising children for church attendees. We posit that it is positive, assuming (following the literature) that substitution effects dominate income effects in the wage term, βr
 $$\begin{equation}
\ \frac{{df}}{{da}}\left|_{\smash{\raise-8pt\hbox{\scriptsize\it q}}} {\ \, = \,\frac{{\partial f}}{{\partial w}}\ \frac{{dw}}{{da}} + \frac{{\partial f}}{{\partial \pi }}\ \frac{{d\pi }}{{da}} + \frac{{\partial f}}{{\partial \lambda }}\ \frac{{d\lambda }}{{da}} = \ {\beta ^r}\ { + \gamma^r}q\ \,\ > \,0} \right.\!.
\end{equation}$$
The nuns per capita effect on fertility includes both neutral reduced costs of raising children for non-attendees, and the preferentially reduced costs for attendees:
 $$\begin{equation}
\ \frac{{df}}{{dq}}\left|_{\smash{\raise-8pt\hbox{\scriptsize\it a}}} {\ = \ \ \frac{{\partial f}}{{\partial \lambda }}\ \frac{{d\lambda }}{{dq}} = \ \ {\theta ^r}\ { + \gamma^r}a\ > \ 0} \right.\!.\
\end{equation}$$
The interaction coefficient, which captures the fertility increase due to preferentially reduced costs of raising children for attendees:
 $$\begin{equation}
\frac{{{\partial ^2}f}}{{\partial a\partial q}} = \ \frac{{\partial f}}{{\partial \lambda }}\frac{{{\partial ^2 \lambda}}}{{\partial a\partial q}} = {\ \gamma^r} > 0\, .
\end{equation}$$
We seek estimates of βC, γC, and θC, which will capture, respectively, the effects of norms and theology, service provision, and preferential service provision for attendees.
Aggregating (5) for Catholics in a particular country, c, yields
 $$\begin{equation}
{f_{Cct}} = {\alpha _{Cc}} + {\beta ^C}{a_{Cct}} + {\theta ^C}{q_{Cct}} + {\gamma ^C}{a_{Cct}}{q_{Cct}}\ + {\delta _{t\ }} + {\eta _{Cct}}\!.
\end{equation}$$
Turning now to measurement, our proxy for religiosity, a, is church attendance rates, as is standard in the literature. Social service provision for Catholics is, qC, is proxied by nuns per Catholic, recalling the discussion above of the critical role that nuns played in staffing hospitals day care centers, schools, and welfare services.
Unfortunately, we lack estimated fertility rates for Catholics by country, and the ISSP does not provide precise estimates of church attendance rates for Catholics separately, forcing us to use aggregate fertility as a left-hand side variable and to approximate religion-specific church attendance rates with national church attendance rates. We discuss possible biases due to these forced measurement errors below.
National fertility rates can be expressed as the weighted average of Catholic and non-Catholic specific rates, where Pc is the Catholic proportion of the population (this proportion is well approximated as time-invariant during the relevant period), i.e., fct = Pc fCct + (1−Pc) fNCct.
Substituting in (5.1) and the equivalent equation for non-Catholics yields
 $$\begin{equation*}
\begin{array}{@{}l@{}} {f_{ct}} = {\rm{ }}{P_c}[{\alpha _{Cc}} + {\beta ^C}{a_{Cct}} + {\rm{ }}{\theta ^C}{q_{Cct}} + {\gamma ^C}{a_{Cct}}{q_{Cct}} + {\delta _{t }} + {\eta _{Cct}}]\\ \quad + {\rm{ }}\left( {1 - {P_c}} \right){\rm{ }}[{\alpha _{NCc}} + {\beta ^{NC}}{a_{NCct}} + {\rm{ }}{\theta ^{NC}}{q_{NCct}} + {\gamma ^{NC}}{a_{NCct}}{q_{NCct}} + {\delta _{t }} + {\eta _{NCct}}]. \end{array}
\end{equation*}$$
Assuming aCct = aNCct = act, and substituting, we get
 $$\begin{equation*}
{f_{ct}} = {\alpha _c} + {\beta ^{NC}}{a_{ct}} + ({\beta ^{NC}} - {\beta ^C}){P_c}{a_{ct}} + {\theta ^C}{P_c}{q_{Cct}} + \ {\gamma ^C}{a_{ct}}{P_c}{q_{Cct}}\ + {\delta _{t\ }} + {\varepsilon _{ct}},
\end{equation*}$$
where all the time-invariant terms are captured in a country effect αc = Pc αCc + (1−Pc) αNCc, and the error term includes all terms involving unmeasured quality of non-Catholic social services, εct = (1−Pc) [ϑNC qNCct + γNCaNCct qNCct] + ηCct + ηNCct. These omitted variables will cause a bias in a fixed effects specification only if the changes in family-friendly services available to non-Catholics are correlated with changes in the number of nuns per Catholic.
Denoting nuns per capita as nct and noting that nct = Pc qCct, we simplify our estimating equation to
 $$\begin{equation*}
{f_{ct}} = {\alpha _c} + {\beta ^{NC}}{a_{ct}} + {\rm{ }}({\beta ^C}{ - ^{}}{\beta ^{NC}}){P_c}{a_{ct}} + {\theta ^C}{n_{ct\ }} + {\gamma ^C}{a_{ct}}{n_{ct}}\ + {\delta _{t\ }} + {\varepsilon _{ct}}.
\end{equation*}$$
We estimate in differences over 5 years intervals. Differencing allows for non-stationarity in the error (εct). A 5-year interval is chosen rather than a single-year interval in order to reduce year to year measurement error in church attendance. So our estimating equations are of the form
 $$\begin{eqnarray}
\Delta {f_{ct}} &=& {\beta ^{NC}}\Delta {a_{ct}} + ({\beta ^C} - {\beta ^{NC}})\Delta ({P_c}{a_{ct}}) + {\theta ^C}\Delta {n_{ct\ }} + \ {\gamma ^C}\Delta ({a_{ct}}{n_{ct}})\nonumber\\
&&\, + \Delta {\delta _{t\ }} + \Delta {\varepsilon _{ct}},
\end{eqnarray}$$
where ∆xt ≡ xt − xt −5 for any variable x. Note that church attendance effects on fertility are estimated for both Catholics and non-Catholics, the effect of nuns and the interaction effect are estimated for Catholics.
6.2. Estimates
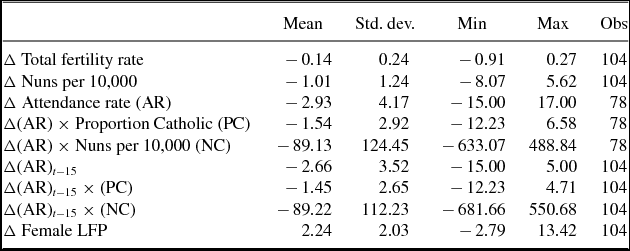
Table 2 contains summary statistics for the variables included in equation (6), with means reported in 5-year differences. Total fertility declined by an average of 0.14 children per woman over each 5-year interval from 1960 through 2000, a cumulative decline of 1.12 lifetime children. Nuns per capita, church attendance, and their interaction all showed declines, but with considerable variation across countries.
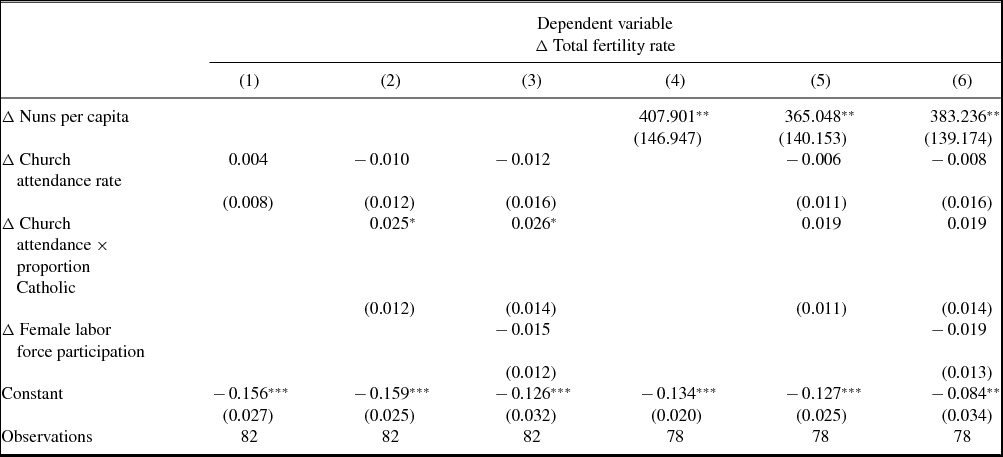
Table 3 reports estimated effects of religiosity (church attendance) and service provision (nuns) for a panel of 14 European countries between 1960 and 2000. These are partial derivatives (4.1) and (4.2). Religiosity alone does not significantly predict fertility, when we pool across countries with different mixes of Catholics and Protestants, as reported in column (1). That result changes when we allow a differential coefficient for Catholics, which yields a weakly statistically significant point estimate of 0.025 (column (2)).
Before proceeding, a comment on statistical inference is necessary. Calculating standard errors and statistical significance is complicated by the small number of countries in the sample (14) and the fact that asymptotic approximations rely on the number of countries, N (rather than N × T). We report standard errors clustered by country over time, corrected for the possibility of poor asymptotic approximation of a normal distribution by the jacknife-equivalent procedure proposed by Bell and McCaffrey (Reference Bell and McCaffrey2002), which corresponds to the “CR3” standard errors of Cameron et al. (Reference Cameron, Gelbach and Miller2008). Critical values used to denote statistical significance are those of a t-distribution with 13 (the number of countries minus 1) degrees of freedom. We have validated the statistical significance of these results using the alternative “wild bootstrap” procedure of Cameron et al. (Reference Cameron, Gelbach and Miller2008), which is designed to treat the same small-sample problem, but has lower power. Rejection probabilities (p-values) using that procedure are quite similar in general.
Now return to the differential attendance coefficient in column (2). It estimates βC−βNC. Though only weakly significant, it is a fairly large estimate, suggesting that in a (hypothetical) entirely Catholic country, a 10 percentage point decline in church attendance predicts a TFR reduction of 0.25 children relative to that of Protestants. That result is not altered by including a measure of female labor force participation (column (3)), which suggests that the effect of religiosity through raising opportunity costs of work (the leftmost term in (4.1)) is negligible.
One caveat is the possibility of reverse causality: church attendance might be affected by fertility if parents attend church because they feel it benefits their children.Footnote 15 In the discussion of reduced church attendance post Vatican II, the possibility that it occurred because there were less children is not mentioned in the literature. Moreover, it would be hard to explain why that mechanism appears for Catholics but not for Protestants, who experienced a trend reduction in church attendance without a decline in fertility.
What about service provision, they key innovation in our analysis? The right three columns of the table report estimates of the derivative in (4.2), showing very strong evidence of an effect of service provision (as proxied by nuns/capita) on fertility. Each nun per capita yields a large and statistically significant coefficient ranging from 383 to 408 children, a result that is robust across specifications. These coefficients can be interpreted as children per nun since both fertility and nuns per capita are normalized by population. Of course, these are only estimates and should be treated with caution. The standard error on the children per nun estimate in column (4) is 124 children. Nevertheless, the magnitude is remarkably large if we were to hazard a causal interpretation (more on that below). Apparently, the vows that nuns took not to bear their own children are more than compensated for by their effect on the fertility of others!
Again, we might have some concern with reverse causality, if one thought that the number of nuns responds to the demand for service provision, which is in turn tied to fertility. The literature on clergy attrition post Vatican II nowhere mentions this possibility, nor can we think of a mechanism by which clergy recruitment or attrition responds that quickly to demand; clergy typically join for life and leave for personal or theological reasons. Finally, examining Figures 5 and 6, we cannot think of a mechanism that would reduce fertility so suddenly and differentially in France, Germany, Italy, and Ireland starting in 1965, and in Spain starting in 1970, to drive the posited reverse causality mechanism.
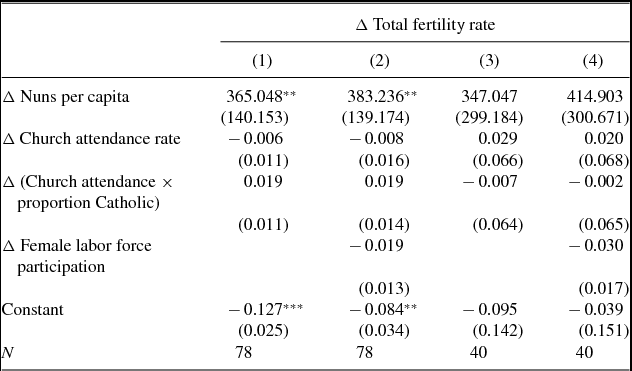
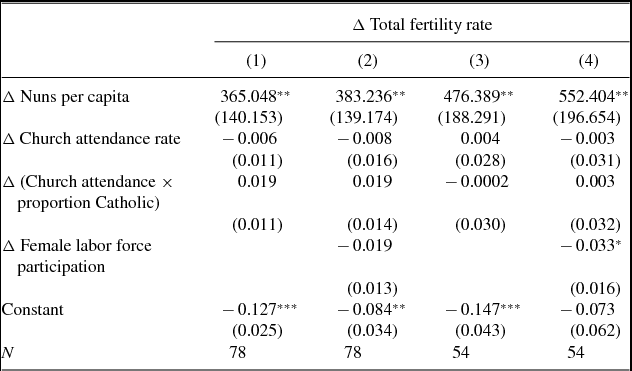
Our argument for identification of the coefficient on nuns/capita rests on the assertion that the decline in nuns per capita after 1965 was initiated by the exogenous shock of Vatican II, generating differential declines in different countries, which for historical reasons had different levels of nuns per Catholic when the shock arrived. The data that most closely captures the effects of that shock is from the 1960s and 1970s, so as a robustness check, we re-estimated for that subsample of the data, to be sure that the results match those in Table 3. Those results are reported in Appendix Tables A.1 and A.2, which show that the coefficient on nuns/capita remains large and statistically different from zero for the 1960–1980 sample, while for the shorter 1960–1975 sample the point estimate remains about the same but the larger standard errors preclude drawing statistical inference. (As in Table 3, standard errors are calculated using the Bell and McCaffrey (Reference Bell and McCaffrey2002) method.)
Nuns per catholic in European countries, 1960–2000

Number of nuns and Catholics are from the Annuarium Statisticum Ecclasiae and from the Annuario Ponteficio. The proportion of Catholic is averaged over the period 1960–2000. U.S. figures from the Catholic Directory and ARIS, www.adherents.com.
Changes in fertility, attendance and nuns

Summary statistics 1960, 5-year intervals. Population weighted. Fertility and female labor force participation are from the World Bank. Nuns and Catholics are from the Vatican Statistical Annual (1970–2000) and from the Annuario Pontificio (1960–1970). The proportion Catholic is averaged over the period 1960–2000. The 14 countries included are those listed in Table 1 above, except for the U.S. church attendance rates are calculated using the ISSP data retrospectively, as in Iannaccone (2003). Contemporaneous attendance rates are available only through 1990.
Fertility, church attendance, and nuns

Note: For variable definitions, see note to Table 2. Regressions are weighted by population. Standard errors are clustered by country and are reported in parenthesis. The calculation of standard errors is explained in the text. Stars denote significance with this convention: ***p < 0.01, **p < 0.05, *p < 0.1, where p is the p-value calculated using the t-distribution with 13 degrees of freedom.
Referring back to equation (4.1) in the framework section, estimates in columns (1)–(3) indicate that there is no evidence for a religiosity (i.e., church attendance) effect on fertility among Protestants. Moreover, the evidence in columns (5) and (6) indicate that once we account for service provision, q, there is no evidence for a religiosity effect among Catholics either. The only effect we find on fertility is the very strong one due to service provision (i.e., about 400 children per nun). That judgment might be harsh, recalling that church attendance rates by denomination were unavailable, so that measurement error might induce some attenuation bias in estimating religiosity effects on fertility in this panel.
Having established that service provision predicts increased fertility, we now turn to attempting to establish why. We can explore that by estimating equation (6), which includes an interaction term. The pronatalist service provision effect, (θC + γCa) from equation (4.2), could be either unconditional, θC, or conditional on church attendance, γra.
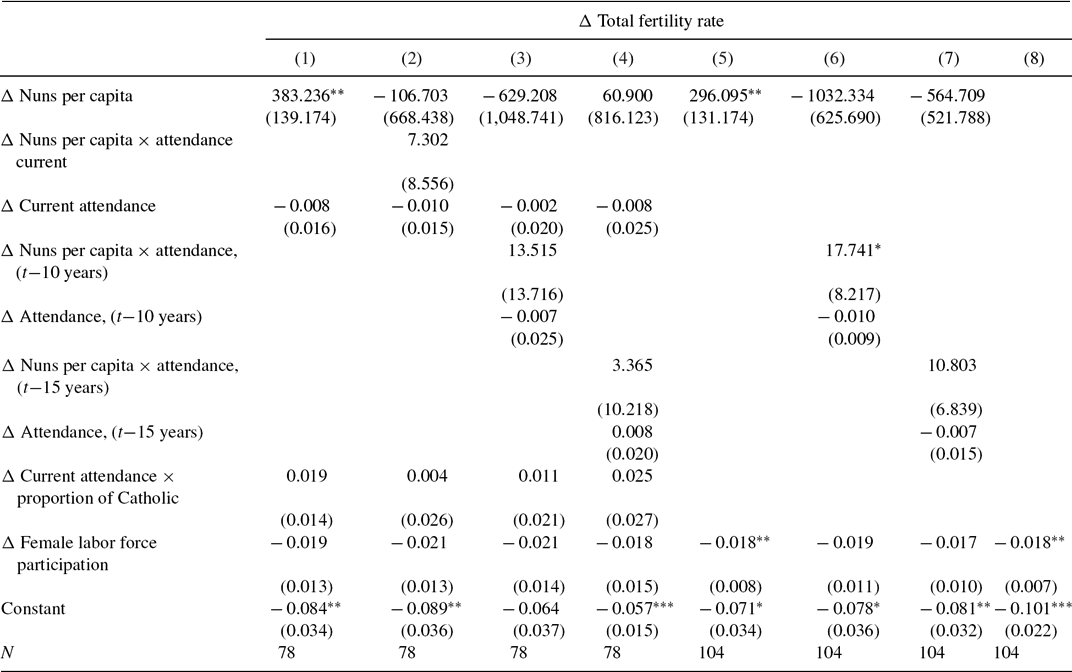
Table 4 reports on our attempts to test the conjecture of conditional service provision by estimating all the terms of equation (6), which includes as a regressor the interaction of nuns/capita with our estimate of Catholic attendance. That requires a short digression on measurement. The theory of conditional service provision provides no guidance as to when in one's life a member of a congregation signals religiosity in order to gain access to services. Is it current religiosity that matters for a mother, or perhaps religiosity signaled at the age of communion, or in between? We remain agnostic on this point and report interactions of nuns/capita with current attendance, attendance lagged 10 years, and attendance lagged 15 years. The first column repeats the specification in Table 3 for comparison (383 children per nun). Columns (2) through (4) report that we unfortunately lack sufficient precision to estimate both a service provision coefficient, θC, and an interaction, γC when using current attendance as our measure of religiosity. While the interaction terms persistently have positive signs, suggesting conditional service provision, none of the three are statistically different from zero. Moreover, including the interaction term in this specification vastly increases the standard error on the “main” effect of service provision, so that nothing can be learned.
Is service provision conditional? Fertility and attendance interacted

Notes: For variable definitions, see note to Table 2. Regressions are weighted by population. Standard errors are clustered by country and are reported in parenthesis. The calculation of standard errors is explained in the text. Stars denote significance with this convention: ***p < 0.01, **p < 0.05, *p < 0.1, where p is the p-value calculated using the t-distribution with 13 degrees of freedom.
Desperate for precision, we consider a compromise. Estimates of attendance are available only through 1990, so that dropping current attendance rates from the regression allows two more 5-year periods to be added to the estimation panel, 1990–95 and 1995–2000. If we drop the current attendance term from the regression (which was a statistical zero anyway) replacing it with a 10-year lag, then we can gain some precision in estimating the interaction coefficient. That exercise is pursued in columns (5) through (7), using the full sample of 5-year differences between 1960 and 2000 (eight differences × thirteen countries for a total of 104 observations). Column (5) reports the baseline regression for the full panel, reporting a statistically significant coefficient on nuns/capita of 296 children per nun. That estimate is a smaller than the estimates in column (1) using the shorter sample period, but not statistically different.
The next column reports coefficients on nuns per capita, attendance lagged 10 years, and the interaction of nuns/capita and lagged attendance. In this case, the interaction has a large and weakly statistically significant coefficient of 17.7. The main effect of nuns per capita is large and negative, and that of attendance is also negative, but neither is estimated with any precision. To put the interaction coefficient in context, at an attendance rate of 82% (the Catholic average in 1960), each nun would account for (82 × 17.7−1032) = 419 children, which is about the same size as that from previous estimates.
At the 15-year lag, the interaction term is statistically insignificant, at 10.8, as are the main effects (nuns and attendance).
In summary, while service provision is strongly pronatalist, the results on conditionality of service provision are ambiguous. The effects of service provision on fertility might have been conditional on attendance, as the evidence in column (6) suggests, but we simply lack sufficient precision to say for sure. In terms of Section 4.1, θr + γra > 0, but we cannot say for sure whether that is because of the unconditional effect, the conditional effect, or the combination.
Besides hypothesis testing on mechanisms, an alternative application of these results is to ask how much of the unexplained decline in European fertility a decline in Catholic service provision can account for. Column (8) of Table 4 reports on the explanatory power of female labor force participation, which is a well-established predictor of reduced fertility. The constant in that regression predicts a decline in fertility of −0.101 per 5-year period once increased labor force participation by women is accounted for, or an unexplained reduction of 0.808 lifetime children over the eight 5-year intervals between 1960 and 2000. These figures can only provide a rough estimate, as the constants in these regressions are not precisely estimated, but comparing the constant in column (5) to that in column (8) indicates that about 30% of that unexplained reduction [(0.101–0.071)/0.101], or 0.24 predicted children per woman, is accounted for by reduced service provision by the Catholic church. Given the likely attenuation bias in our estimates – due to noisy measures of the change in nuns/Catholic that predicted fertility reduction due to a decline in service provision might well be an underestimate.
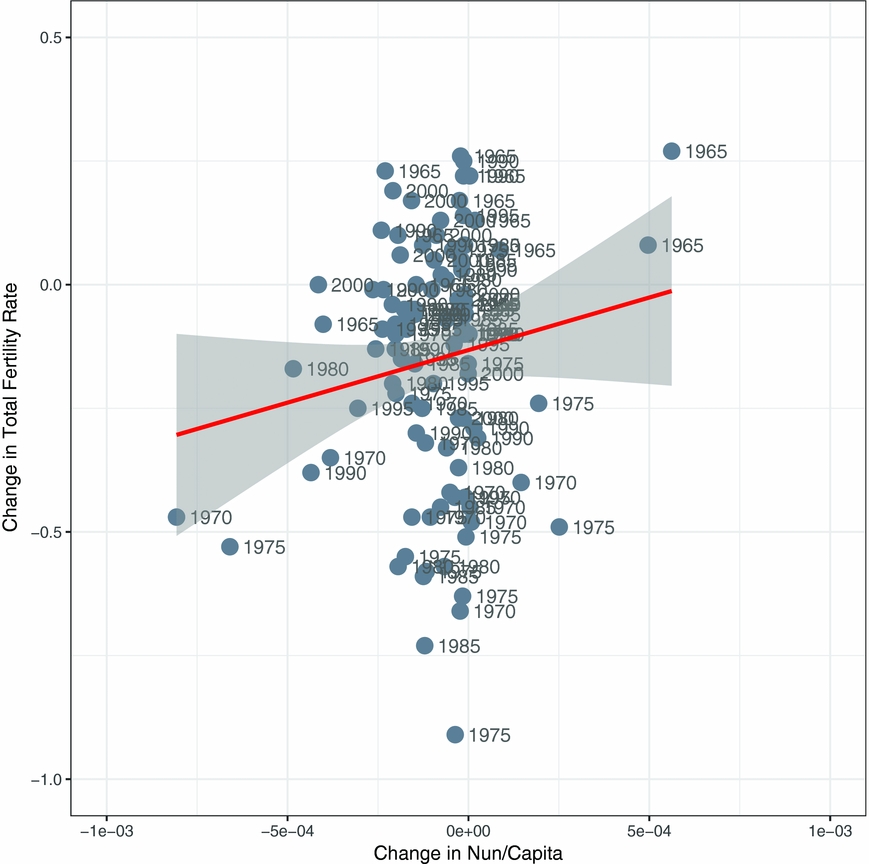
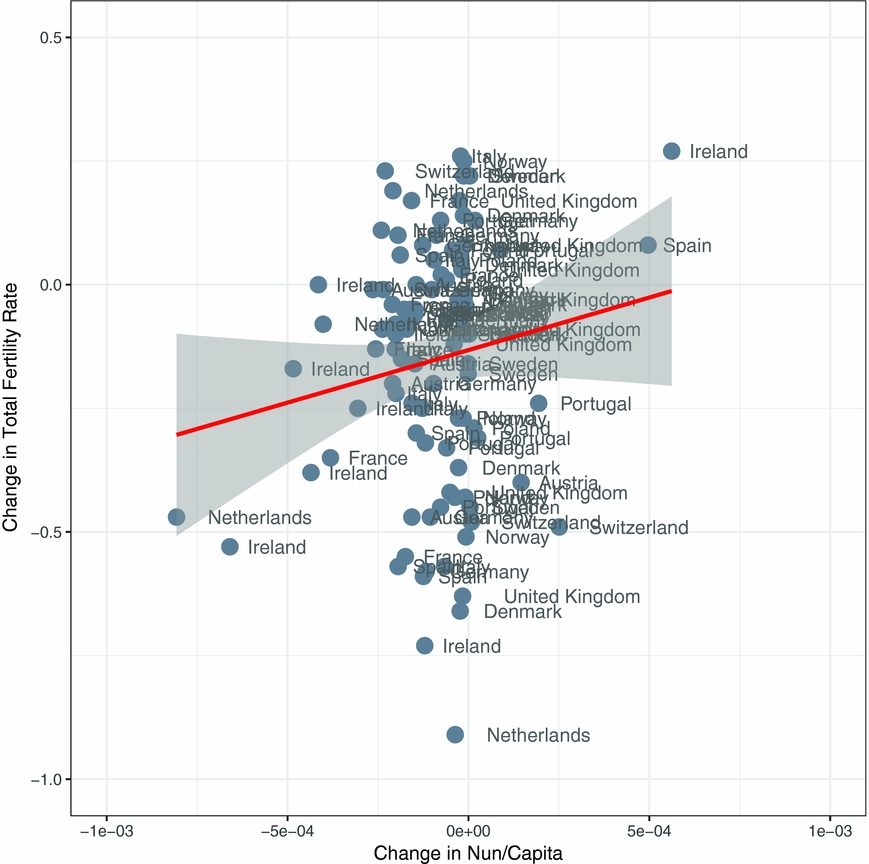
Are these results heavily influenced by particular periods or countries? As a robustness check, Figure 8 illustrates scatterplots of changes in fertility against changes in the key variable, nuns/capita interacted with lagged church attendance, with a regression line reporting the slope of the coefficient on nun/capita in Table 3, column (6). (These are “leverage” plots from the Frisch–Waugh regression). The figure labels observations by the final year of the 5-year difference, showing that the variation driving the regression is indeed that which occurred in the period immediately after the Second Vatican Council, from 1965 to 70 and from 1970 to 75. Figure 9 illustrates the same data, with the observations labeled by country, showing that while Ireland is important, Spain, Portugal, and the Netherlands also contribute to the positive coefficient. As a further check on the importance of particular countries we have rerun the regressions omitting one country each time, and found that the results are essentially the same. (The regression coefficient on nuns/capita omitting Ireland is 365 (p = 0.01)).
Change in nun/capita and change in total fertility rate, 1960–2000.

Change in nun/capita and change in total fertility rate, 1960–2000.

Finally, a key assumption in our model is that nuns proxy for social service provision rather than influencing preferences for fertility through theological influence. That assumption is difficult to test directly and we are uncomfortable assuming completely atheological nuns. An alternative way to gauge the relative importance of theology versus social services is to compare the influence on fertility of priests, as opposed to nuns. The division of labor in Catholic communities is such that a disproportionate amount of theological services are provided by priests, while most social services are provided by nuns. Attrition of priests and attrition of nuns since the Second Vatican Council is highly correlated, but not perfectly so, allowing the possibility of estimating separate coefficients for priest/capita and nuns/capita in equation (4.2).
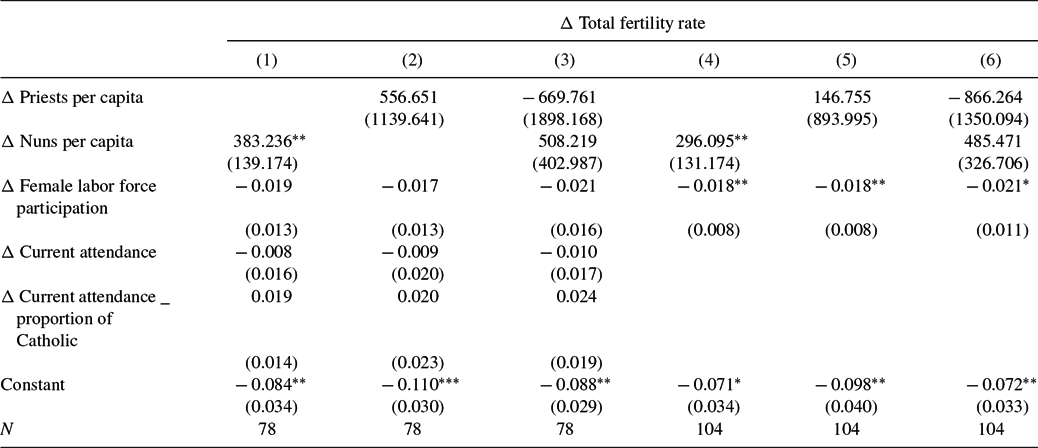
Table 5 reports the results of that exercise. Column (1) starts with the baseline specification from Table 3. Column (2) shows the same specification with priests per capita replacing nuns per capita. The coefficient is large and positive, like that for nuns, but very imprecisely estimated. The positive coefficient is not surprising as the correlation of these two variables is quite high, so priests could easily proxy for the omitted variable “nuns.” A third specification runs a “horserace,” estimating the partial regression coefficient of priests/capita with nuns/capita included in the equation. The coefficient on the nuns is large (508 children), and positive, but not statistically significant, while that on priests is negative and statistically insignificant. Columns (4) through (6) of the table repeat these specifications, but make use of the entire sample of observations through 2000 by dropping the current attendance rate variable (which is available only through 1990), as in Table 4. The results remain qualitatively the same: nuns strongly predict fertility while priests do not, though the coefficient on priests is very imprecisely estimated. These results are not conclusive but again suggest that the social service provision mechanism is more important than the theological mechanism in affecting fertility.Footnote 16
Which services affect fertility? Priests and nuns

Notes: For variable definitions, see note to Table 2. Weighted by population. Standard errors are clustered by country and are reported in parenthesis. The calculation of standard errors is explained in the text. Stars denote significance with this convention: ***p < 0.01, **p < 0.05, *p < 0.1, where p is the p-value calculated using the t-distribution with 13 degrees of freedom.
6.3. Is the Estimate Too Large?
Four hundred children per nun appears to be an unreasonably large estimate, on the face of it. We provide two possible explanations, one from the theory of fertility transitions and another from an organizational theory of religious institutions.
Consider a Becker (Reference Becker1991) style quality–quantity model, which is designed to explain rapid fertility transitions. A natural way to illustrate the logic is to augment the household budget constraint in Section 4 by adding home production, as in Gronau (Reference Gronau1977). For instance, meals could be cooked at home rather than purchased, or household maintenance could be self-provided with home work hours rather than subcontracted to hired help. Assume a home production function g(Hh) which is increasing and concave, and that work hours are now split between two home and market categories, H = Hh + Hm. This extension is solved by maximization in stages: the household first chooses how much to work at home by setting market wages equal to the marginal product of the last hour of home work, w = g'(H*h), to define the optimal budget constraint (should T > H*h, otherwise Hm = 0). In the second stage, the household optimally chooses consumption and fertility, as in Section 4.
Figure 10 illustrates the resulting budget constraint with a solid black line. It has a concave portion at the lower right, reflecting home production, and a convex portion at the upper left due to per-capitization of consumption. This budget constraint admits multiple equilibria, at both A and B on the same indifference curve U 0, since it has a range between those two points in which the marginal cost of an additional child in foregone consumption per capita (quality) decreases. Though they share the same utility level, families at A and B enjoy very different lifestyles, with the mother in A choosing low fertility and work in the market, while the mother in B chooses high fertility and work at home.
Fertility, childbearing costs, and household production.

The figure allows an illustration of Becker's approach to fertility transition. As wages increase, the budget constraint would stretch vertically to a higher intercept along the y-axis (not shown), allowing higher consumption to working mothers (at A) without consumption gains for non-working mothers (at B). As that process continues, should children not be a luxury good, at some high wage equilibrium B would be dominated as all mothers with preferences described by U 0 go to work.
Now consider the effect of increasing the time costs of childrearing, λ, for families in the midst of a fertility transition, indifferent between equilibria at A and B. The utility cost of increasing λ at B are much higher than those at A, since they apply to more children. Both families would respond by shifting to the unique optimum at C, at low fertility. The formerly high fertility family shifting from B to C would experience a sharp decline in fertility due to a very small change in the cost of raising children. Between B and C, a single nun staffing early child education, for instance, could reduce fertility by 400 children.
In summary, a society experiencing the fertility transition as modeled by Becker would have a high proportion of families close to indifferent between high and low fertility lifestyles. For those families, small changes in childrearing costs due to the removal of the subsidy that nuns provided could have triggered a sharp reduction in fertility.
An alternative explanation for the large fertility decline might come from the important role nuns played managing, as well as staffing, faith-based social service provision. These institutions typically include a permanent staff of clergy, often supervising lay employees and volunteers. The sudden loss of these experienced managers might have sharply reduced the quality of services provided by schools, health care facilities and other social service providers. We think of this as a complementary explanation, since it also operates through the time costs of childrearing, λ.
6.4. Discussion
The data clearly support the service provision mechanism of European fertility decline. Declining religiosity may play a role, though only for Catholics, and even so the evidence for a religiosity effect might alternatively be interpreted as evidence that family-friendly social services were preferentially provided to families demonstrating religiosity.
The evidence for conditional, as opposed to unconditional service provision is ambiguous. It does provide a parsimonious explanation for all the results. Referring back to the literature, a decline in Catholic service provision, preferentially provided to church attendees, is also capable of explaining the anomaly reported by Adsera (Reference Adsera2006a, Reference Adsera2006b) for Spain, where religiosity is uncorrelated with fertility, perhaps because the level of nuns/Catholic has always been relatively low. That interaction effect might also explain why Westoff and Jones (Reference Westoff and Jones1979) find that communion and fertility are positively correlated in the 1950s and 1960s for U.S. Catholics, but not in the 1970s, by which time inexpensive service provision by the Catholic church had declined in the United States [Stark and Finke (Reference Stark and Finke2000)]. Taken together, while we are fairly convinced that family-friendly Catholic services were fertility enhancing, the evidence is also suggestive that these services were preferentially provided to families of churchgoers.
7. CONCLUSIONS
We have proposed a novel solution to the Southern European fertility puzzle. The puzzle is not just the South's unprecedented and rapid transition to low fertility, but also the high fertility that went before, the continuing low labor force participation of women, and the resulting fertility deficit of nearly one half child per woman in Catholic versus Protestant countries. Our review of past research on social service provision in communal religions and our empirical results indicate that declining social service provision by the Catholic church since the Second Vatican Council induced substantial decline in fertility among European Catholics. Declining religiosity as measured by rates of church attendance does not predict fertility decline.
The data suggest that the observed Catholic fertility effect is due less to changing preferences or norms than to an institutional decline which reduced family-friendly social services available in Catholic communities. Otherwise, it is hard to explain why the withdrawal of social service provision, as measured by nuns/capita, predicts so strongly the fertility decline of European Catholics. That interpretation is consistent with the literature linking low fertility to the lack of family-friendly institutions for the children of working mothers in contemporary Italy and other Southern European countries [Del Boca (Reference Del Boca2002) and Del Boca et al. (Reference Del Boca, Pasqua and Pronzato2003)]. It may be that receding church services left a vacuum in family-friendly social service provision long since filled by government in northern European countries.
Further support for this interpretation comes from Chou's (Reference Chou2011) study of second-generation immigrants in the United States. Those from Catholic majority countries in Europe experienced a fertility decline well predicted by declining fertility in their parents’ country of origin. This trans-Atlantic correlation exists even though the fertility decline in Europe occurred after their mothers’ emigration, which would be consistent with withdrawal of subsidized family-friendly services in the form of nuns from a Catholic family's country of origin.
Understanding how social service provision affects fertility may be critical to understanding fertility trends among European Catholics and to projecting European demographics over the next generation. Moreover, the implications extend beyond the half-billion residents of Europe or even the billion Catholics worldwide. The populations and leaders of less developed countries look to Europe and wonder whether prosperity and greatly increased female labor market participation inevitably imply graying populations and demographic decline. These inferences may not be warranted if, as we find, rapid fertility decline in Catholic Europe is not so much due to economic development, female labor force participation, or even secularization, as it is due to the loss of church-based family-friendly social services.
The finding that costs of childrearing rather than theology or norms matter most has potentially important public policy implications. Religious groups may strongly support social service provision in some times and places, but very different institutional arrangements may be required to support their continued provision as clergy withdraw from volunteer service. Our conclusions might more generally be important for any society facing rapid economic and social change, and especially for societies in which women are increasingly torn between labor market opportunities and the high shadow cost those impose on child care. That tension may be much greater the less support is available from religious communities, other social networks, markets, or governments.
APPENDIX
Fertility, church attendance, and nuns

Fertility, church attendance, and nuns