1. Introduction
Categorical perception of speech sounds is believed to emerge early in life (Eimas, Siqueland, Juscyk & Vigorito, Reference Eimas, Siqueland, Juscyk and Vigorito1971), and is further modified through the acquisition of one's first language (Kuhl, Reference Kuhl1997). What remains largely unknown is whether native-like categorical perception of L2 speech sounds can be acquired in adulthood. Behavioral studies have shown that effective training in adulthood, after the purported offset of the critical period for language acquisition, can lead to improvements in non-native speech sound perception (e.g., Maye, Werker & Gerken, Reference Maye, Werker and Gerken2002; Wang & Kuhl, Reference Wang and Kuhl2003; Zhao & Kuhl, Reference Zhao and Kuhl2015); however, the extent to which these modifications affect auditory neural processes is not known. Whether observed behavioral improvements in non-native speech sound perception result from modification of internal phonetic categorical representations, or from an overall heightened sensitivity to L2 sounds, remains an open question.
The learning of lexical tones in tone languages is known to be difficult for second language (L2) learners, particularly for adult learners whose L1 is not a tone language. Still, little is known regarding the psychophysiological nature of lexical tone processing and the cause of difficulty for L2 learners. Several behavioral studies on categorization of lexical tones have shown that Mandarin tones are perceived categorically by native speakers of Chinese, but not by speakers of non-tonal languages who have little or no experience with Chinese (Francis, Ciocca & Ng, Reference Francis, Ciocca and Ng2003; Hallé, Chang & Best, Reference Hallé, Chang and Best2004; Peng, Zheng, Gong, Yang, Kong & Wang, Reference Peng, Zheng, Gong, Yang, Kong and Wang2010; Xu, Gandour & Francis, Reference Xu, Gandour and Francis2006). The question arises whether the learning of tonal languages can alter the perceptual boundaries of tones, and thus enable L2 learners to carry out native-like categorical perception of lexical tones. In an earlier behavioral study of categorical perception of lexical tones by English learners of Mandarin, we reported that advanced learners of Mandarin showed the ability to categorize tones similarly to native Mandarin speakers in identification and discrimination tasks (Shen & Froud, Reference Shen and Froud2016). To understand whether L2 learners’ behavioral performance on these tasks was supported by native-like categorical encoding, and whether L2 speech sounds are perceived with native-like automatic efficiency, it was necessary to examine the neurophysiological basis of lexical tone categorization.
The mismatch negativity (MMN) is a well-studied fronto-central cortical event-related potential (ERP) associated with automatic involuntary sound processing (Näätänen, Jacobsen & Winkler, Reference Näätänen, Jacobsen and Winkler2005; Pincze, Lakatos, Rajkai, Ulbert & Karmos, Reference Pincze, Lakatos, Rajkai, Ulbert and Karmos2001). The MMN, which is commonly elicited in response to deviant stimuli in an auditory train (referred to as an “oddball paradigm”), reflects the neural activity associated with change detection mechanisms in the auditory system, and eliciting this component does not require listeners’ conscious attention (e.g., Näätänen, Reference Näätänen2001). The amplitude of the MMN increases as the perceived saliency of the acoustic discrepancy between standard and deviant stimuli increases (Chandrasekaran, Krishnan & Gandour, Reference Chandrasekaran, Krishnan and Gandour2009; Näätänen & Alho, Reference Näätänen and Alho1997). This characteristic of the MMN means that it can be used to evaluate the electrophysiological correlates of categorical perception. For example, in a cross-language speech perception study, Dehaene-Lambertz (Reference Dehaene-Lambertz1997) showed that a large MMN was elicited by native cross-category deviants, but not by non-native or within-category deviants. Later studies reported similar findings, showing that larger MMN amplitudes for cross-category deviants compared to within-category deviants are good indicators of categorical perception of phonemes (Kasai, Yamada, Kamio, Nakagome, Iwanami, Fukuda, Itoh, Koshida, Yumoto, Iramina, Kato &,Ueno, Reference Kasai, Yamada, Kamio, Nakagome, Iwanami, Fukuda, Itoh, Koshida, Yumoto, Iramina, Kato and Ueno2001; Kazanina, Phillips & Idsardi, Reference Kazanina, Phillips and Idsardi2006; Sharma & Dorman, Reference Sharma and Dorman1999; Winkler, Lehtokoski, Alku, Vainio, Czigler, Csépe, Aaltonen, Raimo, Alho, Lang, Iivonen & Näätänen, Reference Winkler, Lehtokoski, Alku, Vainio, Czigler, Csépe, Aaltonen, Raimo, Alho, Lang, Iivonen and Näätänen1999), as well as Mandarin tones (Xi, Zhang, Shu, Zhang & Li, Reference Xi, Zhang, Shu, Zhang and Li2010; Zheng, Reference Zheng2010). Findings from these ERP studies of speech perception suggested that categorization of one's native speech sounds, including both phonemes and lexical tones, can be realized without listeners’ conscious awareness, and thus should be an automatic and effortless process. One of the aims of the present study is to explore whether L2 learners of Mandarin Chinese can establish native-like categorical perception of the lexical tones at a pre-attentive and automatic level of processing.
The P300 is another well-studied ERP component – a positive voltage shift that is observed over centro-parietal regions around 300–800ms after the onset of auditory deviance (e.g., Polich, Reference Polich2007; Toscano, McMurray, Dennhardt & Luck, Reference Toscano, McMurray, Dennhardt and Luck2010). P300 is usually elicited by the same oddball paradigm as the MMN, but unlike MMN (which reflects automatic, preconscious change detection), P300 corresponds with attentional detection of auditory deviance based on context updating and memory storage. P300 amplitude is believed to be associated with levels of confidence and arousal, attention allocation, and ease of discrimination. It has often been used as an index for phonological discrimination (Polich, Reference Polich2007) and categorical perception of phonemes (Maiste, Wiens, Hunt, Scherg & Picton, Reference Maiste, Wiens, Hunt, Scherg and Picton1995). The combination of MMN and P300 was adopted in the current study to examine two different stages of categorical perception of lexical tones (Tone 1/Tone 4, Tone2/Tone3) by native Mandarin speakers: an early, automatic stage (indexed by MMN) and a later stage that is modulated by attention (indexed by P300).
A second aim of the current study is to explore the neural mechanisms of lexical tone categorization. Competing hypotheses have been proposed to account for the lateralization of pitch processing. The acoustic hypothesis (Zatorre & Belin, Reference Zatorre and Belin2001) claims that laterality of auditory processing depends on acoustic cues, and fundamental frequencies as cues are lateralized to the right hemisphere. Since lexical tones rely on pitches as the primary cue, this hypothesis is supported by several brain-imaging studies that found right-lateralization of brain activations to be associated with tone processing (e.g., Hsiao, Wu, Ho & Lin, Reference Hsiao, Wu, Ho and Lin2009; Jia, Tsang, Huang & Chen, Reference Jia, Tsang, Huang and Chen2013; Li, Gandour, Talavage, Wong, Hoffa, Lowe & Dzemidzic, Reference Li, Gandour, Talavage, Wong, Hoffa, Lowe and Dzemidzic2010; Luo, Ni, Li, Li, Zhang, Zeng & Chen, Reference Luo, Ni, Li, Li, Zhang, Zeng and Chen2006; Ren, Yang & Li, Reference Ren, Yang and Li2009;). In contrast, the functional hypothesis (Van Lancker, Reference van Lancker1980) claims that lateralization depends on the psycholinguistic functions of the acoustic signals, and that brain responses to pitch patterns carrying linguistic functions are lateralized to the left hemisphere while non-linguistic pitch information is preferentially processed in the right hemisphere. This hypothesis has also found empirical support from studies that reported left lateralization of lexical tone processing (Gandour, Wong, Hsieh, Weinzapfel, Van Lancker & Hutchins, Reference Gandour, Wong, Hsieh, Weinzapfel, Van Lancker and Hutchins2000; Gandour, Tong, Wong, Talavage, Dzemidzic, Xu, Li & Lowe, Reference Gandour, Tong, Wong, Talavage, Dzemidzic, Xu, Li and Lowe2004; Hsieh, Gandour, Wong & Hutchins, Reference Hsieh, Gandour, Wong and Hutchins2001; Wang, Jongman & Sereno, Reference Wang, Jongman and Sereno2001; Wong, Parsons, Martinez & Diehl, Reference Wong, Parsons, Martinez and Diehl2004).
The use of different tasks and stimuli might account for some of these apparently contradictory findings. First of all, different tone contrasts have different categorical effects and thus may activate different phonological processes. For example, level tone contrasts are perceived less categorically than contour tones (Francis et al., Reference Francis, Ciocca and Ng2003). Additionally, the aforementioned imaging studies used different tasks with different levels of difficulty; therefore, these imaging results may reflect the engagement of distinct levels of processing and different time courses of associated cognitive operations. To reconcile these competing hypotheses and various empirical findings, a more comprehensive model is needed to elucidate how tone processing decomposes into different stages, and to determine the basic components in the time course of auditory processing of lexical tones. By measuring MMN and P300 responses in a passive listening task and an active discrimination task, we can examine the lateralization of categorical perception at two separate levels of processing, and thus begin to elucidate the neural mechanisms of lexical tone perception.
Hence, the current study adopts double oddball paradigms, using cross- and within-category contrasts with equal acoustic deviance, to investigate two questions: 1) Can experienced adult English learners of Mandarin Chinese perceive lexical tones in a native-like categorical manner at both an early automatic stage and a later, attentionally modulated, stage of speech processing; and 2) is brain activation associated with categorical perception of lexical tones lateralized to the right hemisphere, as predicted by the acoustic hypothesis, or with predominantly left hemisphere activations, as per the functional hypothesis?
The choice of tonal contrasts Tone 1/Tone 4 (T1/T4) and Tone 2/Tone 3 (T2/T3) is crucial to this approach. The main perceptual cues for lexical tone perception include pitch height, duration, and pitch contour (slope and turning point). Previous studies have consistently reported that native Mandarin listeners are more sensitive to pitch contour, while English listeners are more sensitive to pitch height (Jongman, Qin, Zhang & Sereno, Reference Jongman, Qin, Zhang and Sereno2017; Broselow, Hurtig & Ringen, Reference Broselow, Hurtig and Ringen1987; Kaan, Barkley, Bao & Wayland, Reference Kaan, Barkley, Bao and Wayland2008; White, Reference White1981). With respect to the T1/T4 contrast, because T1 and T4 are both high pitch tones, the distinction between them presents difficulties for English speakers who rely heavily on F0 heights as acoustic cues. For the other tonal comparison, T2 has a slightly earlier turning point and shorter duration than T3 (Jongman, Wang, Moore & Sereno, Reference Jongman, Wang, Moore, Sereno, Li, Tan, Bates and Tzeng2006; Moore & Jongman, Reference Moore and Jongman1997). However, because T2 and T3 share similar pitch contours, and have the longest duration of all four tones, they represent the most difficult contrast for both native and nonnative speakers to discriminate (Chandrasekaran, Krishnan & Gandour, Reference Chandrasekaran, Krishnan and Gandour2007; Gandour, Reference Gandour1994; Hao, Reference Hao2012; Shen, Lin & Yan, Reference Shen, Lin and Yan1993). Comparisons between MMN/P300 responses elicited by cross-category and within-category oddball pairs with equal acoustic deviances can provide fresh insights into phonological representations and automaticity in lexical tone categorization by listeners with different language backgrounds, and help elucidate the source of some difficulties encountered by those learning a tonal language in adulthood.
2. Methods
2.1 Participants
A total of 32 participants (age range 19–30 years) were recruited from the student body at Columbia University, and all study procedures were carried out with approval of the Institutional Review Board at Teachers College, Columbia University. Two participants’ data were excluded because of insufficient number of artifact-free trials. The final analysis included data from thirty participants in the following three groups: (1) native American English speakers with no previous exposure to Chinese (n = 10), (2) advanced L2 learners of Mandarin Chinese (n = 10), and (3) native Mandarin Chinese speakers (n = 10). None of the participants had any professional music training experience. The learners of Mandarin Chinese were recruited from the Chinese program at Columbia University. The inclusion criteria for the advanced learners were as follows: 1) all participants had taken Chinese for at least three semesters (5 credits each semester); 2) all started learning Mandarin Chinese after the age of 17; and 3) all speak English as a first language. The Chinese speaker group consisted of US-based native Mandarin Chinese speakers who moved to the U.S. from Mainland China within less than 4 years after the age of 22. The native English speakers were recruited from Teachers College, and had no experience of learning Chinese or any other tonal languages. All participants were recruited from the same institutes with the same recruitment criteria as the behavioral study we conducted a year earlier (Shen & Froud, Reference Shen and Froud2016); however, only four of the 2016 study participants took part. All others were newly recruited for this study.
2.2 Stimuli
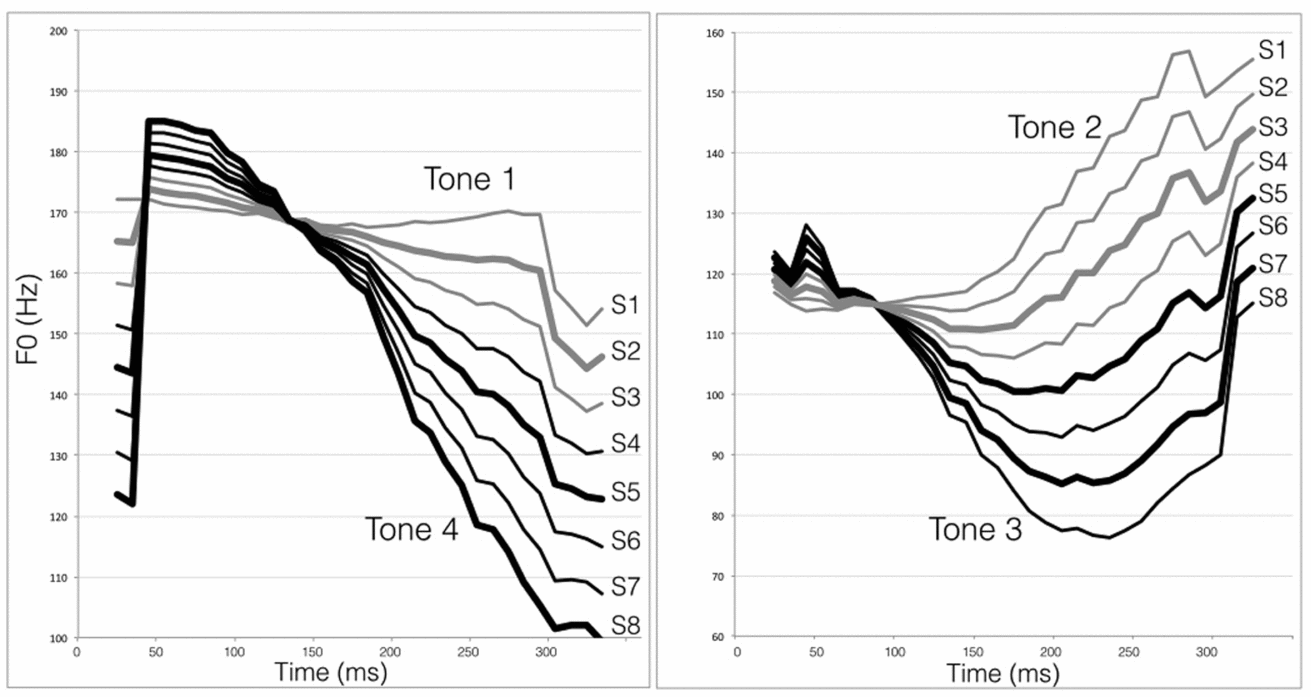
Two tonal continua were generated, one between Mandarin tones 1/4, and the other one between tones 2/3. Speech sound stimuli were recorded by a male native speaker of Mandarin Chinese pronouncing the target syllable /i/ in four different tones. All of the four tones over the syllable /i/ were real words with differing semantics in Mandarin: “clothes衣” with the level tone (T1), “aunt姨” with the rising tone (T2), “chair椅” with the dipping tone (T3), and “meaning意” with the following tone (T4). Each continuum contained 8 steps with equal distances created through interpolation by applying the pitch synchronous overlap and add (PSOLA) method (Moulines & Laroche, Reference Moulines and Laroche1995). All stimuli were tested in an earlier behavioral study (Shen & Froud, Reference Shen and Froud2016) to locate perceptual boundaries. For the Tone1/Tone4 (T1/T4) continuum, a discrimination peak was identified between step 2 and 5; therefore, step 2 / step 5 was selected as the cross-category pair, and step 5 / step 8 was selected as the within-category pair for the oddball paradigm. For the Tone2/Tone3 (T2/T3) continuum, a discrimination peak was located between steps 4 and 5. Thus the cross-category pair was set to step 3 / step 5, and the within-category pair was step 5 / step 7. For both tone continua, step 5 was used as the standard sound in the oddball paradigm; the other two sounds were employed as the cross-category and within-category deviants (Figure 1). The F0 difference between the deviants and the standards was 10 Hz. All sounds were scaled to 350ms duration with 60dB intensity. Manipulations of the tones and contours were carried out in Praat software (Boersma & Weenink, Reference Boersma and Weenink2009).
F0 contours of T1/T4 and T2/T3 continua. Gray lines indicate tone steps that were identified as tone 1 (left) and tone 2 (right). Black lines indicate tone steps that were identified as tone 4 (left) and tone 2 (right). Bold lines are tone steps that were used in the oddball pairs. For the T1/T4 continuum, step 5 (S5) was the standard sound, step 2 (S2) was the cross-category deviant, and step 8 (S8) was the within-category deviant. For the T2/T3 continuum, step 5 (S5) was the standard sound, step 3 (S3) was the cross-category deviant, and step 7 (S7) was the within-category deviant.

2.3 Procedure
Participants were seated in a chair in a sound-attenuated and electrically shielded room, in front of a computer monitor that delivered task instructions. During two listening tasks (detailed below), EEG was continuously recorded using 128-electrode high-density HydroCel EEG nets manufactured by Electrical Geodesics, Inc. Impedance for all electrodes was maintained under 40kΩ, with most electrodes maintained below 20kΩ. EEG data were recorded using EGI's Netstation (v4.5.4) data acquisition software at a sample rate of 500Hz. Auditory stimuli were presented at 65dB in free field from a Tannoy OCV 6 full bandwidth pendant speaker suspended 27 cm directly above the participant.
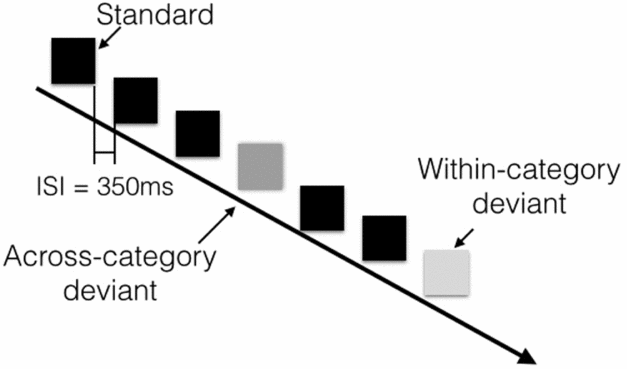
The EEG recordings for this study consisted of two parts: a passive MMN session and an attentional P300 session. For the MMN session, T1/T4 contrasts and T2/T3 contrasts were presented in two separate blocks. Each block comprised 1000 trials, including 80% standards, 10% within-category deviants and 10% cross-category deviants (Figure 2). A total of 1000 stimuli for each block were presented with an inter-stimulus interval of 350ms in a pseudo-random order that ensured at least two standards preceded each deviant. Participants were instructed to ignore the stimuli coming through the overhead speaker while they relaxed and watched a self-selected silent movie. Each of the two blocks lasted for 16 minutes.
Schematic diagram for typical trials in the oddball paradigm.

For the P300 experiment, participants were presented with the same sounds, but they were asked to pay close attention to the sounds and to press a button every time they heard a sound that was “different” from the others (deviant identification task). There were 400 trials in each of two blocks that consisted of stimuli in T1/T4 and T2/T3 continua, with 80% standard sounds, 10% within-category deviants and 10% cross-category deviants. The inter-stimulus interval was 800ms. Each of the two blocks lasted for 8 minutes.
2.4 Data analysis
The first part of the data processing was carried out using NetStation software (V4.5.4, Electrical Geodesics, Inc.). Raw data were first digitally filtered with a 0.1-30Hz bandpass filter, and then segmented from 100ms pre- stimulus onset to 650ms post stimulus onset for the MMN experiment, and 100ms pre-stimulus onset to 1000ms post-stimulus onset for the P300 experiment. Data were then re-referenced to the average of all electrodes, and baseline corrected relative to a 100ms pre-stimulus baseline. Recorded trials containing movement artifacts, eye blinks or other artifacts were rejected. Only participants with at least 65 acceptable trials per condition for the MMN study, and 30 acceptable trials per condition for the P300 study, were included in the analyses (in the latter analysis, artifact-free error trials and correct trials were all included, as the inter-stimulus interval was too short to determine behavioral accuracy on the task). Two participants’ data (a native English speaker and a native Chinese speaker) were excluded because of an insufficient number of artifact-free trials.
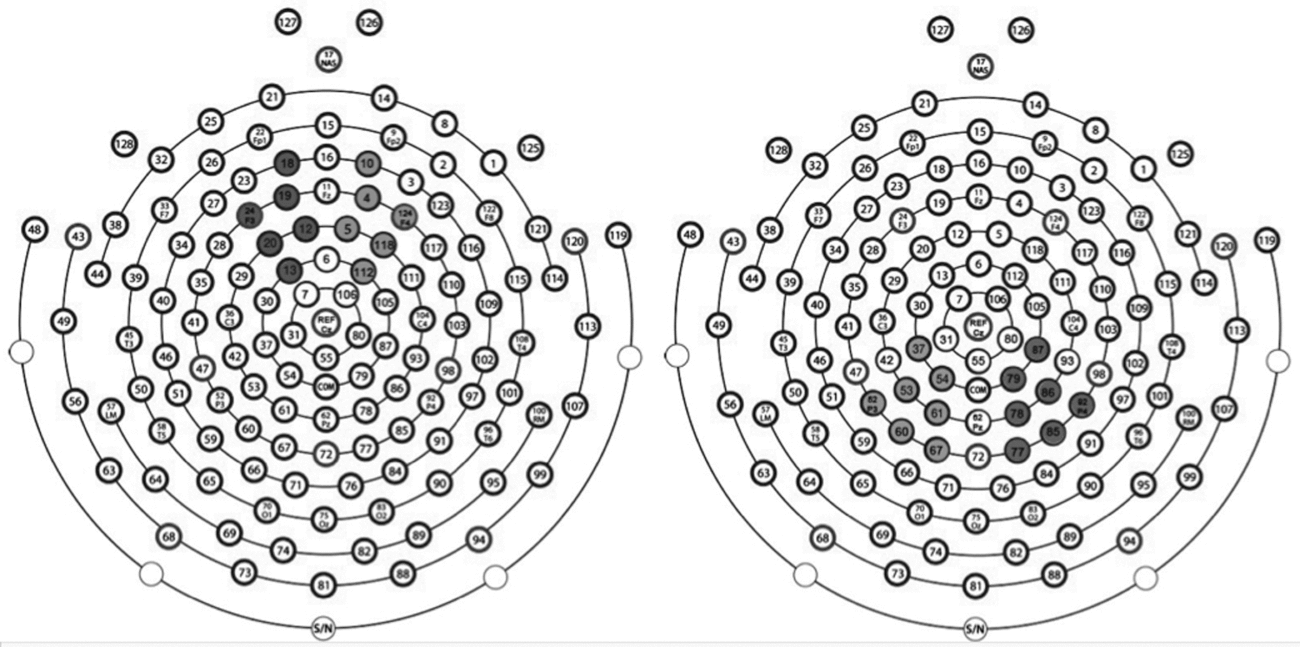
For this study, the EEG data were analyzed according to a pre-established region of interest (Fig. 3) for each ERP component. The auditory MMN is commonly observed over fronto-central electrodes (e.g., Xi et al., Reference Xi, Zhang, Shu, Zhang and Li2010; Kaan et al., Reference Kaan, Barkley, Bao and Wayland2008); and the P300 is usually seen over centro-parietal electrodes (e.g., Zhang et al., 2012; Polich, Reference Polich2007). Hence, for the MMN, two groups of electrodes (electrode montages) were selected for statistical analysis: left frontal (electrodes 12, 13, 18, 19, 20, 24) and right frontal (electrodes 4, 5, 10, 112, 112, 118). First, difference waves for the MMN were obtained by subtracting the averaged deviants from the averaged standards. The calculation of mean amplitude was conducted with a moving window technique on the difference wave. Negative peaks were initially identified between 150~250ms post deviance onset for each participant. Then, the value of a time window extending 30ms before and after the negative peak was averaged to obtain the mean amplitude over the entire duration of the MMN response.
MMN and P300 montages. Left: MMN montage, left and right frontal central electrodes. Right: P300 montage, left and right central-parietal electrodes.

For the P300 study, two electrode montages were selected for statistical analysis: left central-parietal (electrodes 37, 52, 53, 54, 60, 61, 67) and right central-parietal (electrodes 77, 78, 79, 85, 86, 87, 92). Similarly to the MMN analyses, mean amplitudes were also calculated through the moving window technique applied to the difference wave: the positive peaks were identified between 250–600ms post deviance onset for each participant, and then amplitudes within a time window extending ±40ms from the P300 peak were averaged.
For the statistical analysis, firstly, the significance of differences between ERP responses across conditions was assessed using pairwise t-tests to compare between the responses to each standard and deviant. Then, three-way repeated-measures ANOVAs on mean amplitudes (measured in microvolts) of the predetermined components of interest (MMN and P300) were conducted to analyze the effect of two within-subject variables: deviant type (cross-category vs. within-category) and hemisphere (left vs. right); and one between-subjects variable: group (Chinese speakers vs. English speakers vs. learners of Chinese).
Greenhouse-Geisser corrections were applied where sphericity criteria were not met, and to reduce the possibility of type I error. All analyses were conducted with alpha level of 0.05.
3. Results
3.1 MMN Experiments
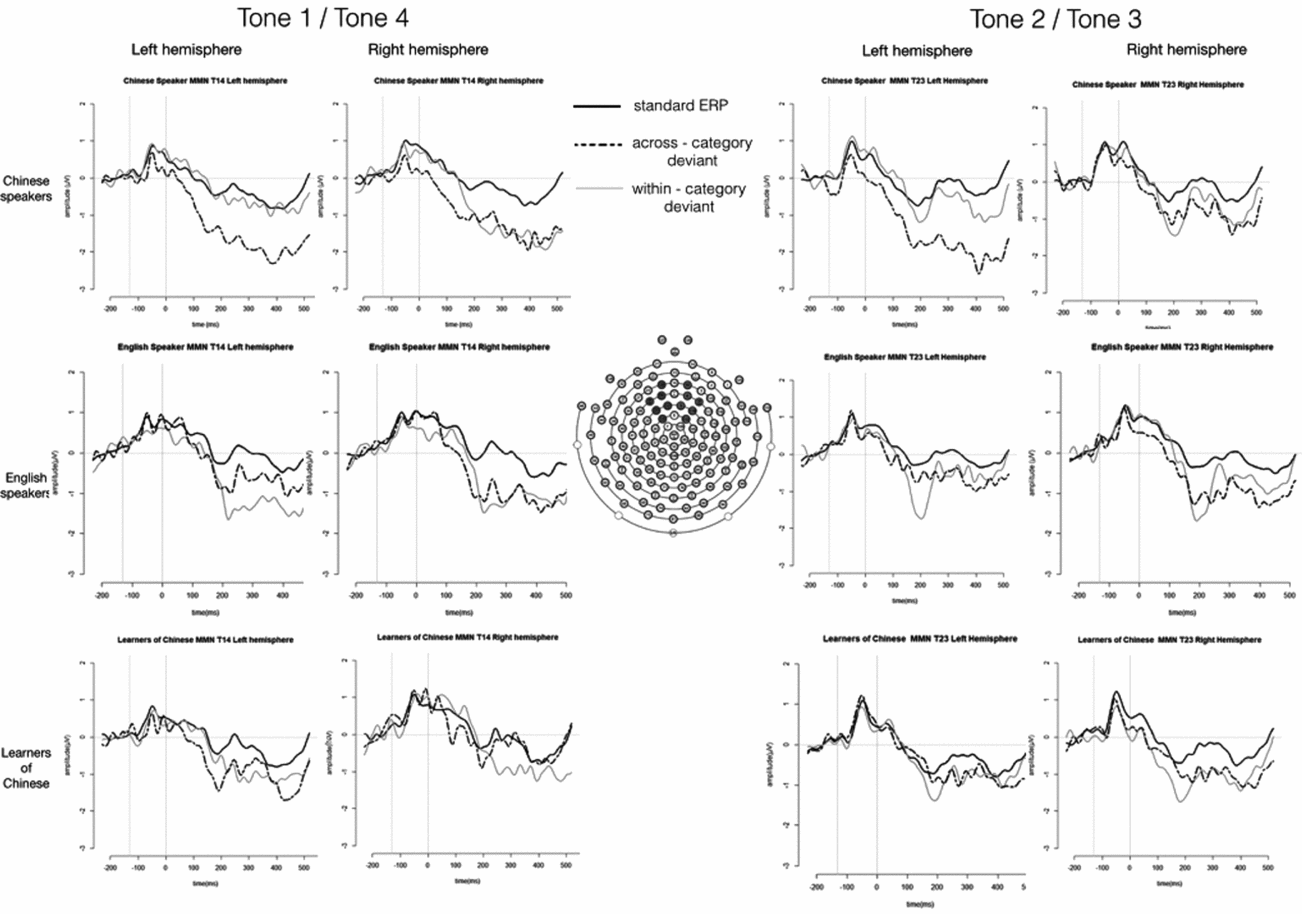
For the MMN study, the grand average waveforms are illustrated in Fig. 4. For the T1/T4 experiment, pairwise t-tests on each deviant and standard revealed significant MMN responses for all groups and both deviant types (deviant < standard, p < 0.05). For the T2/T3 experiment, Native English speakers and learners of Chinese showed significant MMN responses to both deviant types over both left and right hemispheres (deviant < standard, p < 0.05). For native Chinese speakers, the cross-category deviant elicited a significant MMN response over both hemispheres (left t (10) = −6.600, p < 0.001; right: t (10) = −3.864, p = 0.003), while the within-category deviant MMN was only significant over the right hemisphere (left: t (10) = −1.09, p = 0.299, right t (10) = −2.387, p = 0.038).
Native Chinese speakers’ (top charts), native English speakers’ (middle charts) and learners’ (bottom charts) ERP responses during the pre-attentional task in the T1/T4 experiment (left panel) and T2/T3 experiment (right panel). Within each panel, the left column shows waveforms obtained from left hemisphere recording sites, and the right column shows responses over right hemisphere recording sites.

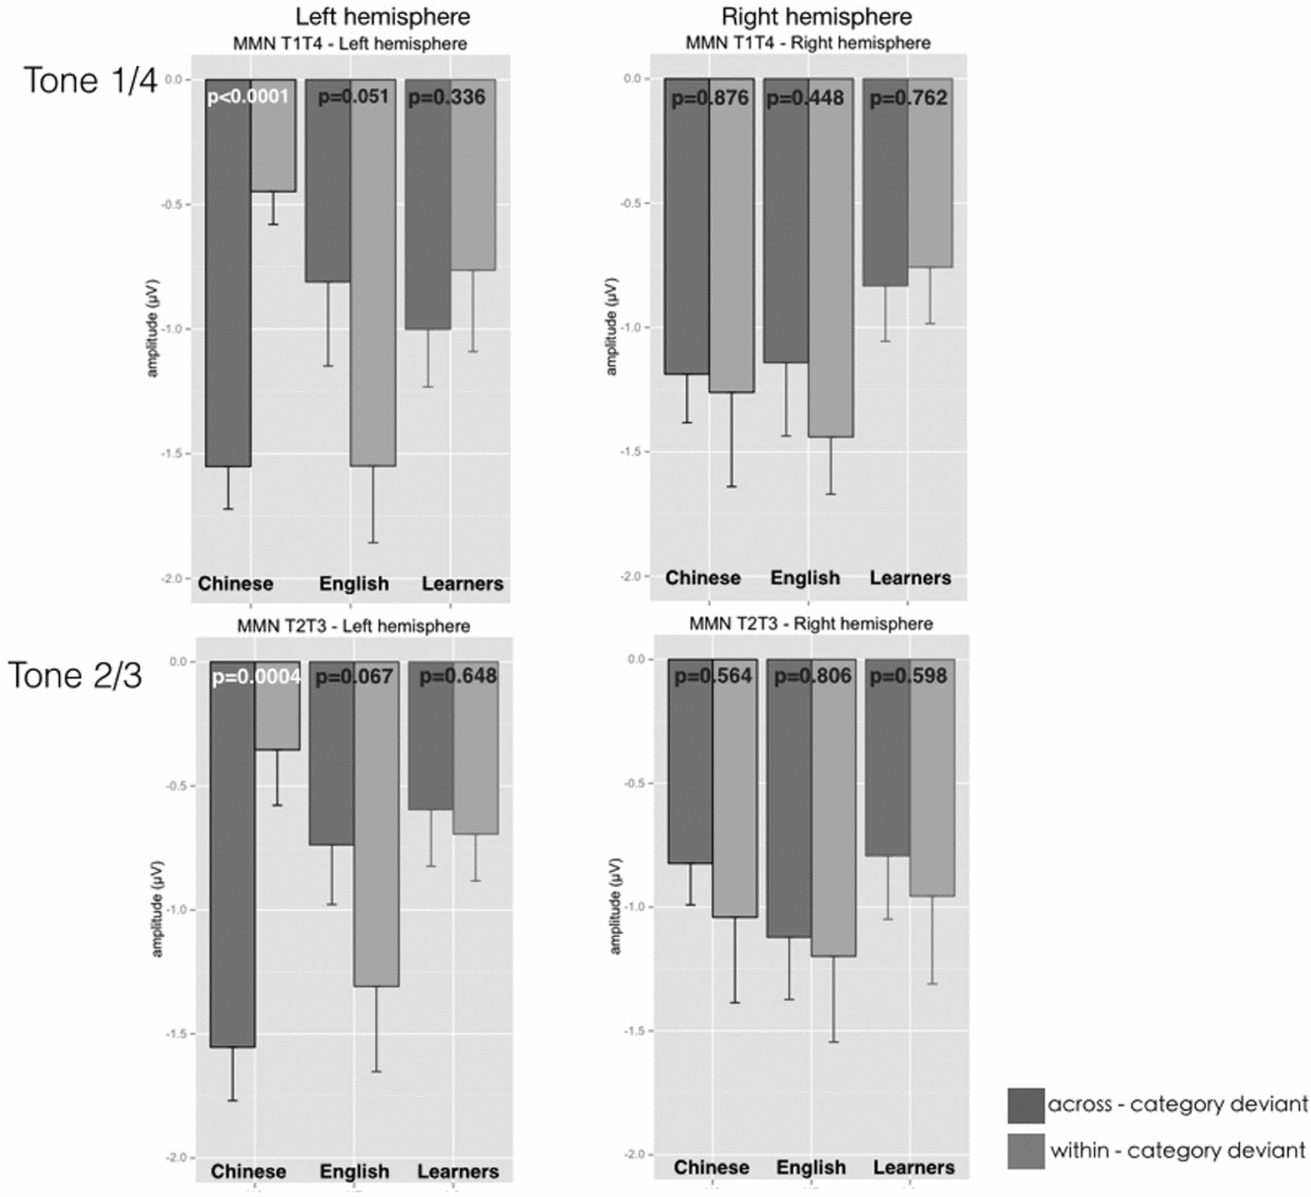
The mean amplitudes of the MMN responses elicited by the two deviants are shown in Fig. 5. The results for T1/T4 experiment and T2/T3 experiments revealed a similar pattern. A three-way mixed-model ANOVA showed no significant main effect of hemisphere, group or deviant type for either experiment. A significant interaction between deviant type and group (T1/T4: F (2, 29) = 4.123, p = 0.026, η 2 = 0.065; T2/T3: F (2, 29) = 3.562, p = 0.041, η 2 = 0.042) was observed, as well as a three-way interaction between deviant type, group and hemisphere (T1/T4: F (2, 29) = 4.884, p = 0.015, η 2 = 0.04; T2/T3: F (2, 29) = 8.583, p = 0.001, η 2 = 0.055). Post-hoc analyses using pairwise t-tests showed that the differences between deviant types (cross- and within-category deviants) were only significant for Chinese speakers over left hemisphere sensors (T1/T4: t (10) = 6.581, p < 0.001; T2/T3: t (10) = 5.207, p < 0.001), indicating that the native Chinese speakers’ MMN responses were significantly enhanced to the cross-category deviant compared to the within-category deviants, over left hemisphere recording sites. No significant differences between deviant types were observed for English speakers and learners of Mandarin, though an effect of deviant type was observed to approach significance for English speakers over left hemisphere sensors with the opposite pattern from Chinese speakers, with larger MMN amplitudes associated with the within-category deviants (t (10) = 2.212, p = 0.051).
MMN mean amplitudes (in µV) in the T1/T4 experiment (upper panels) and T2/T3 experiment (lower panels). The left column shows the amplitude recorded over left hemisphere sensors, and the right column shows recorded amplitudes from right hemisphere electrodes. Within each plot, the bars on the left represent data from native Chinese speakers; the bars in the middle represent data from native English speakers; and the bars on the right represent data from learners of Chinese. The error bars represent standard error of the mean for each condition and group. The numbers inside the bars are p-values of pair-wise t-tests between across- and within-category responses within each group.

3.2 P300 experiments
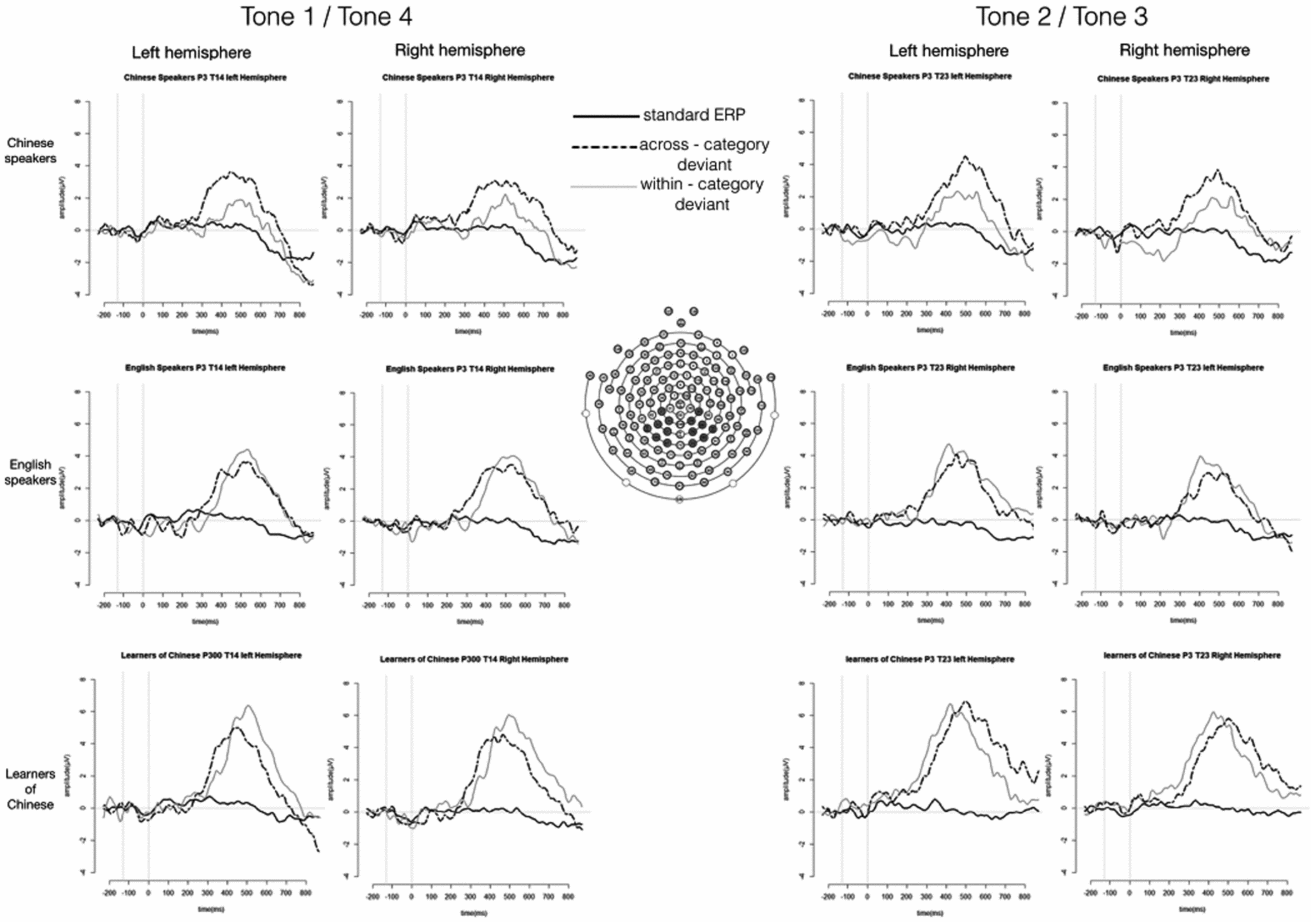
For both T1/T4 and T2/T3 contrasts, all three groups demonstrated robust P300 responses to both types of deviants over both left and right hemisphere recording sites (deviant > standard, p < 0.05) (see Fig. 6).
Native Chinese speakers’ (top charts), native English speakers’ (middle charts) and learners’ (bottom charts) responses during the attentional P300 task in the T1/T4 condition (left panel) and T2/T3 condition (right panel). Within each panel, the left column shows waveforms obtained over left hemisphere recording sites, and the right column shows responses recorded over right hemisphere recording sites.

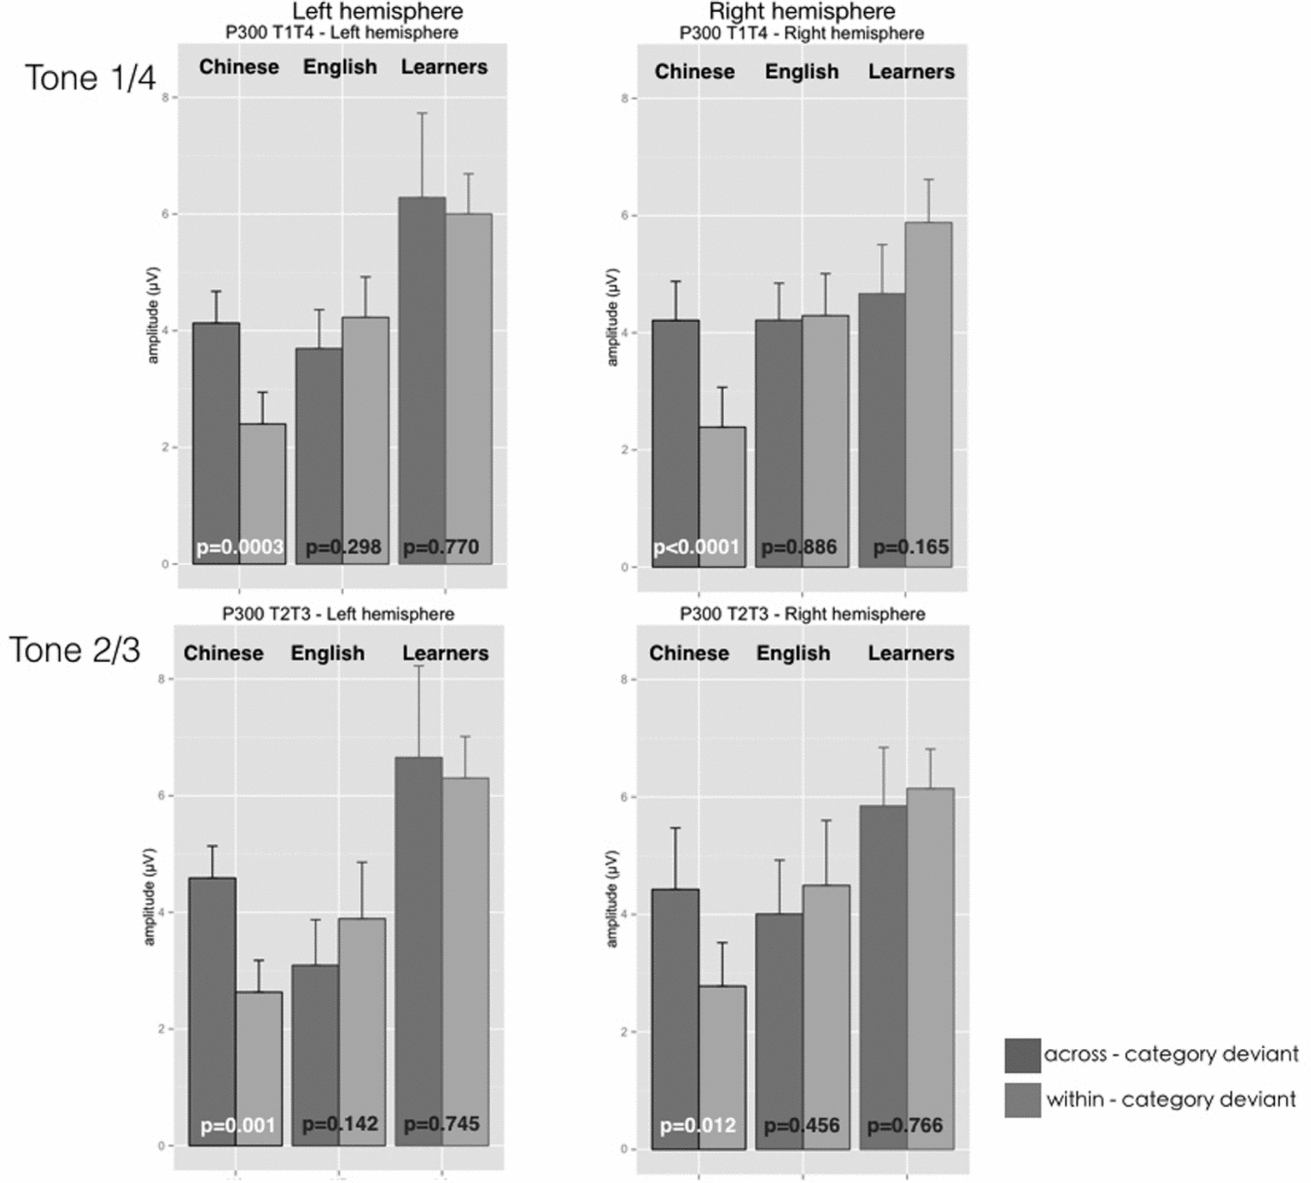
The mean amplitude of the P300 responses is illustrated in Fig. 7, below. A three-way repeated-measures ANOVA with factors group (Chinese native speakers, learners of Chinese, and English monolinguals), deviant type (cross-category and within-category) and hemisphere (left and right) showed a significant main effect of group (T1/T4: F (2, 27) = 3.641, p = 0.039, η 2 = 0.159; T2/T3: F (2, 27) = 3.419, p = 0.044, η 2 = 0.154). Tukey's post-hoc analysis revealed that the amplitudes of the P300 responses obtained from learners of Chinese were significantly greater than native Chinese speakers and English speakers (T1/T4: learners > Chinese, p < 0.001, learners > English, p = 0.013; T2/T3: learners > Chinese, p < 0.001, learners > English, p = 0.002). There was also a significant interaction between deviant type and group (T1/T4: F (2, 27) = 10.30, p < 0.001, η 2 = 0.046; T2/T3: F (2, 27) = 3.667, p = 0.039, η 2 = 0.033). Further comparisons revealed a significant main effect of deviant type only for the native Chinese speakers (T1/T4: F (1, 9) = 44.118, p < 0.001, η 2 = 0.189; T2/T3: F (1, 9) = 48.964, p < 0.001, η 2 = 0.139), but not for the English speakers or learners of Chinese.
P300 mean amplitudes (µV) recorded for each group in the T1/T4 condition (upper panel) and the T2/T3 condition (lower panel). The left column illustrates amplitudes of P300 responses recorded over left hemisphere sensors, and the right column illustrates recorded amplitudes from right hemisphere electrodes. Within each panel, the bars on the left represent data from native Chinese speakers; the bars in the middle represent data from native English speakers; and the bars on the right represent data from learners of Chinese. The error bars represent standard error for each condition and group. The numbers inside the bars are p-values of pair-wise t-tests between across- and within-category responses within each group.

In summary, native Mandarin speakers showed significantly greater MMN responses to cross-category deviants than to within-category deviants over the left hemisphere, whereas both learners of Mandarin and native English speakers showed similar MMN responses to the two deviant types. For the P300 component, cross-category deviants elicited greater P300 amplitudes from native Mandarin speakers only. Although learners of Mandarin did not show different P300 to the two deviant types, they demonstrated significantly greater overall P300 responses than the other two groups.
4. Discussion
4.1 Categorical perception of lexical tones by native Chinese speakers
In this study, auditory ERPs (MMN and P300) were used to investigate the neurophysiological correlates of categorical perception of lexical tones in naïve listeners, learners and native speakers of Mandarin Chinese. Native Chinese speakers demonstrated categorical perception of lexical tones as early as 150ms post deviance onset in the MMN experiment, and also at a later stage of processing as revealed by P300 responses. Because the physical / acoustical distances between the cross-category and within-category contrasts were held constant, the differential activations to the two contrasts provide strong support for categorical encoding by the Mandarin speakers at both an unconscious automatic stage of processing (150 – 250ms post deviance) and at later, attentionally-modulated, levels of speech processing (300 – 500ms post deviance). These findings are convergent with earlier ERP studies on categorical perception (Dehaene-Lambertz, Reference Dehaene-Lambertz1997; Winkler et al., Reference Winkler, Lehtokoski, Alku, Vainio, Czigler, Csépe, Aaltonen, Raimo, Alho, Lang, Iivonen and Näätänen1999; Kasai et al., Reference Kasai, Yamada, Kamio, Nakagome, Iwanami, Fukuda, Itoh, Koshida, Yumoto, Iramina, Kato and Ueno2001; Kazanina et al., Reference Kazanina, Phillips and Idsardi2006; Xi et al., Reference Xi, Zhang, Shu, Zhang and Li2010; Zhang, Xi, Wu, Shu & Li, 2012).
For native English speakers, within-category deviants elicited larger MMN responses than cross-category deviants, though the difference was only marginally significant. One possibility is that this unpredicted finding may be related to the frequency scale (Hz) used in the experiment design. Pitch is a function of frequency, and is realized through frequency change, but they are not identical to each other: pitch refers to an auditory (psychological) aspect of the signal, and frequency is an acoustic (physical) feature. As a result, physical differences of the same magnitude between stimuli may not necessarily evoke the same sensory responses (Stevens & Volkmann, Reference Stevens and Volkmann1940; Attneave & Olson, Reference Attneave and Olson1971; Harnad, Reference Harnad1987). A number of earlier studies worked on determination of pitch scales based on equal sensory distances, rather than equal physical distances, between steps. For example, the mel scale was developed by Stevens, Volkmann, and Newman (Reference Stevens, Volkmann and Newman1937) to capture stepwise sensory pitch differences, and the resultant scale does not linearly correlate with the frequency scale. In the current study, frequency was used to measure pitch variations in the stimuli. The cross-category and within-category deviants are equally distant from the standard sounds in terms of their frequency, but their sensory distance might not be equal. In addition, the two deviants also differ in their relationship to the standards: the cross-category deviants are of a higher frequency than the standard sounds, and the within-category deviants are of a lower frequency. The fact that the differential sensitivity of the ear is lower for high frequencies than for low frequencies (Stevens et al., Reference Stevens, Volkmann and Newman1937) may indicate that the within-category deviants (with lower frequencies) may be more salient, in the sensory domain, than the cross-category deviants. The finding that within-category deviants elicited larger MMN responses in Native English speakers suggests that these participants perceived the lexical tones based on their psychoacoustic boundaries, whereas native Chinese speakers demonstrated robust psycholinguistic boundary effects.
In addition to the differential perceptual sensitives of the ear to lower and higher frequencies, another potential modulatory factor for native English speakers’ tone categorization is the intonation patterns in their native language. In contrast with lexical tones, pitch changes in English intonation typically extend over multiple syllables, instead of one phoneme. Since intonation patterns are associated with specific meanings, they are thought to be represented in native speakers’ phonological systems in a categorical manner, though less defined compared to tonal categories; as a result, they may exert less influence on the perception of pitch variations (Hallé et al., Reference Hallé, Chang and Best2004; Francis et al., Reference Francis, Ciocca and Ng2003). Nevertheless, it is possible that the similarity between Mandarin Tone 4 (falling tone) and English declarative intonation (Xu & Xu, Reference Xu and Xu2005) may have increased the sensitivity of the English listeners to Tone 4, and thus enhanced the MMN response to the within-category deviant, which was closer to T4 than to the other end tone on the T1/T4 continuum.
For native Mandarin speakers, the MMN results revealed striking differences between left and right hemisphere activations. Although the overall MMN amplitudes did not differ between hemispheres, the differential activation in response to cross-category and within-category deviants for native Chinese speakers was only significant over left hemisphere sensors. This result suggests that lexical tones are processed in both hemispheres at early, automatic, processing stages, but then the left hemisphere preferentially activates in response to acoustic inputs that are categorically relevant.
This finding is consistent with the dual stream model of auditory processing, in which the left superior temporal sulcus (STS) is proposed to be responsible for long-term categorical representations of phonetic patterns (Hickok & Poeppel, Reference Hickok and Poeppel2007). According to this proposal, categorization of familiar phonemic information is supposed to elicit greater activation in the left hemisphere, compared to non-linguistic sounds. This hypothesis has received empirical support from several recent fMRI studies on categorical perception, which reported increased activation in the left STS in response to familiar phonemic patterns compared to unfamiliar nonphonemic patterns (e.g., Dehaene-Lambertz, Pallier, Serniclaes, Sprenger-Charolles, Jobert & Dehaene, Reference Dehaene-Lambertz, Pallier, Serniclaes, Sprenger-Charolles, Jobert and Dehaene2005; Joanisse, Zevin & McCandliss, Reference Joanisse, Zevin and McCandliss2007; Liebenthal, Desai, Ellingson, Ramachandran, Desai & Binder, Reference Liebenthal, Desai, Ellingson, Ramachandran, Desai and Binder2010). For the current study, the finding that native speakers of Mandarin showed differential activation in response to cross-category and within-category deviants only over left hemisphere sensors is consistent with claims of the dual-stream model, and specifically with the proposed functional role of left STS in long-term categorical representations.
4.2 Acquisition of lexical tones: data from Chinese language learners
The results from learners of Chinese yielded several interesting findings. The participants were experienced learners who were taking or had taken advanced Mandarin Chinese courses at the time they participated in this study. They did not demonstrate categorical boundary effects at pre-attentional, automatic levels of processing (as indexed by elicitation of MMN), or at later, attentionally-modulated processing stages (as indexed by elicitation of P300). Interestingly, the Chinese learners exhibited significantly greater P300 amplitudes than both native Chinese speakers and native English speakers, which suggested an overall heightening of the learners’ sensitivity to pitch variations, associated with enhanced attentional resource allocation (Polich, Reference Polich2007). These findings suggest that long-term language learning experience in adulthood may have significantly enhanced these learners’ sensitivities to pitch variation. However, this learning experience does not appear to have modified early, automatic perceptual processing of tones. Despite their apparently enhanced sensitivity to pitch variation, these adult English learners of Mandarin failed to establish native-like neural mechanisms for the automatic mapping of continuous acoustic input onto discrete categorical representations at early stages of auditory processing.
The findings of this study also provide some insights into differences between L1 and L2 phonological processing. Even though native Chinese speakers and learners of Chinese demonstrate similar categorical perception of tones behaviorally (Shen & Froud, Reference Shen and Froud2016), their identification and discrimination responses might be supported by different neural mechanisms. The ability to map from continuous changes in acoustic features onto discrete perceptual units at early automatic levels of perceptual processing is essential in supporting and facilitating efficient speech comprehension (e.g., Bidelman, Moreno & Alain, Reference Bidelman, Moreno and Alain2013; Bidelman & Lee, Reference Bidelman and Lee2015). Such effortless categorical encodings were only observed in Chinese speakers, but were not seen in adult learners of Chinese. To compensate for this lack of early categorical encoding, learners may need to allocate more attentional resources, and hence categorize tones less efficiently, in a top-down, knowledge-driven manner. This coincides with the finding that the learners of Chinese demonstrated more robust P300 amplitudes in response to both within-category and cross-category deviants, a pattern that has been taken to indicate greater attentional resource allocation to a specific task (e.g., Polich, Reference Polich2007). This additional attentional requirement for lexical tone categorization may account for some of the difficulties experienced by L2 learners of Chinese in speech comprehension. If phonetic categorization by adult learners is less efficient and requires more attention compared to native Chinese speakers, higher-level processes such as lexical access may also be more challenging for learners. This view is consistent with earlier findings showing that L2 listeners perform with greater accuracy on acoustic-phonetic analysis tasks than on tasks involving lexical processes (Díaz, Mitterer, Broersma & Sebastián-Gallés, Reference Díaz, Mitterer, Broersma and Sebastián-Gallés2012; Sebastián-Gallés & Baus, Reference Sebastían-Gallés and Baus2005).
In conclusion, the present work provides the first systematic investigation into the categorization of L1 and L2 lexical tone perception using ERP measures. Native categorical encoding of tones emerges predominantly in the left hemisphere at an early stage of auditory processing. Compared to native Mandarin speakers, adult English learners of Mandarin Chinese did not show neurophysiological evidence of native-like automatic categorical encoding of tones, as indexed by the MMN component. Instead, they demonstrated increased P300 amplitudes in response to both cross-category and within-category deviants, suggesting a heightened overall sensitivity to tone stimuli and increased attentional resource allocation to the task of tone discrimination. These findings may reflect an absence of abstract tone categories stored in long-term memory, and a concomitant lack of efficiency in phonetic categorization. These observations may help to account for some of the difficulties in L2 speech perception for adults learning a tone language.