I. Introduction
The reality of climate change is admitted by the vast majority of the scientific community (IPCC, 2014). Among human activities, agriculture—in particular viticulture—is highly dependent upon climatic conditions during the growing season. Hence, wine production is obviously affected by climate change. Return on investment in most agricultural production is driven by yield, thus it is relevant to study the impact of climate change on yield parameters. Return on investment in wine production is driven as much by sales prices, based on quality and reputation, as by yield. In viticulture, it is thus important to study the implications of climate change not only on yield but also on quality (e.g., Ashenfelter and Storchmann, Reference Ashenfelter and Storchmann2016; Oczkowski, Reference Oczkowski2016). In this paper, we address the impact of climate change on vine phenology and development, grape and wine composition, and wine typicity according to origin. Some of these changes have already occurred and can be quantified; others are predictable in the coming decades.
II. The Effect of Climate on Wine Production
Climate is a major factor in wine production. In the scientific literature, many papers address the effect of climate. Vines are grown in a wide variety of climatic situations. However, a majority of the major wine-growing regions are located between the 35th and the 50th parallels in the Northern Hemisphere and between the 30th and the 45th parallels in the Southern Hemisphere. It is virtually impossible to produce high-quality wines in tropical or subtropical regions. Wine growing is also complicated at high latitudes because of injury caused by spring or winter frost and because of a loss of bud fertility at low temperatures. Each of the main wine-producing regions can be characterized by mean climatic conditions, which are well described in Gladstones (Reference Gladstones2011). These climatic conditions are a major driver of wine typicity in relation to its origin (van Leeuwen and Seguin, Reference van Leeuwen and Seguin2006). Among environmental factors, climate has a greater impact on vine development and fruit composition compared to soil and grapevine variety (van Leeuwen et al., Reference van Leeuwen, Friant, Choné, Tregoat, Koundouras and Dubourdieu2004). In a given wine-producing region, climatic conditions vary from one year to the other. These variations induce the “vintage effect,” year-to-year variations in yield, quality, and typicity. Growers have chosen plant materials (variety, clone, and rootstock) according to local climatic conditions in order to optimize the compromise between yield and quality. Viticultural practices can be modified to adapt to climatic variability among vintages.
A. Temperatures
Vine phenology—that is, the date on which bud break, flowering, and véraison (onset of ripening) occur—is driven by temperature. This relation is so strong that vine phenology can be predicted by models that are based only on temperature (Parker et al., Reference Parker, Garcia de Cortazar Atauri, van Leeuwen and Chuine2011). Temperature also affects fruit ripening. Sugar accumulation increases with temperature (Coombe, Reference Coombe1987), but certain secondary metabolites, like anthocyanins, are negatively affected by high temperature (Kliewer and Torres, Reference Kliewer and Torres1972). Grape acidity, in particular the malic acid content, decreases in high temperature (Coombe, Reference Coombe1987).
B. Water Status
Vine water status depends on soil texture, percentage of stones, rooting depth, rainfall, reference evapotranspiration (ET0), and leaf area. Water deficit impairs photosynthesis (Hsiao, Reference Hsiao1973), and shoot growth (Lebon et al., Reference Lebon, Pellegrino, Louarn and Lecoeur2006) and reduces berry size (Trégoat et al., Reference Tregoat, van Leeuwen, Choné and Gaudillere2002; van Leeuwen and Seguin, Reference van Leeuwen and Seguin1994). It increases grape tannin and anthocyanin content (Duteau et al., Reference Duteau, Guilloux and Seguin1981; Matthews and Anderson, Reference Matthews and Anderson1988; van Leeuwen and Seguin, Reference van Leeuwen and Seguin1994). Excessive water deficit stress can lead to damage on leaves and stuck grape ripening.
C. Radiation
As long as water is not a limiting factor, vine photosynthesis increases with light intensity until one-third of maximal radiation and then levels off (Kriedemann and Smart, Reference Kriedeman and Smart1971). Contradictory results have been published on the impact of light on grape phenolics, probably because it is difficult to separate the effect of light from that of temperature. In a field study with an adapted experimental design, Spayd et al. (Reference Spayd, Tarara, Mee and Ferguson2002) showed that the amount of anthocyanin in grape skins increases with light but is negatively affected by high temperature.
III. Climate Change
Most scientists have admitted the reality of climate change, caused by human activities and in particular the emission of greenhouse gases, since the 1990s. The main measurable effect of climate change is a steady increase in temperature. This is observed worldwide, although significant differences in the rate of heating exist from one region to another (Schar et al., Reference Schar, Vidale, Lüthi, Frei, Häberli, Liniger and Appenzeller2004). Depending on the scenario of greenhouse gas emissions, temperatures are predicted to increase by from 1 °C to 3.7 °C until the end of the century, compared to the reference period 1985–2005 (IPCC, 2014). Less consensus exists concerning a modification in rainfall patterns. Rainfall is a discontinuous phenomenon, and tendencies can be assessed only over very long periods (several decades). Moreover, it is likely that modifications in rainfall will differ from one region to another (IPCC, 2014). However, vine water status is driven as much by evapotranspiration as by rainfall (Lebon et al., Reference Lebon, Dumas, Pieri and Schultz2003; see discussions in companion paper, Gambetta, Reference Gambetta2016). Evapotranspiration increases with temperature. Hence, a warmer climate is also a dryer climate, even when rainfall does not decrease. Climate change will also increase radiation and the frequency of extreme weather events (IPCC, 2014).
IV. The Impact of Increasing Temperatures on Vine Development, Fruit Composition, and Wine Quality
A. Measurable Effects
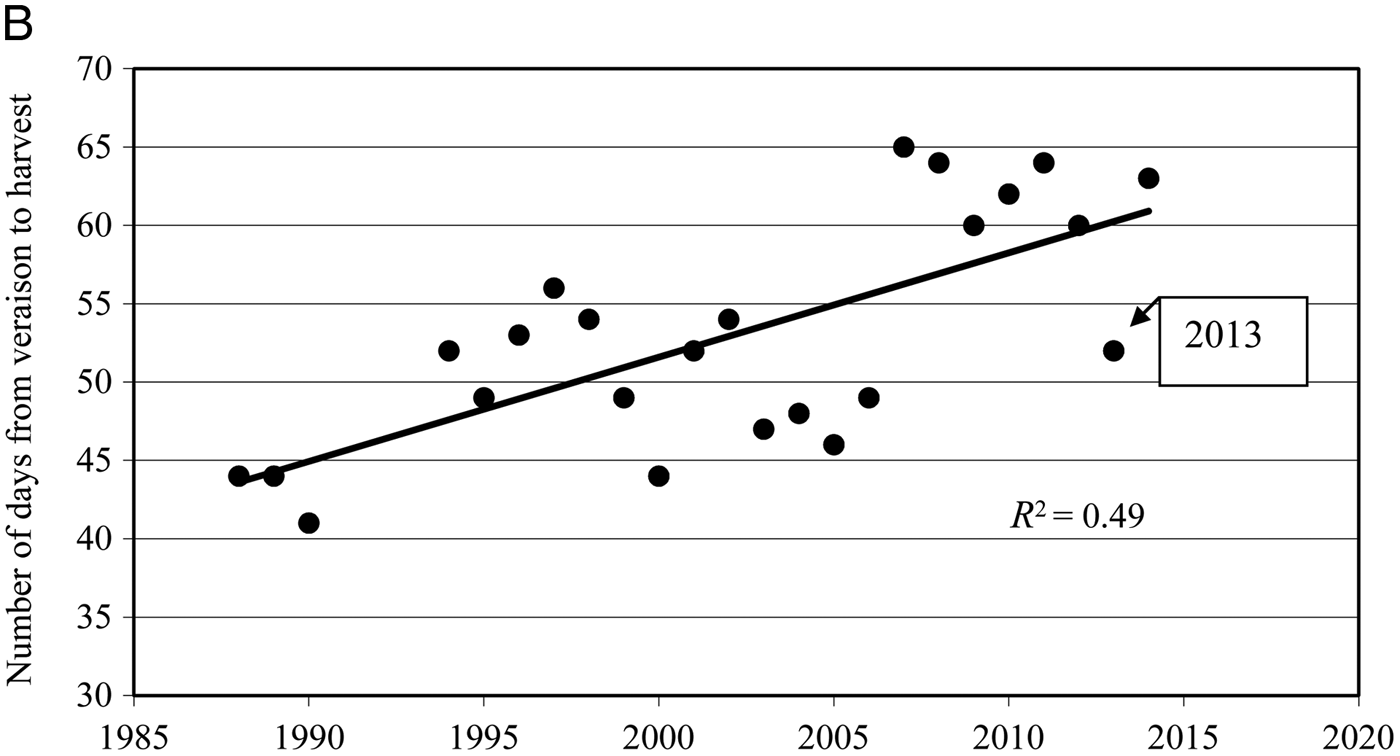
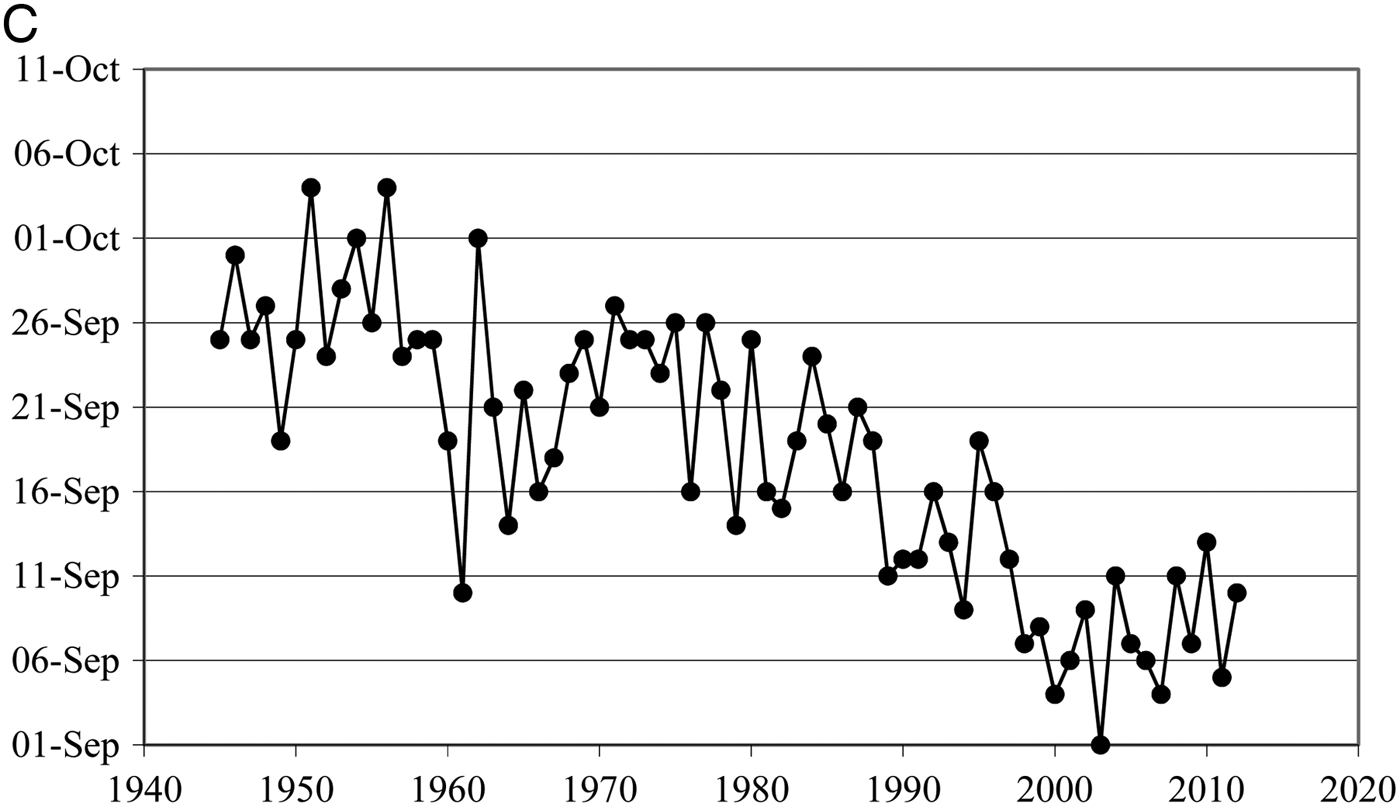
An increase in temperature, which is one of the major consequences of climate change, triggers an advance in phenology. Since the 1980s, harvest dates have advanced by two weeks in Alsace (Duchêne et al., Reference Duchêne and Schneider2005) and Bordeaux, France (Figure 1A). In northern (Alsace) or Atlantic (Bordeaux) wine-growing regions, growers take advantage of warmer conditions to pick fruit at greater levels of ripeness (Figure 1B). Hence, the advance in harvest date is less compared to the real advance in phenology. In Mediterranean conditions, increasing the ripeness levels of grapes is not needed. This explains why the advance in harvest dates is greater in this situation (approximately four weeks for Châteauneuf du Pape, Figure 1C). In any case, grapes ripen in warmer conditions because of climate change, not only because the climate is warming up but also because phenology is advanced.
Harvest Dates in an Estate in Saint-Emilion from 1892 to 2014

Duration from Véraison to Harvest from 1988 to 2014 from a Block of Cabernet Franc in the Saint-Emilion Area (Bordeaux, France)
Harvest Dates in Châteauneuf du Pape from 1945 to 2012
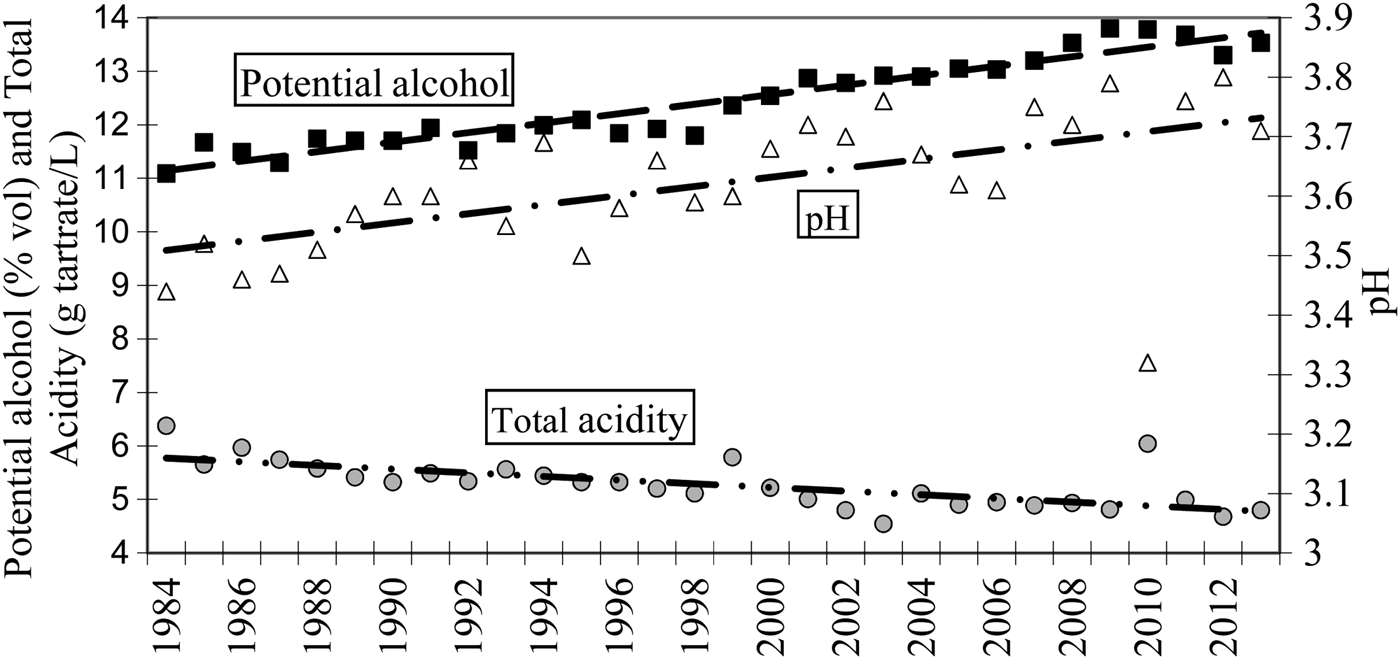
Data from the Dubernet laboratory (11100 Montredon-Corbières, France) shows that there has been a significant evolution in grape composition at harvest over the past 30 years (Figure 2). This data is based on thousands of samples analyzed every year. Potential alcohol levels increased by more than 2% by volume, total acidity decreased by 1 g tartrate/L and pH increased by 0.2 units. Similar modifications in grape composition have been reported at many other vineyards (Duchêne and Schneider, Reference Duchêne and Schneider2005; Mira de Ordunia, Reference Mira de Orduna2010). It is likely that this evolution is not only the result of an increase in temperature. Other factors include increased atmospheric carbon dioxide (CO2) (+15% over the period), increased radiation, improved viticultural techniques, and longer “hangtime” (Figure 1B). More research is needed to quantify the impact of each of these factors in modified grape composition at harvest.
Potential Alcohol Levels, Total Acidity and pH of Grape Juice Just Prior to Harvest in Languedoc from 1984 to 2013
B. Predictable Effects
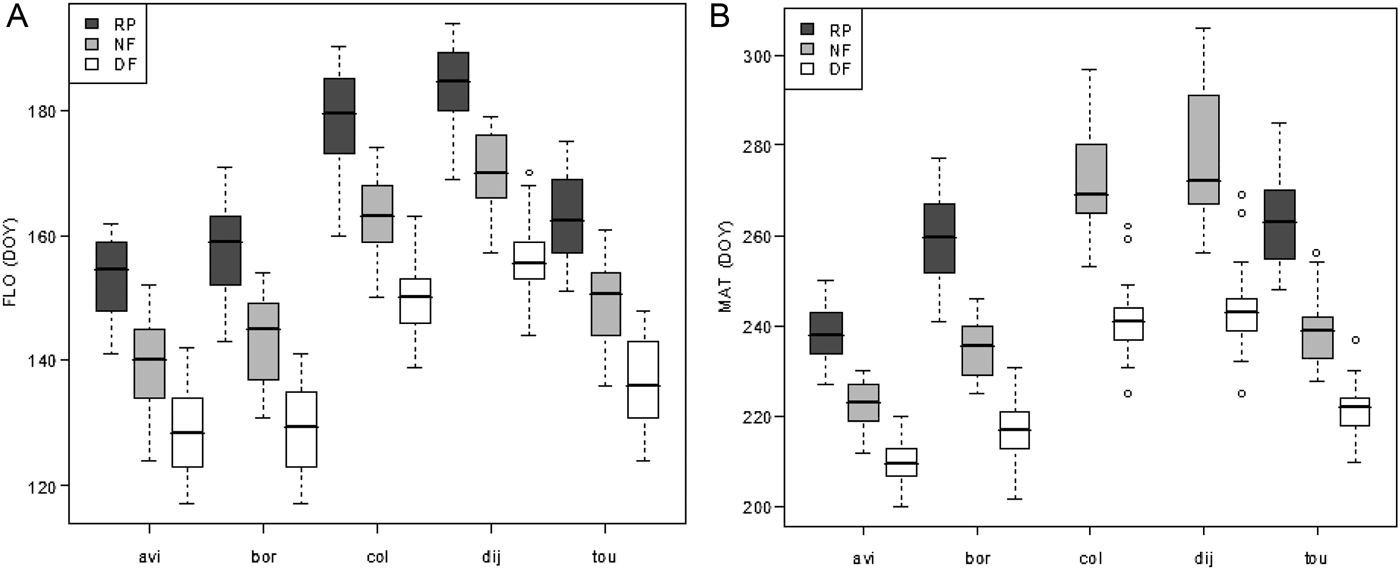
It is possible to model predicted phenology by using temperature projections until the end of the century. Flowering in Bordeaux (France) will be advanced by 15 days in the near future (2020–2050) and by 30 days at the end of the century (2070–2100, Figure 3). Ripeness will be advanced by 25 and 45 days, respectively (Pieri, Reference Pieri, Brisson and Levrault2010). This would mean harvest in the first week of September in two decades and around mid-August by the end of the century. These early harvest dates are incompatible with the production of great terroir wines (van Leeuwen and Seguin, Reference van Leeuwen and Seguin2006).
Modeled Mean Flowering and Harvest Dates
It is quite easy to model phenology based on predicted temperatures, but predicting grape composition as a result of changing climatic conditions in the years to come is much less obvious. However, it is very likely that the already observed trend in grape composition (Figure 2) will continue. Increased sugar levels in grapes yield wines with a higher alcohol level. The best possible alcohol level for quality may vary with the concentration in other compounds like organic acids and the style of the wine targeted by the producer. Wine quality can be impaired when alcohol level is too low but also when the alcohol level is too high. Until the early 1980s, wine quality was altered in most situations by having an alcohol level that was too low. Hence, wine quality benefited from increased sugar levels in grapes. Today it has become more common to harvest grapes with a potential alcohol level of over 14%, which, for most wines, is too high for optimum quality. Regarding acidity, the most relevant indicator is must and wine pH. Wines are perceived as being rounder, sweeter, and less aggressive when pH increases. Most consumers consider this a positive change. However, wines can lack freshness when pH is too high, and it can also impair stability. The wild yeast Brettanomyces bruxellensis can spoil wine during aging in barrels or tanks, even after bottling, when pH is high (Lonvaud-Funel et al., Reference Lonvaud-Funel, Renouf and Strehaiano2010). Higher levels of sulfur dioxide (SO2) have to be added to stabilize wines when pH is high.
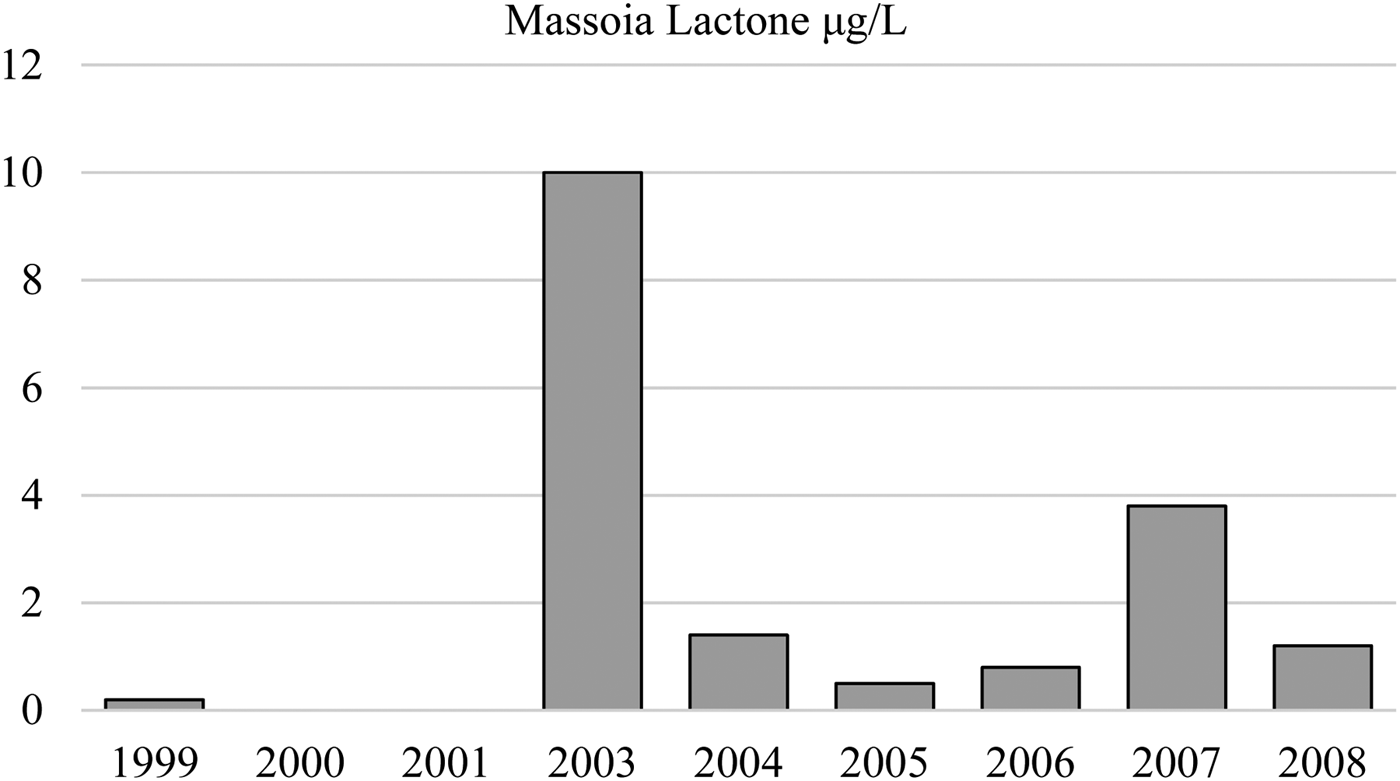
With respect to aroma, concentrations of 2-methoxy-3-isobutyl-methoxypyrazine (IBMP, responsible for bell pepper aroma in wine) in grapes decrease with temperature (Falcão et al., Reference Falcão, de Revel, Perello, Moutsiou, Sanus and Bordignon-Luiz2007). However, other factors, such as fruit exposure, also play an important role in grape IBMP content (Koch et al., Reference Koch, Ebeler, Williams and Matthews2012). It is frequently observed that wines produced in warm climates from vines with dense canopies can show a vegetal character. Rotundone levels in grapes, responsible for the peppery aroma of Syrah wines, decrease with temperature (Scarlett et al., Reference Scarlett, Bramley and Siebert2014). Hence, wines produced from Syrah grapes will exhibit this characteristic less frequently when temperatures increase. However, 1,1,6-trimethyl-1,2-dihydronaphthalene (TDN), the compound responsible for petrol flavors in wines produced from Riesling grapes, increases with temperature during the berry-ripening phase (Marais et al., Reference Marais, van Wyk and Rapp1992). Contrasting results are reported for aromas from the terpenol family. Linalol content in berries is impaired at high temperatures, while no detrimental effect is shown on geraniol content (Duchêne, personal communication, 2015). Massoia lactone (5,6-dihydro-6-pentyl-2(2H)-pyranone) is the characteristic aroma of figs and coconut that can be found in wines produced from overripe fruit. In Bordeaux, Pons et al. (Reference Pons, Lavigne, Darriet and Dubourdieu2011) found more massoia lactone in Pomerol wines, produced from a majority of Merlot grapes, in warm vintages, whether they are dry (2003) or wet (2007) (Figure 4).
Level of 5,6-Dihydro-6-Pentyl-2(2H)-Pyranone for Selected Vintages
V. The Impact of Increasing Water Deficits on Vine Development, Fruit Composition, and Wine Quality
A. Measurable Effects
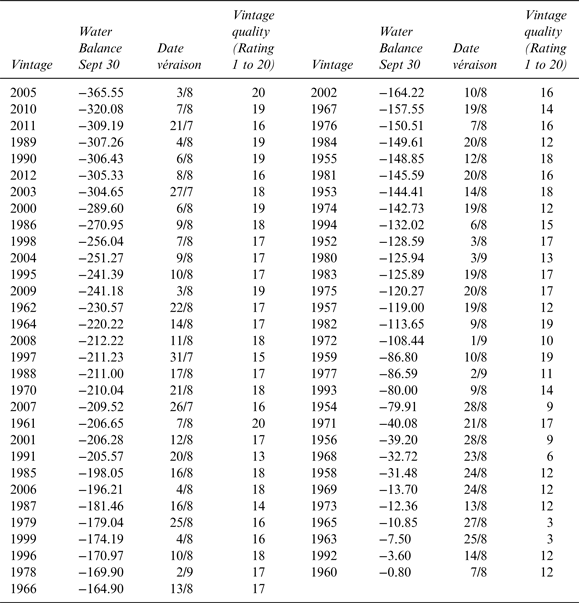
Water balance modeling is an appropriate tool for estimating vine water deficits in a specific block or vintage. In Table 1, water deficit was modeled for the Saint-Emilion region (Bordeaux, France) according to Lebon et al. (Reference Lebon, Dumas, Pieri and Schultz2003) for 61 vintages from 1952 to 2012. To emphasize the effect of climate in the model's results, we used a soil water holding capacity of 0 mm and ignored possible stomatal regulation. For this reason, values are negative; the more negative the value, the dryer the vintage. Over the period considered, vintages become dryer (Figure 5), not necessarily because of decreased rainfall but more certainly because evapotranspiration increases with higher temperatures. Among the 20 driest vintages in 61 years, 10 occurred in the period 2000–2012. At the same time, overall quality of the vintage, as rated by the Bordeaux wine brokers Tasted and Lawton (33000 Bordeaux, France), increases with the level of water deficit. The correlation between quality and water deficit is highly significant (R 2 = 0.54, Figure 6). Over the same period, vintage quality is much less correlated to the average temperature from April to October (R 2 = 0.26). In Bordeaux, all dry years are good or great vintages. If modeled water deficit is over 220 mm from April 1 to September 30, quality is equal to or higher than 16/20. This does not mean that all wet vintages are necessarily poor vintages. Some wet vintages have been saved by a particularly dry and sunny September. This analysis shows that, over the past years, average vintage quality in Bordeaux improved, not necessarily because of higher temperature but, rather, because of dryer production conditions. However, these two factors are not completely independent, because high temperatures induce high evapotranspiration. Water deficit improves quality potential for the production of red wine because it induces early cessation of shoot growth, reduces berry size, and enhances skin phenolics in grapes (van Leeuwen et al., Reference van Leeuwen, Trégoat, Choné, Bois, Pernet and Gaudillère2009). These results from the Bordeaux area cannot automatically be reproduced in dryer regions, where yield and quality may suffer from excessive water stress, in particular in soils with low water-holding capacity.
Evolution of Water Balance from 1952 to 2012 for Saint-Emilion
Correlation Between Vintage Quality and Water Balance in Saint-Emilion
Classification of 61 Vintages from Driest to Wettest in Saint-Emilion
Note: Classification of 61 vintages from the driest to the wettest by water balance modeling between April 1 and September 30 in the Saint-Emilion region (Bordeaux, France). Water balance model according to Lebon et al. (Reference Lebon, Dumas, Pieri and Schultz2003). Parameters: Soil Water Holding Capacity = 0 mm; no stomatal regulation. Vintage quality ratings according to Bordeaux wine brokers Tasted and Lawton.
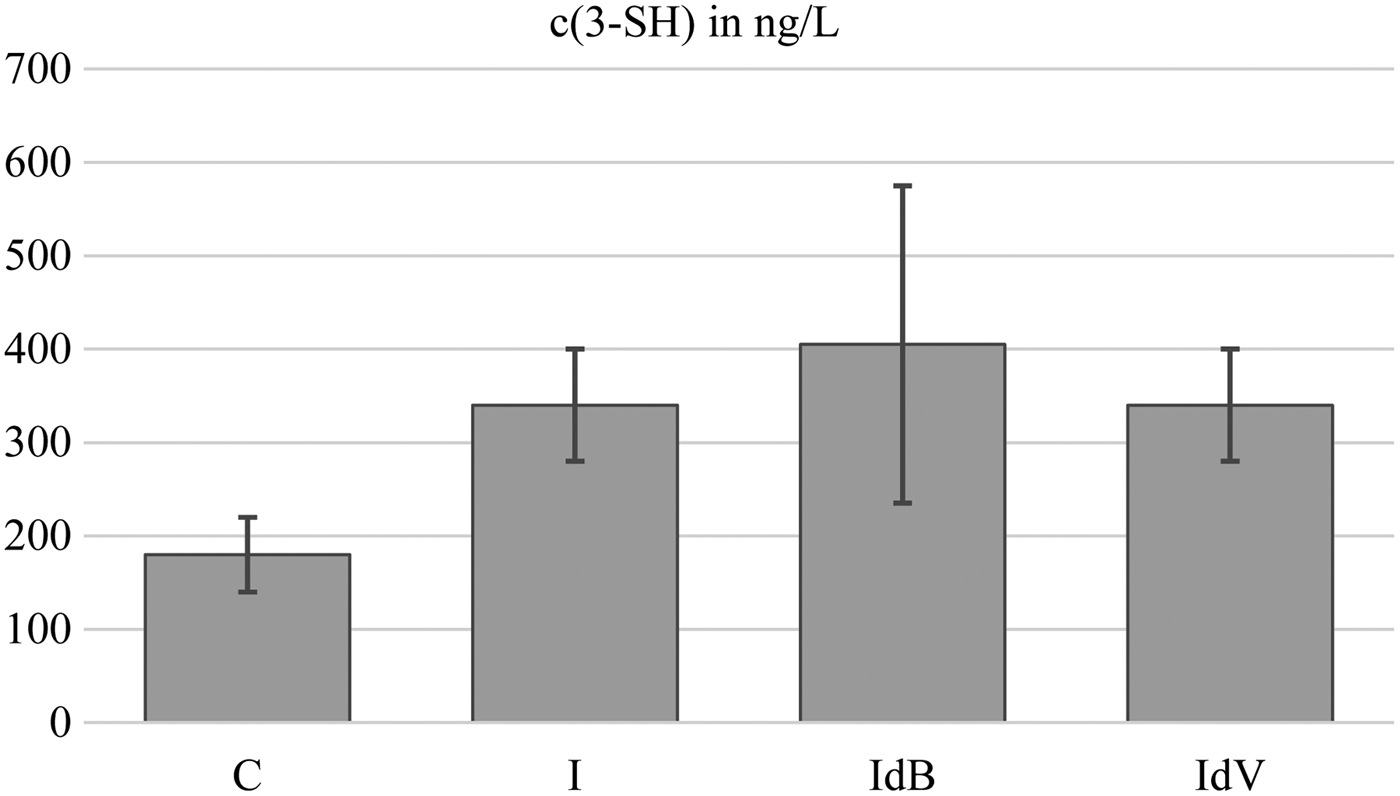
The impact of climate change on aromas and aroma precursors is compound specific. Berry content in volatile thiole precursors is reduced by water stress, while it can be increased by moderate water deficit (Peyrot des Gachons et al., Reference Peyrot des Gachons, van Leeuwen, Tominaga, Soyer, Gaudillere and Dubourdieu2005). This result was confirmed for Riesling by Schüttler et al. (Reference Schüttler, Gruber, Thibon, Lafontaine, Stoll, Schultz, Rauhut and Darriet2011, Reference Schüttler, Fritsch, Hoppe, Schüssler, Jung, Thibon, Gruber, Lafontaine, Stoll, de Revel, Schultz, Rauhut and Darriet2013) in semicontrolled conditions (Figure 7). Volatile thiole content was not significantly modified by grape exposure, neither by leaf pulling pre-véraison nor by leaf pulling at véraison. In this study, monoterpenes, another family of aroma compounds, were not affected by vine water status.
3-Sulfanylhexane-1-ol Content in Wine
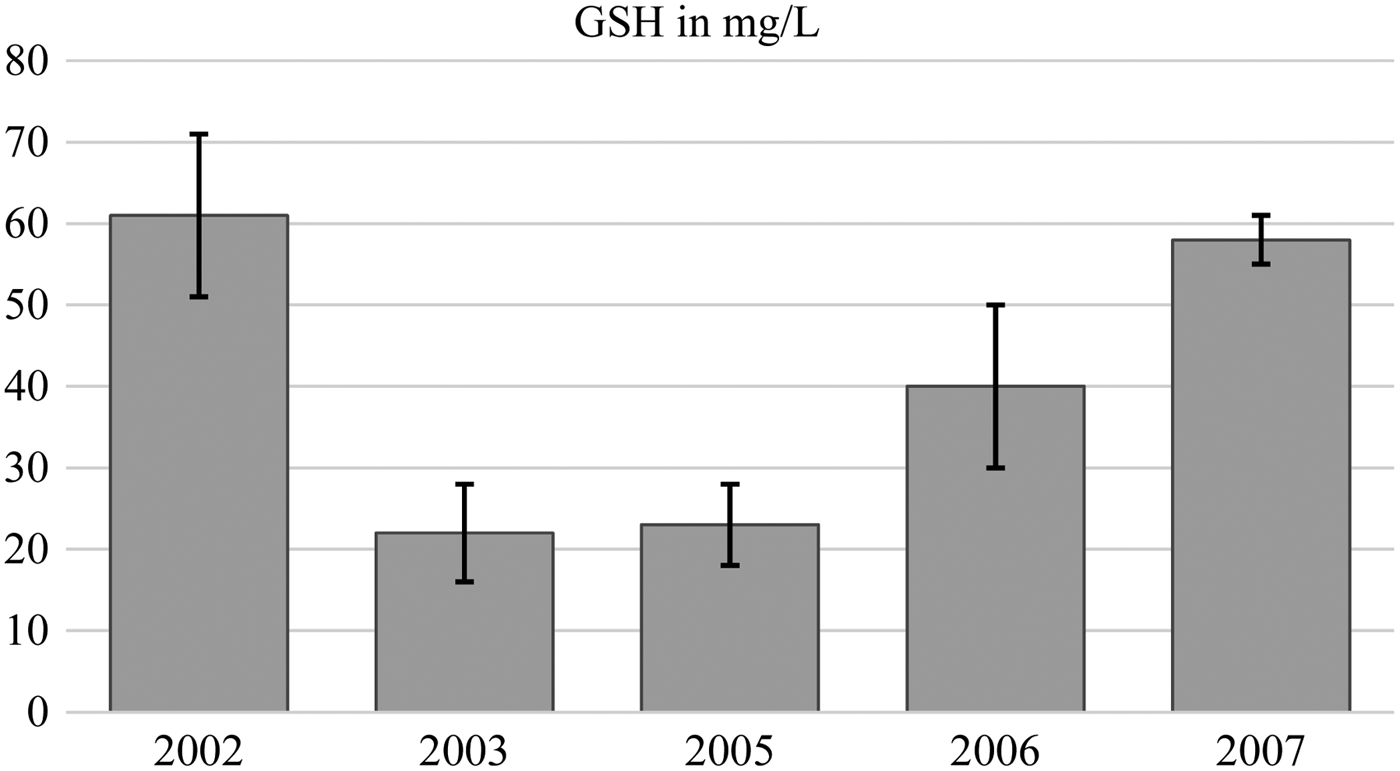
Koundouras et al. (Reference Koundouras, Marinos, Gkoulioti, Kotseridis and van Leeuwen2006) reported increased norisoprenoid C13 levels in grapes under water deficit conditions. However, this might be an indirect effect linked to reduced vigor and increased bunch exposure. In dry vintages in the Bordeaux area, Sauvignon blanc grapes contain more flavane-3-ols and less glutathione (Figure 8). Glutathione has anti-oxydative properties and increases aging potential in white wines.
Glutathione Content of Sauvignon Blanc Grape Must at Harvest
B. Predictable Effects in Climate Change Scenarios
Higher temperatures will increase evapotranspiration. Modifications in rainfall patterns are difficult to predict. It is likely that rainfall will be subject to great regional and temporal variations. In some regions, rainfall will be higher, while other regions might be experience longer periods of drought. Rainfall distribution over the year might also be subject to major changes. Hence, it is difficult to predict the impact of climate change on water balance. Moreover, the reproductive cycle of the vine will be compressed in warmer conditions. When the harvest takes place earlier in the season (i.e., in August in the Northern Hemisphere), the most intense period of water stress will occur after the harvest (Ollat et al., Reference Ollat, Brisson, Denoyes, Garcia de Cortazar, Goutouly, Kleinhentz, Launay, Michalet, Ollat, Pieri, van Leeuwen and Le Treut2013). Despite these uncertainties, most wine-growing regions will be subject to increased water deficits because of the weight of evapotranspiration in the water balance (see discussion in companion paper, Schultz, Reference Schultz2016). The first impact of water deficit is reduced yield, because of a smaller berry size (Ollat et al., Reference Ollat, Diakou-Verdin, Carde, Barrieu, Gaudillère and Moing2002) and reduced bud fertility (Guilpart et al., Reference Guilpart, Metay and Gary2014). All wine-growing regions in the world will experience reduced yields, although the magnitude might vary. The impact of increasing water deficits on wine quality will vary. In red wine production, water deficit (but not severe stress) enhances quality. For instance, in Bordeaux, to date overall vintage quality has never been jeopardized by excessive water deficit, even in an extremely dry vintage such as 2005, when rainfall was close to half that of a normal year. As in Bordeaux, red wine quality will increase with developing water deficits in most Atlantic and northern wine-growing regions in Europe. In Mediterranean or other very dry climates, quality might suffer from excessive water stress, which can lead to impaired photosynthesis and leaf necrosis, in particular on soils with low water-holding capacity. However, no serious study has been published on the frequency of situations in which quality might benefit from more water deficits versus those in which quality might suffer. This sort of investigation would be a welcome contribution to the literature and very useful for growers in developing adaptive strategies.
VI. The Impact of Increasing Radiation on Vine Development, Fruit Composition, and Wine Quality
A. Measurable Effects
Over the past few decades, radiation has been steadily increasing, in particular UV-B radiation (280–320 nm). However, the extent of this phenomenon reported in the literature varies according to the region and the author. The UV-B radiation increase is about 1–2% per decade, but can reach 8% per decade at higher altitudes (Schultz, Reference Schultz2000). Higher UV-B radiation enhances color, flavonol, and tannin synthesis in red grapes (Berli et al., Reference Berli, D'Angelo, Cavagnaro, Bottini, Weilloud and Silva2008; Martinez-Lüscher et al., Reference Martinez-Lüscher, Sanchez-Dias, Delrot, Aguirreolea, Pascual and Gomès2014), but can induce off-flavors in white grapes, such as o-Acetoaminophenone and 1,1,6-trimethyl-1,2-dihydronaphthalene (TDN) (Schultz, Reference Schultz2000).
B. Predictable Effects
An increase in radiation can cause sunburn on grapes, particularly in the pre-véraison phase. An increase in UV-B radiation might be favorable in red wine production because of increased skin phenolics but can impair white wine quality and induce atypical aging. The proportion of UV-B radiation is related to changes in the ozone layer.
VII. Adaptations to Limit the Impact of Climate Change on Wine Quality
A. Adaptations to Increased Temperatures
Harvest is taking place earlier in the season as a result of increased temperatures. This has increased wine quality in many regions, because grapes can be picked when they are more mature. However, when ripeness is reached too early in the season (July or August in the Northern Hemisphere, January or February in the Southern Hemisphere) grape composition is unbalanced and wine quality is jeopardized. This evolution is currently taking place, in particular in production regions with warm climates. To avoid quality alterations caused by high temperatures during fruit ripening, phenology should be delayed.
Plant material is a major tool for reaching this goal. Growers can use rootstocks that induce a longer cycle, and clonal selection should be oriented toward late-ripening clones. These adaptations will not change wine typicity. Together, they can delay ripeness by approximately seven to ten days. Over the long term, ripeness can be delayed much more by the use of late-ripening varieties. Late-ripening varieties can be found among the traditional varieties in some wine-growing regions. This is the case with Cabernet-Sauvignon in Bordeaux and Mourvèdre in Languedoc-Roussillon (France). When the climate becomes too warm for Merlot in Bordeaux and for Syrah in Languedoc, the proportion of Cabernet-Sauvignon and Mourvèdre, respectively, can be increased in these regions, without altering the wine style. In the long run, it might be necessary to use nonlocal varieties. These varieties must be chosen in order to change the wine style produced in each region as little as possible. This adaptation is obviously easier to implement in New World wine-growing regions than in European countries with traditional appellations. Today, in these appellations, growers can only use local varieties. It might be worthwhile to start experimenting with a small proportion of nonlocal varieties, in order to have accumulated enough experience by the time a major change in varieties becomes unavoidable.
Training systems can be modified to delay phenology. Higher trunks can reduce the temperature in the bunch zone and, in particular, limit maximum temperatures on dry and stony soils. Late pruning (end of February or March in the Northern Hemisphere) delays bud break and subsequent phenological stages. Low leaf area: fruit weight ratios delay véraison (Parker et al., Reference Parker, Hofmann, van Leeuwen, McLachlan and Trought2014). However, it can have a negative impact on fruit composition and, in particular, reduce the tannin and anthocyanin content in grape berries. These are key compounds in red wine quality.
Wine-growing regions can be moved to higher latitudes, and in mountainous regions, vineyards can be moved to higher altitudes. However, these adaptations have a high social and economic cost. Regions located at high latitudes, which might currently be marginal for wine production, will become suitable for grape growing. Several studies focus on when and where this is likely to happen (Ferrise et al., Reference Ferrise, Trombi, Moriondo and Bindi2016; Fraga et al., Reference Fraga, Malheiro, Moutinho-Perreira and Santos2012; Hannah et al., Reference Hannah, Roehrdanz, Ikegami, Shepard, Shaw, Tabor, Zhi, Marquet and Hijmans2013; Roehrdanz and Hannah, Reference Roehrdanz and Hannah2016). The authors—in particular, Hannah and colleagues—also model the decrease in suitability of current wine-growing regions. However, they seem to underestimate possible adaptation, which can be implemented by growers to maintain high-quality wine production in warmer temperatures (van Leeuwen et al., Reference van Leeuwen, Schultz, Garcia de Cortazar-Atauri, Duchêne, Ollat, Pieri, Bois, Goutouly, Quénol, Touzard, Malheiro, Bavaresco and Delrot2013). When variations in altitude are significant in the production region, which is the case, for instance, in the Douro region (port wine production), grapevine can be planted at higher elevations (Jones and Alves, Reference Jones and Alves2012). Temperatures decrease by 0.65 °C per 100 m gain in elevation.
B. Adaptations to Increased Water Deficits
The choice of plant material is a major tool to adapt vineyards to greater water deficits. Rootstock resistance to water deficits is highly variable (Carbonneau, Reference Carbonneau1985). The genetic basis of these differences is currently under investigation (Marguerit et al., Reference Marguerit, Brendel, Lebon, Decroocq, van Leeuwen and Ollat2012). Some existing rootstocks, like 140 Ruggeri or 110 Richter, are highly resistant to drought. One of the priorities of today's viticultural research is to create new rootstocks that show even greater drought resistance. In the same way, large differences in drought tolerance exist among grapevine varieties (Albuquerque, Reference Albuquerque1993; see also discussion in companion paper, Gambetta, Reference Gambetta2016). Mediterranean varieties, such as Grenache or Carignan, are better adapted to dry conditions than Atlantic varieties, such as Merlot or Sauvignon blanc. The great advantage of adapting vineyards to increased drought stress through the choice of plant material (rootstock and variety) is that it is environmentally friendly and does not increase production costs.
Training systems also vary with respect to their impact on water consumption by the vines. In the Mediterranean region, over centuries growers have developed a training system that has great drought-resistant performance: the so-called gobelet (Mediterranean bush vines). This system limits vine water use by combining low leaf area on a per-hectare basis (which means less transpiration) and relatively low yields (lower need for photosynthesis). The low yield does not negatively affect economic sustainability, because the production costs per hectare are low. There is no trellis to set up and maintain, and no shoot positioning has to be carried out. Hence, grapes are produced at reasonably low cost per kilogram. The main drawback of this system is that it makes harvesting by machine very difficult. The paradox is that, for this reason, many drought- resistant gobelet vineyards are being pulled up just when it should be a priority to focus on drought resistance because of climate change. One of today's research priorities should be the development of a mechanical harvester that is able to harvest gobelet vineyards. Any other training system that limits leaf area per hectare increases drought resistance. However, the leaf area: fruit weight ratio should not be reduced to maintain quality. Hence, a lower leaf area per hectare will either decrease yield (if the ratio is maintained) or quality (if the yield is maintained).
Vine water status is related both to climatic factors (rainfall and ET0) and soil-related factors (soil water-holding capacity [SWHC]). Increased climatic dryness, whether through a reduction in rainfall or an increase in ET0, can be compensated for by an increase in the SWHC. In dry regions, or regions exposed to increased drought, the development of vineyards on soils with at least a moderate SWHC can limit the negative impact of excessive water stress, as long as winter rains is sufficient to replenish the soil water storage capacity.
Irrigation is also a way to avoid excessive drought stress. However, it should not be considered the first option when adapting a vineyard to increased water deficits. Unlike the other solutions proposed here, irrigation has an economic, environmental, and social cost. When water is becoming increasingly scarce, the irrigation of a drought-resistant plant such as vines should not be a priority. In many irrigated regions, in particular in California and Australia, access to irrigation water has become a serious issue. Moreover, irrigation can lead salt to build up in vineyard soils, when winter rain is insufficient for leaching it out of the soil. Vines are highly sensitive to salt, so its buildup can make soils unsuitable for grape production. When irrigation is the only option for maintaining vineyards in a given area, deficit irrigation should be implemented, both to save water and to optimize grape quality potential.
C. Adaptations to High Radiation Levels
Excess radiation exposure can cause sunburn. A high proportion of UV-B radiation is favorable to synthesis of skin phenolics (color, tannin) but can impair white wine quality through the development of off-flavors. High-altitude vineyards are affected more than vineyards at sea level. The detrimental impact of high radiation can be limited by using adapted training systems or canopy management. The exposure of grapes can be limited through reduced hedging and leaf pulling. Special nets that can filter UV-B radiation have also been developed and can be used to protect the bunch zone.
VIII. Conclusion
Climate change is a major challenge for viticulture in the coming decades. In the recent past, wine quality has increased in most wine-growing regions because of higher temperatures and more frequent water deficits while yields have decreased. If the tendency continues, quality might be negatively affected in the near future. Growers need to implement adaptive strategies to continue the production of high-quality wines at economically acceptable yields in a warmer and dryer climate. Among various options, the use of adapted plant material is one of the better tools, because it has the advantage of being environmentally friendly and cost effective.