


Introduction
Polythermal glaciers are most commonly observed in polar or subpolar regions. However, some glaciers at mid-latitudes (e.g. in the European Alps) can also be considered polythermal (Reference PatersonPaterson, 1994; Reference Haeberli and HoelzlHaeberli and Hoelzle, 1995; Reference Suter, Laternse, Haeberl, Frauenfelde and HoelzlSuter and others, 2001). The presence of ice at temperatures below the pressure-melting point (pmp) influences a number of properties of the glacier, such as the temperature gradients and heat fluxes, distribution of shear stresses and characteristics of the hydrological system. This makes modelling the behaviour of polythermal glaciers more complicated than that of temperate glaciers. It has been recognized for some time that geophysical properties of ice, such as seismic wave speed (Reference KohnenKohnen, 1974) and dielectric permittivity (Reference Bogorodsky, Bentle and GudmandseBogorodsky and others, 1985), are influenced by ice temperature. Among geophysical methods, ground-penetrating radar, in particular, has the potential to identify cold ice because of its relatively low backscatter compared to temperate ice, as the volume fraction of liquid water is greatly reduced at ice temperatures below the pmp (Reference NyeNye, 1991; Reference MaderMader, 1992; Reference Pettersson, Jansso and BlattePettersson and others, 2004). As a consequence, several studies established the possibility of detecting thermal regimes within glaciers by means of radar surveys (see Reference Pettersson, Jansso and HolmlunPettersson and others, 2003, and references therein for a summary).
A prominent example of a glacier in the Alps which contains cold firn in the accumulation area is Gornergletscher, located in Valais, Switzerland. With a length of ∼14 km and an area of ∼60 km2, it is one of the largest European glaciers. It spans an altitude range from 2200 to >4550ma.s.l. It has been the subject of a number of scientific studies since the 1970s (e.g. Reference Bezinge, Perrete and SchafeBezinge and others, 1973; Reference EllistonElliston, 1973; Haeberli, 1976; Reference Aschwanden and LeibundguAschwanden and Leibundgut, 1982; Reference Alean, Haeberl and SchädleAlean and others, 1984; Reference Haeberli, Schmi and WagenbacHaeberli and others, 1988; Reference Haeberli and FunHaeberli and Funk, 1991; Reference Iken, Fabr and FunIken and others, 1996; Reference L¨uthi and FunLüthi and Funk, 2000, Reference L¨uthi and Fun2001; Reference Suter, Laternse, Haeberl, Frauenfelde and HoelzlSuter and others, 2001;Reference Huss, Baude, Werde, Fun and HocHuss and others, 2007; Reference Sugiyama, Baude, Weis and FunSugiyama and others, 2007). Its accumulation region at Colle Gnifetti has been the site of several ice-core drillings, mainly to exploit palaeoclimate proxies conserved in the ice (e.g. Reference Oeschger, Schottere, Stauffe, Haeberl and RöthlisbergeOeschger and others, 1978; G¨aggeler and others, 1983; Döscher and others, 1995; Wagenbach and others, 1996; Reference Smiraglia, Magg, Nov, Ross and JohnstoSmiraglia and others, 2000).
A prominent example of a glacier in the Alps which contains cold firn in the accumulation area is Gornergletscher, located in Valais, Switzerland. With a length of ∼14 km and an area of ∼60 km2, it is one of the largest European glaciers. It spans an altitude range from 2200 to >4550ma.s.l. It has been the subject of a number of scientific studies since the 1970s (e.g. Reference Bezinge, Perrete and SchafeBezinge and others, 1973; Reference EllistonElliston, 1973; Haeberli, 1976; Reference Aschwanden and LeibundguAschwanden and Leibundgut, 1982; Reference Alean, Haeberl and SchädleAlean and others, 1984; Reference Haeberli, Schmi and WagenbacHaeberli and others, 1988; Reference Haeberli and FunHaeberli and Funk, 1991; Reference Iken, Fabr and FunIken and others, 1996; Reference L¨uthi and FunLüthi and Funk, 2000, Reference L¨uthi and Fun2001; Suter and others, 2001;Reference Huss, Baude, Werde, Fun and HocHuss and others, 2007; Reference Sugiyama, Baude, Weis and FunSugiyama and others, 2007). Its accumulation region at Colle Gnifetti has been the site of several ice-core drillings, mainly to exploit palaeoclimate proxies conserved in the ice (e.g. Reference Oeschger, Schottere, Stauffe, Haeberl and RöthlisbergeOeschger and others, 1978; G¨aggeler and others, 1983; Döscher and others, 1995; Wagenbach and others, 1996; Reference Smiraglia, Magg, Nov, Ross and JohnstoSmiraglia and others, 2000).
One reason for the scientific interest in Gornergletscher is a glacier-dammed lake that forms every spring above the confluence of the southern branch, Grenzgletscher, with the northern branch, the actual Gornergletscher (Fig. 1). The lake, known as Gornersee, reaches a maximum volume of ∼1–4×10⁶ m3 and usually drains during summer over a period of several days, with peak water outflow of 20–60m3 s − 1 (Reference Bezinge, Perrete and SchafeBezinge and others, 1973; Reference Huss, Baude, Werde, Fun and HocHuss and others, 2007). This jökulhlaup, or glacier outburst flood, poses a threat to the villages located down-valley. The village of Zermatt has experienced serious damage in the past from these jökulhlaups. To investigate the ice-dynamical, thermal and hydrological properties of the glacier, an extensive field program has been carried out over the past few years. Predictions of the future response and behaviour of the glacier, as well as the drainage mechanism, are the ultimate goal of this field program. This requires a thorough understanding of the processes occurring during the jökulhlaup and related glacier dynamics. A number of different techniques (e.g. measurements of surface velocity, mass balance, borehole deformation and temperature, water pressure, tracer experiments, ground-penetrating radar, passive and active seismics) have been employed in several campaigns to obtain physical parameters and their variation over the course of the drainage.
Overview of study area at confluence of Gorner- and Grenzgletscher with the Gornersee (solid grey area): surface elevation with 20 m contour lines (thin solid), bedrock elevation with 50 m contour lines (dashed), borehole locations (labelled diamonds), low-frequency radar profiles (dotted lines) and extent of medial moraines at surface (hatched). Along the 40 MHz radar profiles (P05-2 to P07-7, semi-bold lines) the presence of the low backscatter at 60 m depth is indicated as a grey bold line, the presence of clutter as a black bold line. The semi-bold dashed grey line indicates a tentative flowline (BHT4–BHT2–BH3), the semi-bold dashed black line the glacier boundary.

In this study, we use radar data to determine the current thermal structure of the glacier, focusing on several cross-sections of the glacier tongue, along with data on ice thickness, bedrock topography and temperature profiles from boreholes. Implications of the deduced temperature distribution for the jökulhlaup and glacier dynamics, as well as possible future applications for detecting signals of climate change and improving palaeoclimatological methods, are discussed.
Methods
Radar systems and data acquisition
The glacier tongue was first surveyed with a low-frequency monopulse system, operating with resistivity loaded dipoles (Reference Funk, Gudmundsso and HermanFunk and others, 1994a). An example survey is shown in Figure 2a. Antenna frequency was varied between 1 and 5MHz as a trade-off between strong reflections from the bedrock and a short transmitter pulse for improved resolution. Data acquisition and post-recording processing, including static correction, bandpass filtering, migration using the ellipse method and automatic gain control, are identical to the procedures described in detail by Reference Bauder, Fun and GudmundssoBauder and others (2003). Antennae distance and shot interval were kept constant at 15 m. Transmitter and receiver positions were recorded at every shot using DGPS (differential global positioning system). Using such low frequencies and large wavelengths provides the advantage that more energy is transmitted into the ice, the absorption in ice is low and the signals are rather insensitive to metre-size englacial scatterers. Thus, the main return signals are from the ice/bed interface.
Radar data along profile P05-2 recorded with (a) 1–5MHz and (b) 40 MHz, both plotted in filled-wiggle mode. Greyscale of filled wiggles in (b) indicates signal magnitude (white: low; black: high). Thin lines in (a) indicate traced bedrock. Main backscatter features and interpretation are indicated on the plots. Vertical arrows mark the flowline (zero on x axis), as indicated in Figure 1. Ice flow is into the plane.
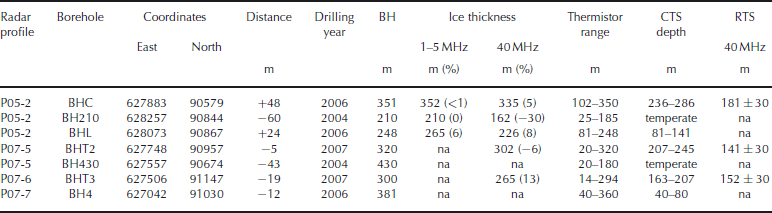
Additionally, seven profiles in the confluence area were surveyed in April 2005 and April 2007 with 40 MHz radar (Figs 2b and 3a–g), with a Reference Narod and ClarkNarod and Clarke (1994) transmitter (Icefield Instruments, Canada) and antennae based on the system developed by Reference Hempel and ThysseHempel and Thyssen (1993). Trans-mitter and receiver antennae each consisted of two dipoles slightly crossed in the horizontal plane, operated in parallel with a damped bow-tie antenna put on top for improved directivity. Antennae spacing and shot interval were 5 m. Data were recorded with a Tektronix storage oscilloscope at 2500 samples per trace with eight-fold stacking per shot. Oscilloscope recording was triggered by the first break of the airwave. Traces were recorded in a 10μs window with 4 ns sample interval. Processing includes time-domain dewowing, bandpass filtering and gain control (compensation for spherical divergence and energy decay). Ice close to the surface near borehole BHH had density ∼900 kgm − 3, corresponding to a velocity of 1.70×10⁸ ms − 1, using the empirical approximation of Reference Kovacs, Go and MoreKovacs and others (1995). For deeper ice the density, and thuswave speed, is expected to be lower because of higher pressure and small amounts of liquid water in temperate ice. Conversion of two-way travel time (twtt) to depth for all data is performed with a wave speed of 1.68×10⁸ ms − 1 for solid ice. Compared to the wave speed at the surface, this corresponds to a 1% difference. The wave speed used is also justified, a posteriori, by comparison with ice thicknesses derived from boreholes. The comparison of ice thicknesses derived with the two different radar systems allows us to evaluate uncertainties for ice-thickness estimates (Table 1).
Comparison of radar and borehole characteristics
Radargrams recorded at 40MHz, displayed in the twtt domain. (a’–g’) Ice geometry and schematic interpretation of profiles (a–g) in the depth domain, converted to elevation (m a.s.l.): surface topography (thick curves), bedrock topography (deduced from 40MHz data: thin curves; 1–5MHz data (only (b’) and (d’)): dashed curves), and depth of cold–temperate transition surface (CTS) 40MHz data, dotted curves). Vertical lines (d’–g’) show projected location of boreholes onto the nearest radar profile along tentative flowlines; thin black line indicates borehole extent without thermistors; bold lines indicate thermistor chains; and line fillings indicate temperatures: below pmp (light grey); thermistor gap containing CTS (grey, see Table 1); and temperate ice (black). Ice flow is into the plane.
Temperature logging
Between 2004 and 2007, several boreholes were drilled to bedrock with hot water (Fig. 1). After drilling, thermistor strings were deployed in the boreholes (Table 1). The strings were equipped with calibrated thermistors (Fenwal 135-107FAG-J01) and installed in the boreholes in varying increments, depicted in Figure 4. Temperatures were recorded several times after deployment, with an accuracy of 0.05 K per measurement. Logging intervals ranged between months and years, depending on the borehole, to allow for the decay of thermal perturbations caused by the drilling procedure.
Distribution of steady-state temperatures in selected boreholes. Shaded area indicates temperatures above the pmp curve for ice in equilibrium with liquid water (Reference PatersonPaterson, 1994, p. 212). Details of boreholes are given in Table 1.
Results
The low-frequency data show clear reflections from the ice/bed interface along all profiles (see example in Fig. 2).
They show no indication of any signals originating from the interior part of the glacier, because of the low frequency and long pulse length. In contrast, the 40 MHz data show three distinct features, as illustrated for profile P05-2 (Fig. 2). Firstly, the bedrock reflection is visible along the first two-thirds of the profile (from right to left), with a maximum ice thickness occurring around −100m (i.e. 100m to the left of the tentative flowline shown in Fig. 1); secondly, two areas of high backscatter (horizontal sections 200 to 350 m and −600 to −350m) from the surface downwards are visible, decreasing to a medium backscatter level below a twtt of ∼1500 ns; thirdly, a zone of low backscatter (horizontal section −200 to 200 m) at twtt values between 800 and 2200 ns is visible.
Notes: Distance refers to the distance of the borehole along a flowline from the nearest profile (>0 and <0 are down- and upstream of the profile, respectively). All depth values rounded to full metres. All boreholes drilled to bedrock. Ice thicknesses: percentage differences of radar minus borehole thicknesses in respect to radar ice thicknesses are given in parentheses. CTS depth: the ranges of cold–temperate transition surface depths result from thermistor spacings; thermistor increments vary with depth and borehole. RTS: radar transition surface, the depth of the transition from low to medium backscatter. Uncertainty range for radar depths only includes the picking uncertainty in radar data. na: not applicable (borehole outside radar profile range or no detectable bedrock/CTS signal).
Bedrock topography
The resolution of the 40MHz data is naturally better than that of the low-frequency data (i.e. the reciprocal bandwidth of either system). For the 40MHz system, λ = 4m in ice. Its source wavelet is ∼200 ns in duration (bandwidth 5MHz), which corresponds to almost 34m in ice. For a single boundary between semi-infinite half-spaces, the theoretical resolution limit is λ/4. Considering the length of the wavelet, the resolution limit of a layer detected with the 40MHz system is ∼15–20 m.
Despite the different resolutions, the ice thicknesses derived from high- and low-frequency radar data are usually in good agreement along the profiles where both datasets were recorded (Fig. 3b’ and d’). The maximum difference of both radar-based ice thicknesses is 50m (23% of the borehole ice thickness in the case of BH210; Fig. 3d’). The agreement of the 1–5MHz ice thicknesses with the borehole thicknesses at three locations is very good (differences of 1, 0 and 17) given the wavelength of the system. Comparison of low-frequency-based ice thicknesses with logging data of other boreholes drilled to bedrock (not further considered here) yields an agreement better than 10% of the ice thickness, on average (Reference Riesen, Baude and EiseRiesen and others, 2006). For the 40MHz radar, differences with borehole-based ice thicknesses range from 16 to 48m (Table 1). The largest percentage error, 30% of 40MHz radar ice thickness (or 23% of borehole thickness), occurs for a relatively small radar ice thickness of 162m (210m borehole BH210, ∼60m upstream of the profile). The other percentage differences (in respect to radar thickness) are 5, 8, 6 and 13% (with profile–borehole distances <50 m).
Apart from the technical resolution limits of either radar system, several other factors contribute to the overall uncertainty of estimated ice thickness. Our radar profiles are usually a few to tens of metres away from the boreholes. Although there is no systematic relation apparent in our dataset (Table 1), a larger distance obviously leads toworse agreement. The general bedrock roughness influences the time of first break for different wavelengths. Significant parts of Gornergletscher have become ice-free over the past few years. The now-exposed bedrock shows a roughness of the order of tens of metres. Naturally, the first (earliest) radar return from the bedrock will occur at bedrock highs. With the correct wave speed, one therefore expects that a radar thickness is, in general, smaller than a borehole ice thickness, as a borehole a few centimetres in diameter can easily be lowered in lows of bedrock roughness within the footprint ofthe radar signal. Moreover, the bedrock is a non-planar three-dimensional (3-D) surface, but our radar data only image in two dimensions, where off-profile reflections can mask the along-profile location of the bed. Reference Moran, Greenfiel, Arcon and DelaneMoran and others (2000) showed that ice-thickness errors for radar estimates with a steep bedrock topography on a glacier are ∼15% for two-dimensional (2-D) data processing and migration, and can amount to >30% for raw data.
Another factor contributing to the observed ice-thickness differences could be the presence of sediments within the basal layer of the glacier, especially in the regions close to the medial moraines and the lake with a vivid hydrological system. Because of the large wavelength, the 1–5MHz system would be much less sensitive to such sediments than the 40 MHz system.
We consider the roughness of the bed the primary factor responsible for the differences in ice thickness between the two radar systems, with a possible, but uncertain, contribution from the sediment content of the basal layer. From the differences in Table 1 we estimate an accuracy of 15% in ice thickness along the profiles for the 40 MHz data. Overall, these results provide a realistic uncertainty and indicate that the choice of a standard wave speed for migration and travel-time–depth conversion is acceptable. The interpolated bedrock topography is derived from a combination of both radar datasets. It shows a prominent overdeepening downstream of the confluence area (centred around coordinates 627400 E, 90750N in Fig. 1). The interpolated topography probably has a higher uncertainty than 15% (Reference Bauder, Fun and GudmundssoBauder and others, 2003).
High-backscatter zone
The high backscatter close to the surface occurs in the vicinity of two medial moraines, one between Gorner- and Grenzgletscher, the other between the Grenz- and Zwillings-gletscher branches. Both moraines rise several tens of metres above the surrounding glacier surface, are partly >100m wide (Fig. 1) and consist of debris varying in size from centimetres to boulders several metres in diameter. Naturally, debris of medial moraines extends vertically into the ice, although the moraine width at depth is rather of the order of metres, as evident from the highest parts of the medial moraines at the surface (Fig. 1). Since the wavelength of the 40 MHz system approaches this order of magnitude, it is much more sensitive to inhomogeneities located on the surface and within the ice than the low-frequency radar. We therefore interpret the radar scatterers, for instance observed along profile P05-2 around −600 to −350m and +250 to +350mfrom the centre line (Figs 2b and 1), as clutter mainly originating from moraine material located both along- and off-track of the profile, as well as at the surface and at depth. It is obvious that the scatter is large enough to inhibit recording the bedrock reflection in the vicinity of the moraines (Fig. 2b).
Low-backscatter zone
Along all profiles, the 40 MHz data show a zone of low backscatter in the central region (Fig. 3a–g), outlined with dotted lines in the schematic cross-sections of Figure 3a‘–g’ and vertically projected to the surface in Figure 1 (bold grey lines). The upper part of the data, from the surface down to ∼60m depth, is masked by the radar air- and ground waves. In profiles P07-1 and P05-3 the low-backscatter zone seems to extend all the way to the bedrock. In all other profiles, the maximum depth corresponds to ∼50% of the ice thickness. Laterally, the low-backscatter zone is visible over a distance of 200–400 m, partly bounded by the zone of high backscatter (e.g. at +200m in profile P05-2, Fig. 2b). The lower boundary of the low-backscatter zone is rather diffuse in most cases, varying by up to 30 m over the same along-profile distance.We take this value as the precision with which we can determine the depth of the lower boundary.
Borehole temperatures
Most temperatures in the boreholes approached an equilibrium value within a few weeks of deployment. At some locations (e.g. BH210 and BH430), the temperatures reached equilibrium only after 1–2 years. This rather long time is due to the fact that at these locations the borehole closure rate is very low because of high water pressure and ice temperatures very close to the melting point. Thermistors not reaching equilibrium values are considered faulty, or cables exposed to strain are excluded from further analysis (e.g. BHT1). Temperatures in boreholes BH430 and BH210 show a steady and almost linear decrease from −0.1 ˚ C to −0.3 ˚ C, close to the pmp (Fig. 4). Boreholes BH4, BHC, BHT2 and BHT3 indicate temperatures >1 K below the pmp for shallow to intermediate depths. The pmp is reached at different depths, depending on borehole location (Table 1). The cold– temperate transition surface (CTS) is believed to be located in the depth range between the two thermistors for which the upper one is below the pmp and the lower one is at the pmp.
Interpretation and Discussion
Borehole vs radar CTS depth
Temperatures below the pmp greatly reduce the liquid-water content, and thus reduce the backscatter observed with radar systems. We therefore suggest that the region of low backscatter observed in our radar corresponds to ice temperatures below the pmp and that its lower boundary is related to the CTS. We now investigate whether this hypothesis is consistent with borehole observations and physical mechanisms.
To compare radar backscatter and temperature measurements, we project the location of the boreholes along the flowline to the nearest radar profile. Using data in Table 1, we can compare our inferred CTS depth from radar with that from thermistor readings. At those locations where the projected boreholes cross the outlined zone of low backscatter (dotted lines in Fig. 3), the CTS observed in boreholes is generally deeper than the lower boundary of the low-backscatter zone, in the following referred to as the radar transition surface (RTS). The values differ by 11, 55 and 66 m. The smallest difference, at BHT3, is within the measurement uncertainty and supports our hypothesis. In the other two cases, the distance between borehole and profile is +48m (BHC) and −5m (BHT2). For BHC, the difference amounts to 23% of the borehole depth. For a perfect interface between cold and temperate ice (no liquidwater above CTS), these uncertainties are still in the range (although at the upper limit) of possible uncertainties (Reference Moran, Greenfiel, Arcon and DelaneMoran and others, 2000), especially given the distance between borehole and radar profile. BHT2 is located almost on the profile, and the difference amounts to 32% of borehole depth. This discrepancy cannot be explained by geometric effects alone and is discussed below in further detail. BH210 and BH430 are outside the zone of low backscatter and are both temperate. BH4 is at the southern margin of profile P07-7 (Fig. 3g’), where the RTS is already masked by the high backscatter from the moraine.
All nominal temperature values determined in BH4, BHC, BHT2 and BHT3 are below the pmp curve. These data are in accordance with data from 1975 by Reference HaeberliHaeberli (1976), who measured temperatures several Kelvin below the pmp in the same area on Grenzgletscher at depths of 44, 160 and 180m. The temperature measurements therefore indicate a massive surface layer of cold ice, with a thickness corresponding to >50% of the ice thickness in the central part of the glacier. In the vicinity of medial moraines, all boreholes indicate either temperate ice throughout (BH210, BH430), or only a shallow cold surface layer (BH4, BHL). We therefore assume that the ice at the medial moraines is temperate. This could also be assumed a priori, as, by definition, ice at medial moraines has been in contact with the bedrock upstream of the actual confluence (at elevations at or below 3000 m) where the basal ice is temperate.
The presence of cold ice in the boreholes combined with the distribution of low backscatter leads us to the conclusion that the zone of low backscatter is completely within a region of cold ice. The apparent systematic offset between the borehole CTS and RTS depth makes it, however, difficult to conclude that the RTS is related to the borehole CTS. As the radar data do not allow direct observation of temperatures, several reasons could explain this discrepancy.
It should be noted that the radar backscatter is sensitive to liquid-water content, whereas the borehole thermistors determine temperature. The liquid-water content can be inversely proportionally related to the temperature depression below the melting point, but also depends on the geometry of inclusions and the impurity content (Reference NyeNye, 1991; Reference MaderMader, 1992). The 40 MHz radar signal has a wavelength of ∼4m in ice. In order for liquid-water inclusions to act as individual scatterers at this wavelength, they need a diameter of about one-tenth of the wavelength, i.e. 0.4 m. This is less likely than the combined effect of a number of smaller scatterers in high number density.
Apart from liquid-water inclusions, the scatterers could, in general, also consist of boulders or sediments. However, as hot-water drilling of boreholes was unproblematic down to bedrock, the presence of a considerable amount of sediment in the ice is unlikely. As mentioned above, the onset of the scattering above the borehole-based CTS depth indicates that the lower boundary is still in cold ice. We are unable to think of an efficient mechanism to incorporate significant amounts of boulders or similar into the cold layer of Grenzgletscher from below. Area-wide deposition of boulders on the glacier surface from above (e.g. from an ancient rockfall) would rather result in a strong reflection horizon, comparable to that of the bed, and, moreover, inhibit successful drilling.
Another possibility for the observed difference is the separation of borehole location and radar profiles. The temperature measurements take place at different times in a Lagrangian frame of reference. This implies that the distance between a borehole and the position of a radar profile changes over time. However, this is only considered to be important on timescales of more than a year. For instance, BHT2 was drilled directly on the profile several months after the radar measurements, but also shows the offset in CTS depth. The nature of radar measurements and the conversion of observed signal backscatter in the travel-time domain to a depth domain along the radar profile introduce further errors. Above, we estimated an uncertainty of 30 m for the location of the RTS in the radargram. The wave speed used to convert radar travel time to depth introduces an error of ∼10–15%, comparable to the uncertainty for ice thickness presented above. The CTS is a 3-D surface and shows variations with depth, details of which we do not know. It might therefore be possible that some backscatter originates from off-nadir directions. As the scatter appears as clutter and not as defined hyperbolae, it is unfortunately not possible to reduce the noise by migration processing. Whether this backscatter is caused by a rough surface of the CTS or simply single large objects above the CTS (e.g. an individual collection of water pockets along and off the profile) cannot be determined from our data.
Seasonal variations of water pressure, which is close to overburden pressure in spring (personal communication from M. Werder, 2008), could also contribute to the observed differences in borehole-CTS and RTS depths. A number of hairline cracks are present on the tongue, partly remaining from icefalls upstream, partly forming every year when the lake is filling. Although cold ice is impermeable on the intergranular scale (Reference PatersonPaterson, 1994), the highwater pressure could cause penetration of liquid water into the cracks to shallower depths and enable the formation of local water pockets, even in those parts where the bulk of the ice is cold. Despite decreasing water pressure after the melt season, some liquid water could still remain above the CTS and refreeze only slowly over time, depending on the thermal state of the surrounding ice, thus leading to the formation of liquid-water pockets acting as scatterers within the cold ice. A final contribution to backscatter above the CTS is the gradual increase of liquid-water content, again for temperatures below the pmp. However, Reference Pettersson, Jansso and HolmlunPettersson and others (2003) showed that these inclusions cause very little backscatter.
Summarizing these considerations, we conclude that the first part of our hypothesis is correct: the low-backscatter zone detected with the 40 MHz radar does indeed correspond to a zone of low liquid-water content, indicating cold ice. For the second part of our hypothesis, however, we conclude that at the utilized frequency the lower boundary of the low-backscatter zone should only be considered a critical transition in liquid-water content in respect to the characteristics of the radar system, indicating some upper limit of the CTS, rather than a direct proxy for the CTS.
Relevance of a cold surface layer
The surface layer of cold ice influences various properties of the glacier. Its significance for hydrology is most easily recognizable by the abundance of superficial lakes and channels on the glacier tongue. The properties of the ice dam blocking the lake, as well as the closure rate of the drainage channel, located either sub-or intraglacially, depend on ice viscosity, which, in turn, depends on ice temperature. The presence of cold ice could thus potentially influence the drainage mechanism of the lake and the characteristics of the jökulhlaup. Although the distribution of glacier velocity, dominated by basal motion, is probably not influenced by cold ice most of the time, the exceptional behaviour occurring during the lake outburst flood, as observed by Reference Sugiyama, Baude, Weis and FunSugiyama and others (2007), could be influenced by the different properties and the spatial distribution of cold ice.
Determining the distribution of cold ice on the surface of the glacier tongue could open several opportunities for palaeoclimate research. Firstly, if the bubbles enclosed by cold ice have lain undisturbed since formation, they will contain past atmospheric information (Reference HaeberliHaeberli, 1976). Secondly, large volumes of old ice could be used for improving and developing analytical methods for palaeoclimate research (e.g. carbon dating). Gornergletscher thus provides easy access to an atmospheric archive of past European climate at its surface, with fewer logistical problems than encountered in ice-core drilling operations.
Previous studies provided a sequence of the thermal spatial regime of Grenzgletscher based on borehole measurements alone. Based on our interpretation of the radar and temperature data and the general behaviour and properties of the Grenzgletscher branch, we can extend the distribution of the thermal regime along the centre flowline in the following sequence:
-
1. Cold ice originates in the accumulation region at high elevations where the glacier is cold throughout and frozen to bed (Reference Haeberli and FunHaeberli and Funk, 1991; Lüthi and Funk, 2001; Reference Suter, Laternse, Haeberl, Frauenfelde and HoelzlSuter and others, 2001; Reference Eisen, Nixdor, Kec and WagenbacEisen and others, 2003).
-
2. In the lower accumulation region and the upper ablation region (including the equilibrium line), temperate firn and ice are present as a surface layer on top of a cold layer of ice.
-
3. At some point, strain heating and geothermal heat flux cause the onset of melting at the base. The exact position of this onset is unknown. It could be at a higher elevation than the appearance of zone 2 at the surface.
-
4. In the intermediate ablation area, including our area of investigation, the temperate surface layer from zone 2 has completely melted. Thus cold ice originating from zone 1 emerges at the surface. Temperate ice persists underneath as a basal layer. In the confluence area of Gorner- and Grenzgletscher the cold layer occupies about the central half of the width of the Grenzgletscher branch at the surface. The thickness of the temperate basal layer amounts to ∼50% of the ice thickness at maximum.
-
5. In the lowest ablation region, temperate surface ice from zone 2 and the cold-ice layer from zone 1 have completely melted. The temperate basal ice layer is present throughout the glacier. Apart from zone 1, the lateral parts of Grenzgletscher (including the medial moraines) are temperate.
Under a changing climate forcing, as currently experienced (Reference Huss, Baude, Werde, Fun and HocHuss and others, 2007), the position of the CTS will change. The different contributions to a changing CTS (advection and temperature forcing) can be analysed by modelling approaches. Earlier studies (Reference Blatter and HaeberlBlatter and Haeberli, 1984) employed a 2-D model to determine the temperature distribution in Grenzgletscher along a flowline, using local temperature measurements as boundary conditions. Although a 2-D flow model can provide information about the present thermal regime of an ice body (e.g. Reference Funk, Echelmeye and IkeFunk and others, 1994b), it is likely that such an approach will not suffice to pin down all components of the energy balance for a CTS’s 3-D geometry, as presented here. Although a time-dependent 2-D model will improve results, full 3-D modelling in a non-steady state seems necessary, if all components of the thermal regime need to be quantified.
Conclusion and Outlook
We have related the backscatter properties of 40 MHz radar on the Grenzgletscher branch of Gornergletscher to the thermal distribution in the glacier. The transition from a massive surface layer of low backscatter to a basal layer of medium backscatter in the central part of the glacier probably corresponds to a change in liquid-water content. It indicates an upper limit of the CTS depth, as evident from thermistor records in several boreholes. We cannot provide a conclusive reason for the difference in the larger CTS depth observed in boreholes and the onset of medium backscatter, the RTS, at smaller depths in the radar data. A relationship to the presence of local pockets of liquid water, caused by seasonal penetration of liquid water under high pressure into cracks within cold ice, is likely, as are uncertainties in radar depths and geometric effects. As Grenzgletscher is not in steady state, this problem can only be resolved with a transient 3-D thermomechanical model, taking into account time-dependent vertical and also lateral heat fluxes.
Our measurements provide a baseline for future observations. Comparable interpretations for linking observed climate warming and changing CTS depth and distribution, as carried out by Reference Pettersson, Jansso and HolmlunPettersson and others (2003) at Storglaci¨aren, Sweden, mainly require improved accuracy of the radar measurements. Extrapolating the negative mass-balance trend observed over the last 70 years (Reference Bauder, Fun and HusBauder and others, 2007; Reference Huss, Baude, Werde, Fun and HocHuss and others, 2007), it can be expected that the volume of cold ice will decrease. Firstly, increasing mean air temperatures in the firn region leads to a higher firn temperature and thus reduced flux of cold ice down-glacier; secondly, increased ablation reduces the flux of cold ice downwards of the confluence area; and, thirdly, the ongoing thinning of the glacier tongue will further reduce the volume of near-surface cold ice.
Acknowledgements
The Gorner Project is funded under grants 200021-103882 and 200020-111892 of the Schweizerischen Nationalfonds. O. Eisen is funded by the ‘Emmy Noether’ programme of the Deutsche Forschungsgemeinschaft. The Swiss military provided logistical support with helicopter transports and the International Foundation High Altitude Research Stations Jungfraujoch and Gornergrat (HFSJG) provided support for personnel transport. We acknowledge comments of two anonymous referees andW.Haeberli for improving an earlier version of this work. Special thanks to casa Mark, Sotto Il Vigno.



