INTRODUCTION
Biodiesel production has increased in recent years leading to increased stocks of crude glycerine (CG), an energy-rich co-product available for livestock producers (Avila-Stagno et al. Reference Avila-Stagno, Chaves, He, Harstad, Beauchemin, McGinn and McAllister2013). Glycerol, the main component of CG, is primarily converted to propionate within the rumen, showing the potential to decrease methane production and improve energy efficiency by ruminants (Garton et al. Reference Garton, Lough and Vioque1961; Krueger et al. Reference Krueger, Anderson, Tedeschi, Callaway, Edrington and Nisbet2010; Lee et al. Reference Lee, Lee, Cho, Kam, Lee, Kim and Seo2011). Previous studies evaluating pure glycerol or CG as a supplementary feed were conducted with cattle fed grain-rich diets, where the supplement often replaced a starch-rich grain ingredient, and results have indicated that the impact of the glycerol or CG supplementation on animal performance is dose-dependent. For example, there was no effect of CG on milk yield by dairy cows supplemented with glycerol at a rate of up to 300 g/cow/day (Chung et al. Reference Chung, Rico, Martinez, Cassidy, Noirot, Ames and Varga2007; Wang et al. Reference Wang, Liu, Huo, Yang, Dong, Huang and Guo2009; Boyd et al. Reference Boyd, Bernard and West2013; Omazic et al. Reference Omazic, Traven, Bertilsson and Holtenius2013), whereas a negative impact was observed in dairy cows receiving 400 g/day of glycerol (Boyd et al. Reference Boyd, Bernard and West2013). Results from studies with growing cattle managed as feedlot indicated the CG could be included in the diet at a proportion of up to 80 g/kg dry matter (DM), even though a greater proportion of CG could be used in combination with dried distillers grains (Parsons et al. Reference Parsons, Shelor and Drouillard2009; Gunn et al. Reference Gunn, Lemenager, Buckmaster, Claeys and Lake2011; Hales et al. Reference Hales, Kraich, Bondurant, Meyer, Luebbe, Brown, Cole and MacDonald2013). In the same way, body weight (BW) gain by cattle grazing a tropical pasture and receiving supplementation with concentrate at a rate of 7 g/kg BW was positively impacted when CG was included in the concentrate in a proportion of up to 280 g/kg DM (San Vito et al. Reference San Vito, Lage, Ribeiro, Silva and Berchielli2015), whereas a negative effect was obtained when it was added to the concentrate in a proportion of 430 g/kg DM (Farias et al. Reference Farias, Prado, Valero, Zawadzki, Silva, Eiras, Rivaroli and Lima2012). The dose-dependent effect of glycerol or CG supplementation was also observed in an in vitro trial (Abo El-Nor et al. Reference Abo El-Nor, AbuGhazaleh, Potu, Hastings and Khattab2010) and in a few studies with sheep, where the dietary inclusion of CG at a rate of up to 120 g/kg DM did not affect BW gain or wool yield (Meale et al. Reference Meale, Chaves, Ding, Bush and McAllister2013) whereas increasing the inclusion of pure glycerol from 70 to 210 g/kg DM led to linear decreases in DM intake and final BW by weaned lambs (Avila-Stagno et al. Reference Avila-Stagno, Chaves, He, Harstad, Beauchemin, McGinn and McAllister2013).
In most of the studies reported above, animals were kept in pens and received total mixed diets. However, in regions of South America most sheep are raised on grasslands and usually receive feed supplementation when pasture allowance is limited. However, the nutritional impact of using CG as a supplementary feedstuff for sheep fed only forage has not been reported. As pointed out by Hess et al. (Reference Hess, Lake and Gunter2008), the utility of CG as a feed additive for forage-fed ruminants depends largely on how well the animals are able to utilize the glycerol and other dietary components when CG is added to the diet. Therefore, the opportunity for improving nutrient supply by CG supplementation is expected to be different in animals fed a tropical (C4) compared with those fed a temperate (C3) grass forage. Temperate grasses are usually more digestible and have greater total and soluble nitrogen (N) content than tropical grasses. Thus, when glycerol is an energetic substrate for both rumen bacteria and animal, it could be hypothesized that CG supplementation might improve digestible organic matter (OM) intake and α-amino N supply in the small intestine of animals fed either C3 or C4 grass forage and, additionally, could reduce rumen ammonia concentration and urinary N losses in animals fed the C3 grass forage. Thus, the present study was conducted to evaluate the nutritional impact of increasing the levels of CG supplementation for sheep fed Avena strigosa or Cynodon sp. as the sole feedstuff (Trial 1). Additionally, the rate of glycerol disappearing from rumen fluid was also assessed (Trial 2).
MATERIALS AND METHODS
Feedstuffs, animals, housing and experimental design
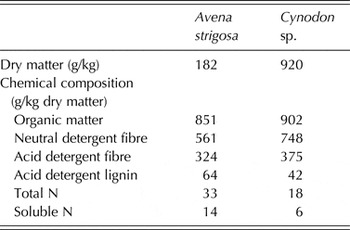
Research protocols followed the guidelines recommended by the Animal Care and Ethical Committee of the Universidade Federal de Santa Maria. In Trial 1, eight Polwarth wethers (26 ± 3·4 kg BW), housed in metabolic cages (1·30 × 0·55 m2) equipped with a faeces collector and using harnesses for total urine collection, were used in two 4 × 4 Latin Square trials to evaluate the effect of CG supplementation on intake and digestion processes. At least 3 weeks before starting the experiment, sheep were fitted with a chronic rumen catheter (siliconized polyvinyl chloride (PVC), 35 cm length, 10 mm external diameter, 7 mm internal diameter) and a duodenal cannula. Treatments consisted of no CG (control, CON) or intra-ruminal infusion of CG twice daily, just after the morning and afternoon meals, at a daily rate of 0·5, 1·5 or 3·0 ml/kg BW. The CG contained 782 g DM/kg, 920, 2·6 and 6 g/kg DM of OM, crude protein and ether extract, respectively, 38 mg sodium/ml and 0·84 g glycerol/ml. In each Latin Square, four animals were fed frozen Avena strigosa Schreb and four were fed Cynodon sp. hay. Both forages were offered ad libitum (100–200 g orts/kg) at 08.00 and 17.00 h. The chemical composition of experimental forages is shown in Table 1. Wethers had free access to water and to a mineral salt containing (g/kg): calcium, 100; phosphorus, 45; sulphur, 4·12; sodium, 205; cobalt, 0·025; copper, 0·450; iron, 1·5; iodine, 0·05; manganese, 1·0; selenium, 0·009; zinc, 2·52 and fluorine, 0·45. The Avena strigosa was obtained from a pasture fertilized monthly with 25 kg N/ha, being harvested when the swards reached a height of approximately 30 cm. The pasture was harvested by cutting 5 cm above the ground level and stored at –20 °C until feeding to reduce plant tissue metabolism. The Cynodon sp. hay was obtained from a commercial store.
Chemical composition of experimental forages

Experimental periods lasted for 15 days, with 10-days adaptation and 5-days collection periods. Feed was weighed and sampled daily from day 11 to 15 of each experimental period. Total feed orts and faeces were taken daily throughout the collection period and stored at –20 °C. At the end of each experimental period they were weighed, homogenized and a sample (100 g/kg of wet weight from each sheep) was collected. All samples were oven-dried at 55 °C for at least 72 h, ground through a 1-mm screen (Willey mill, Arthur H. Thomas, Philadelphia, PA, USA) and pooled by animal and period for subsequent chemical analysis. Total urine was collected daily during the collection period in buckets containing 100 ml of 3·6 M sulphuric acid (H2SO4). Volume was measured and a sample of 10 ml/l was diluted to 50 ml with distilled water and stored frozen (−20 °C) until analysis. On days 11–14, duodenal digesta samples (100 ml) were collected at 12-h intervals, advancing 3 h throughout the days to obtain 3-h interval samples over a 24-h period. These samples were composited within animal and period and stored frozen (–20 °C). For analysis, they were thawed, dried in a forced-air oven (55 °C) and ground to pass through a 1-mm screen. Before drying, an aliquot of the duodenal fluid (10 ml) was taken and stored at –20 °C for ammonia N analysis. On day 15 of each period, rumen fluid samples (approximately 100 ml) were collected at 0, 2, 4, 6, 8, 10, 12, 14, 16, 18, 20 and 22 h, starting just before the morning meal (time 0). These samples were filtered through a 50 × m nylon filter and the pH was immediately measured with a digital pH meter (Marte Ltda, MG, Brazil). One aliquot (18 ml) of filtered fluid was removed and 2 ml of 3·6 M H2SO4 was added. Samples were centrifuged (4000 g for 20 min) at room temperature and the supernatants collected and stored frozen at –20 °C.
Glycerol analysis in acidified rumen fluid samples from Trial 1 did not perform adequately. Thus, a second trial (Trial 2) was conducted specifically to measure the rate of glycerol disappearing from rumen fluid using the same animals, diets and treatments described for Trial 1, except that Latin Squares were not repeated. Moreover, due to forage availability constraints, experimental periods were only 5 days long. On day 5 of each period, rumen fluid samples (approximately 100 ml) were collected immediately before and at 2, 4, 6 and 8 h after the CG infusion into the rumen. These samples were filtered through a 50 µm nylon filter, one aliquot removed, centrifuged (4000 g for 20 min) and the supernatant collected and stored frozen at –20 °C for glycerol analysis.
Chemical analysis
Dry matter content was determined by drying at 105 °C for at least 16 h. Ash was determined by combusting at 600 °C for 3 h and OM by mass difference. Total N was assayed by a Kjeldahl method (Method 984.13 of AOAC 1997). The neutral detergent fibre (NDF) included ash and was analysed according to procedures described by Mertens (Reference Mertens2002) with use of heat-stable α-amylase and without sulphite. The concentration of acid detergent fibre (ADF) was analysed according to Method 973.18 of AOAC (AOAC 1997), except that the samples were weighed into polyester filter bags (porosity of 16 µm) and treated with neutral or acid detergent in an autoclave at 110 °C for 40 min (Senger et al. Reference Senger, Kozloski, Sanchez, Mesquita, Alves and Castagnino2008). For sulphuric-acid lignin (ADL) analysis, the bags containing residual ADF were treated with 12 M H2SO4 for 3 h (Method 973.18 of AOAC 1997). Analysis of neutral detergent insoluble nitrogen (NDIN) and soluble N were performed according to Licitra et al. (Reference Licitra, Hernandez and Van Soest1996). Total N in urine samples was assayed by the Kjeldahl method. Duodenal supernatant samples were analysed for ammonia N concentration following the procedures described by Weatherburn (Reference Weatherburn1967). Dried duodenal samples were analysed for purine bases (PB) according to Makkar & Becker (Reference Makkar and Becker1999) and for α-amino N concentration using a non-automated colorimetric method adapted from Palmer & Peters (Reference Palmer and Peters1969) as described by Hentz et al. (Reference Hentz, Kozloski, Orlandi, Ávila, Castagnino, Stefanello and Estivallet Pacheco2012). Rumen fluid samples acidified with H2SO4 were analysed for ammonia N using the phenol-hypochlorite method (Weatherburn Reference Weatherburn1967). For glycerol analysis in non-acidified rumen fluid samples, an enzymatic commercial kit (Bioclin, Quibasa, Belo Horizonte, MG, Brazil) was used.
Calculations
The apparent digestibility of feed fractions was calculated as follows: (intake (g/day) – faecal excretion (g/day))/intake (g/day). The true digestibility of OM was estimated considering that neutral detergent soluble fractions of the faeces are endogenous in origin and only the NDF fraction of faeces originated from feed (Van Soest Reference Van Soest1994) as follows: (OM intake (g/day) – faecal NDF (g/day))/OM intake (g/day). The true digestibility of N compounds was estimated considering that neutral detergent soluble N of the faeces are of endogenous origin and only the NDIN fraction of faeces originated from feed (Van Soest Reference Van Soest1994) as follows: (N intake (g/day) – faecal NDIN (g/day))/N intake (g/day).
The duodenal flow of DM (g/day) and its respective components was estimated based on ADF concentration in duodenal digesta and faeces as follows: (faecal DM (g/day) μ faecal ADF (g/kg of DM))/duodenal ADF (g/kg of DM). The option for using this marker was based on results from preview studies with sheep fitted with re-entrant duodenal cannula (Porter & Singleton Reference Porter and Singleton1971; Charmley & Veira Reference Charmley and Veira1990), where most of the cellulose entering the duodenum was excreted in faeces, and from a study with cattle where the mobile nylon bag technique was used (Kozloski et al. Reference Kozloski, Stefanello, Mesquita, Alves, Ribeiro Filho, Almeida and Moraes Genro2014), reporting no significant disappearance of ADF in the lower gastrointestinal tract. Thus, it was assumed that even if some cellulose digestion had occurred in the lower gastrointestinal tract, resulting in some level of bias, it did not invalidate treatment comparisons in the present study.
The ruminal OM digestibility was calculated as follows: (OM intake (g/day) – duodenal OM (g/day))/OM intake (g/day). The amount of microbial nitrogen flowing to the small intestine was estimated based on the amount of duodenal purines, assuming that the N content in purines is 0·49 and the ratio purine N: microbial N is 0·116 (Chen & Gomes Reference Chen and Gomes1992). The efficiency of microbial protein synthesis (EMPS, g microbial N/kg digested OM) was calculated either by considering only the OM ingested from forage (EMPS) as: microbial N (g/day)/rumen digestible OM (kg/day), or by including the amount of infused glycerol in the rumen digested OM (EMPSgly) as: microbial N (g/day)/(rumen digestible OM (kg/day) + (CG (l/day) × 0·84)). Duodenal flow (g/day) of non-ammonia non-microbial N (NANMN) was calculated as: duodenal N (g/day) – (microbial N (g/day) + ammonia N (g/day)). The ruminal degradability of dietary N (RDN) compounds was calculated without correction for N from endogenous origin as: 1 – (NANMN (g/day)/ N intake (g/day)). The duodenal flow of glycerol (mg/day) was calculated as: (duodenal DM (g/day) × ((1 – DM in duodenal digesta (g/g))/DM in duodenal digesta (g/g))) × glycerol in duodenal fluid (mg/ml).
Statistical analysis
Data was analysed using the MIXED procedure of SAS version 9.2 (SAS Institute 2009) following the model: Y = μ + A + P + F + T + (F × T) + ε, where Y is the dependent variable, μ is the overall mean, A is the random effect of the animal, P is the random effect of the period, F is the fixed effect of forage type, T is the fixed effect of the CG treatment and ε is the residual error. The fixed effect of Latin Square was tested previously and was not significant. Therefore, it was excluded from the model. Data derived from rumen samples collected at each sampling interval were included as repeated measurements in the model described above. Orthogonal contrast analysis was used to compare the CON v. 0·5 CG, and to test the linear and quadratic effects of treatments. The CON treatment was initially included for testing the linear and quadratic effects. However, no quadratic effect was detected for any variable and only linear effects were significant. Using this procedure, it would not be possible to highlight the similarity between the control and the lowest level of CG infusion treatment for relevant variables. Thus, this analysis was run again, excluding the CON and including only the CG treatments. The rate of glycerol disappearance from rumen fluid after CG infusion in Trial 2 was analysed through linear regression, excluding the values at time 0.
RESULTS
Intake and total tract digestibility
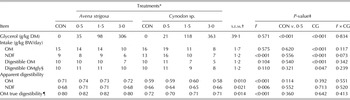
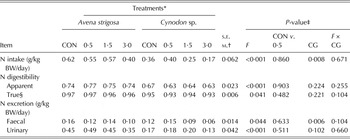
No significant interaction between forage type and CG treatment was detected. The actual concentration of glycerol in the diet was similar for both forage types and increased linearly (P < 0·05) from on average 28 to 108 and to 335 g/kg DM at increased levels of ruminal infusion of CG (Table 2). Except for NDF intake, which was greater (P < 0·05) in sheep fed Cynodon sp., total and digestible OM intake were not affected by forage type, and were similar between the CON and the 0·5 CG treatment. All these variables were negatively and linearly affected by increasing the levels of CG infusion (P < 0·05). The OM and NDF digestibility were greater (P < 0·05) in sheep fed Avena strigosa and were not affected by CG infusion. The N intake and N faecal excretion were greater (P < 0·05) for Avena strigosa than for Cynodon sp. and decreased linearly (P < 0·05) at increased levels of CG infusion (Table 3). The digestibility and urinary excretion of N compounds were greater (P < 0·05) in sheep fed Avena strigosa than in those fed Cynodon sp. Neither N digestibility nor urinary N excretion were affected by CG infusion.
Dietary glycerol concentration, intake and total digestibility of organic matter (OM) and neutral detergent fibre (NDF), and digestible energy (DE) intake by wethers fed Avena strigosa or Cynodon sp. and ruminally infused with levels of crude glycerine (CG)

DM, dry matter; BW, body weight.
* Wethers were fed ad libitum with a temperate or a tropical grass and ruminally infused with CG at a rate of 0·5, 1·5 or 3·0 ml/kg BW/day. Control (CON) treatments (i.e. no CG infusion) were included.
† Standard error mean where n = 8 per treatment.
‡ Probability of Type I error where: F, effect of forage type; CON v. 0·5, contrast between control v. 0·5 ml/kg BW/day; CG, linear contrast between CG treatments (0·5 v. 1·5 v. 3·0 ml/kg BW/day); F × CG, interaction between forage type and CG treatments.
§ (OM intake (g/kg BW/day) + (CG (ml/kg BW/day) × 0·84))) – faecal OM (g/kg BW/day).
¶ (OM intake (g/day) – faecal NDF (g/day))/OM intake (g/day).
Nitrogen utilization by wethers fed Avena strigosa or Cynodon sp. and ruminally infused with levels of crude glycerine (CG)

BW, body weight.
* Wethers were fed ad libitum with a temperate or a tropical grass and ruminally infused with CG at a rate of 0·5, 1·5 or 3·0 ml/kg BW/day. Control (CON) treatments (i.e. no CG infusion) were included.
† Standard error mean where n = 8 per treatment.
‡ Probability of Type I error where: F, effect of forage type; CON v. 0·5, contrast between control v. 0·5 ml/kg BW/day; CG, linear contrast between CG treatments (0·5 v. 1·5 v. 3·0 ml/kg BW/day); F × CG, interaction between forage type and CG treatments.
§ (N intake (g/day) – neutral detergent insoluble N in faeces (g/day))/N intake (g/day).
Rumen fluid parameters
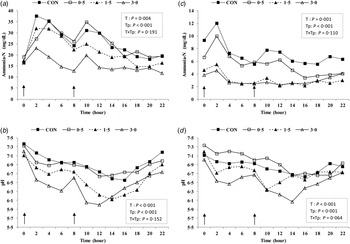
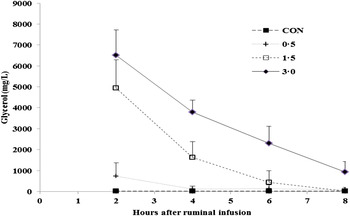
No significant interactions between forage type, CG treatment and time were detected for rumen pH and ammonia N concentration (Trial 1). Rumen fluid pH was not affected by forage type and was not different between the CON and 0·5 CG treatment, whereas it decreased linearly (P < 0·05) at increased levels of CG infusion (Fig. 1). The concentration of ammonia N in rumen fluid was greater (P < 0·05) in sheep fed Avena strigosa than in those fed Cynodon sp. For both forage types, the ammonia N concentration was similar between the CON and 0·5 CG treatment, whereas it decreased linearly (P < 0·05) with increasing levels of CG infusion. On average, glycerol concentration in rumen fluid (Trial 2) was not affected by forage type and was related linearly (P < 0·05) to the amount of CG infused into the rumen (Fig. 2), although a significant treatment × time interaction (P < 0·05) was detected. Mean values were negligible and not affected by time in the CON treatment, whereas they decreased linearly (P < 0·05) over time after rumen infusion at increased levels of CG infusion. For the 0·5 and 1·5 levels of CG infusion, negligible glycerol concentrations were detected in rumen fluid at 4 and 8 h after CG infusion, respectively. For the highest level of CG infusion (i.e. 3·0 ml/kg BW/day), relatively high glycerol concentrations in rumen fluid were still observed even 8 h after CG infusion.
Rumen fluid pH and ammonia nitrogen (N) concentration in wethers fed ad libitum Avena strigosa (Panels a and b) or Cynodon sp. (Panels c and d), not infused (control (CON)) or ruminally infused with crude glycerine at a daily rate of 0·5, 1·5 or 3·0 ml/kg body weight. The arrows indicate the meals. Standard error means were: pH = 0·102 and ammonia N = 2·30, where n = 96 per treatment.

Glycerol concentrations in rumen fluid of wethers fed ad libitum oat grass or Cynodon sp., not infused (control (CON)) or ruminally infused with crude glycerine at a daily rate of 0·5, 1·5 or 3·0 ml/kg body weight. No interaction was detected between forage type, time and treatment (P = 0·173) and, thus, values in Figure are means of both forage types. Treatment × time interaction: P < 0·001. Linear effect of time within treatments: CON, P = 0·296; 0·5, P = 0·112; 1·5, P < 0·001 and 3·0, P < 0·001. Standard error means: 398·7, where n = 32 per treatment.

Duodenal flow, ruminal digestibility and rumen microbial protein synthesis
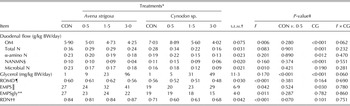
No significant interaction between forage type and CG treatment was detected, and except for duodenal flow of glycerol, all variables were similar between the CON and 0·5 CG treatment (Table 4). Duodenal flow of glycerol increased linearly with increasing levels of CG infusion (P < 0·05). The duodenal flow of OM was greater (P < 0·05) for Cynodon sp., and the duodenal flow of microbial N, the ruminal digestibility of OM, the ruminal degradability of feed N compounds and the EMPS were greater (P < 0·05) for Avena strigosa than for Cynodon sp. The duodenal flow of microbial N, ruminal digestibility of OM and the ruminal degradability of feed N compounds were not affected by CG. All other duodenal variables decreased linearly (P < 0·05) at increased levels of CG infusion.
Duodenal flow and ruminal digestibility of organic matter (OM) and N compounds in wethers fed Avena strigosa or Cynodon sp. and ruminally infused with levels of crude glycerine (CG)

DM, dry matter; BW, body weight.
* Wethers were fed ad libitum with a temperate or a tropical grass and ruminally infused with CG at a rate of 0·5, 1·5 or 3·0 ml/kg BW/day. Control (CON) treatments (i.e. no CG infusion) were included.
† Standard error mean where n = 8 per treatment.
‡ Probability of Type I error where: F, effect of forage type; CON v. 0·5, contrast between control v. 0·5 ml/kg BW/day; CG, linear contrast between CG treatments (0·5 v. 1·5 v. 3·0 ml/kg BW/day); F × CG, interaction between forage type and CG treatments.
§ Non-ammonia, non-microbial N, calculated as: duodenal N (g/day) – (microbial N (g/day) + ammonia N (g/day));
¶ ROMD, ruminal OM apparent digestibility.
║ EMPS, efficiency of rumen microbial protein synthesis calculated as: (g of microbial N/kg of rumen digestible OM).
** EMPSgly, efficiency of rumen microbial protein synthesis as: microbial N (g/day)/(rumen digestible OM (kg/day) + (CG (l/day) × 0·84)).
†† RDN, ruminal degradability of feed N compounds.
DISCUSSION
Previous studies have reported that the inclusion of a low proportion of CG in high-grain diets shows the potential to improve ruminant performance (Drouillard Reference Drouillard and Makkar2012). In the present study, however, no positive nutritional effect of CG was observed and, instead, at ruminal infusion rates >0·5 ml/kg/BW, the impact of CG supplementation on nutrient supply for sheep was negative, clearly the consequence of depressed forage intake. In turn, no significant effect of CG infusion on OM or NDF digestibility was observed, representing an advantage of CG compared with starch-rich supplements, which usually decrease fibre digestibility. Because forage intake decreased and CG infusion was based on BW, the glycerol concentration at the highest level of infusion (i.e. 3·0 ml/kg/BW) may have exceeded the optimum. The CG inclusion rate of 335 g/kg DM in the current experiment was above the inclusion rates that have been reported to decrease performance of sheep fed grain-based diets (Avila-Stagno et al. Reference Avila-Stagno, Chaves, He, Harstad, Beauchemin, McGinn and McAllister2013; Meale et al. Reference Meale, Chaves, Ding, Bush and McAllister2013). The mechanisms by which CG would reduce forage intake probably involved rumen osmotic pressure (Carter & Grovum Reference Carter and Grovum1990) and/or metabolic regulation (Illius & Jessop Reference Illius and Jessop1996). The amount of sodium infused through the CG represented, on average of both diets, 1·3, 4·9 and 15·1 g/kg DM for the 0·5, 1·5 or 3·0 ml/kg BW CG treatments, respectively. These values are largely above the 0·6 to 0·8 g of sodium/kg DM recommended by NRC (2007) and would have the potential do increase the osmolality of rumen fluid and decrease forage intake by sheep (Carter & Grovum Reference Carter and Grovum1990). From the metabolic point of view, three fates for glycerol in the rumen have been estimated, which include passage, fermentation and absorption (Krehbiel Reference Krehbiel2008; Omazic et al. Reference Omazic, Kronqvist, Zhongyan, Martens and Holtenius2015). Results from the present study indicate that passage of glycerol from the rumen is negligible, as the duodenal flow of glycerol represented on average only 0·02 of infused glycerol, even at the highest level of CG infusion. Earlier reports suggested the glycerol is rapidly fermented to propionate by ruminal bacteria (Krehbiel Reference Krehbiel2008). However, the fractional gas production rate was slower, and the lag was longer for glycerol than for alfalfa hay or maize grain incubated in vitro (Krueger et al. Reference Krueger, Anderson, Tedeschi, Callaway, Edrington and Nisbet2010; Lee et al. Reference Lee, Lee, Cho, Kam, Lee, Kim and Seo2011). Moreover, previous observations (Garton et al. Reference Garton, Lough and Vioque1961; Omazic et al. Reference Omazic, Kronqvist, Zhongyan, Martens and Holtenius2015) and results from Trial 2 of the present study indicate that the rate of glycerol disappearing from rumen is relatively slow, since considerable glycerol concentrations remained in rumen fluid even at 6 or 8 h after CG infusion. In vitro fermentation studies suggested that species of Selenomonas were the major fermenters of glycerol (Krehbiel Reference Krehbiel2008), and AbuGhazaleh et al. (Reference AbuGhazaleh, Abo El-Nor and Ibrahim2011) reported that DNA concentration for Selenomonas ruminantium in ruminal fluid decreased at dietary glycerol concentrations above 150 g/kg DM. Thus, it is probable that a significant proportion of infused glycerol, especially at the greater levels of CG infusion, was absorbed from rumen to portal blood. Kristensen & Raun (Reference Kristensen, Raun, Ortigues-Marty, Miraux and Brand-Williams2007) infused 925 g of CG/day into the rumen of dairy cows and observed that 0·10 of infused glycerol appeared in portal blood. Independent of whether it was converted to propionate in the rumen or absorbed to portal blood, glycerol shows the potential to increase gluconeogenesis in the liver (Krehbiel Reference Krehbiel2008) and to change the profile of blood metabolites (DeFrain et al. Reference DeFrain, Hippen, Kalscheur and Jardon2004; Chung et al. Reference Chung, Rico, Martinez, Cassidy, Noirot, Ames and Varga2007; Wang et al. Reference Wang, Liu, Huo, Yang, Dong, Huang and Guo2009; Omazic et al. Reference Omazic, Traven, Bertilsson and Holtenius2013).
Roger et al. (Reference Roger, Fonty, Andre and Gouet1992) found that the growth and cellulolytic activity of Ruminococcus flavefaciens and Fibrobacter succinogenes, as well as of an anaerobic fungal species, Neocallimastix frontalis, were greatly inhibited in vitro at a glycerol concentration of 50 g/l in incubation media. Moreover, the DNA concentration for Butyrivibrio fibrisolvens in ruminal fluid was found to decrease in diets with glycerol concentrations >150 g/kg DM (AbuGhazaleh et al. Reference AbuGhazaleh, Abo El-Nor and Ibrahim2011). In the same way, fibre degradation in vitro was shown to be negatively affected at levels of glycerol >72 g/kg DM (Krueger et al. Reference Krueger, Anderson, Tedeschi, Callaway, Edrington and Nisbet2010; AbuGhazaleh et al. Reference AbuGhazaleh, Abo El-Nor and Ibrahim2011). The actual dietary concentration of glycerol in the present study varied from 21 to 364 g/kg DM and, based on previous reports, the CG infusion would be expected to have a negative impact on NDF digestibility, at least at the greater infusion levels. Furthermore, an indirect impact of CG on NDF degradation was also expected due to a reduction in rumen fluid pH, which decreased linearly at increased levels of CG infusion. However, even at the highest infusion level, pH values were generally >6·2 and most quantitative predictive models assume that at values >6·0, the pH variation has a minor impact on fibre degradation (Dijkstra et al. Reference Dijkstra, Ellis, Kebreab, Strathe, López, France and Bannink2012). Additionally, the growth and cellulolytic activity of Ruminococcus flavefaciens and Fibrobacter succinogenes, as well as of anaerobic fungal Neocallimastix frontalis, was not inhibited in vitro at glycerol concentrations of up to 10 g/l in the incubation media (Roger et al. Reference Roger, Fonty, Andre and Gouet1992). The highest values of glycerol concentration in rumen fluid observed in Trial 2 of the present study were approximately 7 g/l.
It was also hypothesized that CG infusion could reduce rumen ammonia N concentration and urinary N losses, and increase the α-amino N supply in the small intestine, especially in animals fed the temperate grass forage. As expected, rumen fluid concentration of ammonia N decreased linearly with increasing levels of CG infusion, and this effect was significant for both forage types. However, urinary N excretion was not reduced by CG infusion and, instead of a concomitant and positive effect, a negative impact of CG was observed on duodenal flow of microbial N, NANMN and α-amino N, clearly a consequence of decreased OM intake. The efficiency of rumen microbial protein synthesis was improved by CG when only the forage OM intake was accounted for (i.e. EMPS). Nevertheless, when the infused glycerol was included in the total digestible OM intake, the efficiency of rumen microbial protein synthesis (i.e. EMPSgly) was similar for all treatments. Even though the chemical composition of mixed microbial mass is affected by diet type (Rodríguez et al. Reference Rodríguez, González, Alvir, Reppeto, Centeno and Lamrani2000; Yang et al. Reference Yang, Beauchemin and Rode2001; Carro & Miller Reference Carro and Miller2002), the same total N : PB ratio in mixed microbial mass was used for calculating microbial N supply for all treatments in the present study. Despite this methodological limitation, the current results indicate that, even if some significant proportion of infused glycerol was absorbed into portal blood, most was fermented in the rumen and contributed to rumen microbial growth. Both the EMPS and EMPSgly were, on average, greater for Avena strigosa than for Cynodon sp., which is in agreement with the greater retention time of digesta into the rumen usually reported for high-fibre containing forages, and with the inverse relationship between EMPS and retention time (Russell et al. Reference Russell, O'Connor, Fox, Van Soest and Sniffen1992).
CONCLUSION
The CG supplementation at a rate of up to 0·5 ml/kg BW did not change the nutrient supply, whereas greater levels of supplementation reduced forage intake and nutrient supply to wethers fed only grass forage, independently of whether it was Avena strigosa or Cynodon sp. The forage digestibility, in turn, was not affected by CG supplementation.
The authors thank the Conselho Nacional de Desenvolvimento Científico e Tecnológico (CNPq, Brasília, DF, Brazil) and the Coordenação de Aperfeiçoamento de Pessoal de Nível Superior (CAPES, Brasília, DF, Brazil ) for research fellowship support.