

Introduction
The silkworm Bombyx mori (Bombycidae) is a lepidopteran insect of economic importance. Sericulture in India is an agro-based industry having high employment potential and providing vibrancy to village economies. Low gestation period coupled with eco-friendly activity and high returns make sericulture an ideal programme for weaker sections of the society. It is also a women-friendly occupation and satisfies equity concerns. However, mortality of silkworms due to diseases impedes the progress of this industry. In tropical countries such as India, almost all the major categories of pathogenic microbes infect and cause disease in silkworm (Rajsekhar et al., Reference Rajasekhar, Prasad, Subramanyam, Bhaskar, Murali and Govindappa1992; Doreswamy et al., Reference Doreswamy, Govindan, Devaiah and Muniswamappa2004). The most common diseases of silkworm are grasserie, caused by a virus; flacherie, caused by both a virus and bacteria; muscardine, caused by fungi; and pebrine, a microsporidian parasitic disease. The diseases prevail throughout the year, and in the tropics they are significantly high (Srivastava and Kumar, Reference Srivastava and Kumar2009). Crop loss from silkworm diseases, either partial or complete, is common in all the silkworm rearing areas in India, consequently affecting the national plan for silkworm eggs and raw silk production, and also reducing personal income.
Regular surveillance of silkworm diseases is an important aspect of integrated silkworm disease management, to make effective decision making for managing disease outbreaks. Through selection and use of appropriate techniques, suppression of disease incidence to a tolerable level is achieved. The concept of a tolerable level reflects many complex and interacting factors that are technical, economical, epizootiological and managerial in nature. It also gives an insight on the field level adoption of ‘Package & Practices’ for successful cocoon harvest that sericulture institutes recommend (Anonymous, 2008). Moreover, new disease threats may be quickly detected by regular surveillance, which can be immediately and adequately controlled with appropriate measures.
In India, mulberry sericulture is practised in almost all the states, among which Karnataka is the largest producer of raw silk followed by Andhra Pradesh and West Bengal. West Bengal produces around 11% of the total mulberry raw silk production in India (Anonymous, 2013). The three districts of West Bengal (Malda, Murshidabad and Birbhum), where sericulture is traditionally practised, are the major producers of raw silk in the state. West Bengal has long had a vibrant silk industry, and Murshidabad has long enjoyed a special reputation in this respect.
An attempt through this study has been made to understand the seasonal incidence trends of different silkworm diseases over the years 1992–2011, in the district of Murshidabad, correlating incidence with meteorological factors (temperature and humidity).
Materials and methods
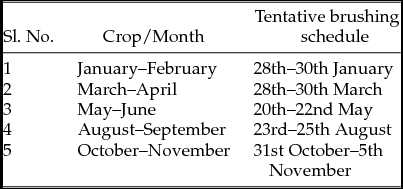
Silkworm disease surveys for the period 1992/93–2011 were analysed for this study. Five commercial crops (rearing) a year were conducted in the district as per the crop schedule (Table 1). The survival rate of multivoltine breeds and hybrids in comparison to cross breeds and bivoltine breeds and hybrids is higher during adverse climatic conditions (Chattopadhyay and Chatterjee, Reference Chattopadhyay, Chatterjee, Gupta and Mondal1990), but their cocoon shell weight is less than the other two. Hence, during the unfavourable season of May–June, multivoltine hybrids were reared. On the other hand, the March–April and August–September rearing seasons are conducive compared to May–June season, hence cross breeds were reared, as the quality of cocoons and survival rate of the silkworms were better than those of multivoltine hybrids and bivoltine hybrids, respectively. October–November and January–February are the two best seasons for rearing, in respect to the climatic conditions; and therefore, bivoltine hybrids were reared in these seasons. This has been the practice over the years and throughout the period of reporting. All the farmers selected under the study, crop-wise, had reared the same combination/hybrids.
Silkworm crop schedule of Murshidabad District, West Bengal, India

In Murshidabad District around 85% of the total 14,000 sericulture farmers (approx.) are concentrated in two blocks – Khargram and Nabagram. The remaining 15% are scattered among the rest of the 20 blocks. For the study, only these two blocks were considered. Out of the 100 villages (having a total of approximately 12,000 farmers) from these two blocks, five villages practising sericulture traditionally and having a cluster of progressive farmers were screened. The total population of sericulture farmers in these five villages was around 2400. Since most of the farmers in the region own a rearing-cum-dwelling house and average acreage of mulberry is less than one acre, only those (around 500) having separate rearing houses, mulberry acreage of more than one acre and the capacity to rear at least 100 disease free layings (dfls) in all the crops were considered. Five such farmers from each of these five villages per crop were randomly selected. Silkworm larvae were examined in 10% of rearing trays from top, middle and bottom, at random, during the V instar (4th/5th day), for disease symptoms followed by confirmation of the disease by microscopic examination in the Silkworm Pathology Laboratory. Disease incidence was expressed in percentage and calculated taking into consideration 40,000 larvae per 100 disease free layings. Meteorological data in respect to ambient maximum temperature, minimum temperature, maximum relative humidity, minimum relative humidity and average rainfall (mm) were recorded for the rearing period (brushing to spinning stage) and their relationship with the disease incidence was statistically analysed by Multiple Regression using MS Excel Data Analysis Add-in.
Results and Discussion
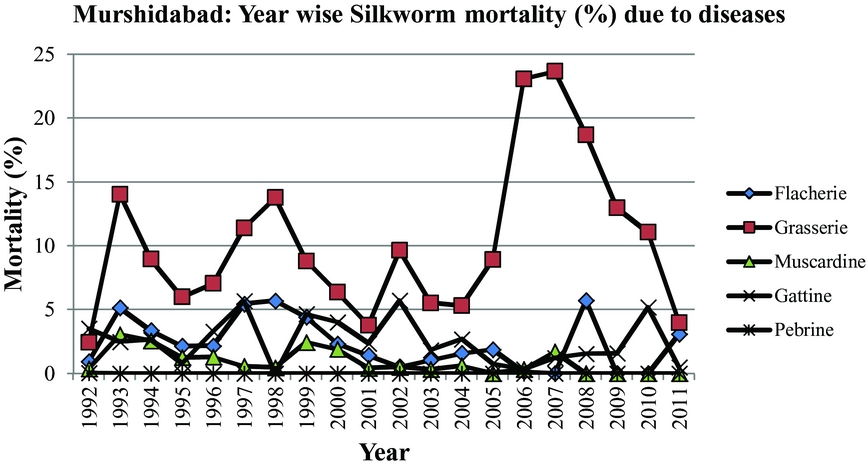
Results are summarized in Figs. 1–12. Fig. 1 shows annual average silkworm mortality due to diseases. Figs. 2–6 show crop-wise average silkworm mortality due to various diseases, i.e. grasserie, flacherie, muscardine, gattine and pebrine, and Figs. 7–12 give the crop-wise impact of the meteorological conditions on the silkworm disease incidence.
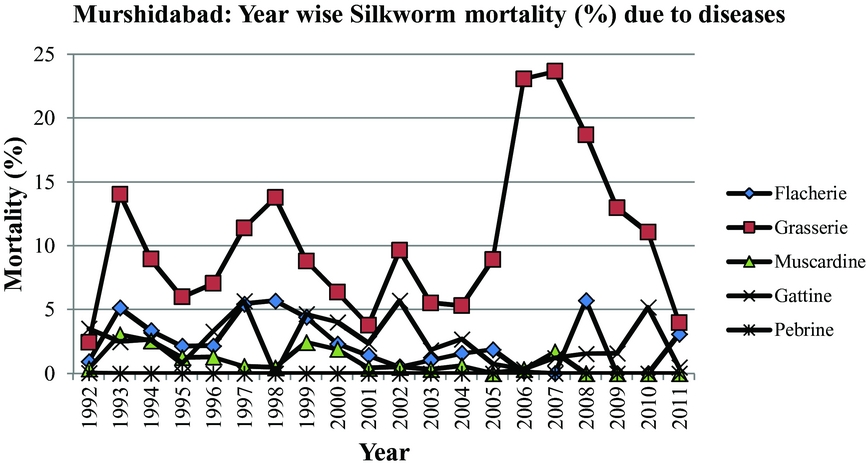
Year wise silkworm mortality (%) due to diseases.
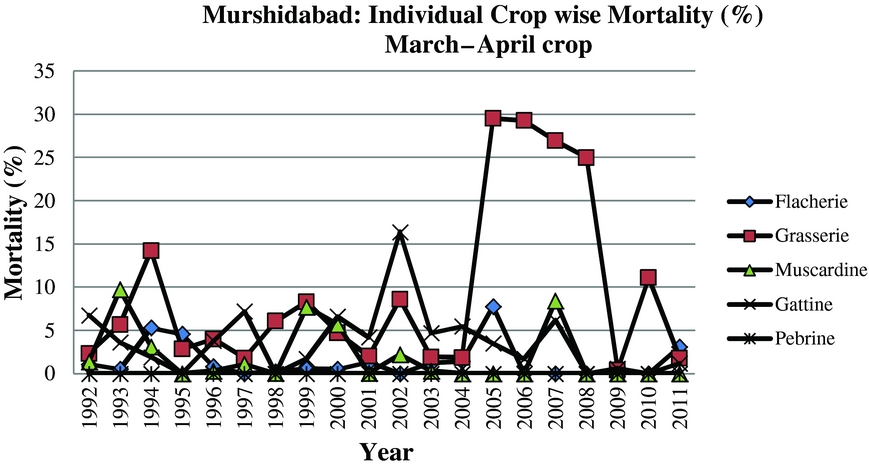
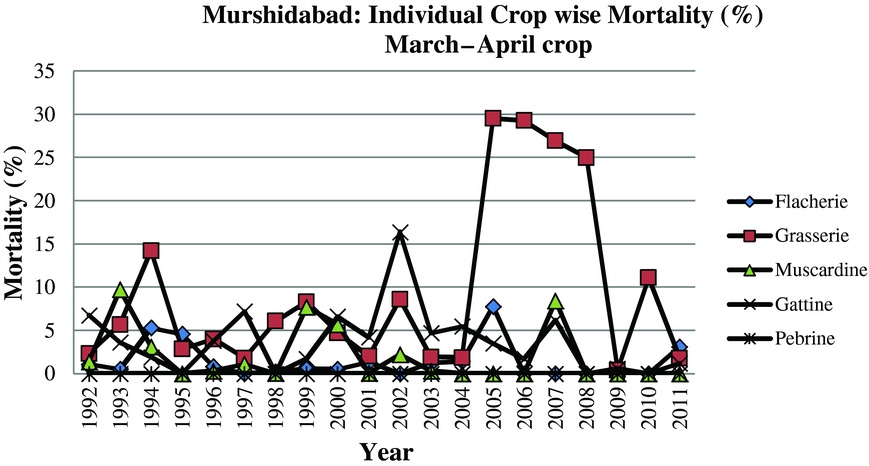
Crop wise silkworm mortality (%) due to diseases (March–April crop).
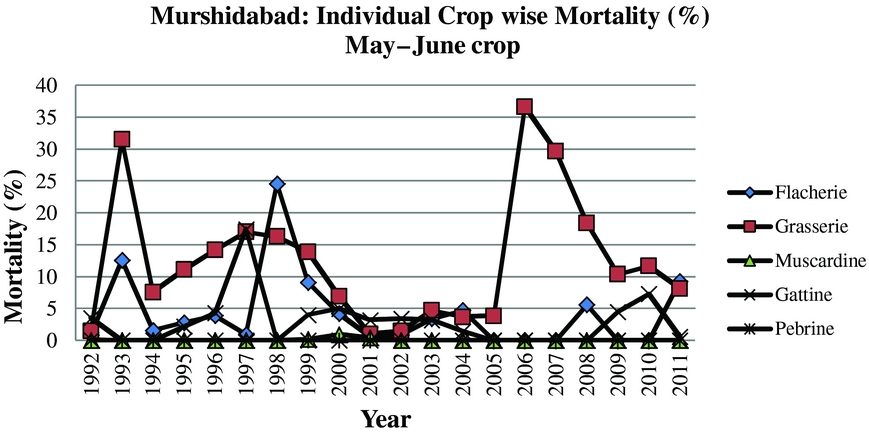
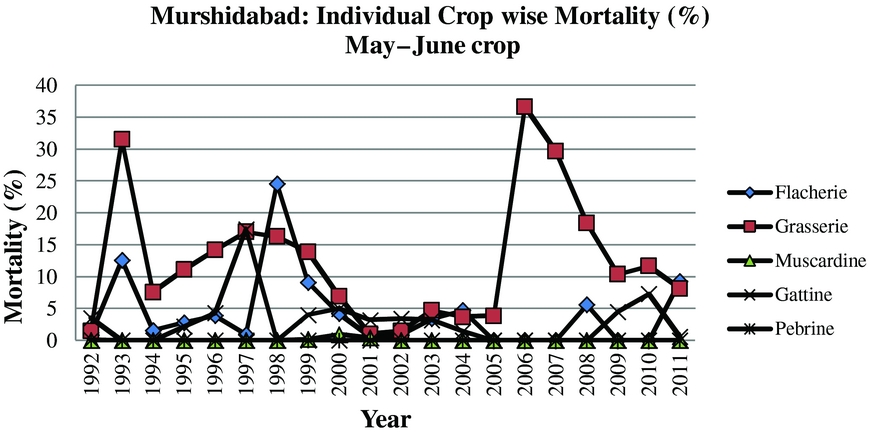
Crop wise silkworm mortality (%) due to diseases (May–June crop).
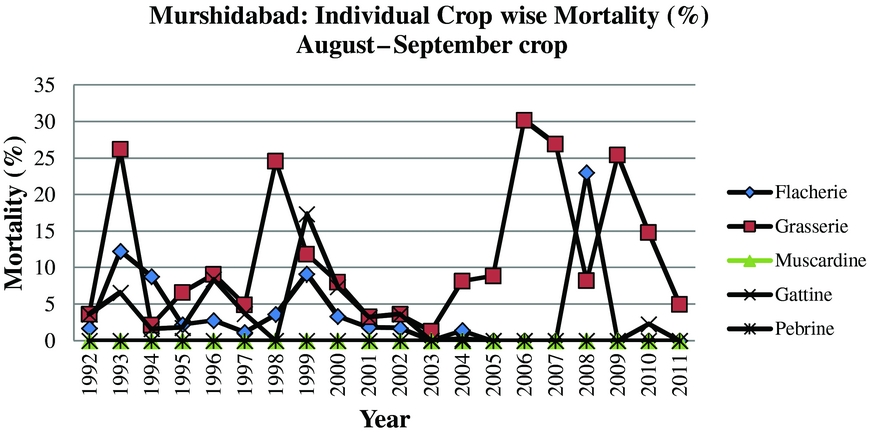
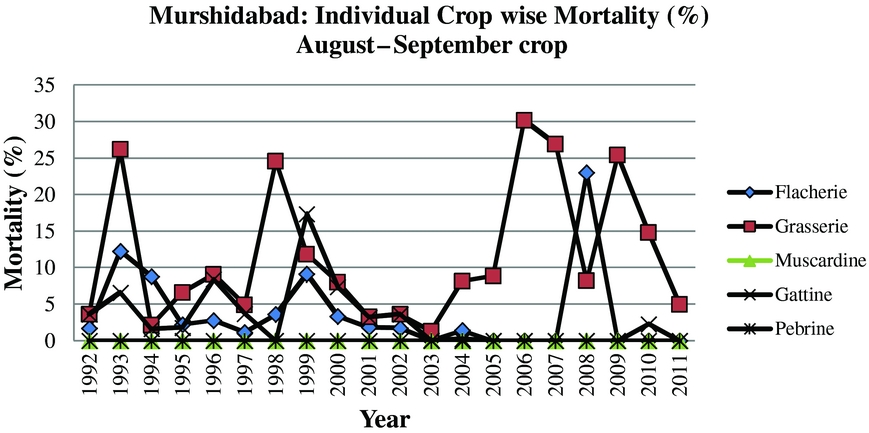
Crop wise silkworm mortality (%) due to diseases (August–September crop).
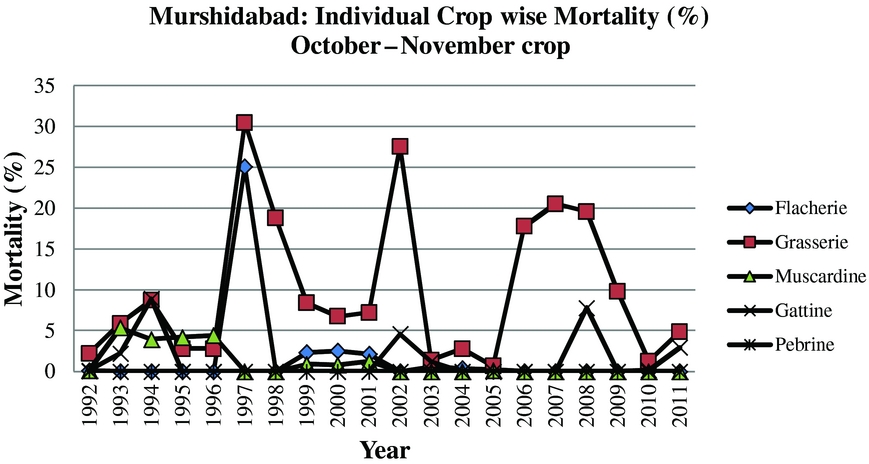
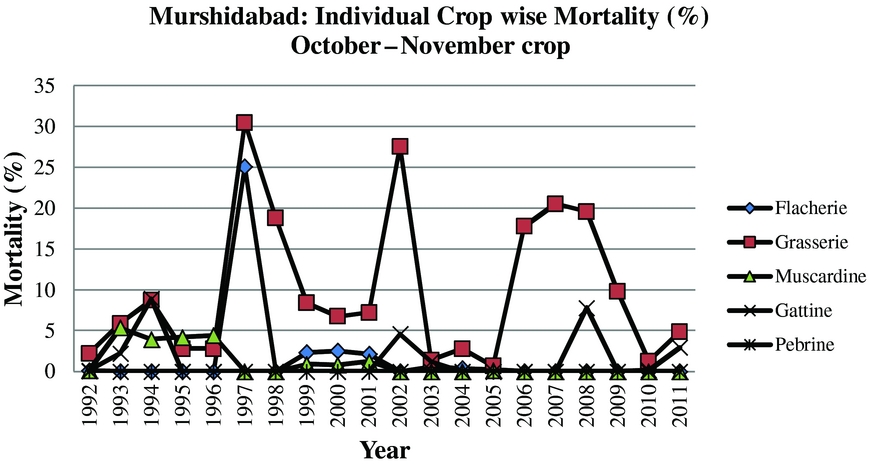
Crop wise silkworm mortality (%) due to diseases (October–November crop).
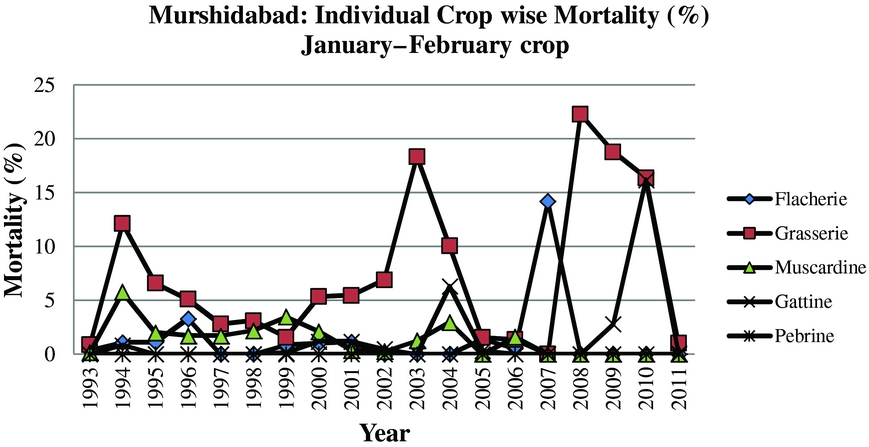
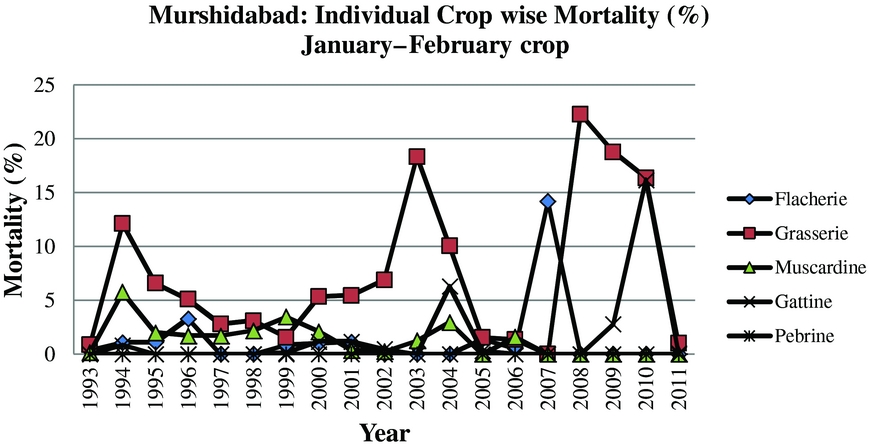
Crop wise silkworm mortality (%) due to diseases (January–February crop).
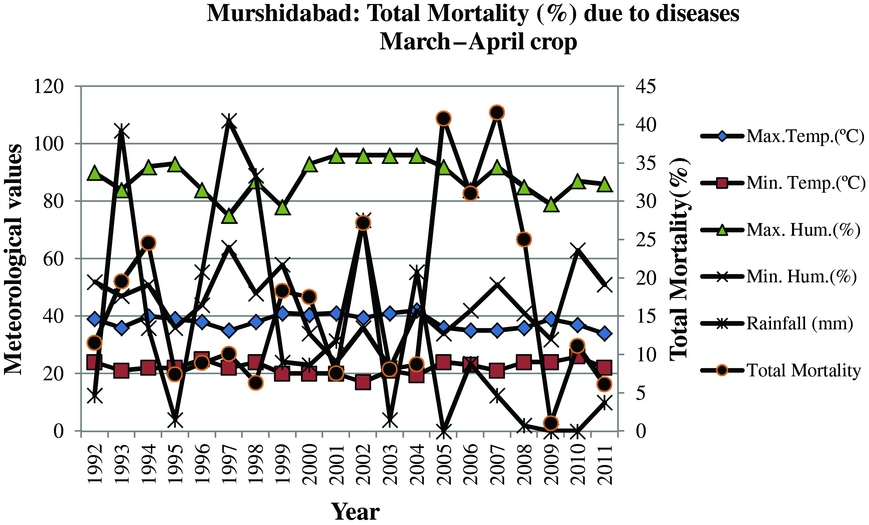
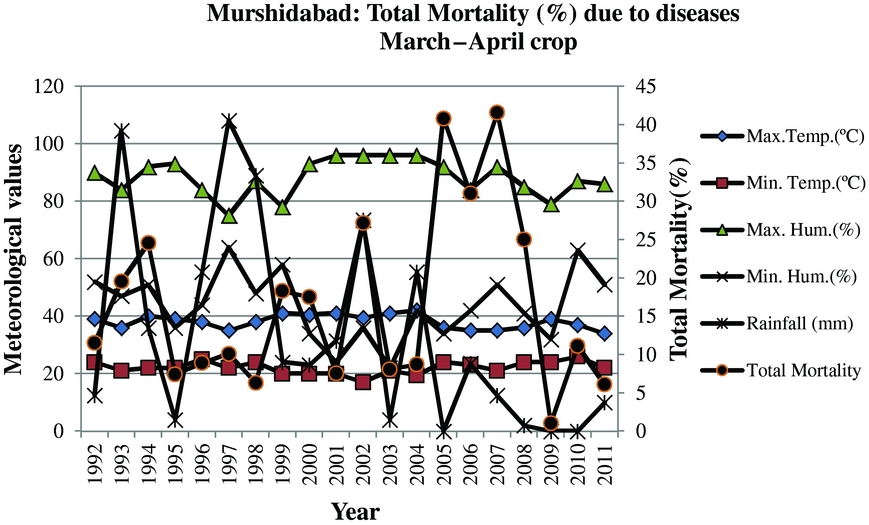
Total mortality (%) due to diseases (March–April crop).
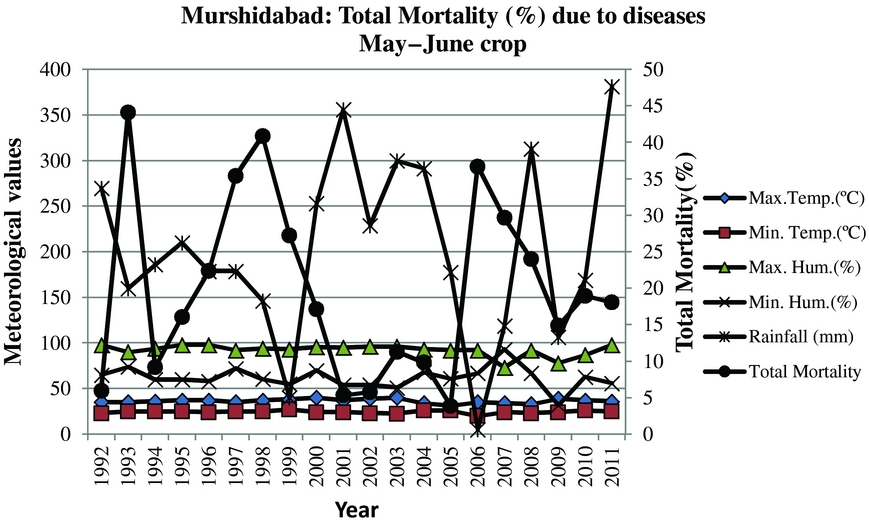
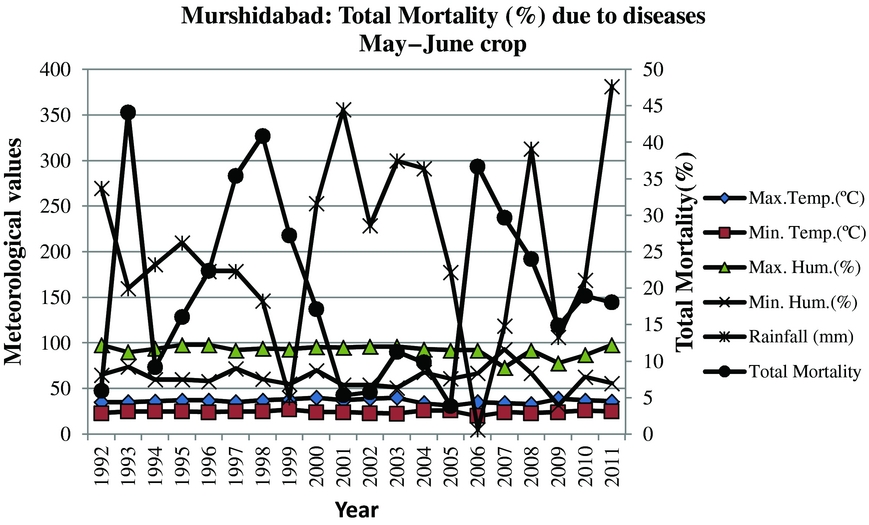
Total mortality (%) due to rainfall (May–June crop).
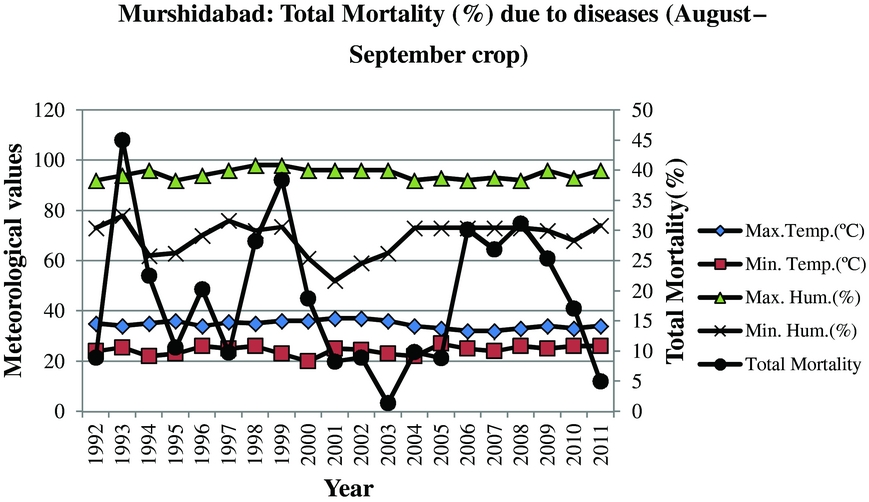
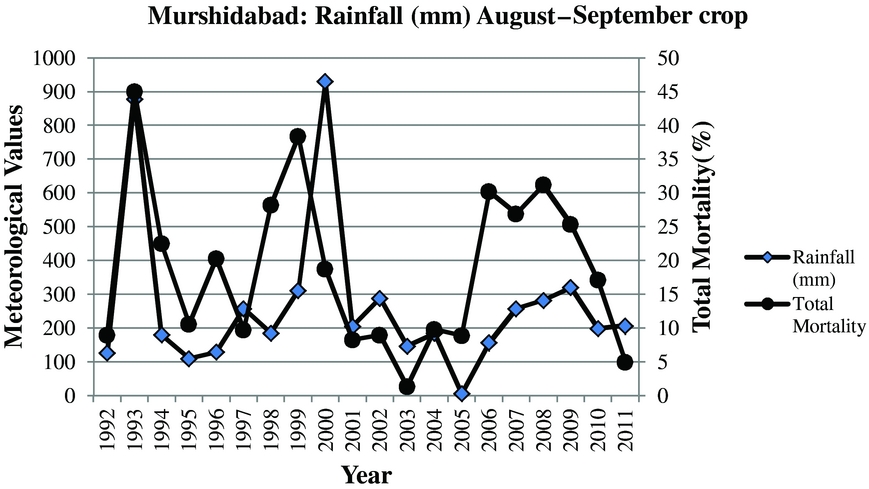
Total mortality (%) due to rainfall (August–September crop).
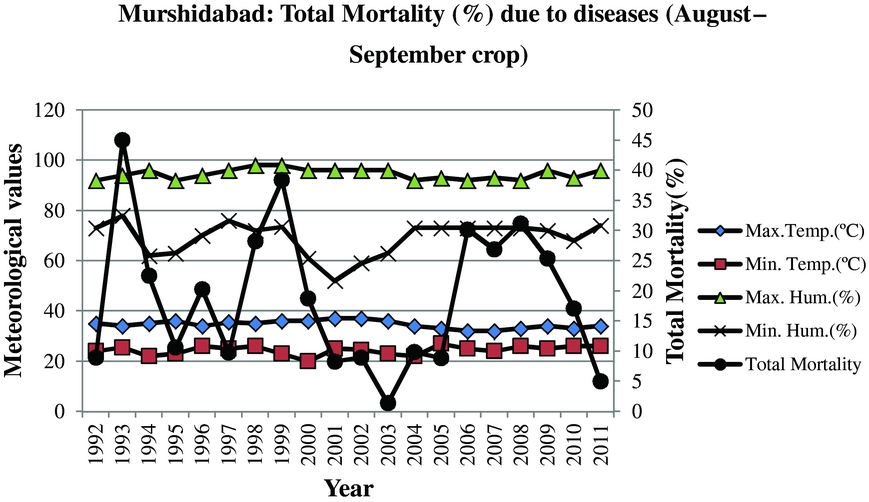
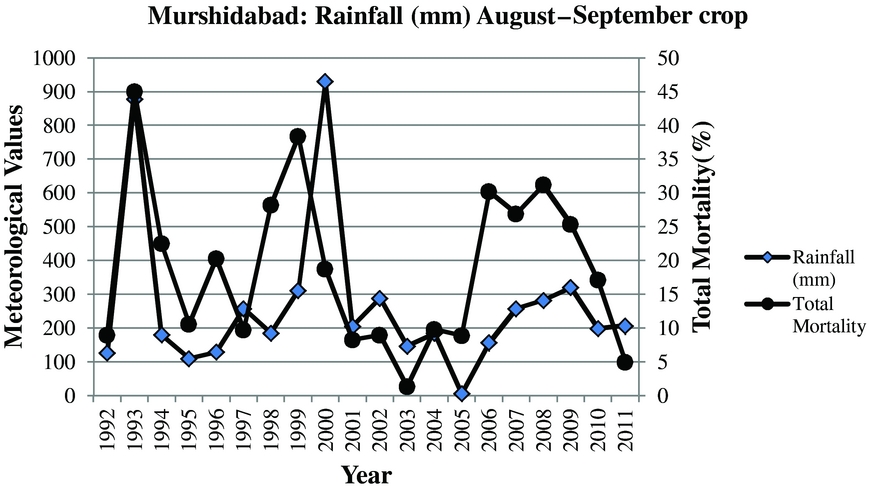
Total mortality against rainfall (mm) (August–September crop).
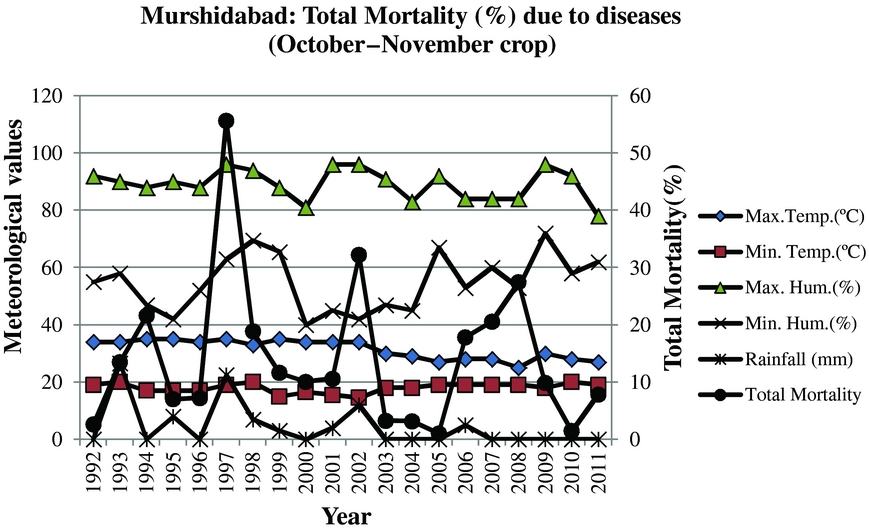
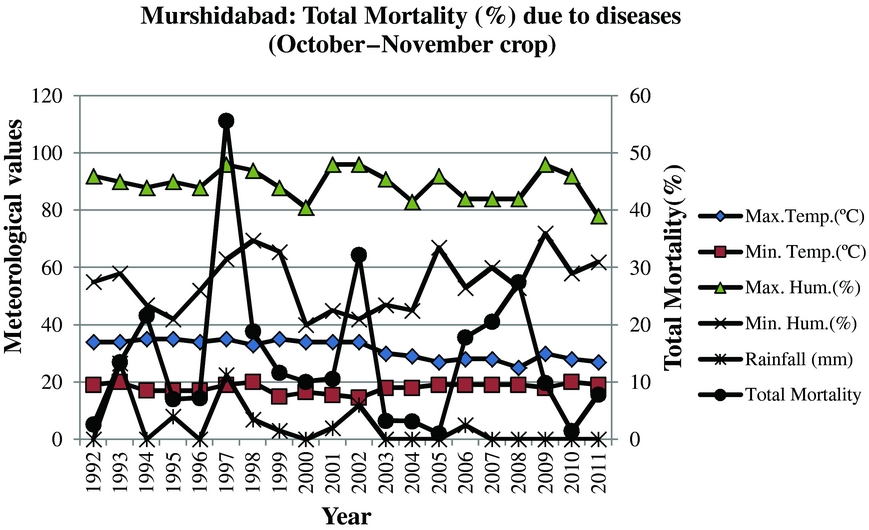
Total mortality (%) due to rainfall (October–November crop).
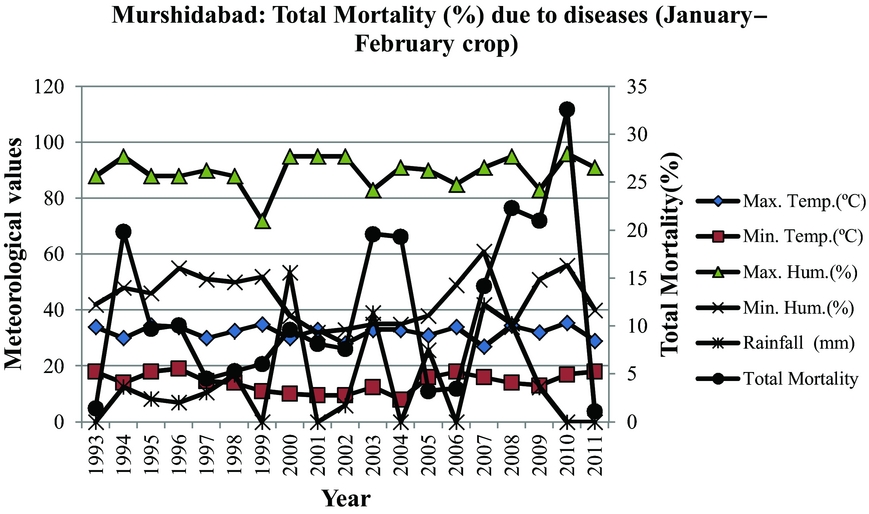
Total mortality (%) due to diseases (January–February crop).

Annual average silkworm mortality
Fig. 1 gives the overall disease trend in the district for the period March–April 1992 to October–November 2011. Highest mortality was due to grasserie, followed by flacherie, gattine and muscardine. There was relatively no incidence of pebrine during these years. The incidence of grasserie remained below 15% for most of the period, except 2006–2008 when it reached approximately 24%. All other diseases remained below 6%. However, occurrence of pebrine alone is not the true indicator of disease incidence, since occurrence of all the diseases except pebrine is dependent on several abiotic factors, among which temperature and humidity are most important. Since these factors vary from season to season, analysis of crop wise disease incidences will reveal the role of these factors on the silkworm mortality.
Individual crop-wise silkworm mortality
March–April crop
Highest mortality in this crop was mainly due to grasserie, except for some intermittent years when gattine, muscardine and flacherie caused more mortality than grasserie. In all years, mortality remained almost below 10% except for the years 1994, 2002, 2005–2008 and 2010, when it was up to 30%. No incidence of pebrine was reported (Fig. 2).
May–June crop
In this crop, highest mortality was due to grasserie, except 1998 when flacherie caused the highest mortality. Severe crop loss (≥30%) occurred during 1993, 2006 and 2007 due to grasserie. Apart from these three years, mortality remained below 20% except in 1998 when 25% flacherie was reported. Pebrine incidence was almost none except in 1992 when 0.08% pebrine was reported (Fig. 3).
August–September crop
Earlier studies have indicated that grasserie is the most common of all the silkworm diseases and also causes maximum damage to the crop. Highest crop loss (up to 30%) was due to grasserie followed by flacherie and gattine (Fig. 4).
October–November crop
Among the five crops during the year, the November crop is the best when climatic conditions are favourable for successful harvest of cocoons. In this season too, highest mortality was due to grasserie followed by flacherie. Excluding 1997 when both grasserie (30.5%) and flacherie (25.1%) accounted for more than 50% of the mortality due to diseases, disease incidence was comparatively low in other years. Disease incidence in most years due to diseases other than grasserie was below 5% throughout the period of the study (Fig. 5).
January–February crop
Compared to other crops, silkworm mortality due to diseases was lowest in this crop. Grasserie accounted for highest loss, up to 22.3%, followed by gattine and flacherie. But in most of the years disease incidence remained below 7% (Fig. 6).
Correlation of individual crop wise silkworm mortality with meteorological factors
March–April crop
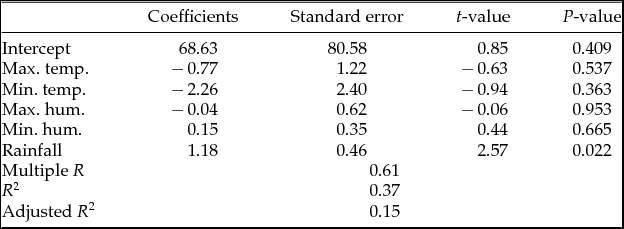
High temperature alone is insufficient to cause damage and hence is negatively correlated with mortality. During this season, maximum mortality was due to grasserie, because it requires both high temperature and high humidity. The maximum temperature remained around 35–40 °C, and coupled with humidity above 85%, proved detrimental for the larvae during this season. Since the rain generally starts from June onwards, barring a couple of years, the rainfall was low and was negatively correlated to mortality (Fig. 7) (Table 2).
Regression analysis results of mortality on weather parameters for the March–April silkworm crop

May–June crop
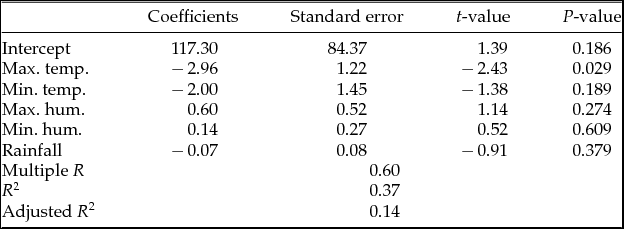
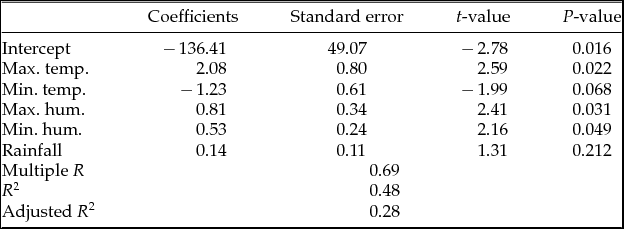
During this crop, except on two occasions when the temperature reached 40 °C, the maximum temperature recorded was approximately 35 °C. Maximum humidity was above 90% during most of the years as rainfall was recorded above 100 mm, except in 1999 and 2006 when it recorded unusually low rainfall of 40 mm and 5.15 mm, respectively. Wide variation in average mortality (3.88–44.14%) owing to variations in temperature, humidity and rainfall was observed. Mortality of silkworms due to rainfall alone was negatively correlated, being statistically significant (p < 0.05) (Fig. 8) (Table 3).
Regression analysis results of mortality on weather parameters for the May–June silkworm crop

August–September crop
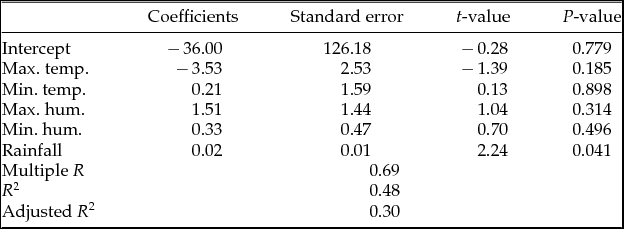
During this crop, the maximum temperature remained around 35 °C and rainfall was higher compared to other seasons, maximum humidity was recorded above 90% throughout (Figs. 9 and 10). Because of high humidity, a symmetric pattern of high mortality coupled with high rainfall was observed, which was found to be statistically significant (P < 0.05) (Figs. 9 and 10) (Table 4).
Regression analysis results of mortality on weather parameters for the August–September silkworm crop

October–November crop
Rainfall was nil for most of this period and the maximum temperature did not go beyond 35 °C. Hence, the maximum and minimum temperature recorded was negatively correlated to mortality. However, humidity was still high at above 80%. The average mortality was around 20% and below, except in 1997, 2002 and 2008 when 55.6, 32.2 and 27.4% mortality, respectively, was recorded. This is by far the most conducive season for rearing. However, intermittent rain during this season led to mortality, especially from grasserie. Impact of rainfall on the overall mortality was statistically significant (P < 0.05) (Fig. 11) (Table 5).
Regression analysis results of mortality on weather parameters for the October–November silkworm crop

January–February crop
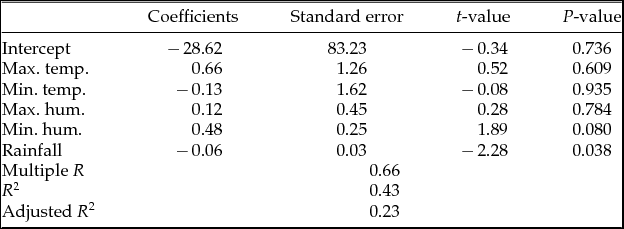
Differences between maximum and minimum temperature and maximum and minimum humidity were highest during this crop. Mortality remained below 20%, except during 2008 and 2010 when mortality was 22.3 and 32.6%, respectively. During these two years a maximum temperature of 34.5–35.5 °C and humidity of 95–96% were recorded. During this season, the temperature generally remained low and the humidity high, ideal for muscardine, but sudden fluctuations in temperature also led to incidences of grasserie. The effect of maximum temperature, maximum humidity and minimum humidity on the mortality of silkworms was statistically significant (P < 0.05) (Fig. 12) (Table 6).
Regression analysis results of mortality on weather parameters for the January–February silkworm crop

Silkworm diseases are a major constraint in realizing the full potential of sericulture (Kumar and Naik, Reference Kumar and Naik2011). Success of the sericulture industry depends upon several variables, but biotic and abiotic factors are of particular importance. Among the abiotic factors, temperature plays a major role on growth and productivity of silkworms (Ueda et al., Reference Ueda, Kimura and Suzuki1975; Benchamin and Jolly, Reference Benchamin, Jolly and Mahalingam1986). High temperature adversely affects nearly all biological processes, including the rates of biochemical and physiological reactions (Hazel, Reference Hazel1995; Willmer et al., Reference Willmer, Stone and Johnston2004) and can eventually affect the quality or quantity of cocoon crops and, subsequently, silk produced. Several studies have demonstrated that silkworms are more sensitive to high temperature during the fourth and fifth stages (Ueda and Lizuka, Reference Ueda and Lizuka1962; Shirota, Reference Shirota1992; Tazima and Ohnuma, Reference Tazima and Ohnuma1995). Different workers demonstrated the influence of humidity during rearing time and its role on disease incidence (Vijaya Kumari et al., Reference Vijaya Kumari, Rajan, Himantharaj, Nataraj and Rekha2001). Similarly, researchers (Lakshminarayana et al., Reference Lakshminarayana, Shankar and Sivarami2002) found that temperature and RH exert a synergistic impact on silkworm larval period. Ghosh et al. (Reference Ghosh, Senapati and Baral2000) found that in the ‘terai’ region of West Bengal the incidence of different diseases among bivoltine races was greater during the monsoon than in the post-monsoon and winter seasons.
Steinhaus (Reference Steinhaus1949), Samson et al. (Reference Samson, Baig, Sharma, Balavenkatasubbaiah, Sasidharan and Jolly1990) and Savanurmath et al. (Reference Savanurmath, Basavarajappa, Hinchigeri, Ingalhalli, Singh and Sanakal1992) reported fluctuation between day and night temperatures and the RH prevailing in the rearing house as being important factors in increased NPV infection and flacherie in silkworm larvae. Chishti and Schaf (Reference Chishti and Schaf1990) reported that silkworm reared at Jammu and Kashmir under controlled condition showed less mortality (0.5–3.0%), whereas silkworm reared under uncontrolled temperature and relative humidity showed high mortality (25.2%).
Susceptibility of pure bivoltine races to grasserie (Liu, Reference Liu1984) in comparison to multivoltine races (Singh et al., Reference Singh, Baig, Balavenkatasubbaiah, Sharma, Sengupta and Sivarami Reddy1990) is well known. Cumulative effect of factors such as weather, race and mulberry variety is responsible for occurrence of grasserie (Sivaprakasam and Rabindra, Reference Sivaprakasam and Rabindra1995). Poor rearing, huge quantity of dfls used per rearing and hiring of rearing appliances favour multiplication of microorganisms of gattine (Samson et al., Reference Samson, Baig, Sharma, Balavenkatasubbaiah, Sasidharan and Jolly1990; Sivaprakasam and Rabindra, Reference Sivaprakasam and Rabindra1995).
Low temperature and high humidity are conducive for the fungal disease muscardine (Jayaramaiah et al., Reference Jayramaiah, Kuberappa, Devaiah and Kalikal1986; Samson et al., Reference Samson, Baig, Sharma, Balavenkatasubbaiah, Sasidharan and Jolly1990; Anonymous, 1992), as the condition favours dispersal of the pathogen (conidia) by wind, mechanical disruption and body contact from infected hosts. The spread of this disease is faster and more devastating than the other diseases of silkworm (Tanada, Reference Tanada and Steinhaus1963; Chishti and Schaf, Reference Chishti and Schaf1990; Prabhakara et al., Reference Prabhakara, Bala Venkatasubbaiah, Siva, Baig and Datta1990).
Krishnan (Reference Krishnan2000) reported that the incidence of gattine was 7.75% during summer (April–May) in West Bengal and Selvakumar et al. (Reference Selvakumar, Nataraju, Balavenkatasubbaiah, Sivaprasad, Baig, Kumar, Sharma, Thiagarajan, Datta, Dandin and Gupta2002) confirmed that prevalence of flacherie was comparatively high during summer, followed by prevalence in the rainy season.
Statistical analysis of the results reveals that although the meteorological parameters are jointly insignificant at significance level 0.05, they are individually significant season wise. Most important among all the meteorological parameters is the rainfall, which increases the relative humidity in the rearing room, causing maximum damage.
Our study is in agreement with the findings of Samson et al. (Reference Samson, Baig, Sharma, Balavenkatasubbaiah, Sasidharan and Jolly1990), Savanurmath et al. (Reference Savanurmath, Basavarajappa, Hinchigeri, Ingalhalli, Singh and Sanakal1994), Ghosh et al. (Reference Ghosh, Senapati and Baral2000), Vijaya Kumari et al. (Reference Vijaya Kumari, Rajan, Himantharaj, Nataraj and Rekha2001) and Selvakumar et al. (Reference Selvakumar, Nataraju, Balavenkatasubbaiah, Sivaprasad, Baig, Kumar, Sharma, Thiagarajan, Datta, Dandin and Gupta2002). However, no single factor alone is responsible for disease occurrence in the farmers’ field except for pebrine, which being transovarian in nature, is dependent for its control on strict mother moth examination at the time of preparation of layings. Apart from the fluctuations in the ambient temperature and relative humidity, several other factors, i.e. quality of leaf fed to the silkworms, silkworm breeds, and adoption of recommended Package of Practices for silkworm rearing by the farmers also come into play towards occurrence of other silkworm diseases. However, a fluctuation in ambient temperature and humidity is of paramount importance towards occurrence of diseases, especially grasserie. In the successive years 2006 and 2007, 17.8–36.7% mortality due to grasserie was observed. In the March–April and May–June crops, high temperature (34–35 °C) and wide fluctuations in humidity accounted for the major crop loss due to grasserie. During August–September crop, the average temperature during late Vth instar was around 30 °C and with high humidity due to heavy rainfall during the time of spinning, around 30% crop loss was experienced. Quality of leaf fed to the silkworm instar wise is also important. The tender and succulent leaves having high moisture content are suitable for feeding the early instars, whereas the mature, coarse leaves having comparatively less moisture are ideal for late instar silkworms. Feeding of tender leaves to late instar silkworms increases their susceptibility to the viral disease, grasserie. Among the meteorological factors, high relative humidity in comparison to high temperature, as a single factor, is more detrimental for the silkworm larvae, and maximum larval mortality due to viral disease, grasserie was observed when both high temperature and high relative humidity prevailed. Since fluctuations in environmental conditions is beyond human control and with rising temperature of the earth's surface due to global warming, development of thermo-tolerant breeds and hybrids through conventional breeding programmes is the need of the hour, to reduce disease incidence. Moreover, scope for development of genetically engineered transgenic breeds has also given a new avenue for tackling this problem. Till then, an integrated disease management strategy has to be strictly followed for control of silkworm diseases, since there is no curative measure for the diseases.
Another approach towards minimizing the chances of disease incidence is through using disease survey data for generating prediction models for disease forecasting. For this, utilization of existing databases from various centres and developing statistical packages for monitoring and forecasting diseases based on prediction models is the greatest need. However, projection of incidence of these diseases cannot always be done accurately based only on prevailing weather conditions. As stated earlier, there are several other factors that need to be taken into account.
Conclusion
From our study, no definite pattern or trend in silkworm disease incidence has emerged in respect to the district of Murshidabad during the last 20 years. General observations are that highest mortality of silkworm due to diseases has been mainly due to grasserie, as the area experiences high relative humidity for the most part of the year. Apart from grasserie, bacterial flacherie, especially during May–June and August–September crop did the most damage. All other disease incidence remained below 10% for most part of the study period, except for an occasional surge in some specific disease in some particular crop, which may be due to factors other than meteorological conditions.
Second, no new pathogen was reported or identified during the period. Another observation was that since 1993 pebrine, the deadliest of the silkworm diseases, was not reported from the farmers’ fields, indicating that thorough examination of mother moths at the time of preparation of layings was effective.
As thermo-tolerant breeds and transgenic breeds are still in the process of development and are yet to be commercialized, emphasis on preventive measures as part of integrated disease management strategy must be rigorously applied. Moreover, the outcome from this study can be utilized for generating prediction models for disease forecasting. Further study on the impact of other factors, in association with meteorological data, should be conducted for making a more consolidated approach in tackling the problem of silkworm disease incidences in the farmers’ fields.
Acknowledgements
The authors sincerely extend their gratitude to all the scientists, officers and technical staff of the Silkworm Pathology Section, Central Sericultural Research and Training Institute, Central Silk Board, Berhampore, Murshidabad, West Bengal, India who rendered their valuable service in collecting and compiling the data during the period of this study. The authors convey their special thanks to Dr A. K. Chandra Scientist-D, Dr P. Mitra Scientist-D, Dr J. Bhattacharya Senior Research Assistant, Dr N. Krishnan Senior Research Officer and Dr Madana Mohanan N, Senior Research Officer (as of 15.05.06).