1 Introduction
1.1 Active flow control and synthetic jet actuators
Active flow control (AFC) technology has experienced an explosive growth during the last two decades as a result of increasing demands for energy-efficient transportation, pipelines and other industrial devices (Gad-el-Hak, Pollard & Bonnet Reference Gad-el-Hak, Pollard and Bonnet2003). Compared with passive methods (e.g. vortex generators), no drag penalty is produced by AFC during off-operation since the actuators can be turned on and off conveniently (Cattafesta & Sheplak Reference Cattafesta and Sheplak2011). The potential applications of AFC include but are not limited to aerodynamic drag reduction, lift augmentation, noise mitigation, mixing enhancement, boundary layer transition control, etc. (Choi, Moin & Kim Reference Choi, Moin and Kim1994; Amitay et al. Reference Amitay, Smith, Kibens, Parekh and Glezer2001; Samimy et al. Reference Samimy, Kim, Kastner, Adamovich and Utkin2007). Depending on the specifics of the problem, various actuators (fluidic, plasma, moving surfaces, etc.) and control strategies (open-loop control, feedback control and feedforward control) can be deployed to create either small-amplitude perturbations leveraging flow instabilities or high-amplitude ‘brute force’, adequate to modify mean flow structures (Corke, Enloe & Wilkinson Reference Corke, Enloe and Wilkinson2010; Cattafesta & Sheplak Reference Cattafesta and Sheplak2011).
Among the various types of fluidic actuators, synthetic jet actuators (SJAs) exhibit the unique feature of imparting momentum/energy to fluid systems with zero net mass flow (ZNMF) (Glezer & Amitay Reference Glezer and Amitay2002; Chiatto et al.
Reference Chiatto, Capuano, Coppola and de Luca2017). This feature largely mitigates the weight and volume penalty brought by external compressors or vacuum pumps that are necessary for steady and unsteady jets or suction (Alexander et al.
Reference Alexander, Harris, Spoor, Boyland, Farrell and Raines2016). Morphologically, SJAs involve the use of an enclosed cavity and an exit orifice through which fluid is ejected and ingested alternately. Compression of the cavity relies either on mechanical volume modification (e.g. piezoelectric membrane, electromagnetic coil and piston) or on rapid thermalization (e.g. microcombustion) (Wang et al.
Reference Wang, Luo, Xia, Liu and Deng2012). Piezoelectric SJAs feature simple construction, high operation frequency (
 $O$
(1 kHz)) and relatively low peak jet velocity (typically less than
 $60~\text{m}~\text{s}^{-1}$
) (Smith & Glezer Reference Smith and Glezer1998; Crittenden & Glezer Reference Crittenden and Glezer2006). By using a dual-disk configuration and operating at resonance frequency (700 Hz in their study), van Buren, Whalen & Amitay (Reference van Buren, Whalen and Amitay2016) demonstrated an improvement of the peak jet velocity to
 $210~\text{m}~\text{s}^{-1}$
. Nevertheless, a fast deterioration of jet velocity is observed in off-resonance operation (less than
 $40~\text{m}~\text{s}^{-1}$
after 1200 Hz), limiting the available frequency range. Piston-type SJAs can create compressible jets at supersonic exit velocity (approximately
 $600~\text{m}~\text{s}^{-1}$
); however, the peak operation frequency is limited to 200 Hz as a result of the inherent mechanical design (Crittenden & Glezer Reference Crittenden and Glezer2006). For combustion-type SJAs, notwithstanding the robustness and high jet velocity, the low working frequency of order
 $O$
(100 Hz), limited by mixing and refilling of the reactants as well as the complex construction incorporating an internal ignitor and several pipes, poses significant challenges (Crittenden et al.
Reference Crittenden, Glezer, Funk and Parekh2001).
1.2 Formation of plasma synthetic jets (PSJs)
High-speed high-Reynolds-number flow control demands actuators with sufficient bandwidth and control authority (Cattafesta & Sheplak Reference Cattafesta and Sheplak2011), while still being relatively robust and simple. Grossman, Cybyk & Vanwie (Reference Grossman, Cybyk and Vanwie2003) proposed to rapidly pressurize the actuator cavity with pulsed arc/spark discharges instead of microcombustion, leading to a simple construction (one cavity plus two/three electrodes). Due to the inherent short time scale of gas discharge at atmospheric pressure (
 $O$
(
 $10~\unicode[STIX]{x03BC}\text{s}$
)) and easily tuneable pulse energy, high-velocity ZNMF jets (
 $300~\text{m}~\text{s}^{-1}$
) can be produced reliably by this spark-jet actuator (also named plasma synthetic jet actuator, PSJA) at high frequency (
 ${>}$
5 kHz) (Narayanaswamy, Raja & Clemens Reference Narayanaswamy, Raja and Clemens2010). Essentially, the PSJA is an electro-mechanical device, converting electrical energy (input) into mechanical jet energy (output). However, the energy conversion chain is not straightforward and involves complex interaction of the gas discharge, gas heating, and thermal and fluid cycles. Each process exhibits inevitable energy losses corresponding to three subefficiencies, namely discharge efficiency, heating efficiency and thermal-cycle efficiency (Zong et al.
Reference Zong, Wu, Song and Jia2016a
). The total efficiency of a PSJA (ratio of output energy to input energy,
 $O$
(0.1 %)) is the product of these subefficiencies and is mainly affected by electrical and geometrical parameters (Popkin et al.
Reference Popkin, Cybyk, Foster and Alvi2016; Zong et al.
Reference Zong, Wu, Song and Jia2016a
; Zhang et al.
Reference Zhang, Wu, Jia, Song, Sun and Li2017).
The electrical parameters (pulse energy, pulse duration and repetition rate) differentiate the diverse discharge regimes and play a key role in tuning the intensity of the PSJ (Zong et al.
Reference Zong, Cui, Wu, Zhang, Liang, Jia and Li2015a
). For actuators with varying cavity volume, the internal energy of the cavity gas is commonly adopted to scale the pulse energy, resulting in a non-dimensional energy deposition (denoted as
 $\unicode[STIX]{x1D700}$
) (Grossman et al.
Reference Grossman, Cybyk and Vanwie2003). Capacitive discharge is widely adopted to feed PSJAs in three-electrode configurations, since the pulse energy can be easily adjusted by tuning the capacitance and capacitor voltage of the primary power supply circuit (Belinger et al.
Reference Belinger, Hardy, Barricau, Cambronne and Caruana2011, Reference Belinger, Naudé, Cambronne and Caruana2014; Wang et al.
Reference Wang, Xia, Luo and Chen2014; Popkin et al.
Reference Popkin, Cybyk, Foster and Alvi2016). In single-shot (non-repetitive) mode, the peak jet velocity (maximum of
 $500~\text{m}~\text{s}^{-1}$
reported in Reedy et al.
Reference Reedy, Kale, Dutton and Elliott2013) increases approximately linearly with the logarithm of the non-dimensional energy deposition (capacitor energy) while the jet duration time initially rises and then saturates (
 $0.04<\unicode[STIX]{x1D700}<22$
) for a fixed actuator geometry (Zong et al.
Reference Zong, Cui, Wu, Zhang, Liang, Jia and Li2015a
). Nevertheless, both the discharge efficiency (70–90 %) and the heating efficiency (20–40 %) pertaining to capacitive discharge drop considerably with increasing energy deposition, as a result of reduced arc resistance (
 $O$
(
 $1~\unicode[STIX]{x03A9}$
)) and increasing radiation and conduction losses (Belinger et al.
Reference Belinger, Naudé, Cambronne and Caruana2014; Golbabaei-Asl, Knight & Wilkinson Reference Golbabaei-Asl, Knight and Wilkinson2015; Popkin et al.
Reference Popkin, Cybyk, Foster and Alvi2016). As an alternative to capacitive discharge, nanosecond pulsed discharge is favourable in high-frequency operation (
 ${>}$
5 kHz). Under this regime, relatively high heating efficiency (
 ${>}$
60 %) can be attained as a result of the high reduced electrical field (ratio of electrical field to species concentration) exhibited in the breakdown stage (Xu et al.
Reference Xu, Shneider, Lacoste and Laux2014; Zhu et al.
Reference Zhu, Wu, Jia, Liang, Li and Li2014). Although satisfactory in heating efficiency, nanosecond pulsed discharge delivers limited absolute discharge energy (typically 1–10 mJ) per pulse, mainly due to limitations in solid-state nanosecond pulse generators, and is thus not suitable for energizing large-volume PSJAs (
 ${>}1000~\text{mm}^{3}$
).
The geometrical parameters (cavity volume, orifice diameter and throat length) describe the ‘transfer function’ of the actuator system between input energy and mechanical output, thus significantly affecting its frequency characteristics (Gallas et al. Reference Gallas, Holman, Nishida, Carroll, Sheplak and Cattafesta2003; Cattafesta & Sheplak Reference Cattafesta and Sheplak2011). As the frequency increases, the cavity density and the mechanical energy delivered by a single pulsed jet show a stair-stepping drop due to the insufficient cavity refresh time and accumulating cavity temperature (Belinger et al. Reference Belinger, Hardy, Barricau, Cambronne and Caruana2011; Zong et al. Reference Zong, Wu, Li, Song, Zhang and Jia2015b ). As such, a saturation frequency for a PSJA exists, above which frequent ‘misfires’ will occur, followed by a sharp drop of time-averaged jet intensity (Narayanaswamy et al. Reference Narayanaswamy, Raja and Clemens2010). The saturation frequency increases linearly with orifice diameter and decreases with throat length (Zong et al. Reference Zong, Wu, Jia, Song, Liang, Li and Zhang2016c ). In single-shot mode, the peak jet velocity and jet mechanical energy remain unchanged while the jet duration extends with increasing orifice diameter (Zong & Kotsonis Reference Zong and Kotsonis2016b ). Finally, a large cavity volume will result in a longer jet duration but lower peak jet velocity (Cybyk et al. Reference Cybyk, Wilkerson, Grossman and Van Wie2003).
1.3 Evolution of PSJs
In contrast to the formation processes of PSJs, quantitative characterization of the ensuing flow structure evolution process generally requires advanced flow measurement techniques (e.g. particle imaging velocimetry (PIV) measurements) and expensive simulation methods (e.g. large-eddy simulation). As a result, limited information is available on the presented topic. In quiescent flow conditions, shock waves, vortex rings and high-speed jets are the three prominent flow structures produced by PSJAs. As the level of energy deposition increases, the flow pattern evolves from the mere emanation of weak shock waves to the presence of weak jets and detached front vortex rings and finally to the continuous expulsion of strong jets (Reedy et al. Reference Reedy, Kale, Dutton and Elliott2013; Zong et al. Reference Zong, Cui, Wu, Zhang, Liang, Jia and Li2015a ). Multiple shock waves of varied intensity are issued from the exit orifice, corresponding well to the periodical behaviour of capacitive discharge (Wang et al. Reference Wang, Xia, Luo and Chen2014). During their radial propagation away from the orifice, an exponential decay of shock wave intensity (signified by the propagation velocity) is observed (Zong & Kotsonis Reference Zong and Kotsonis2016a ). The shear layer of the starting jet rolls up into an axially propagating front vortex ring. This vortex ring bears similarities to the geometric shape of the exit orifice and entrains the surrounding fluids rapidly into the jet core region. For constant exit area, a slotted-shaped orifice exhibits a higher jet spreading rate but higher centreline velocity decay rate than a round orifice. The peak value of the jet penetration length ranges from 30 to 40 mm (Zong & Kotsonis Reference Zong and Kotsonis2016b ). When the PSJ is issued into external cross-flow, the initially erect jet body bends into the general streamwise direction and a quasi-streamwise counter-rotating vortex pair (CVP) is created. Governed by the downwash effect of this CVP, high-momentum fluids in the outer layer are transported to the bottom parts of the boundary layers, leading to a decrease of the boundary layer shape factor (Mahesh Reference Mahesh2013; Zong & Kotsonis Reference Zong and Kotsonis2017b ).
1.4 Background of the present study: non-dimensional formation and evolution laws
It becomes evident, from the aforementioned discussion, that numerous characterization studies for PSJAs have been performed, mostly focusing on formation processes. These cover a wide range of parameter space (energy deposition 0.02–20, cavity volume
 $20{-}2000~\text{mm}^{3}$
, frequency 1 Hz–10 kHz, discharge duration
 $O$
(ns)–
 $O$
(ms)) in the effort to better understand the pertinent formation and evolution mechanisms as well as to maximize potential flow control effects. However, the fast-expanding (
 $O$
(
 $10~\unicode[STIX]{x03BC}\text{s}$
)) high-temperature jet (
 $O$
(1000 K)), small-scale flow structures (
 $O$
(mm)) and strong electromagnetic interference (EMI) incurred by high-voltage (
 $O$
(kV)) high-current (
 $O$
(100 A)) pulsed discharges pose significant challenges for flow measurement techniques such as dynamic pressure transducers, hotwire anemometry and time-resolved PIV (Ko et al.
Reference Ko, Haack, Land, Cybyk, Katz and Kim2010; Narayanaswamy, Raja & Clemens Reference Narayanaswamy, Raja and Clemens2012; Chedevergne et al.
Reference Chedevergne, Léon, Bodoc and Caruana2015; Popkin et al.
Reference Popkin, Cybyk, Foster and Alvi2016). As a result, the non-dimensional formation and evolution laws of PSJs in repetitive working mode (e.g. centreline velocity decay, jet width, front vortex ring propagation) are largely unavailable in previous studies. Proper scaling laws for the formation and evolution of PSJAs are instrumental for a rigorous description of the pertinent working principles, as well as for optimized design of the actuator geometry and operation for flow control applications.
The present study takes the next step towards tackling the abovementioned issue. A high-frequency phase-locked PIV system is employed to access both the phase-averaged and the time-averaged velocity fields of a PSJ in repetitive mode. Near-field (
 $0<x<7.5D$
) and far-field measurements (
 $0<x<22.5D$
) are carried out successively to enable both spatial resolution and spatial range. The effects of two crucial parameters, namely the non-dimensional energy deposition and the dimensionless working frequency, on the formation and evolution of the ensuing flow structures are examined in detail. Proper combination of the actuation parameters is used to scale these formation and evolution laws. Comparison between PSJs and steady jets as well as conventional synthetic jets studied extensively in previous investigations is carried out throughout this work.
2 Formation and evolution metrics of PSJs
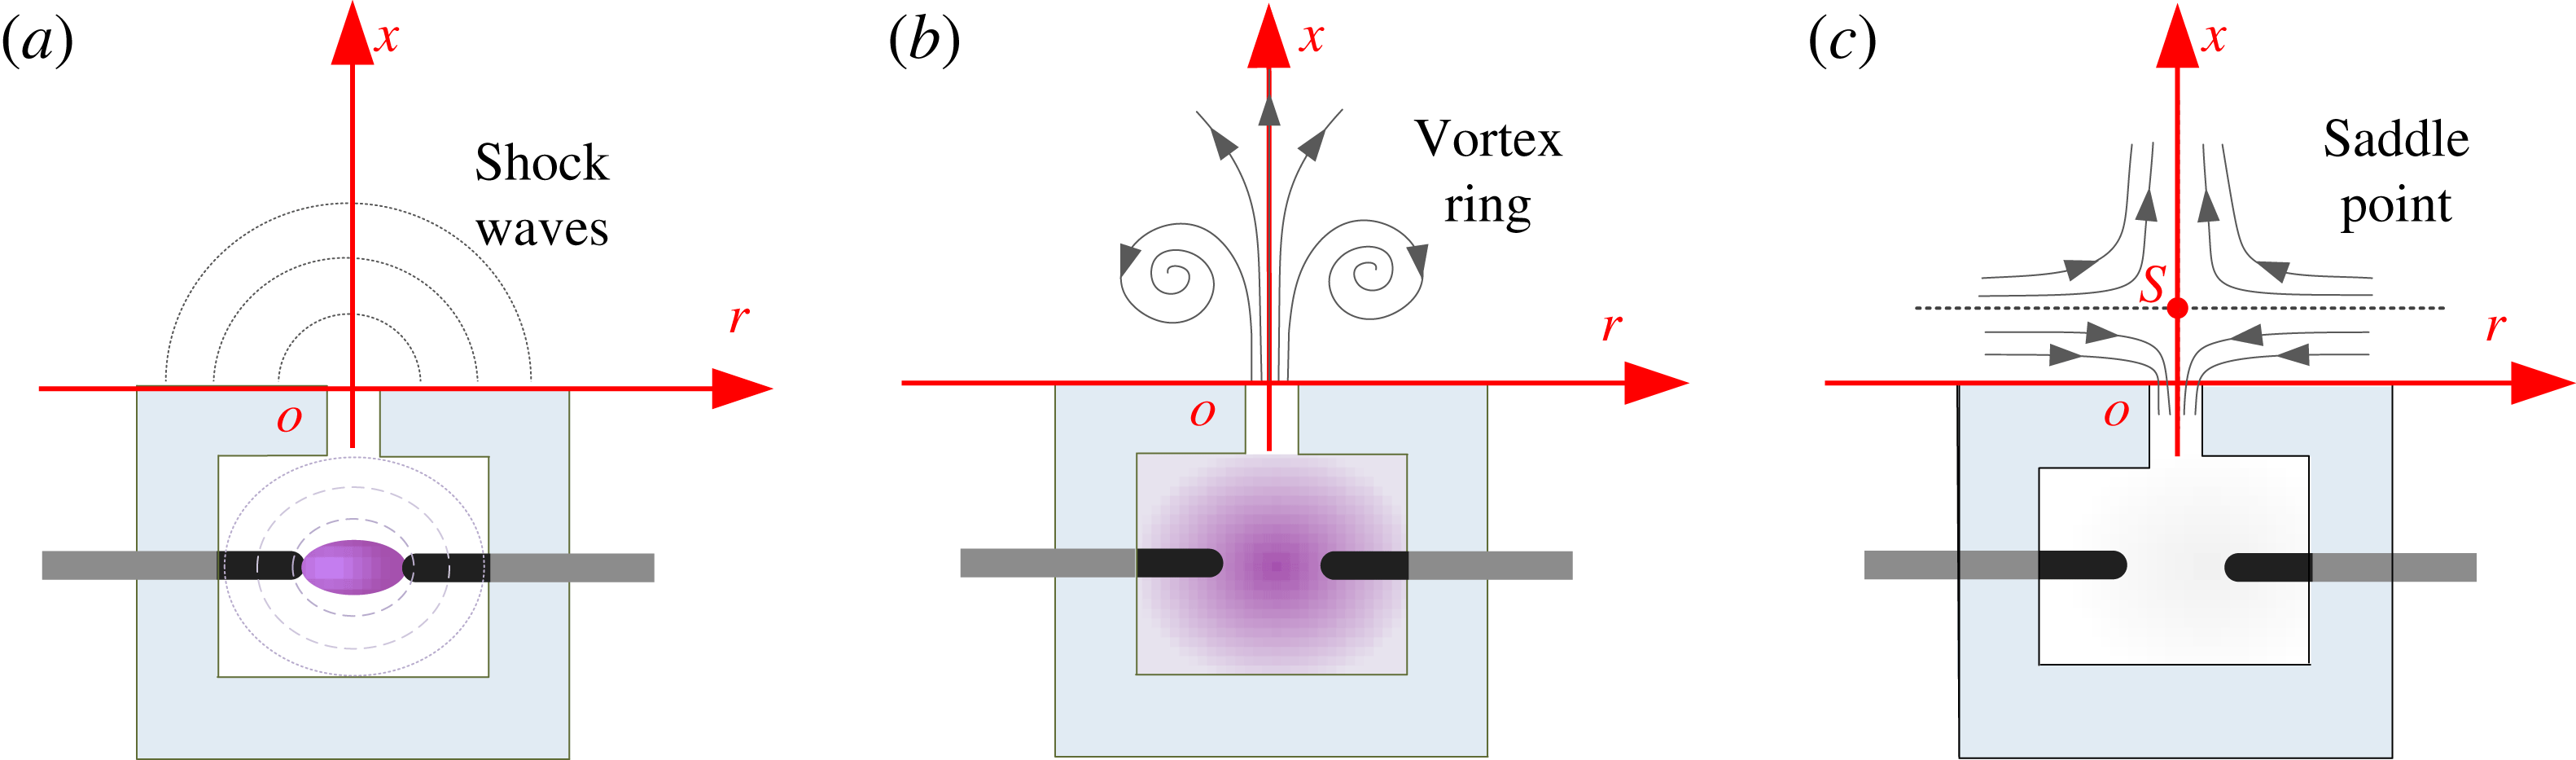
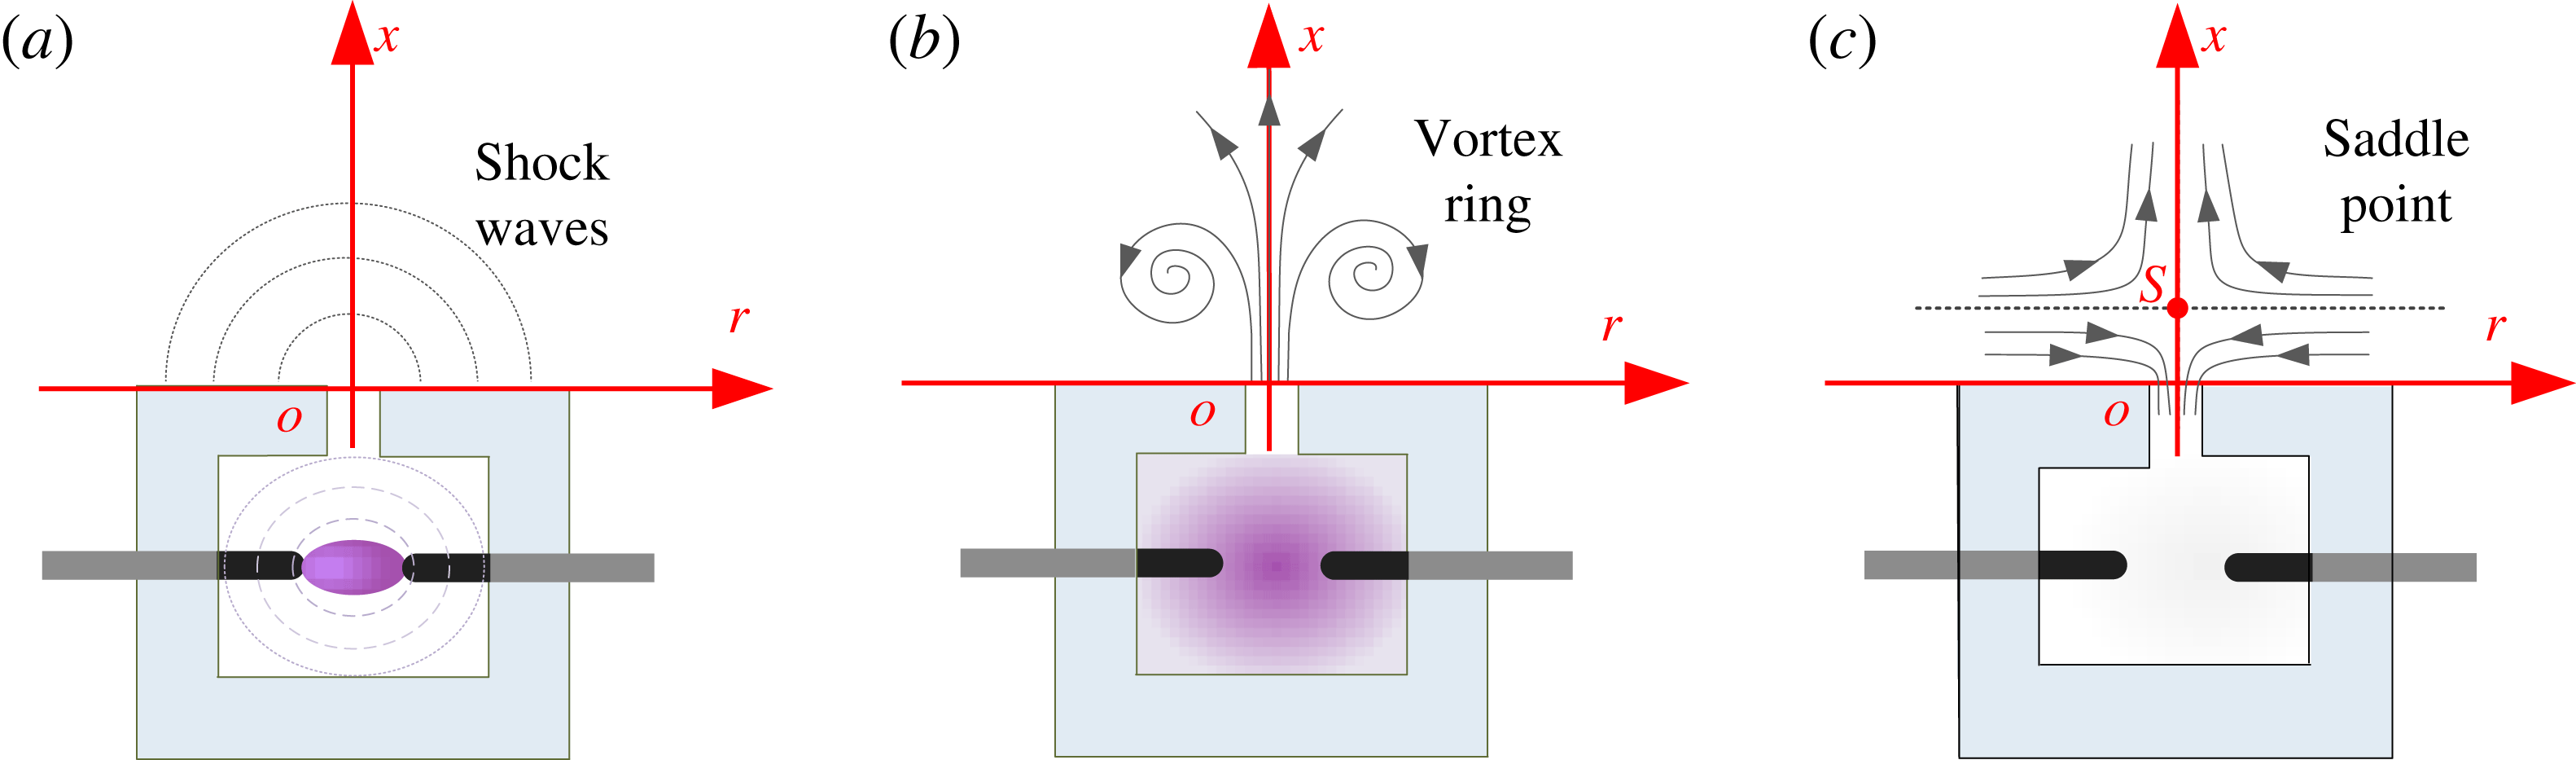
The formation process of a PSJ, illustrated in figure 1, consists of three stages: the energy deposition stage, the jet stage and the refresh stage. During the energy deposition stage (figure 1
a), a strong pulsed spark/arc is initiated by external circuitry, heating and pressurizing the cavity rapidly (
 $O$
(
 $10~\unicode[STIX]{x03BC}\text{s}$
)). Since the arc heating is locally confined in the interelectrode gap, the spatial distribution of temperature and pressure in the cavity is considerably non-uniform. As a result, several shock waves are produced, propagating outwards at supersonic speed (Zong et al.
Reference Zong, Wu, Song, Jia, Liang, Li and Zhang2016b
). During the jet stage (figure 1
b), the high-temperature low-density gas is expelled through the exit throat at high velocity, driven by the pressure differential between the inner cavity and the ambient external flow. The jet shear layer separates at the orifice lip and rolls into a starting vortex ring. As cavity gases are ejected, the cavity pressure drops monotonically. Nevertheless, the jet stage will not terminate at the moment of zero differential pressure due to the inevitable inertia of the throat gas. A negative cavity pressure will develop until full cessation of the throat flow, which provides the drive for the refresh stage. During the refresh stage (figure 1
c), ambient cold gas is ingested into the cavity, mixing with the residual high-temperature low-density gas therein. Considering the effects of the just emitted jet, a saddle flow pattern with the presence of both jet and suction flow can be observed above the orifice exit (Zong & Kotsonis Reference Zong and Kotsonis2016a
).
Conceptual formation and evolution of a PSJ: (a) energy deposition stage, (b) jet stage and (c) refresh stage.
2.1 Non-dimensional energy deposition and frequency
Plasma synthetic jet actuators are essentially electro-mechanical devices with electrical power signals providing the input and high-velocity pulsed jets forming as the output. The pulsed arc energy and the frequency are commonly used to characterize the input. For the capacitive discharge that is typically exploited to feed the actuator (Belinger et al.
Reference Belinger, Hardy, Barricau, Cambronne and Caruana2011; Zong et al.
Reference Zong, Cui, Wu, Zhang, Liang, Jia and Li2015a
), the pulsed arc energy can be simply represented by the capacitor energy (
 $E_{c}$
). The ratio of this capacitor energy (
 $E_{c}$
) to the enthalpy of the cavity gas (
 $E_{g}$
) gives the non-dimensional energy deposition (
 $\unicode[STIX]{x1D700}$
; it should be noted that this is not the efficiency) as follows:
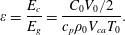 $$\begin{eqnarray}\displaystyle \unicode[STIX]{x1D700}=\frac{E_{c}}{E_{g}}=\frac{C_{0}V_{0}/2}{c_{p}\unicode[STIX]{x1D70C}_{0}V_{ca}T_{0}}. & & \displaystyle\end{eqnarray}$$
Here,
 $c_{p}$
is the constant-pressure specific heat capacity,
 $V_{ca}$
denotes the inner cavity volume of the PSJA and
 $\unicode[STIX]{x1D70C}_{0}$
and
 $T_{0}$
are the atmospheric ambient density and temperature respectively (
 $1.22~\text{kg}~\text{m}^{-3}$
and 288 K for the current study);
 $C_{0}$
and
 $V_{0}$
represent the capacitance and initial voltage of the energy-storing capacitor responsible for powering the actuator.
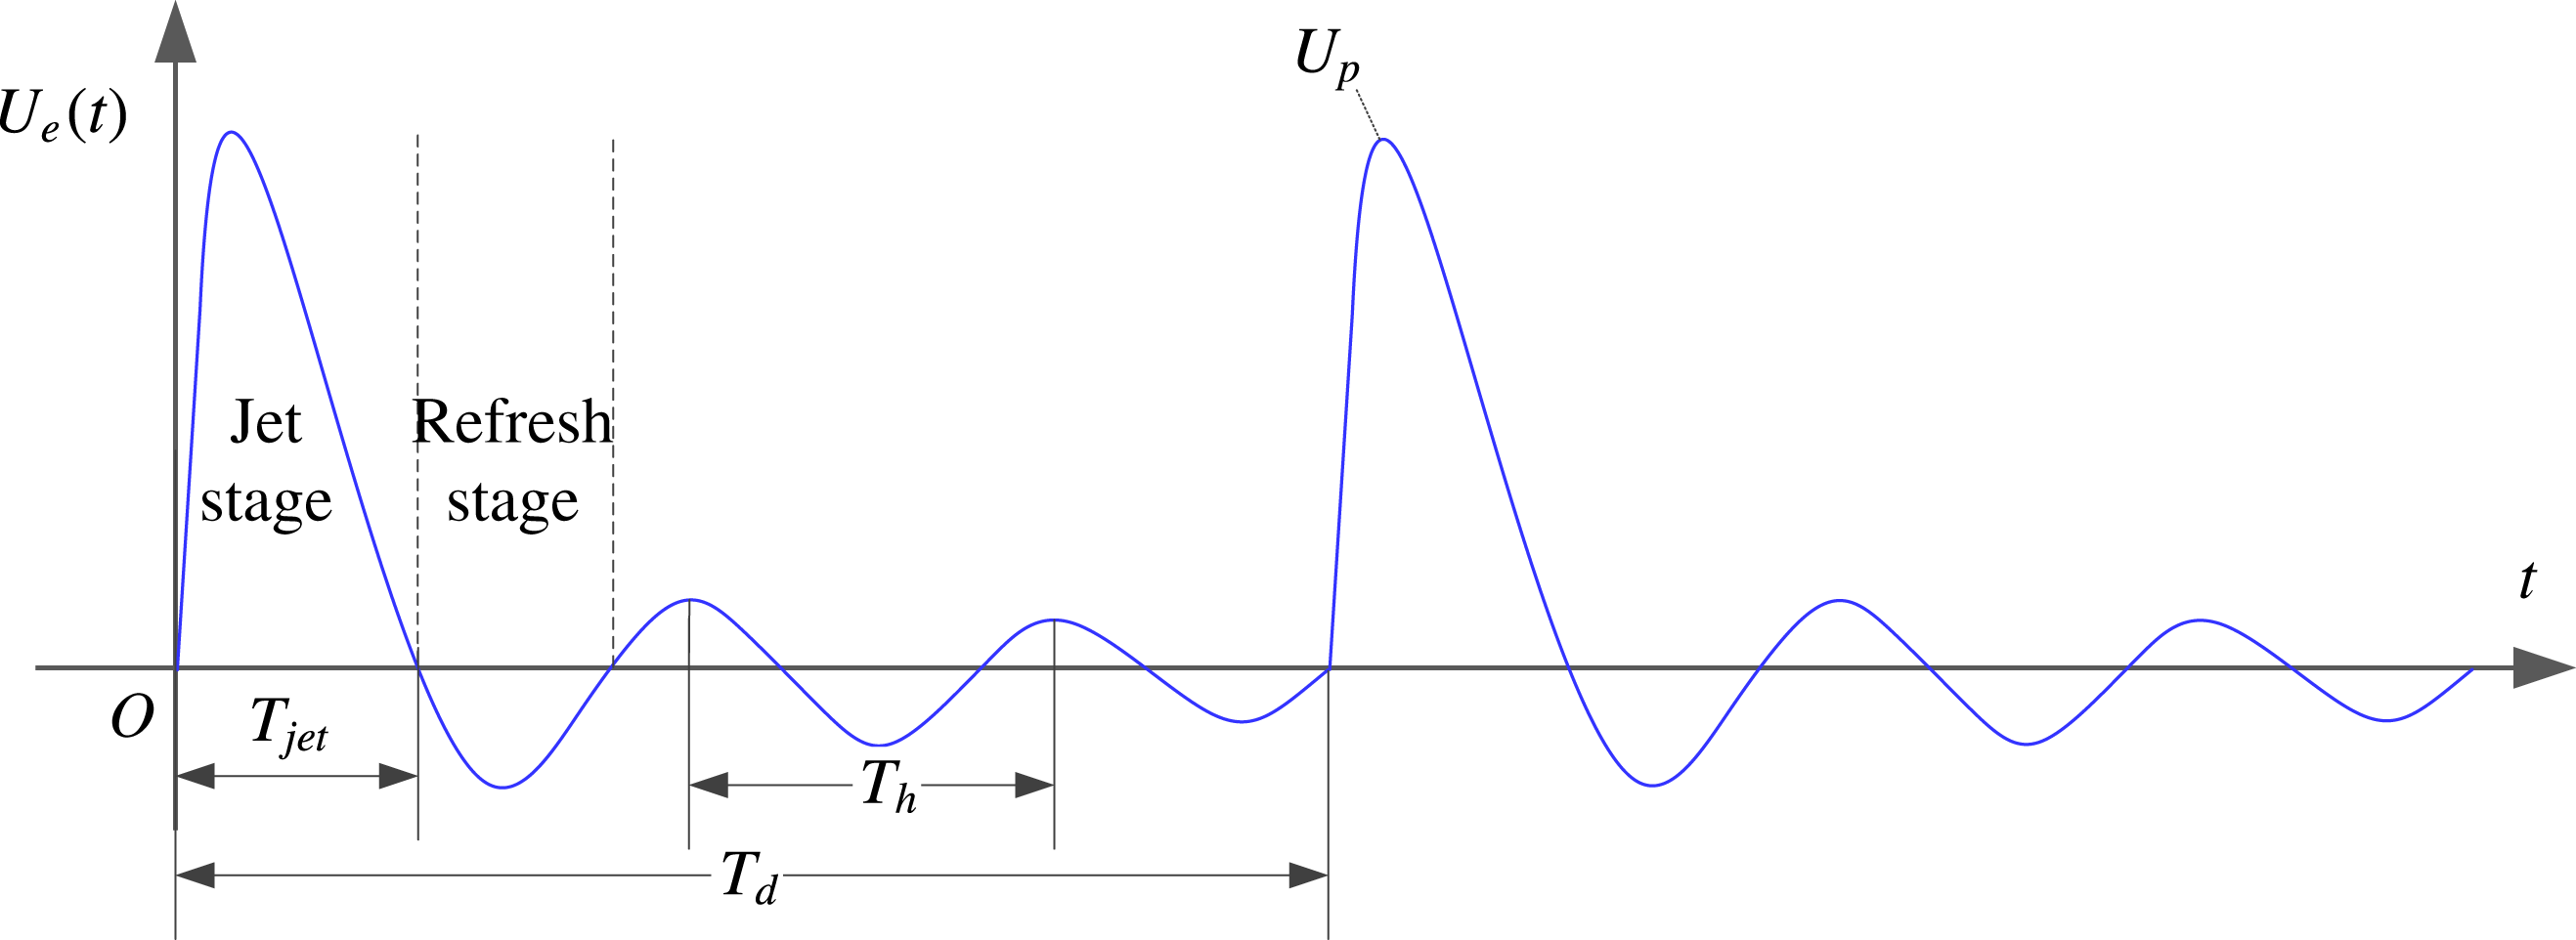
Conceptual temporal evolution of the exit velocity (
 $U_{e}$
). Two actuation cycles are shown.
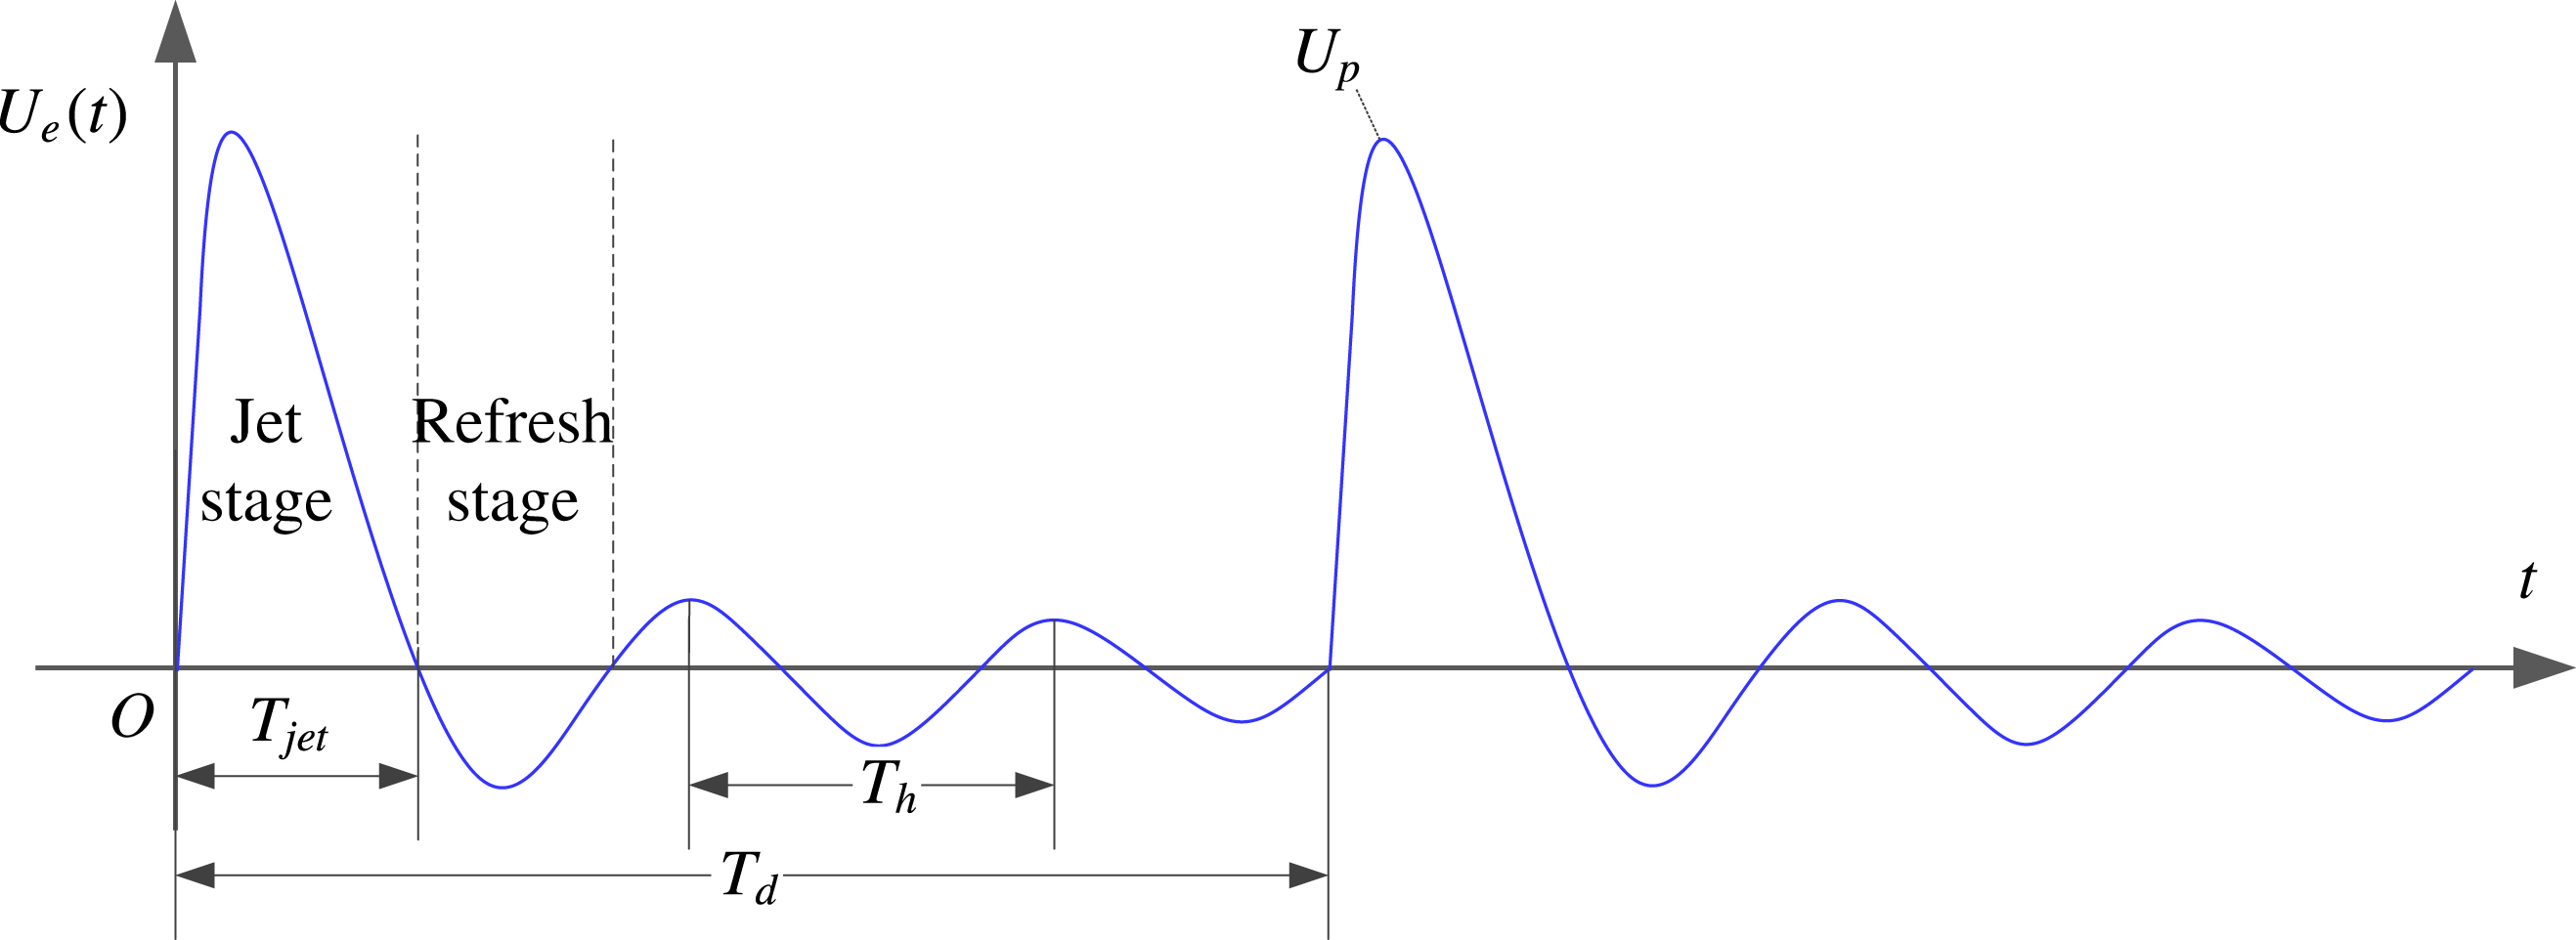
Based on the models in Zong et al. (Reference Zong, Wu, Li, Song, Zhang and Jia2015b
) and Chiatto & de Luca (Reference Chiatto and de Luca2017), a schematic exit velocity trace is shown in figure 2. It should be noted that the energy deposition stage is not sketched due to its extremely short duration compared with the hydrodynamic time scales governing the jet evolution. After the primary jet stage, the actuator behaves like a Helmholtz resonator, where small-amplitude periodical oscillations of the exit velocity can be observed as a result of the inherent stiffness of the cavity air (Chiatto & de Luca Reference Chiatto and de Luca2017). The frequency of alternation between jet and refresh stages (
 $f_{h}=1/T_{h}$
, namely the Helmholtz natural frequency) is related to both atmospheric parameters and geometrical parameters (de Luca, Girfoglio & Coppola Reference de Luca, Girfoglio and Coppola2014) as follows:
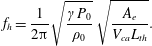 $$\begin{eqnarray}\displaystyle f_{h}=\frac{1}{2\unicode[STIX]{x03C0}}\sqrt{\frac{\unicode[STIX]{x1D6FE}P_{0}}{\unicode[STIX]{x1D70C}_{0}}}\,\sqrt{\frac{A_{e}}{V_{ca}L_{th}}}. & & \displaystyle\end{eqnarray}$$
Here,
 $A_{e}$
is the area of the exit orifice;
 $L_{th}$
,
 $P_{0}$
and
 $\unicode[STIX]{x1D6FE}$
represent the throat length, atmospheric pressure and specific heat ratio respectively. In repetitive working mode, where multiple discharges are initiated in relatively close succession, the PSJA needs at least one refresh stage for recovery. Hence,
 $f_{h}$
can be interpreted as the maximum usable frequency of the PSJA, similar to the saturation frequency proposed by Zong et al. (Reference Zong, Wu, Li, Song, Zhang and Jia2015b
). To describe how significant the frequency effect is, a dimensionless frequency (
 $f^{\ast }$
) can be defined in (2.3), where
 $f_{d}$
,
 $T_{d}$
and
 $T_{h}$
denote the discharge frequency, discharge period and alternation period between jet and refresh stages (
 $1/f_{h}$
) respectively,
 $$\begin{eqnarray}\displaystyle f^{\ast }=\frac{f_{d}}{f_{h}}=\frac{T_{h}}{T_{d}}. & & \displaystyle\end{eqnarray}$$
In the case of
 $f^{\ast }\ll 1$
, the cycle period (time between successive discharges) is long enough to reset the actuator to its original status. As a consequence, the jet intensity in repetitive working mode stays almost identical to that in single-shot operation. On the contrary, if
 $f^{\ast }$
is comparable to or even larger than 1, the intensity of the pulsed jets will deteriorate considerably due to the reduced cavity density (Zong et al.
Reference Zong, Wu, Li, Song, Zhang and Jia2015b
; Chiatto & de Luca Reference Chiatto and de Luca2017).
2.2 Jet intensity quantification
Several evaluation metrics including the peak jet velocity (
 $U_{p}$
) and jet duration time (
 $T_{jet}$
) can be directly extracted from the exit velocity curve shown in figure 2. The ratio of jet duration time to cycle period (
 $T_{d}$
) defines the jet duty cycle,
 $D_{e}=T_{jet}/T_{d}$
. These isolated metrics are crucial, but sensitive to measurement noise. Zong & Kotsonis (Reference Zong and Kotsonis2016b
) proposed an analytical model to estimate the time evolution of the exit density (
 $\unicode[STIX]{x1D70C}_{e}(t)$
), which enables the estimation of the following integral parameters:
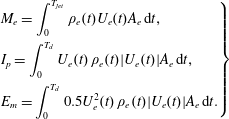 $$\begin{eqnarray}\displaystyle \left.\begin{array}{@{}l@{}}\displaystyle M_{e}=\int _{0}^{T_{jet}}\unicode[STIX]{x1D70C}_{e}(t)U_{e}(t)A_{e}\,\text{d}t,\\ \displaystyle I_{p}=\int _{0}^{T_{d}}U_{e}(t)\,\unicode[STIX]{x1D70C}_{e}(t)|U_{e}(t)|A_{e}\,\text{d}t,\\ \displaystyle E_{m}=\int _{0}^{T_{d}}0.5U_{e}^{2}(t)\,\unicode[STIX]{x1D70C}_{e}(t)|U_{e}(t)|A_{e}\,\text{d}t.\end{array}\right\} & & \displaystyle\end{eqnarray}$$
The parameters
 $M_{e}$
,
 $I_{p}$
and
 $E_{m}$
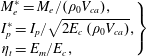
represent the expelled gas mass, jet impulse and issued jet mechanical energy in the primary jet stage respectively. As these parameters are closely related to the actuator geometry and input energy, three non-dimensional parameters can be defined as follows:
 $$\begin{eqnarray}\displaystyle \left.\begin{array}{@{}l@{}}\displaystyle M_{e}^{\ast }=M_{e}/(\unicode[STIX]{x1D70C}_{0}V_{ca}),\\ \displaystyle I_{p}^{\ast }=I_{p}/\sqrt{2E_{c}\,(\unicode[STIX]{x1D70C}_{0}V_{ca})},\\ \displaystyle \unicode[STIX]{x1D702}_{t}=E_{m}/E_{c},\end{array}\right\} & & \displaystyle\end{eqnarray}$$
where the product
 $\unicode[STIX]{x1D70C}_{0}V_{ca}$
is essentially the initial mass of the cavity gas. The non-dimensional impulse (
 $I_{p}^{\ast }$
, also termed the ‘impulse efficiency’) shares similar meaning to the total energy efficiency (
 $\unicode[STIX]{x1D702}_{t}$
), quantifying the effectiveness of the PSJA in producing pulsed jets.
2.3 Stroke length and Reynolds number
To normalize the formation and evolution characteristics, appropriate reference scales should be determined. In this study, the orifice diameter (
 $D_{0}$
), cycle period (
 $T_{d}$
) and peak jet velocity (
 $U_{p}$
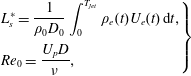
) are selected as the primary reference length, time and velocity scales respectively. The reference velocity is defined independently, instead of deriving it from the length and time scales, since the jet intensity information is necessary to collapse the evolution laws generated by PSJs of different intensities. Based on these reference scales, the non-dimensional stroke length (
 $L_{s}^{\ast }$
) and the Reynolds number (
 $Re_{0}$
) can be computed as follows:
 $$\begin{eqnarray}\displaystyle \left.\begin{array}{@{}l@{}}\displaystyle L_{s}^{\ast }=\frac{1}{\unicode[STIX]{x1D70C}_{0}D_{0}}\int _{0}^{T_{jet}}\unicode[STIX]{x1D70C}_{e}(t)U_{e}(t)\,\text{d}t,\\ \displaystyle Re_{0}=\frac{U_{p}D}{\unicode[STIX]{x1D708}},\end{array}\right\} & & \displaystyle\end{eqnarray}$$
where
 $\unicode[STIX]{x1D708}$
is the kinematic viscosity at ambient conditions. Differently from the approach of Shuster & Smith (Reference Shuster and Smith2007), a correction for density changes is applied to the definition of
 $L_{s}^{\ast }$
as PSJs of different densities are expected to behave differently in the axial penetration and radial spreading rate. In the current study, the influence of energy deposition and discharge frequency is examined. On keeping the energy deposition fixed and increasing the frequency,
 $L_{s}$
and
 $Re_{0}$
hardly change if the frequency effect proposed by Zong et al. (Reference Zong, Wu, Li, Song, Zhang and Jia2015b
) is negligible. Conversely, with increasing discharge energy and unchanged frequency, both
 $L_{s}$
and
 $Re_{0}$
will increase.
3 Experimental set-up and measurement system
3.1 Actuator and power supply
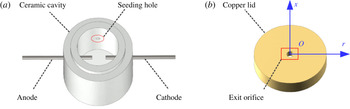
Actuator construction and components: (a) ceramic cavity and (b) copper lid. The axisymmetric coordinate system used is shown in blue.
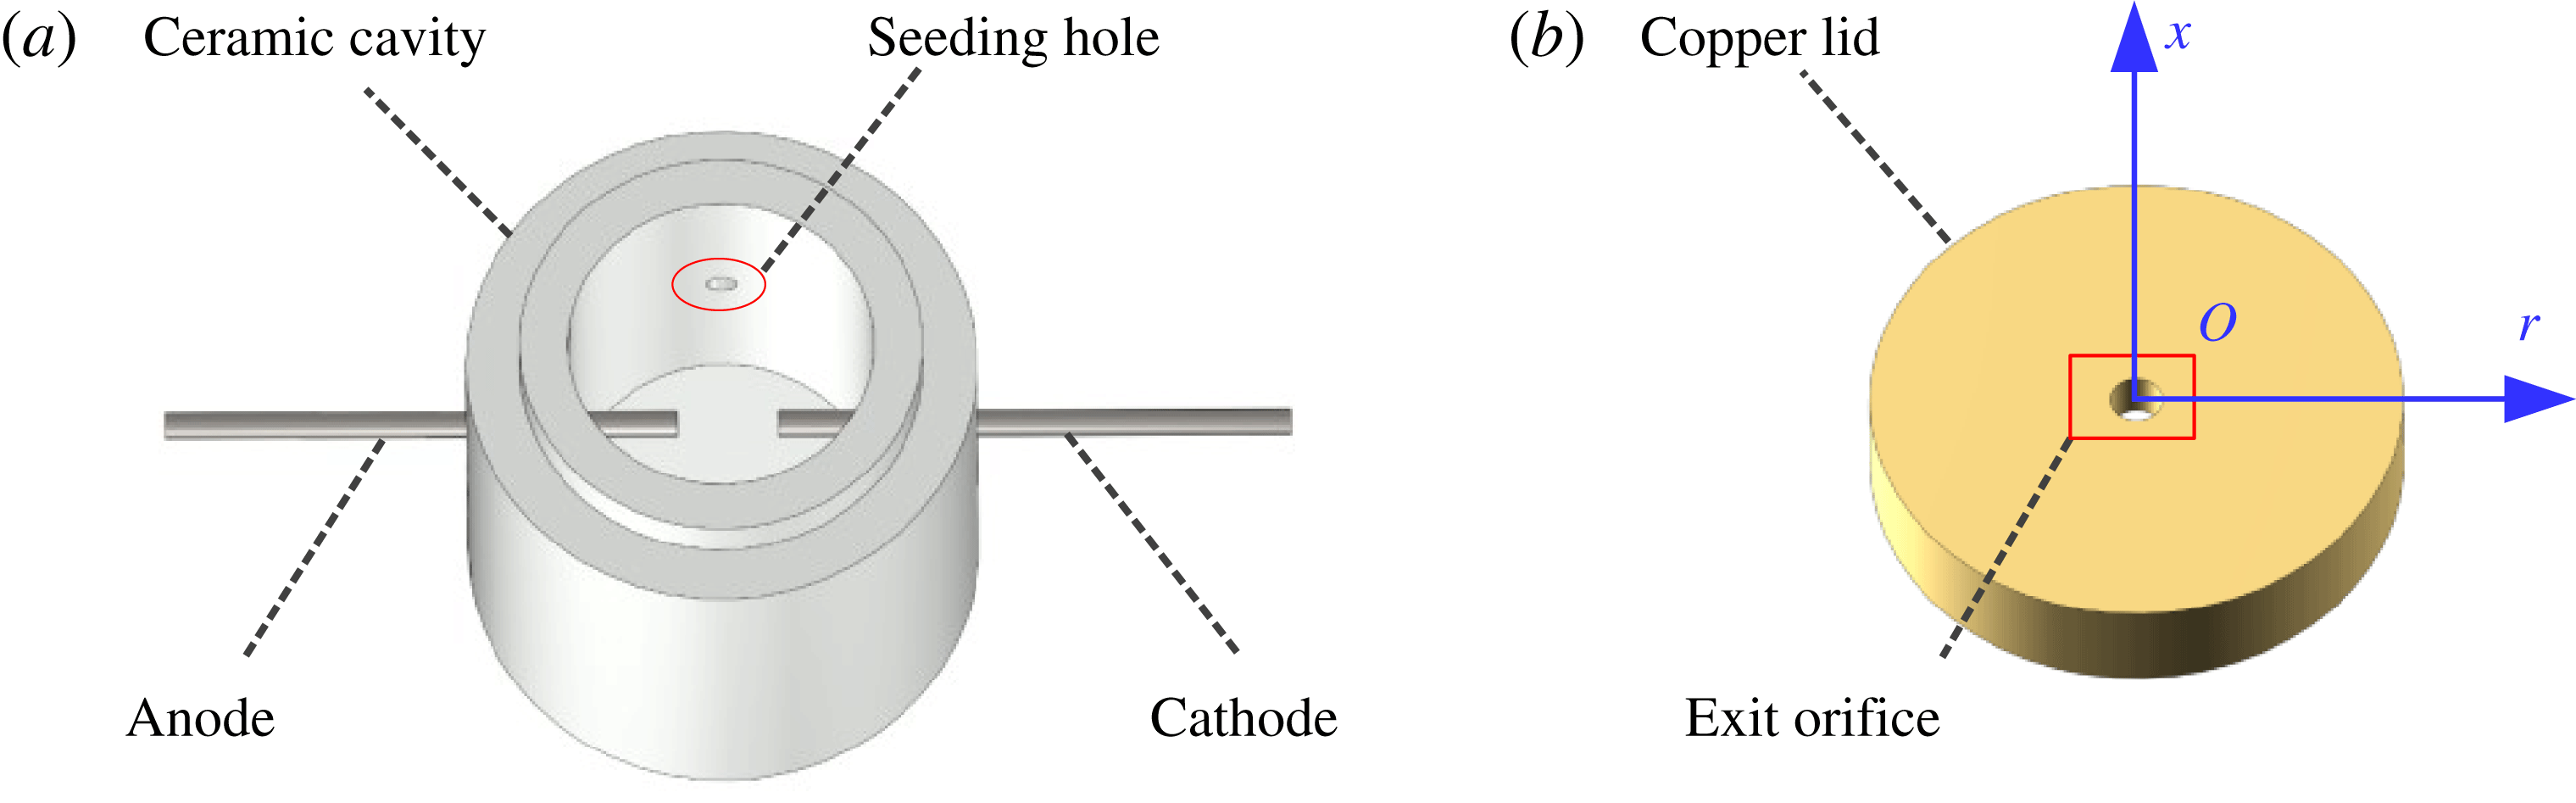
As shown in figure 3, a two-electrode PSJA is adopted consisting of a ceramic cavity and a bronze lid. The ceramic cavity made of machinable glass ceramic (MACOR) can be assembled with the copper lid through a step groove, to thus form an air-tight intracavity. The diameter and height of the intracavity are 12 mm and 15 mm respectively, resulting in a volume of
 $1696~\text{mm}^{3}$
. Three holes (diameter 1 mm) are drilled in a plane positioned 7.5 mm above the cavity bottom. Two tungsten needles are inserted into the two opposing holes, serving as anode and cathode respectively. The interelectrode distance between the anode and the cathode is set as 4 mm. The remaining hole is designed for intracavity PIV seeding, as was proposed by Zong & Kotsonis (Reference Zong and Kotsonis2016a
), to improve the issue of lack of particles in the jet core region reported by Ko et al. (Reference Ko, Haack, Land, Cybyk, Katz and Kim2010). A round orifice (diameter 2 mm, throat length 2 mm) is created in the centre of the copper lid, serving as the jet exit. Based on the above dimensions, the Helmholtz natural frequency (
 $f_{h}$
) calculated by (2.2) is estimated to be 1.65 kHz, resulting in a theoretical alternation period (
 $T_{h}$
) of
 $607~\unicode[STIX]{x03BC}\text{s}$
. Additionally, a reference coordinate system is established in the centre of the jet exit, with the
 $r$
-axis and
 $x$
-axis along the radial and axial directions respectively (figure 3).
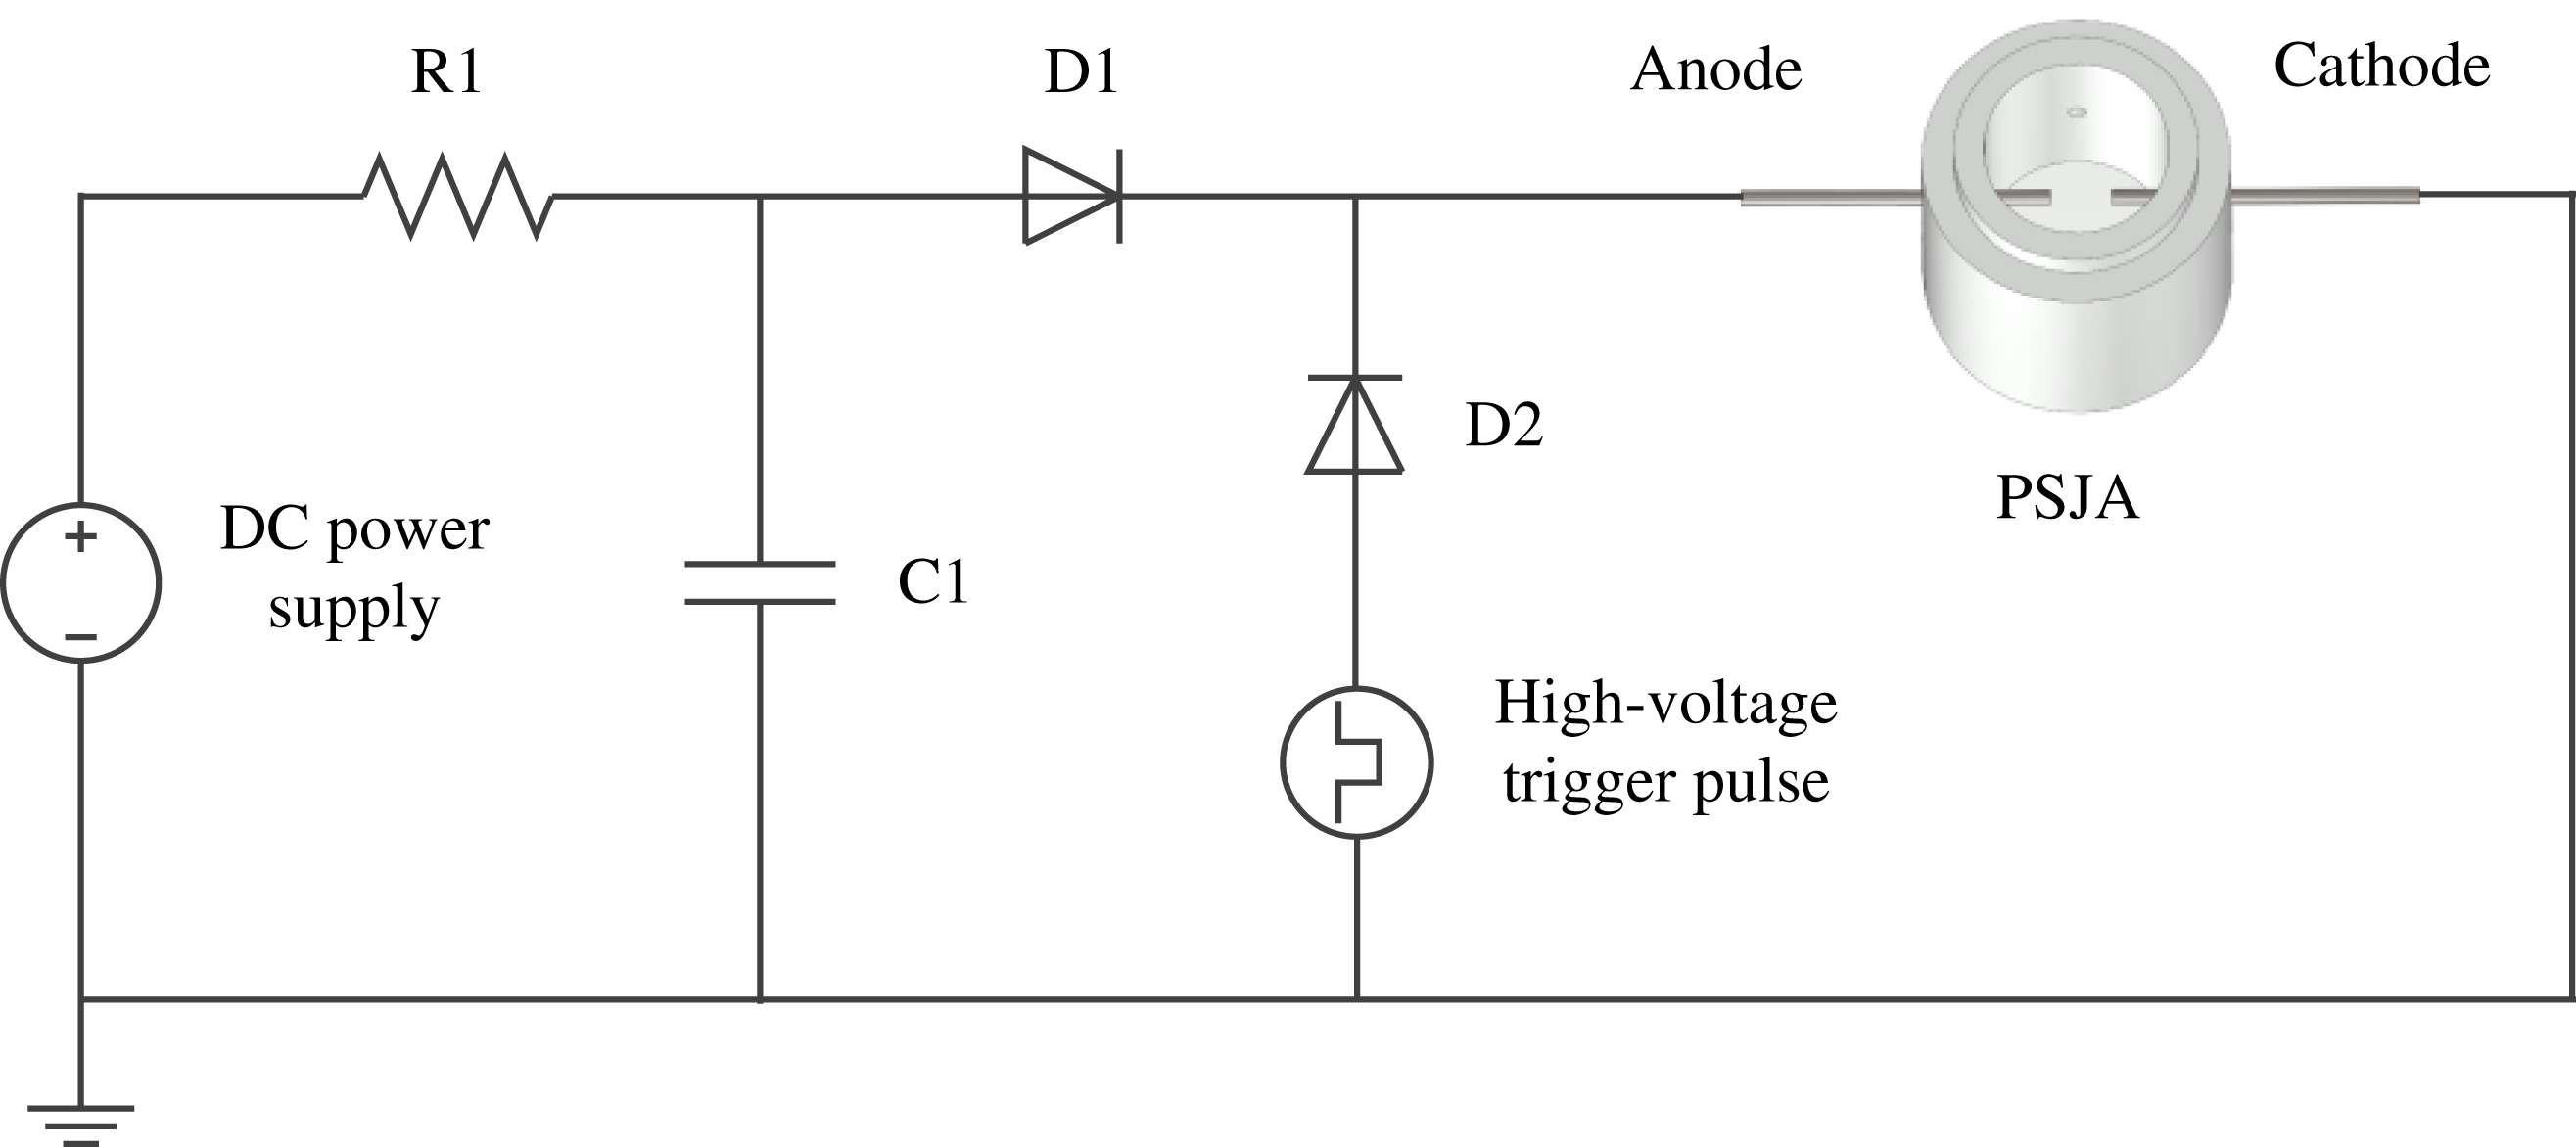
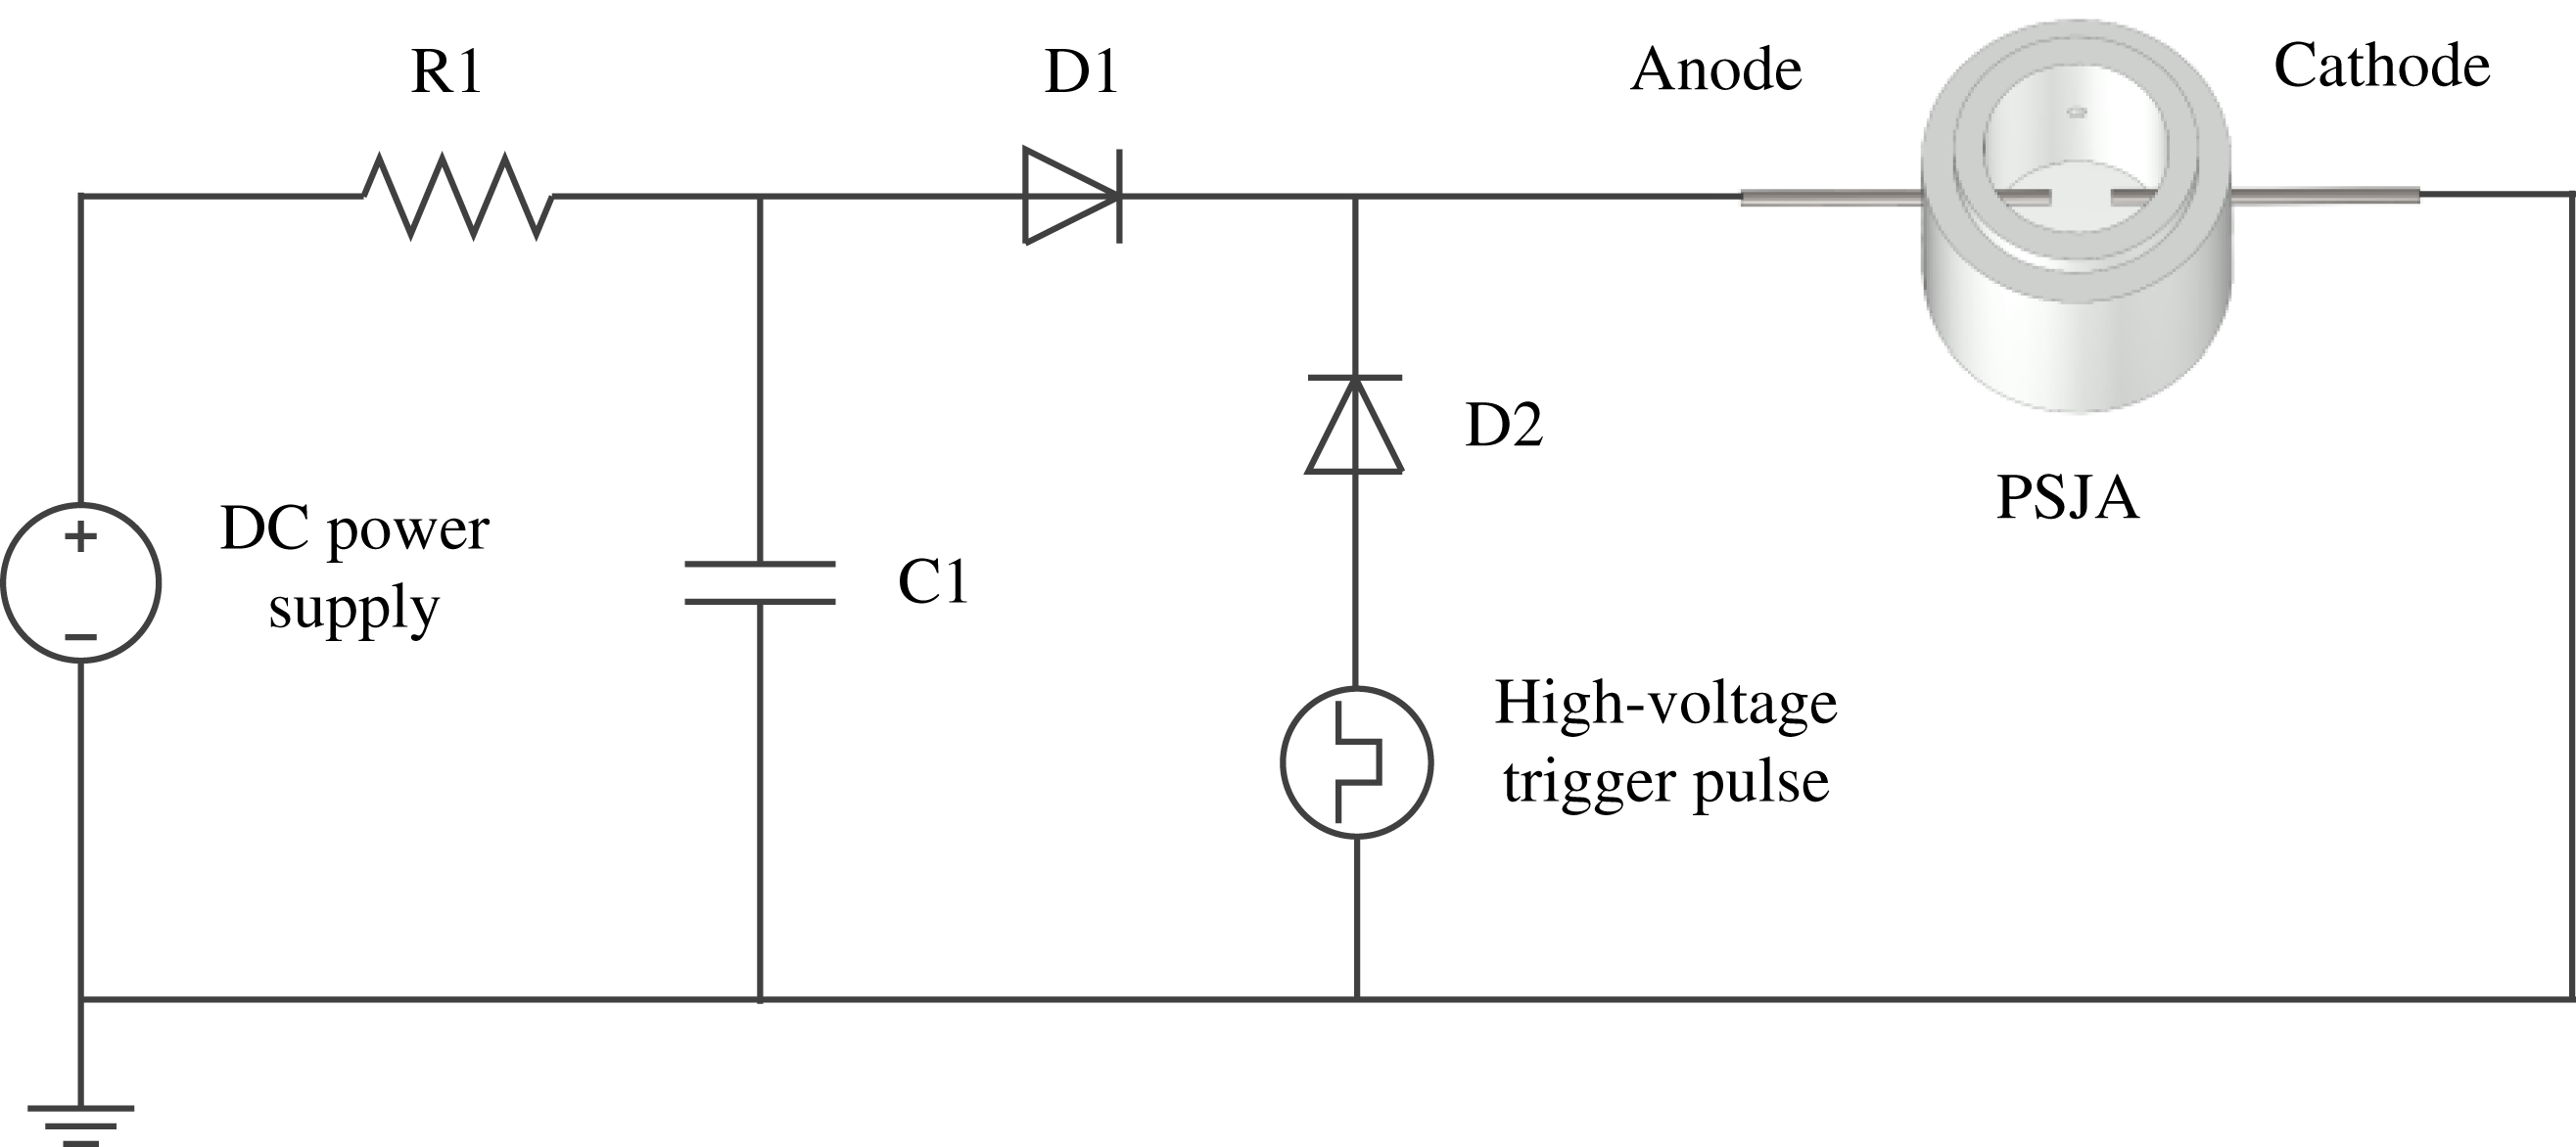
A sequential discharge power supply (triggered discharge–capacitive discharge) was designed to power the actuator, as shown in figure 4. Compared with the power supply system previously used in Zong & Kotsonis (Reference Zong and Kotsonis2016a
), the architecture of this power supply is simplified since no extra trigger electrode is needed. The DC power supply (peak voltage 2.5 kV, power 2000 W) provides the energy necessary for charging capacitor C1 (capacitance
 $1~\unicode[STIX]{x03BC}\text{F}$
, withstanding voltage 5 kV). Resistor R1 (resistance
 $1~\text{k}\unicode[STIX]{x03A9}$
, power 200 W) is used to limit the charging current, for protection of the power supply. During the operation of the PSJA, high-voltage low-energy trigger pulses (amplitude 20 kV, pulse width
 $100~\unicode[STIX]{x03BC}\text{s}$
) are produced by a high-voltage amplifier (Trek Model 20/20 C) to initiate the discharge channel. Subsequently, the energy stored in capacitor C1 is released rapidly into the actuator cavity via arc heating. After evacuation, capacitor C1 is recharged, preparing for the launch of the next cycle. The intensity and repetition rate of the pulsed jet can be tuned conveniently by changing the capacitor charging voltage (
 $V_{0}$
) and the trigger frequency (
 $f_{d}$
) respectively.
Circuitry and configuration of the power supply system.
3.2 The PIV system and measurement scheme
A high-speed two-component planar PIV system was employed to measure the jet induced flow in the axisymmetric plane (
 $xr$
-plane). The actuator was placed in an enclosed Plexiglas box and an atomizer (TSI, 9302) was used to seed dielectric mineral oil particles (Shell Ondina, average diameter
 $1~\unicode[STIX]{x03BC}\text{m}$
) into both the box and the actuator cavity. Prior to discharge ignition, the intracavity seeding was switched off by a mechanical valve to guarantee quiescent flow conditions. The PIV system consisted of a high-speed laser (Continuum Mesa PIV, 532-120-M, 30 J per pulse), a high-speed CCD camera (Photron, Fastcam SA-1) and a high-speed controller (LaVision, HSC). The laser beam emitted from the laser head was first shaped into a thin sheet by two spherical lenses and one cylindrical lens, and further conditioned by two knife edges. The final laser sheet (thickness 0.5 mm) passing through the jet exit centre was kept strictly vertical, to eliminate the influence of buoyancy. The time delay between two subsequent laser pulses (
 $\text{d}t$
) was adjusted dynamically to maintain a peak particle displacement of approximately 10 pixels.
A 200 mm macro lens (Nikon, Micro-Nikkor) attached to a 36 mm extension tube was mounted on the high-speed camera. By changing the object–camera distance, the jet flow was imaged in two sets of field of view (FOV), to achieve respectively highly resolved near-field structures and fully developed far-field characteristics. For the near-field measurement, the imaged FOV was
 $15\times 15~\text{mm}^{2}$
(
 $7.5D\times 7.5D$
), resulting in a magnification ratio of 1.37. For the far-field test, the imaged FOV was extended to
 $45\times 45~\text{mm}^{2}$
(
 $22.5D\times 22.5D$
), corresponding to a magnification ratio of 0.46. The digital resolution of the high-speed camera was
 $1024\times 1024$
pixels. Raw images were recorded in double frame mode at a sampling rate corresponding to the discharge frequency (
 $f_{d}$
). DaVis 8.3.1 was used to record and process the datasets. The final PIV interrogation window size and the overlapping ratio were
 $16\times 16$
and 75 % respectively, resulting in spatial resolutions of
 $0.059~\text{mm}~\text{vector}^{-1}$
and
 $0.18~\text{mm}~\text{vector}^{-1}$
in near-field and far-field tests respectively. The PIV system and the discharge system were synchronized by a digital delay/pulse generator (Stanford Research Systems, Model DG535) working in phase-locked mode. The camera recording frequency was identical to the discharge frequency for all of the tested cases (50 Hz, 100 Hz or 200 Hz). The time delay between discharge ignition and camera recording (denoted as
 $t$
, namely the phase), was adjusted within an accuracy of less than
 $1~\unicode[STIX]{x03BC}\text{s}$
. To retrieve the entire jet evolution pertaining to a single discharge event, approximately 60 phases were selected, at which PIV measurements were obtained. The selected phases ranged from the incipient emanation of shock waves, immediately after discharge initiation (
 $t=50~\unicode[STIX]{x03BC}\text{s}$
), to the complete termination of one cycle (
 $t=T_{d}=1/f$
). The full resolution of the cycle enabled the synthesis of statistically converged time-averaged flow fields of the PSJ. The time step between adjacent phases increased gradually from
 $25~\unicode[STIX]{x03BC}\text{s}$
to
 $1000~\unicode[STIX]{x03BC}\text{s}$
depending on the peak jet velocity observed in snapshots.
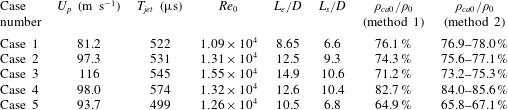
The test parameters for each case.
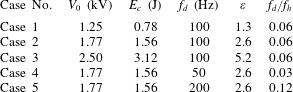
For each resolved phase, three PIV sequences were recorded. Each sequence contained successively the snapshots of the first 100 pulses after the PSJA was activated. Due to the frequency effect postulated in Sary et al. (Reference Sary, Dufour, Rogier and Kourtzanidis2014) and Zong et al. (Reference Zong, Wu, Li, Song, Zhang and Jia2015b
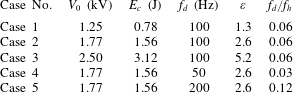
), several of the initial pulses of each sequence (less than 20) were working in the transient stage signified by an unstable actuator performance, while the remaining pulses lay in the quasi-steady stage where the jet intensity remained almost unchanged from pulse to pulse. Based on this consideration, only the last 70 pulses of each sequence were used to execute the phase-averaging operation, resulting in 210 realizations in total for each phase. Five cases with varied capacitor energy and discharge frequency were investigated, as shown in table 1. In cases 1–3, the discharge frequency is kept constant while the energy deposition increases monotonically by a factor of four (
 $1.3\rightarrow 5.2$
). For cases 4, 2 and 5, the dimensionless frequency increases from 0.03 to 0.12 while the energy deposition is kept constant. An overview of the tested cases and pertinent actuation parameters is shown in table 1. It should be noted that the maximum frequency tested here (200 Hz, case 5) is actually limited by the characteristic time of the charging circuit (
 $\unicode[STIX]{x1D70F}=1~\text{ms}$
, product of R1 and C1). A time of at least four
 $\unicode[STIX]{x1D70F}$
is necessary to fully recover the energy-storing capacitor, leading to a maximum reliable working frequency of 250 Hz.
The finite sample size, PIV peak locking errors, finite laser sheet thickness, discharge timing uncertainty and tracer particle lag are recognized as the five main sources of phase-locked PIV measurement uncertainty. Zong & Kotsonis (Reference Zong and Kotsonis2017a
,Reference Zong and Kotsonis
b
) discussed the measurement uncertainty caused by the first four sources in detail. For the measurement uncertainty incurred by tracer particle lag, a relaxation time of
 $3.5~\unicode[STIX]{x03BC}\text{s}$
(Ragni et al.
Reference Ragni, Schrijer, van Oudheusden and Scarano2011; Laurendeau et al.
Reference Laurendeau, Léon, Chedevergne, Senoner and Casalis2017) and a jet acceleration time of
 $100~\unicode[STIX]{x03BC}\text{s}$
(see figure 7) are used to evaluate the maximum error. As a result, the peak relative errors of the phase-averaged axial velocity (
 $U_{x}$
) incurred by the aforementioned five sources are estimated to be 3.1 %, 1.5 %, 2.1 %, 2.5 % and 3.5 % respectively. The Euclidean sum of these five errors gives the total measurement uncertainty, which is less than 5.9 % of the peak jet velocity (
 $U_{p}$
).
4 Phase-averaged results
In § 4.1, the time evolution of the phase-averaged velocity fields is analysed, and the high-speed jet, localized suction and front vortex ring are identified as the three major flow structures pertaining to the jet evolution. From §§ 4.2 to 4.4, these three major flow structures are characterized sequentially, and intercase comparison of the non-dimensional formation and evolution laws is carried out to extract the effect of non-dimensional energy deposition and frequency.
4.1 Phase-averaged velocity fields
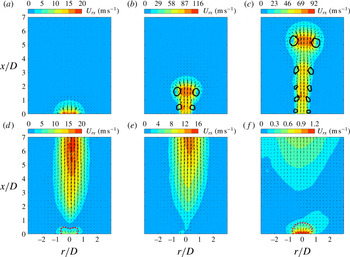
Phase-averaged velocity fields (small FOV) at increasing time delays for case 3 (
 $f_{d}=100~\text{Hz}$
): (a)
 $t=50~\unicode[STIX]{x03BC}\text{s}$
,
 $t/T_{h}=0.08$
; (b)
 $t=150~\unicode[STIX]{x03BC}\text{s}$
,
 $t/T_{h}=0.25$
; (c)
 $t=300~\unicode[STIX]{x03BC}\text{s}$
,
 $t/T_{h}=0.49$
; (d)
 $t=700~\unicode[STIX]{x03BC}\text{s}$
,
 $t/T_{h}=1.15$
; (e)
 $t=900~\unicode[STIX]{x03BC}\text{s}$
,
 $t/T_{h}=1.48$
; (f)
 $t=9000~\unicode[STIX]{x03BC}\text{s}$
,
 $t/T_{h}=14.83$
. The in-plane velocity is plotted as vectors and contours. The solid black lines in (b,c) indicate the vortices detected with the
 $Q$
-criterion. The threshold values are selected as 10 % of the maximum
 $Q$
-values. The dashed red lines in (d) and (f) are contour lines of 50 % of the peak suction velocity.
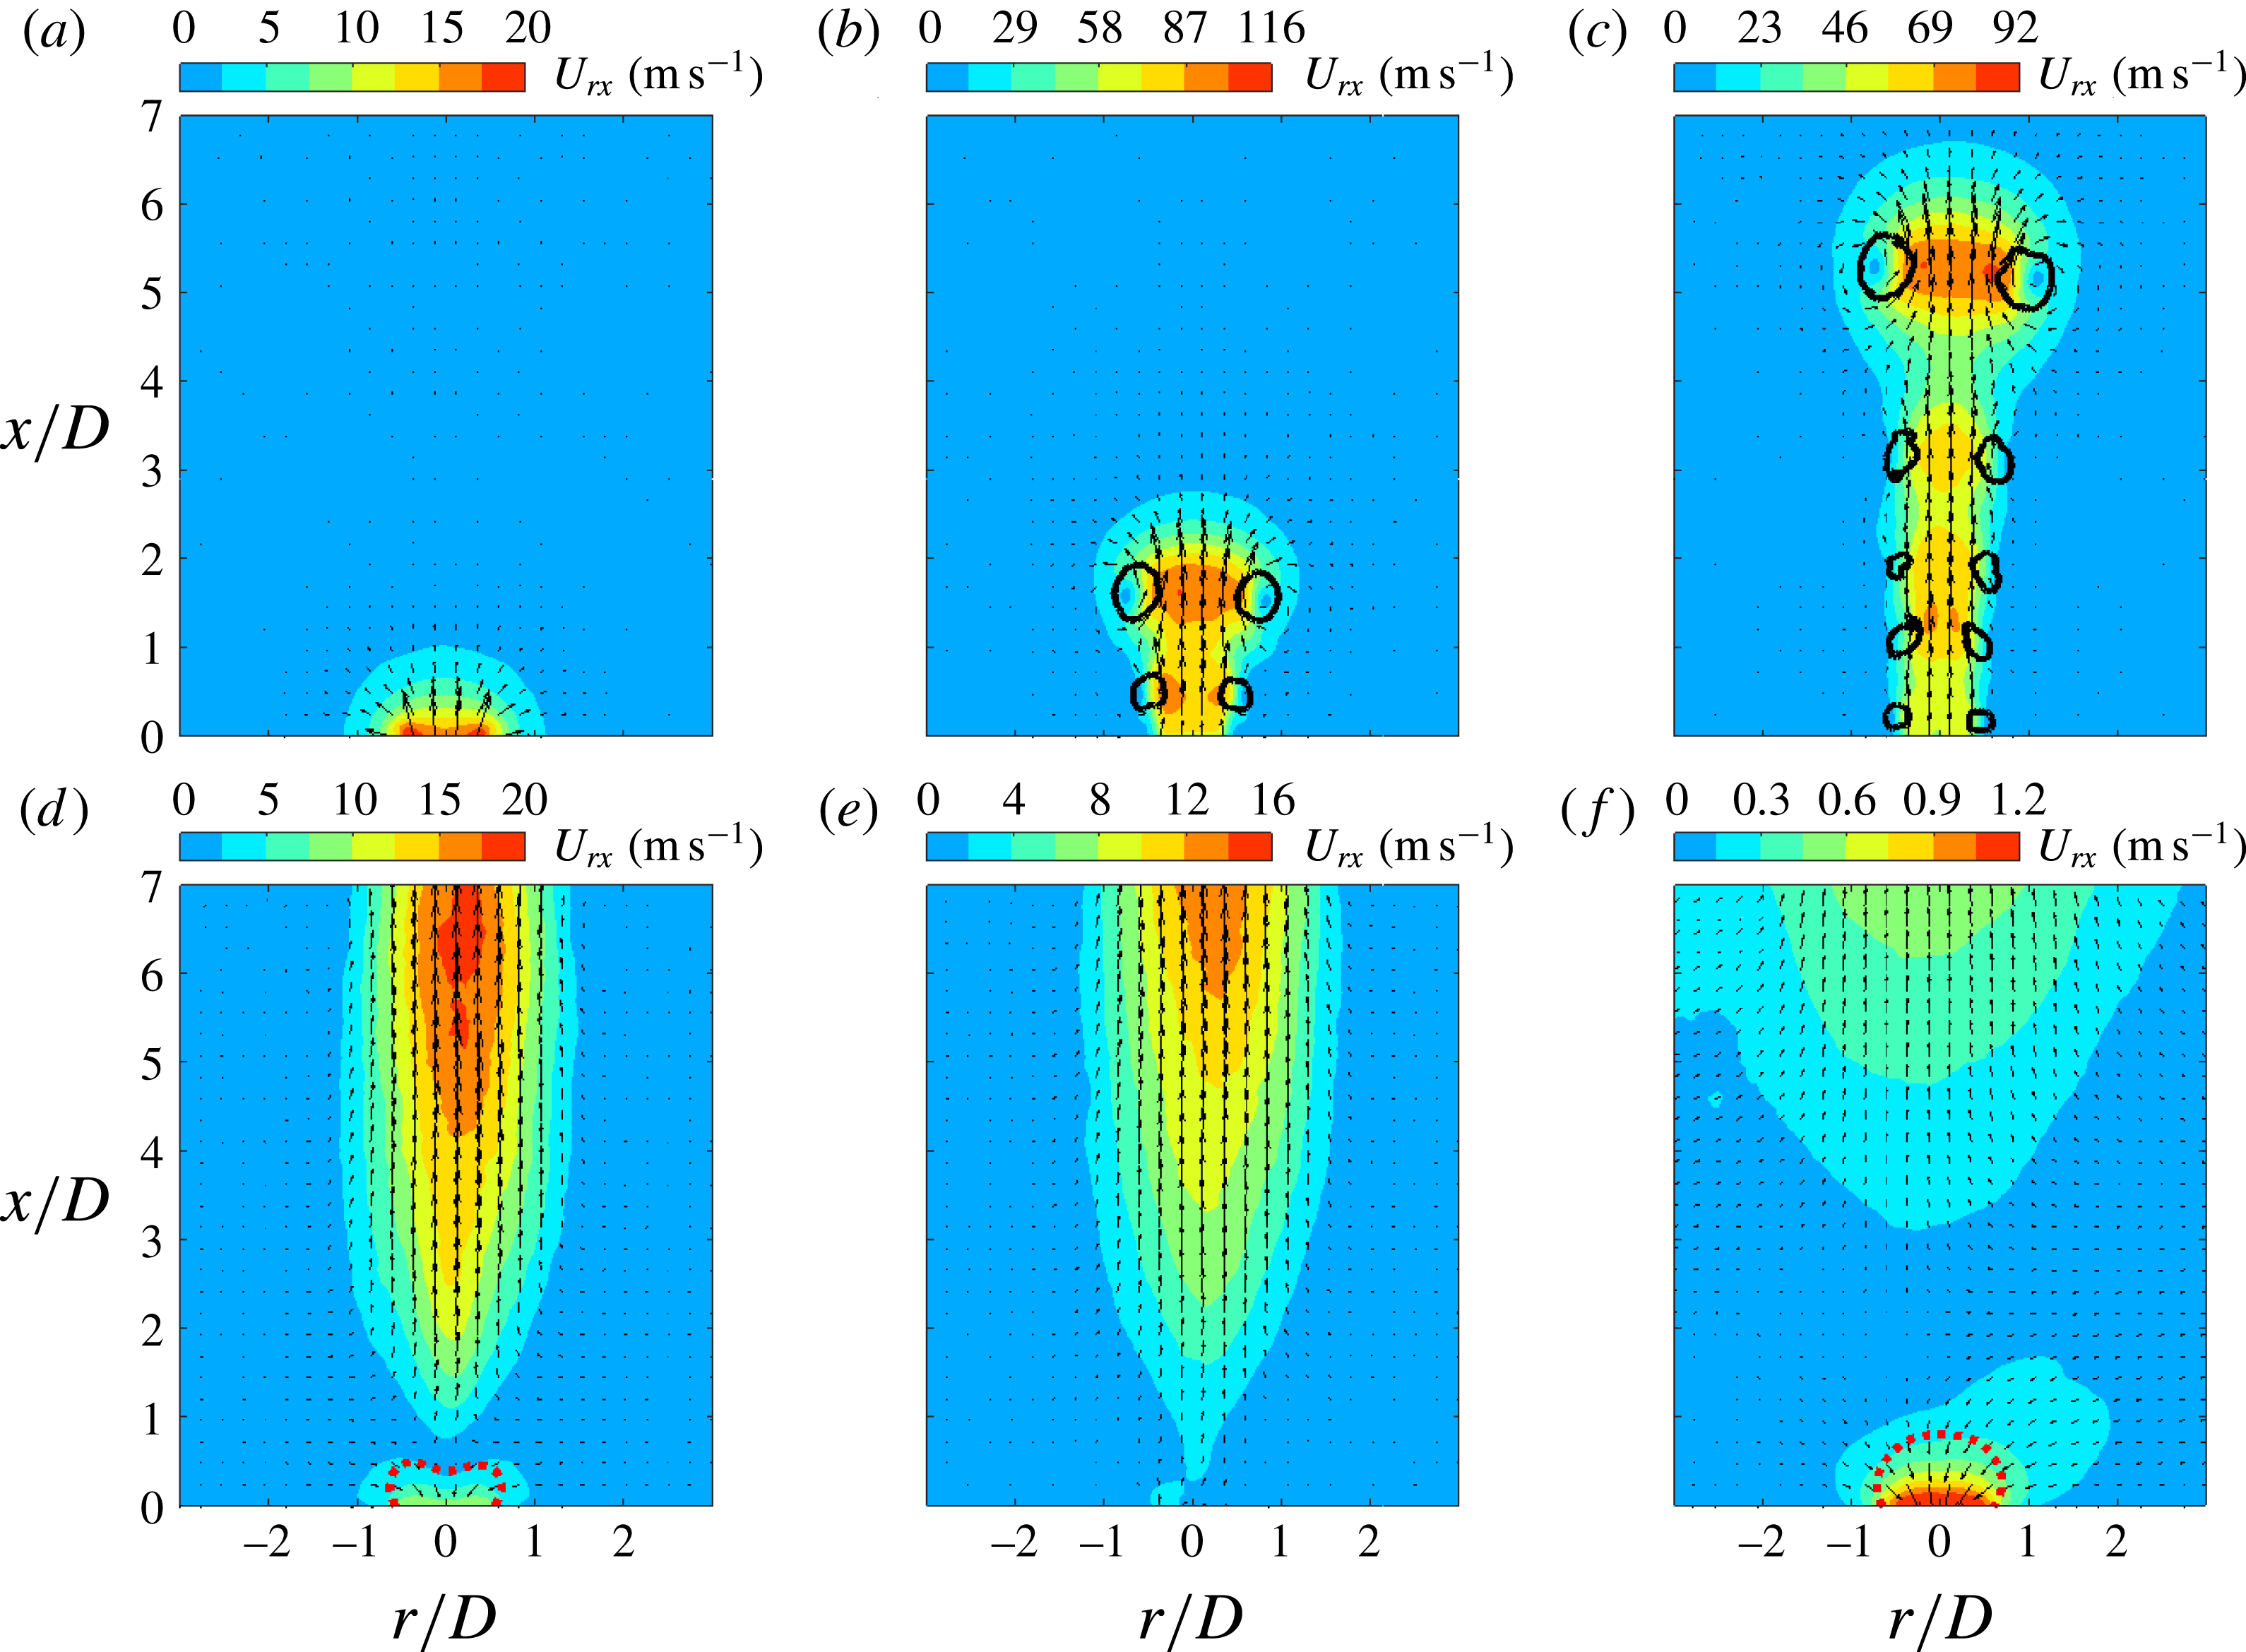
Phase-averaged velocity fields at increasing time delays are shown in figure 5 for case 3 and the small FOV. Here,
 $U_{rx}$
denotes the Euclidean sum of the in-plane velocity components,
 $U_{rx}=2\sqrt{U_{r}^{2}+U_{x}^{2}}$
. At
 $t=50~\unicode[STIX]{x03BC}\text{s}$
, an incipient jet with relatively low exit velocity (
 ${<}20~\text{m}~\text{s}^{-1}$
) is observed. The bow-shaped contour lines are footprints of the outwards-propagating shock waves induced by the rapid arc discharge (Zong & Kotsonis Reference Zong and Kotsonis2016a
). Subsequently, the jet forms and the circular shear layer rolls into a vortex ring, which always resides in the jet front during axial propagation. This front vortex ring (FVR) is essentially equivalent to the starting vortex ring in viscous pulsed jets (Cantwell Reference Cantwell1986). Due to the self-induction effect, a velocity value as high as
 $116~\text{m}~\text{s}^{-1}$
is registered at the centre of the FVR in figure 5(b). The Reynolds number based on this velocity value and the orifice diameter (2 mm) is approximately
 $1.6\times 10^{4}$
, indicating a fully turbulent regime for the front vortex ring. In addition, several shear-layer vortices along the body of the jet resulting from Kelvin–Helmholtz instability are prominent in figure 5(b,c). The axial spacing of these vortices remains approximately constant at
 $1D$
during the propagation.
In figure 5(d), the fluid near the exit orifice is ingested into the actuator cavity, indicating the presence of the refresh stage. The peak suction velocity is around
 $10~\text{m}~\text{s}^{-1}$
, one order less than the corresponding peak jet velocity (figure 5
b). This feature differs significantly from the case of a piezoelectric SJA where the velocity traces during the ejection and ingestion stages are roughly of the same order of magnitude (Shuster & Smith Reference Shuster and Smith2007). At
 $t=900~\unicode[STIX]{x03BC}\text{s}$
, the suction phenomenon diminishes considerably, anticipating the emanation of a second jet stage. Multiple alternations between the jet and refresh stages in one cycle have been confirmed in Zong et al. (Reference Zong, Wu, Li, Song, Zhang and Jia2015b
) and Zong & Kotsonis (Reference Zong and Kotsonis2016a
). This phenomenon differentiates the PSJA once again from the corresponding piezoelectric SJA, where only one alternation is observed per cycle. In figure 5(f), it is striking to note that the suction flow persists until the launch of next cycle (
 $t=9000~\unicode[STIX]{x03BC}\text{s}$
).
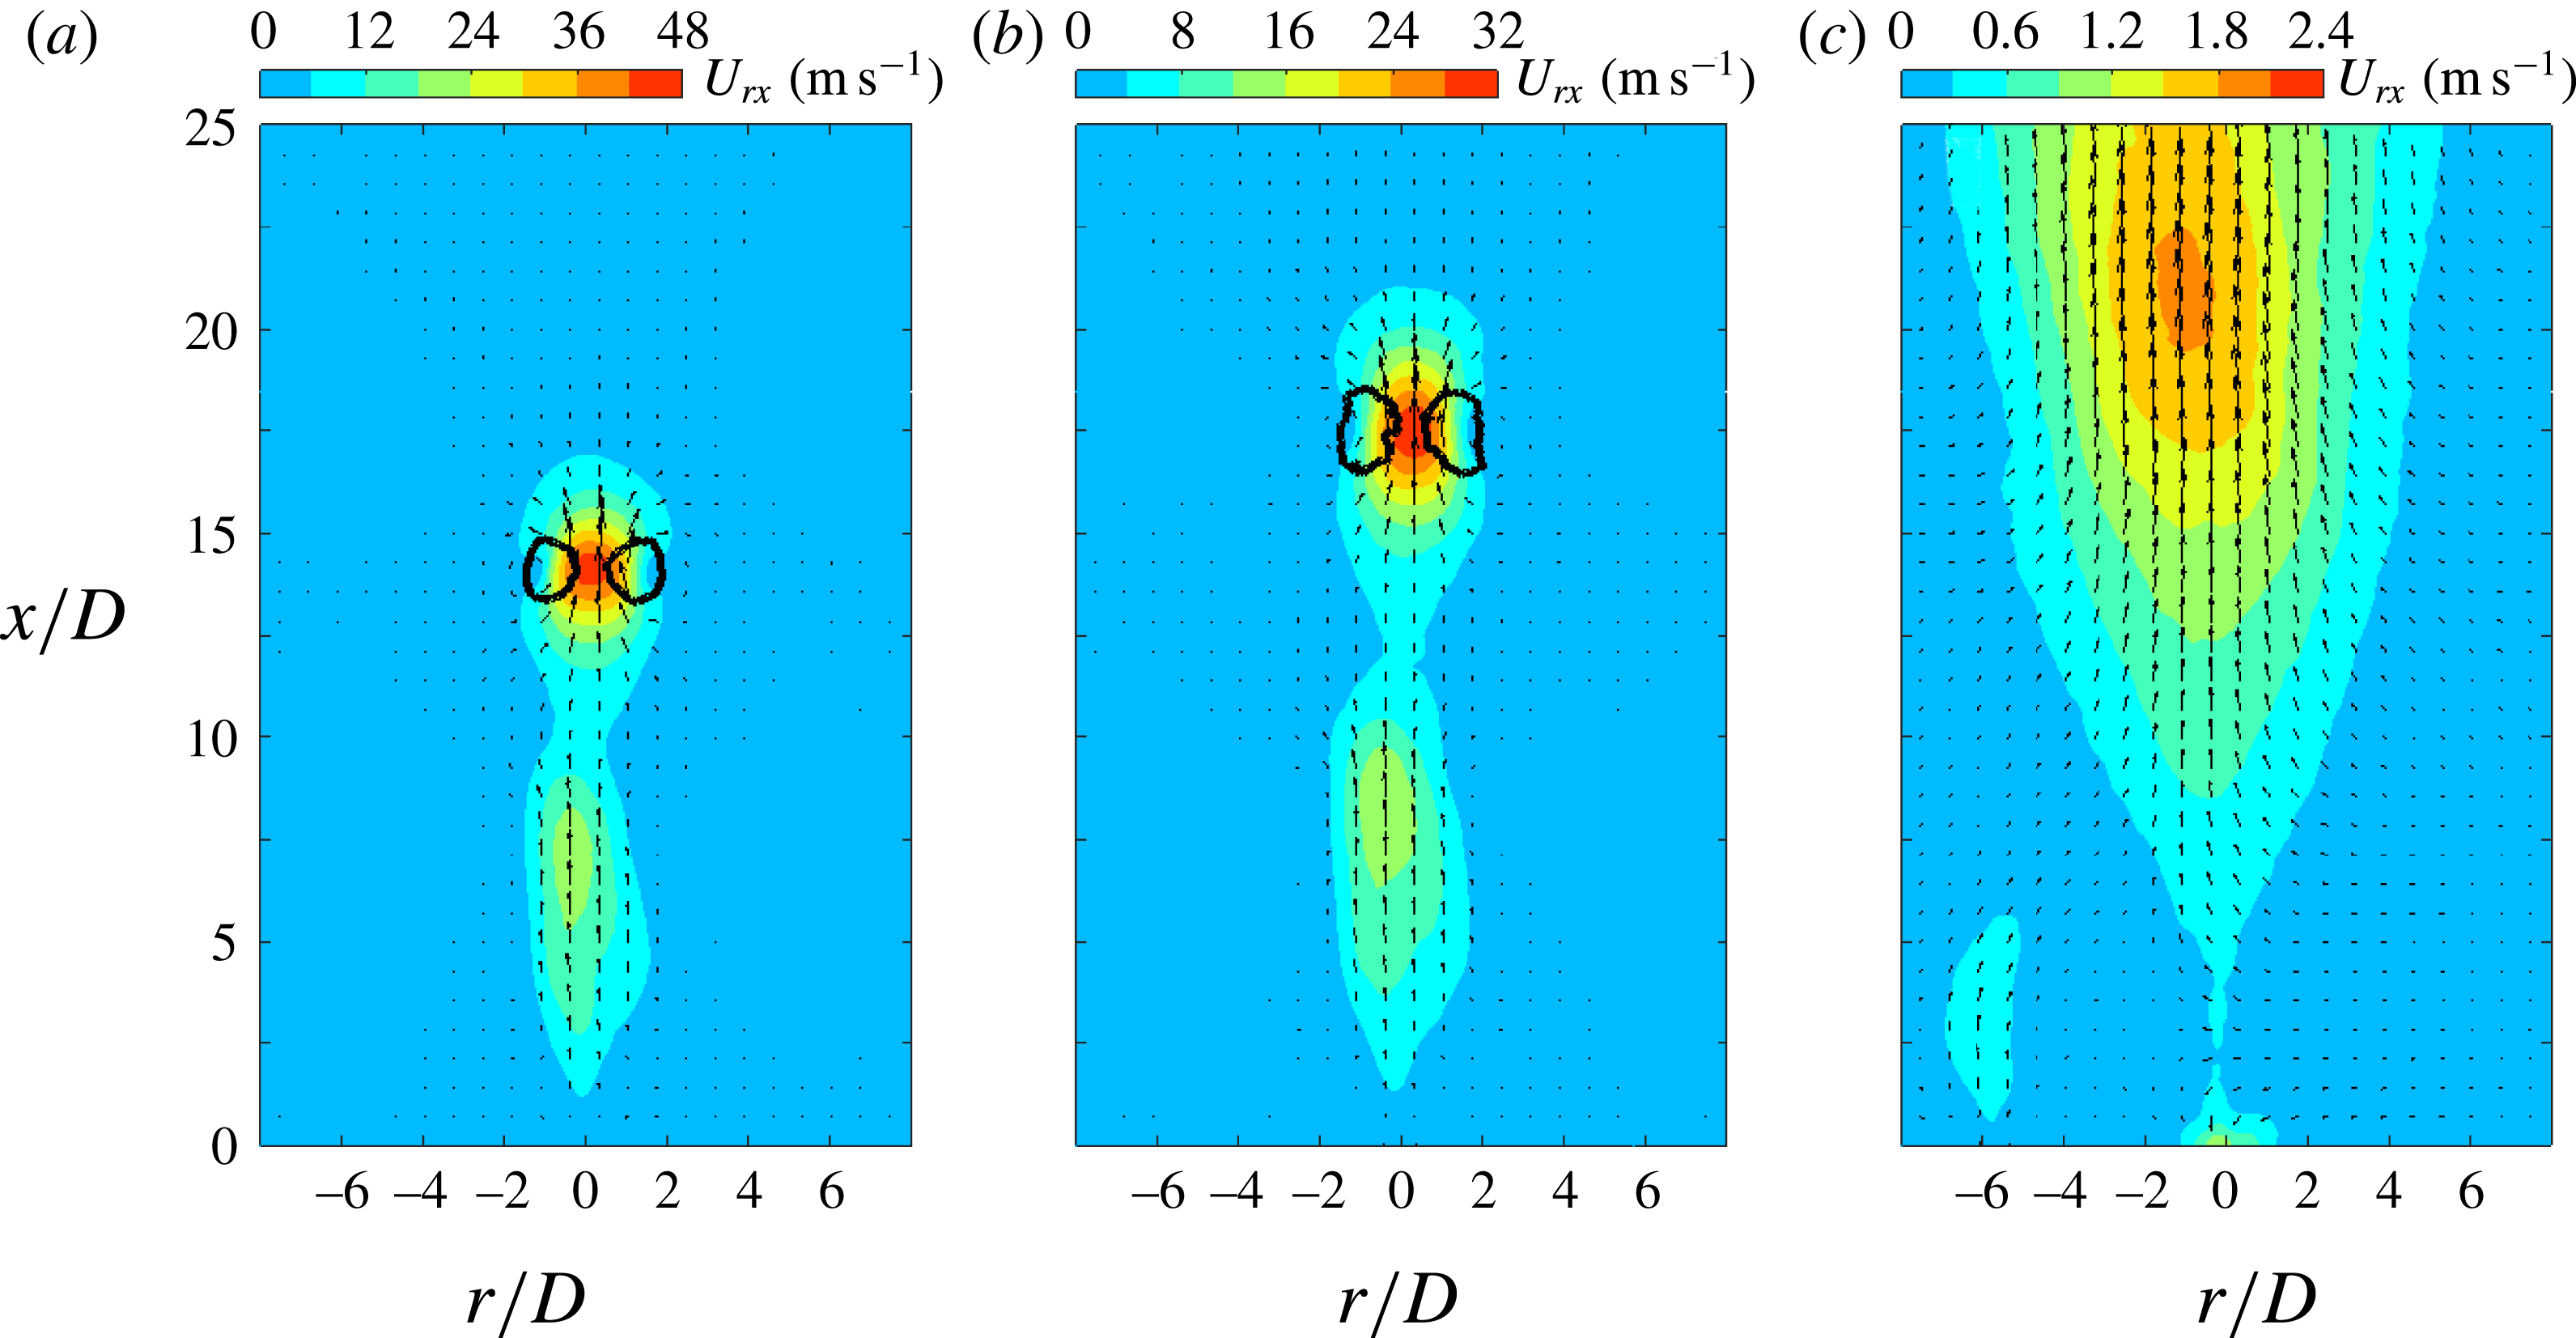
Phase-averaged velocity fields (large FOV) at increasing time delays for case 3 (
 $f_{d}=100~\text{Hz}$
): (a)
 $t=700~\unicode[STIX]{x03BC}\text{s}$
,
 $t/T_{h}=1.15$
; (b)
 $t=900~\unicode[STIX]{x03BC}\text{s}$
,
 $t/T_{h}=1.48$
; (c)
 $t=9000~\unicode[STIX]{x03BC}\text{s}$
,
 $t/T_{h}=14.83$
. The plotting methods are inherited from figure 5.
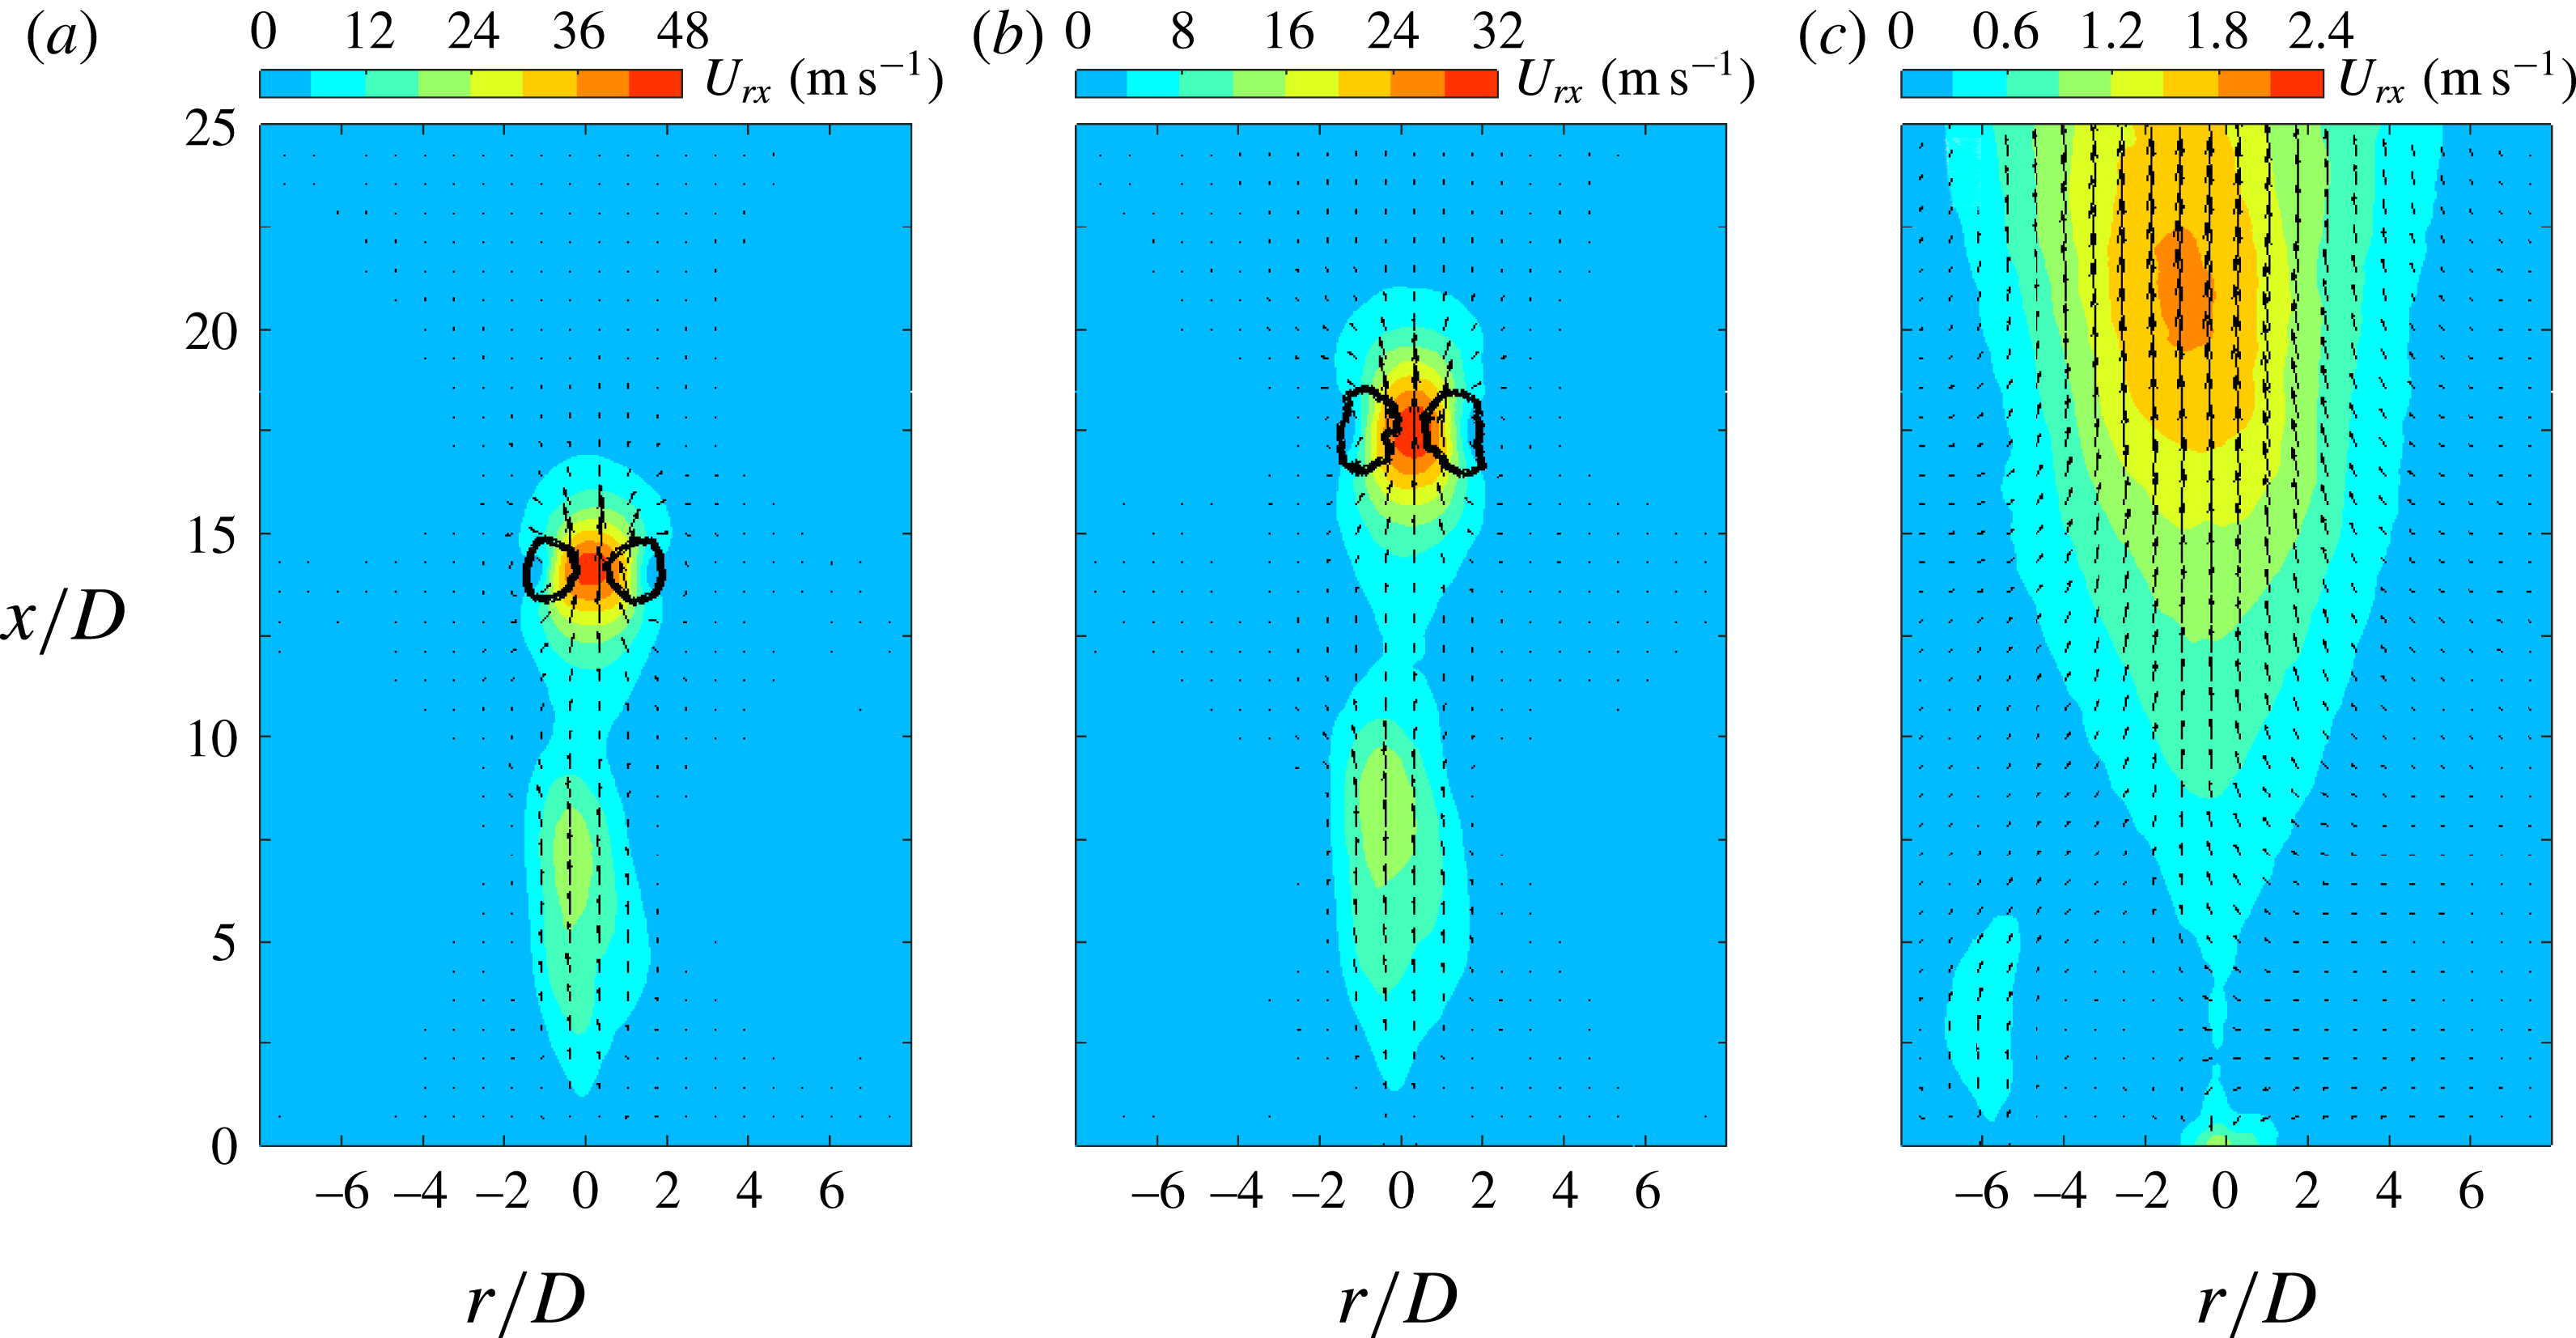
Since the jet front in figure 5(d–f) propagates out of the FOV, the velocity fields at these three phases are further illustrated in figure 6 using the PIV measurements within the larger FOV. The FVR can still be detected by the
 $Q$
-criterion between
 $t=700~\unicode[STIX]{x03BC}\text{s}$
and
 $t=900~\unicode[STIX]{x03BC}\text{s}$
, while other shear-layer vortices cease completely, possibly broken down during the propagation and filtered out by the phase-averaging operation (Laurendeau, Chedevergne & Casalis Reference Laurendeau, Chedevergne and Casalis2014). Additionally, at these late stages of propagation, the FVR is pinched off from the jet body in figure 6(a,b), resulting in two separate high-velocity regions. This reconciles with schlieren observations pertaining to a case of comparable discharge energy in Zong et al. (Reference Zong, Cui, Wu, Zhang, Liang, Jia and Li2015a
). The ‘pinch-off’ is attributed to the rapidly declining jet exit velocity related to the short jet duration, which will be quantified later on in § 4.2. The flow field at
 $t=9000~\unicode[STIX]{x03BC}\text{s}$
is characterized by a diffused low-velocity region.
4.2 High-speed jet
4.2.1 Exit velocity
To quantify the intensity of the pulsed jet, the exit velocity profiles at different time delays (namely
 $U_{y}(r,t\mid x=0)$
) are extracted from the phase-averaged flow fields. Subsequently, a spatially averaged exit velocity is estimated by integrating the exit velocity profile in the radial direction, as follows:
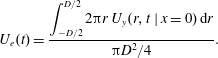 $$\begin{eqnarray}\displaystyle U_{e}(t)=\frac{\displaystyle \int _{-D/2}^{D/2}2\unicode[STIX]{x03C0}r\,U_{y}(r,t\mid x=0)\,\text{d}r}{\unicode[STIX]{x03C0}D^{2}/4}. & & \displaystyle\end{eqnarray}$$
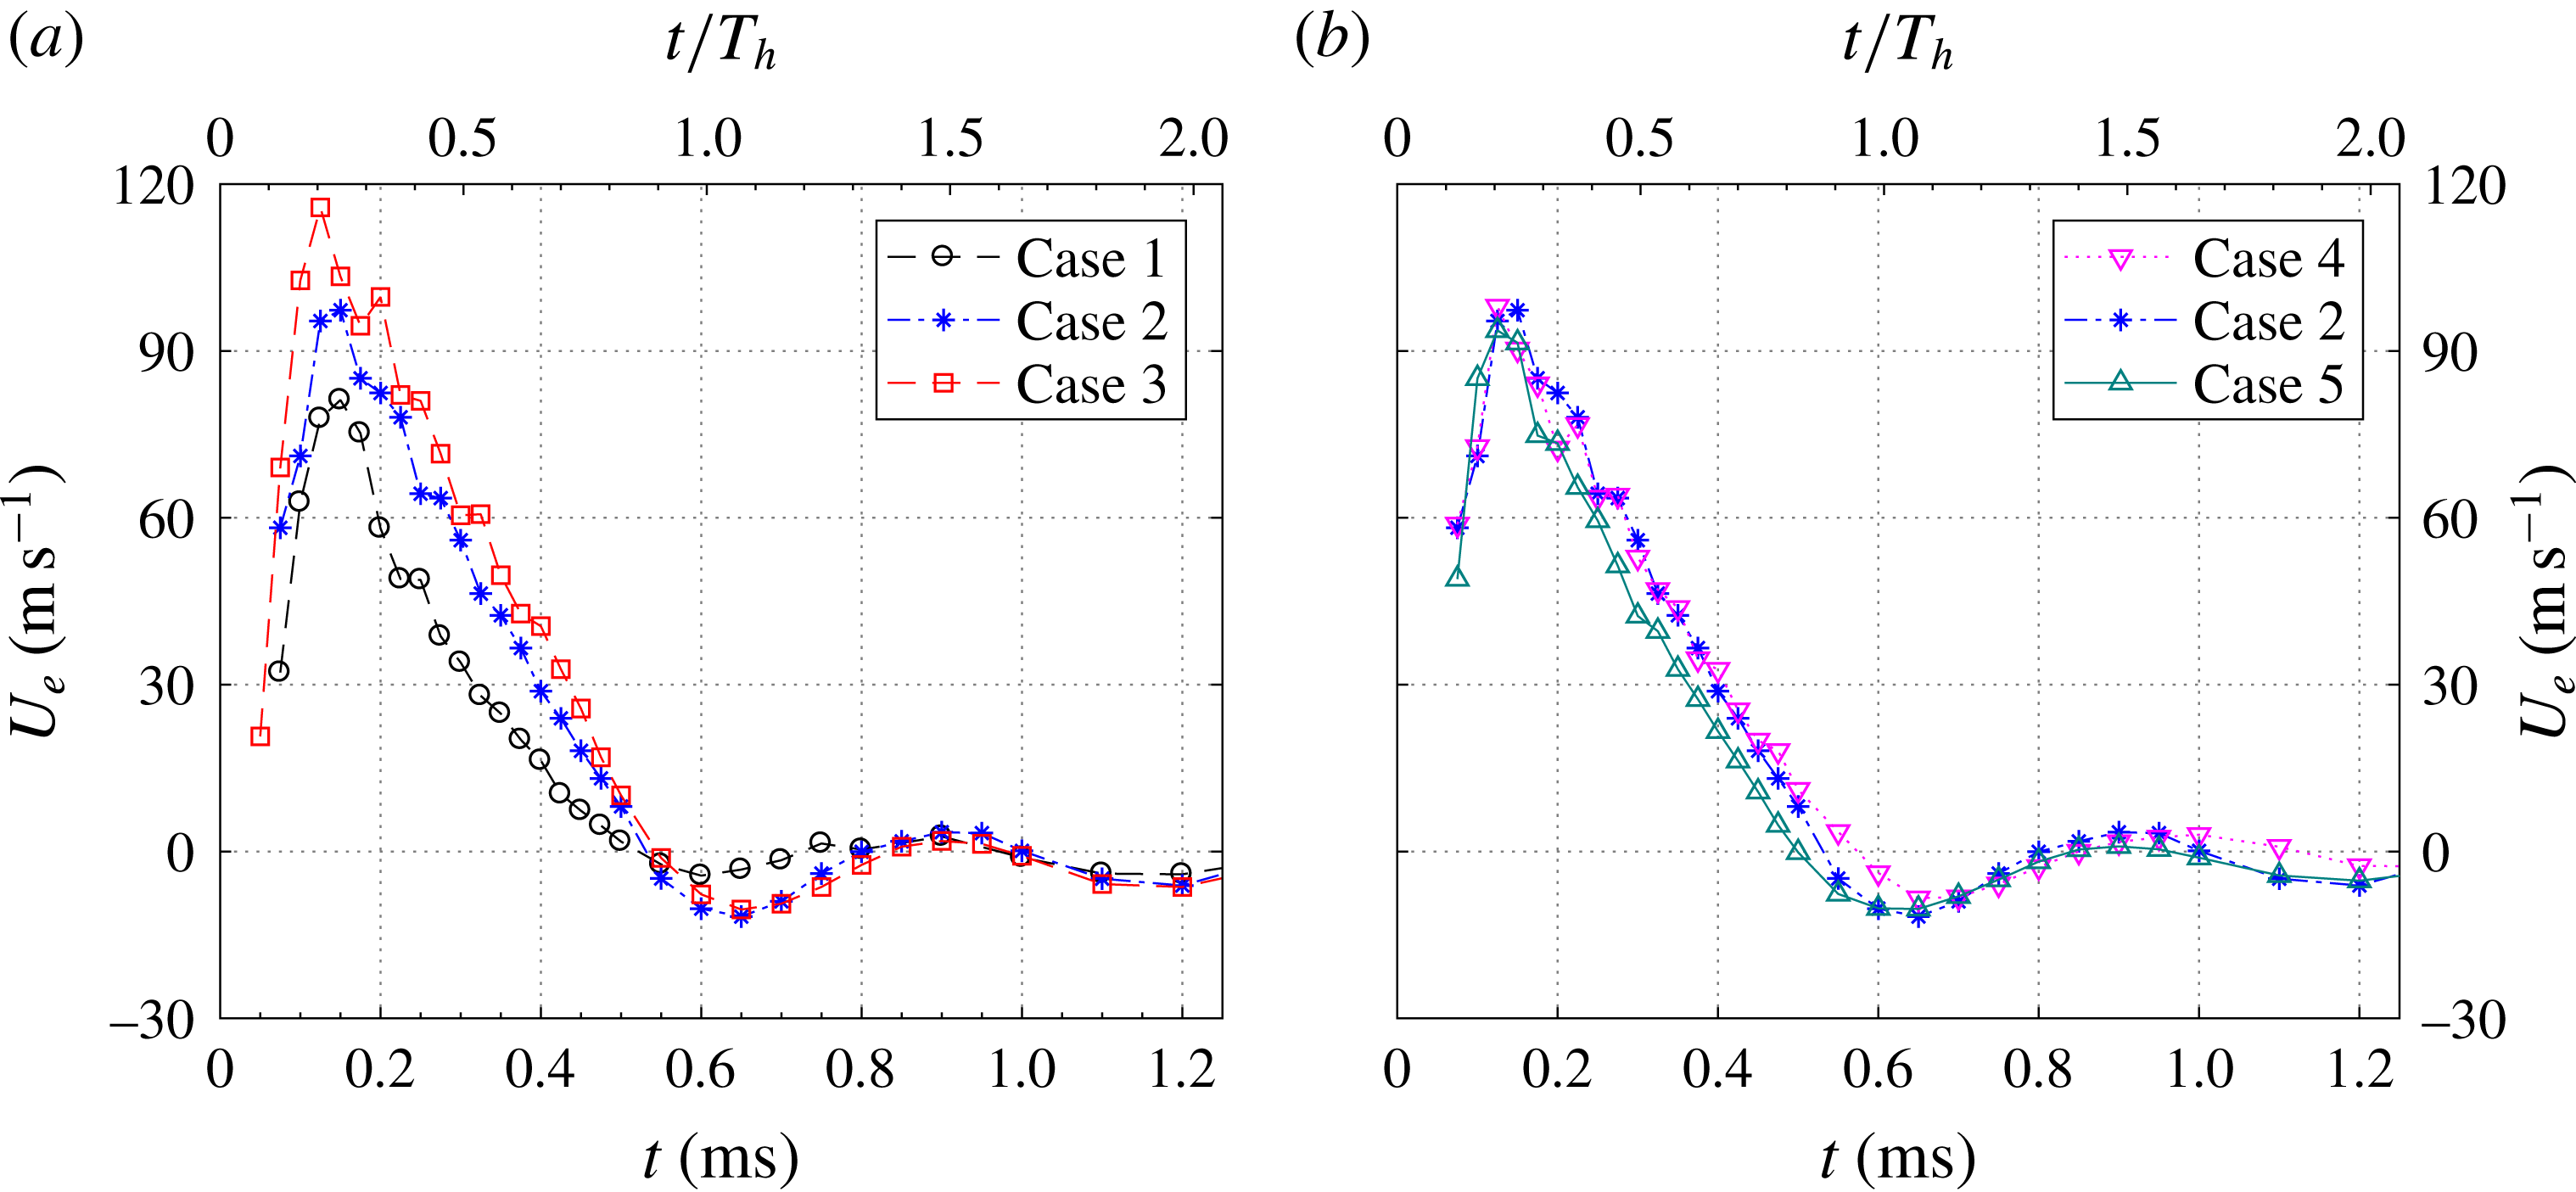
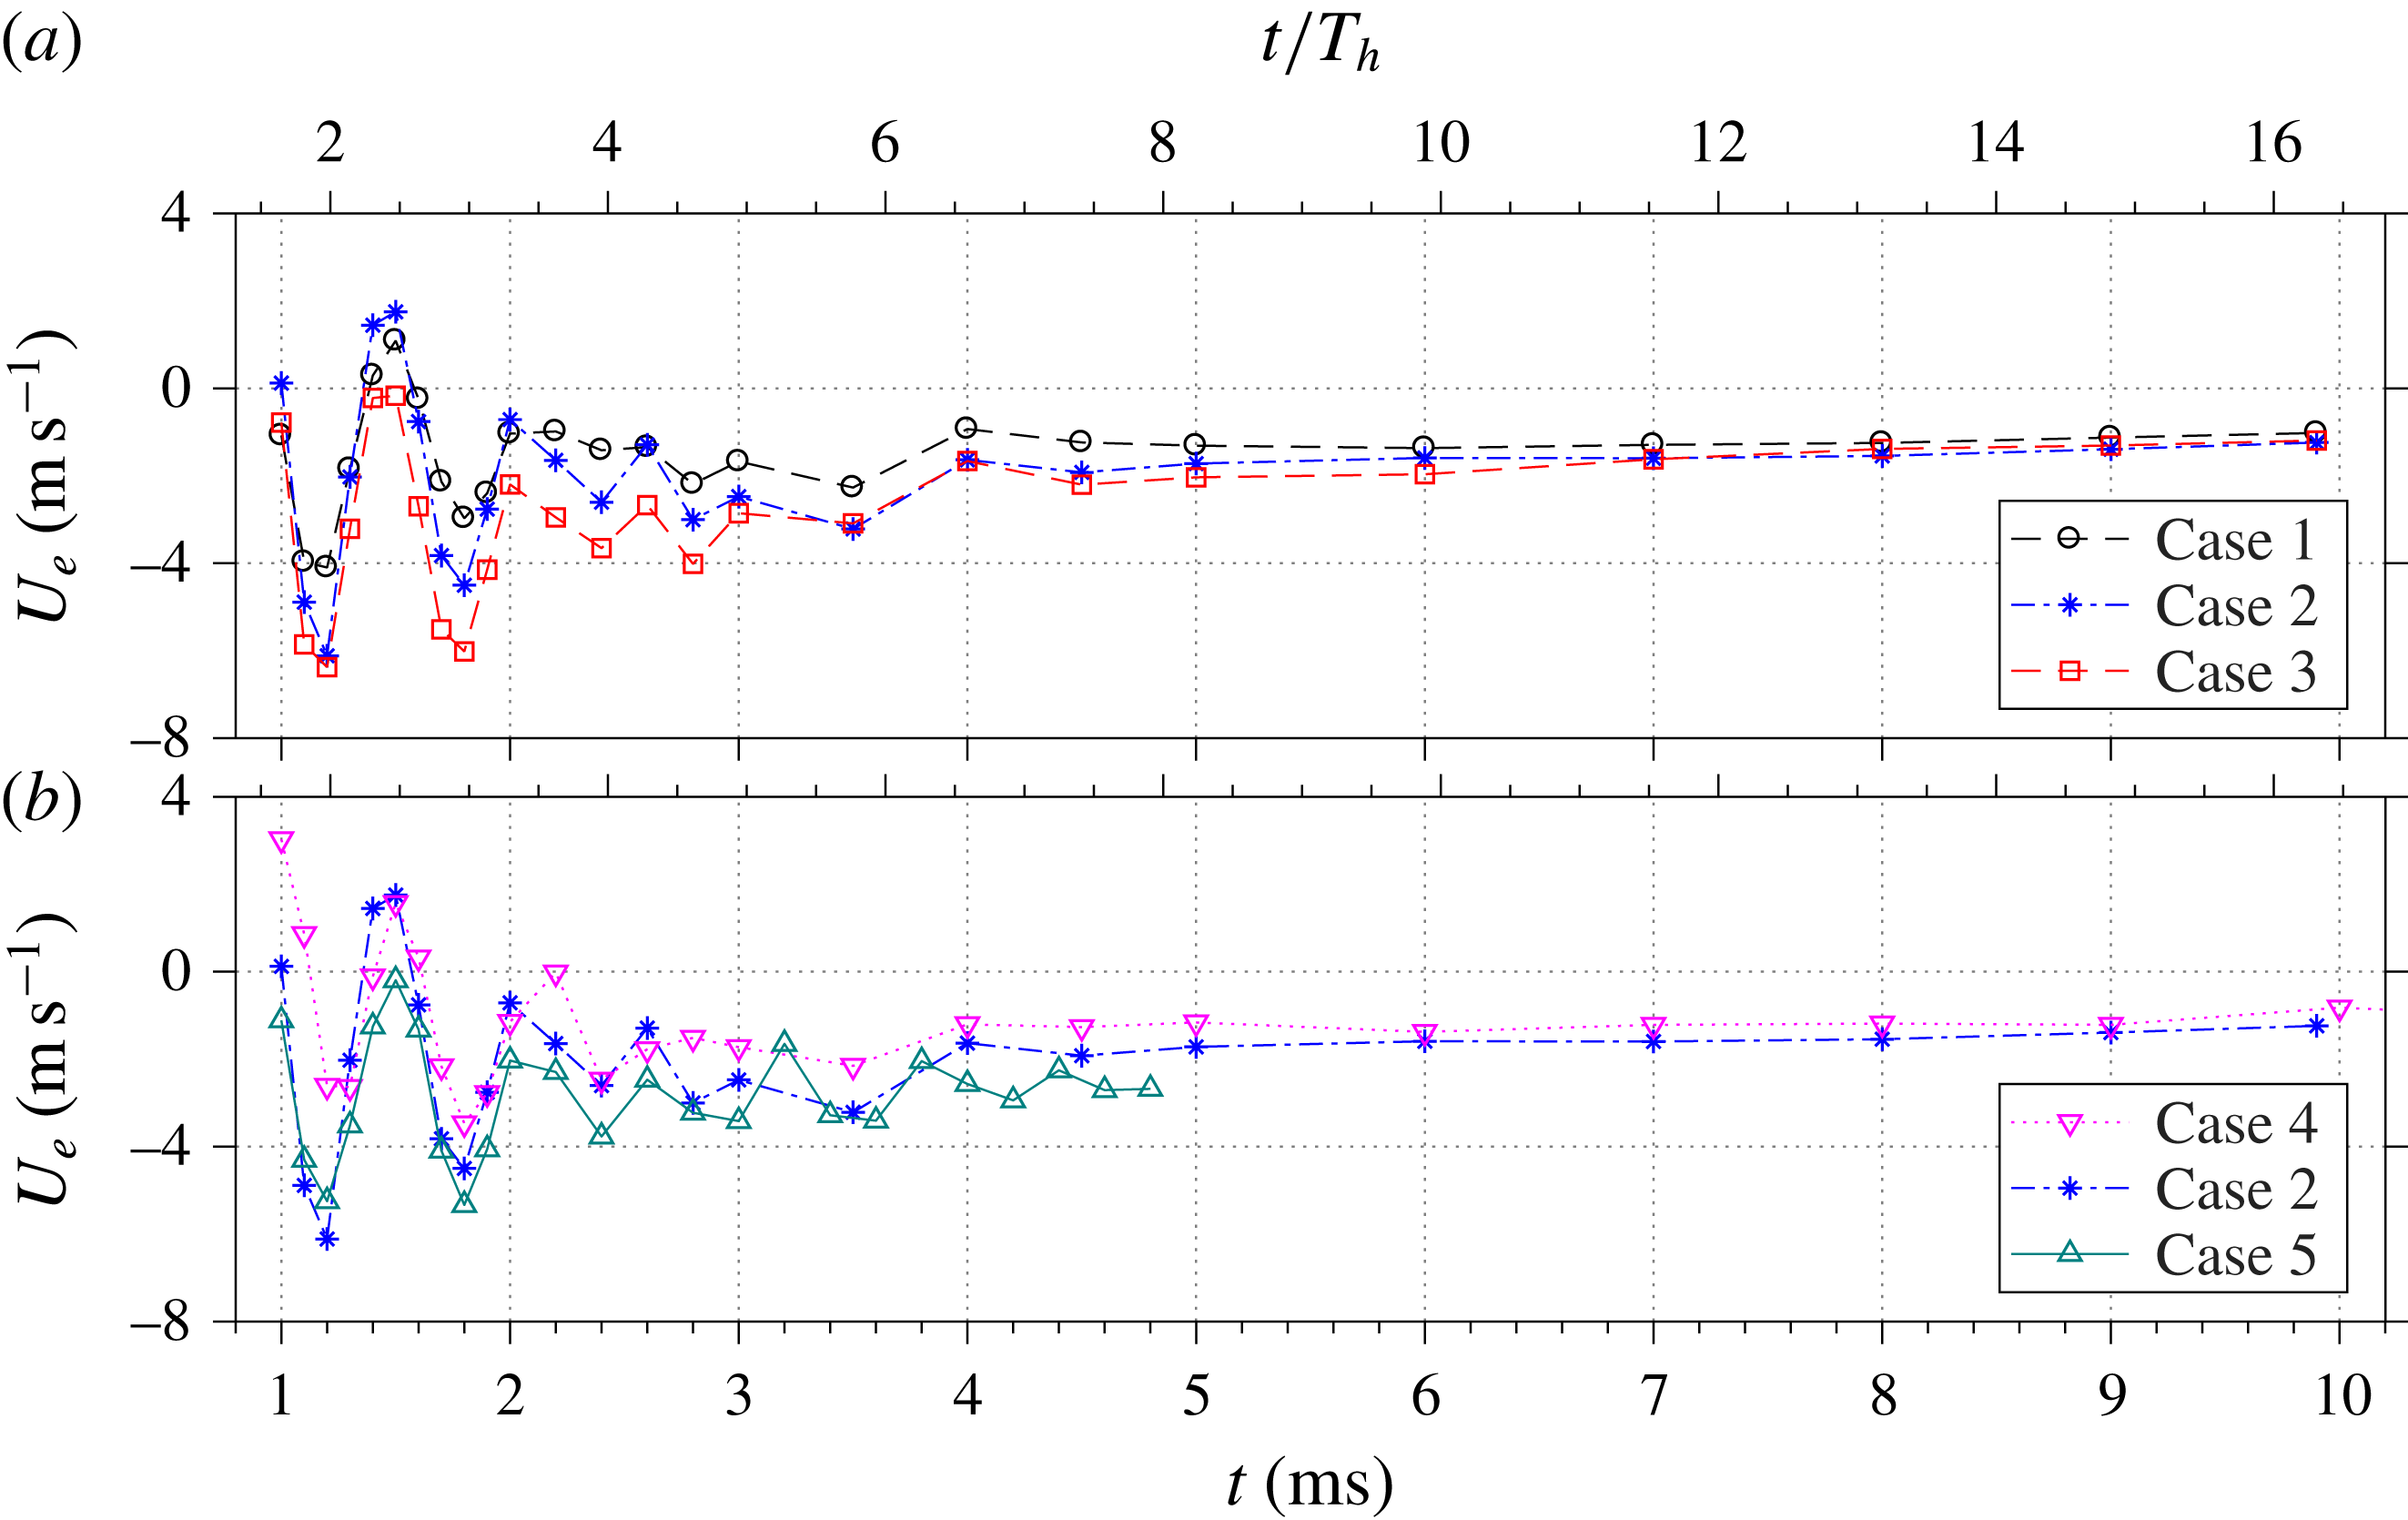
The time evolution of the jet exit velocity for
 $0<t<1.2~\text{ms}$
: (a) influence of energy deposition and (b) influence of discharge frequency.
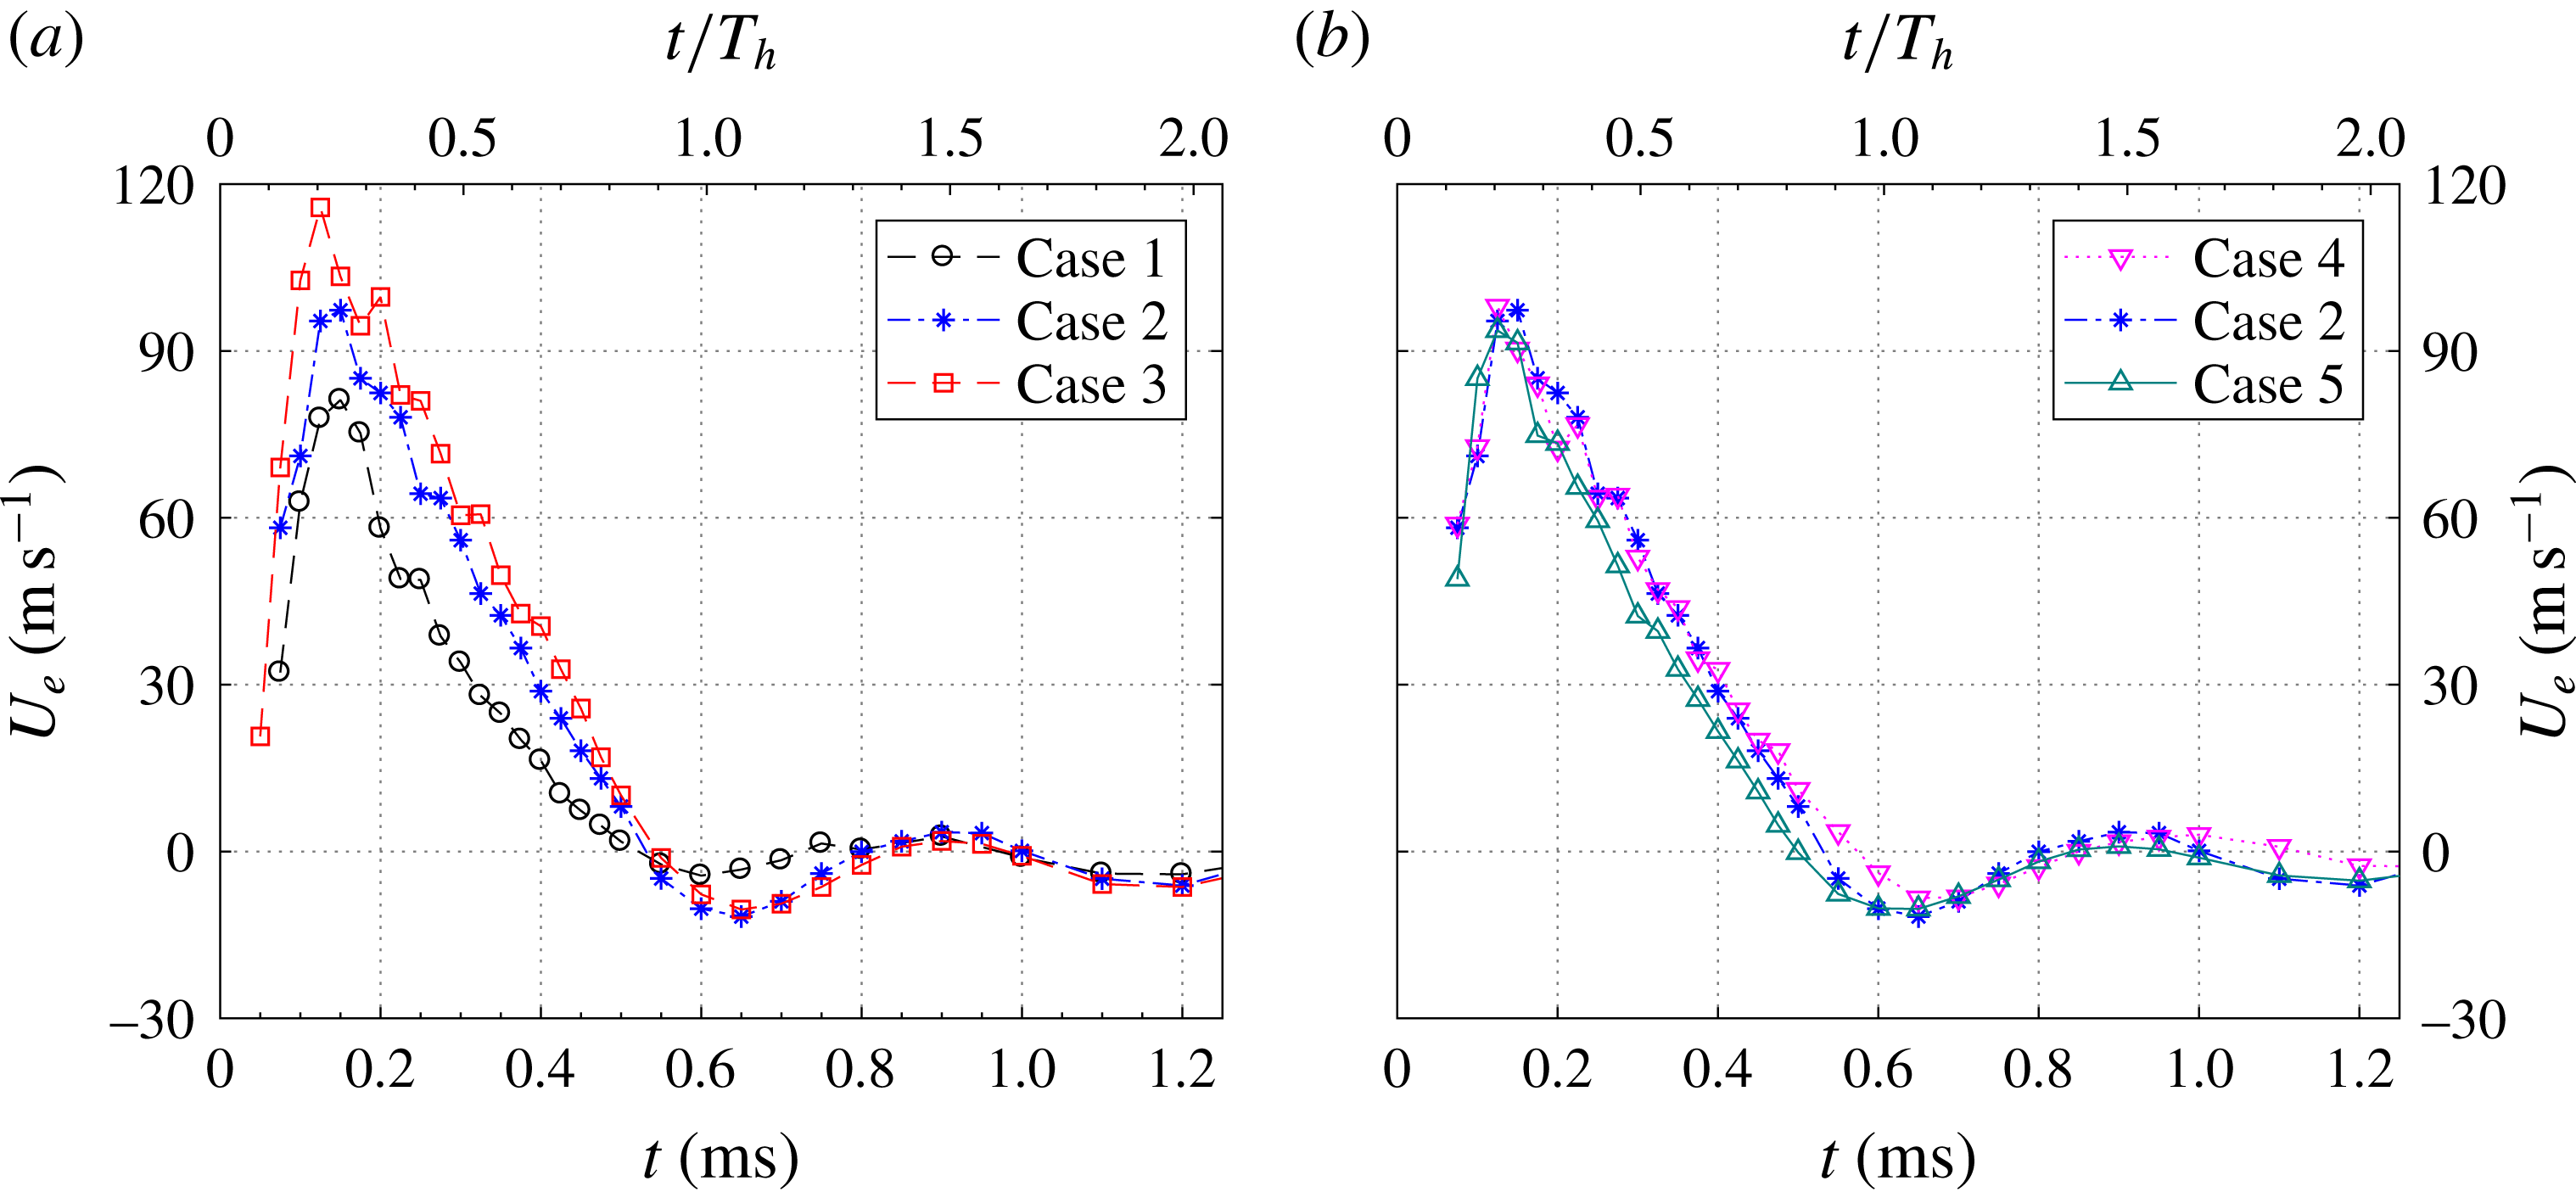
For the different tested cases, the temporal evolution of the spatially integrated exit velocity is shown in figures 7 and 8. Overall, the qualitative trends between different curves are similar. Multiple jet and refresh stages are observed within one cycle. During the primary jet stage, the exit velocity initially shows a sharp increase and afterwards a slow linear drop. The peak value of the exit velocity (
 $U_{p}$
) is reached between
 $t=120~\unicode[STIX]{x03BC}\text{s}$
and
 $t=150~\unicode[STIX]{x03BC}\text{s}$
for all cases. For constant repetition frequency (cases 1–3),
 $U_{p}$
increases from
 $81~\text{m}~\text{s}^{-1}$
to
 $116~\text{m}~\text{s}^{-1}$
when the non-dimensional energy deposition ranges from 1.30 to 5.22 (figure 7
a). Additionally, the jet duration time remains approximately constant at
 $530~\unicode[STIX]{x03BC}\text{s}$
. When the energy deposition is kept fixed at 2.61 and the dimensionless frequency is increased from 0.03 to 0.12 (cases 4, 2 and 5), the peak jet velocity remains approximately constant whereas the jet duration time drops slightly (
 $96~\text{m}~\text{s}^{-1}\rightarrow 85~\text{m}~\text{s}^{-1}$
,
 $570~\unicode[STIX]{x03BC}\text{s}$
to
 $500~\unicode[STIX]{x03BC}\text{s}$
). Based on these peak velocity values, the Reynolds number (
 $Re_{0}$
) defined in (2.6) can be computed as listed in table 2. As a result,
 $Re_{0}$
ranges from
 $1.09\times 10^{4}$
to
 $1.55\times 10^{4}$
, indicating fully turbulent flow status for all of the tested cases. The peak jet velocity values obtained here are relatively lower than those reported in Narayanaswamy et al. (Reference Narayanaswamy, Raja and Clemens2010) and Reedy et al. (Reference Reedy, Kale, Dutton and Elliott2013), where
 $U_{p}$
reaches more than
 $300~\text{m}~\text{s}^{-1}$
. The distinction is mainly attributed to the different cavity volume (
 $1696~\text{mm}^{3}$
for the current study, in contrast to
 $23~\text{mm}^{3}$
in Narayanaswamy et al. (Reference Narayanaswamy, Raja and Clemens2010) and
 $183~\text{mm}^{3}$
in Reedy et al.
Reference Reedy, Kale, Dutton and Elliott2013).
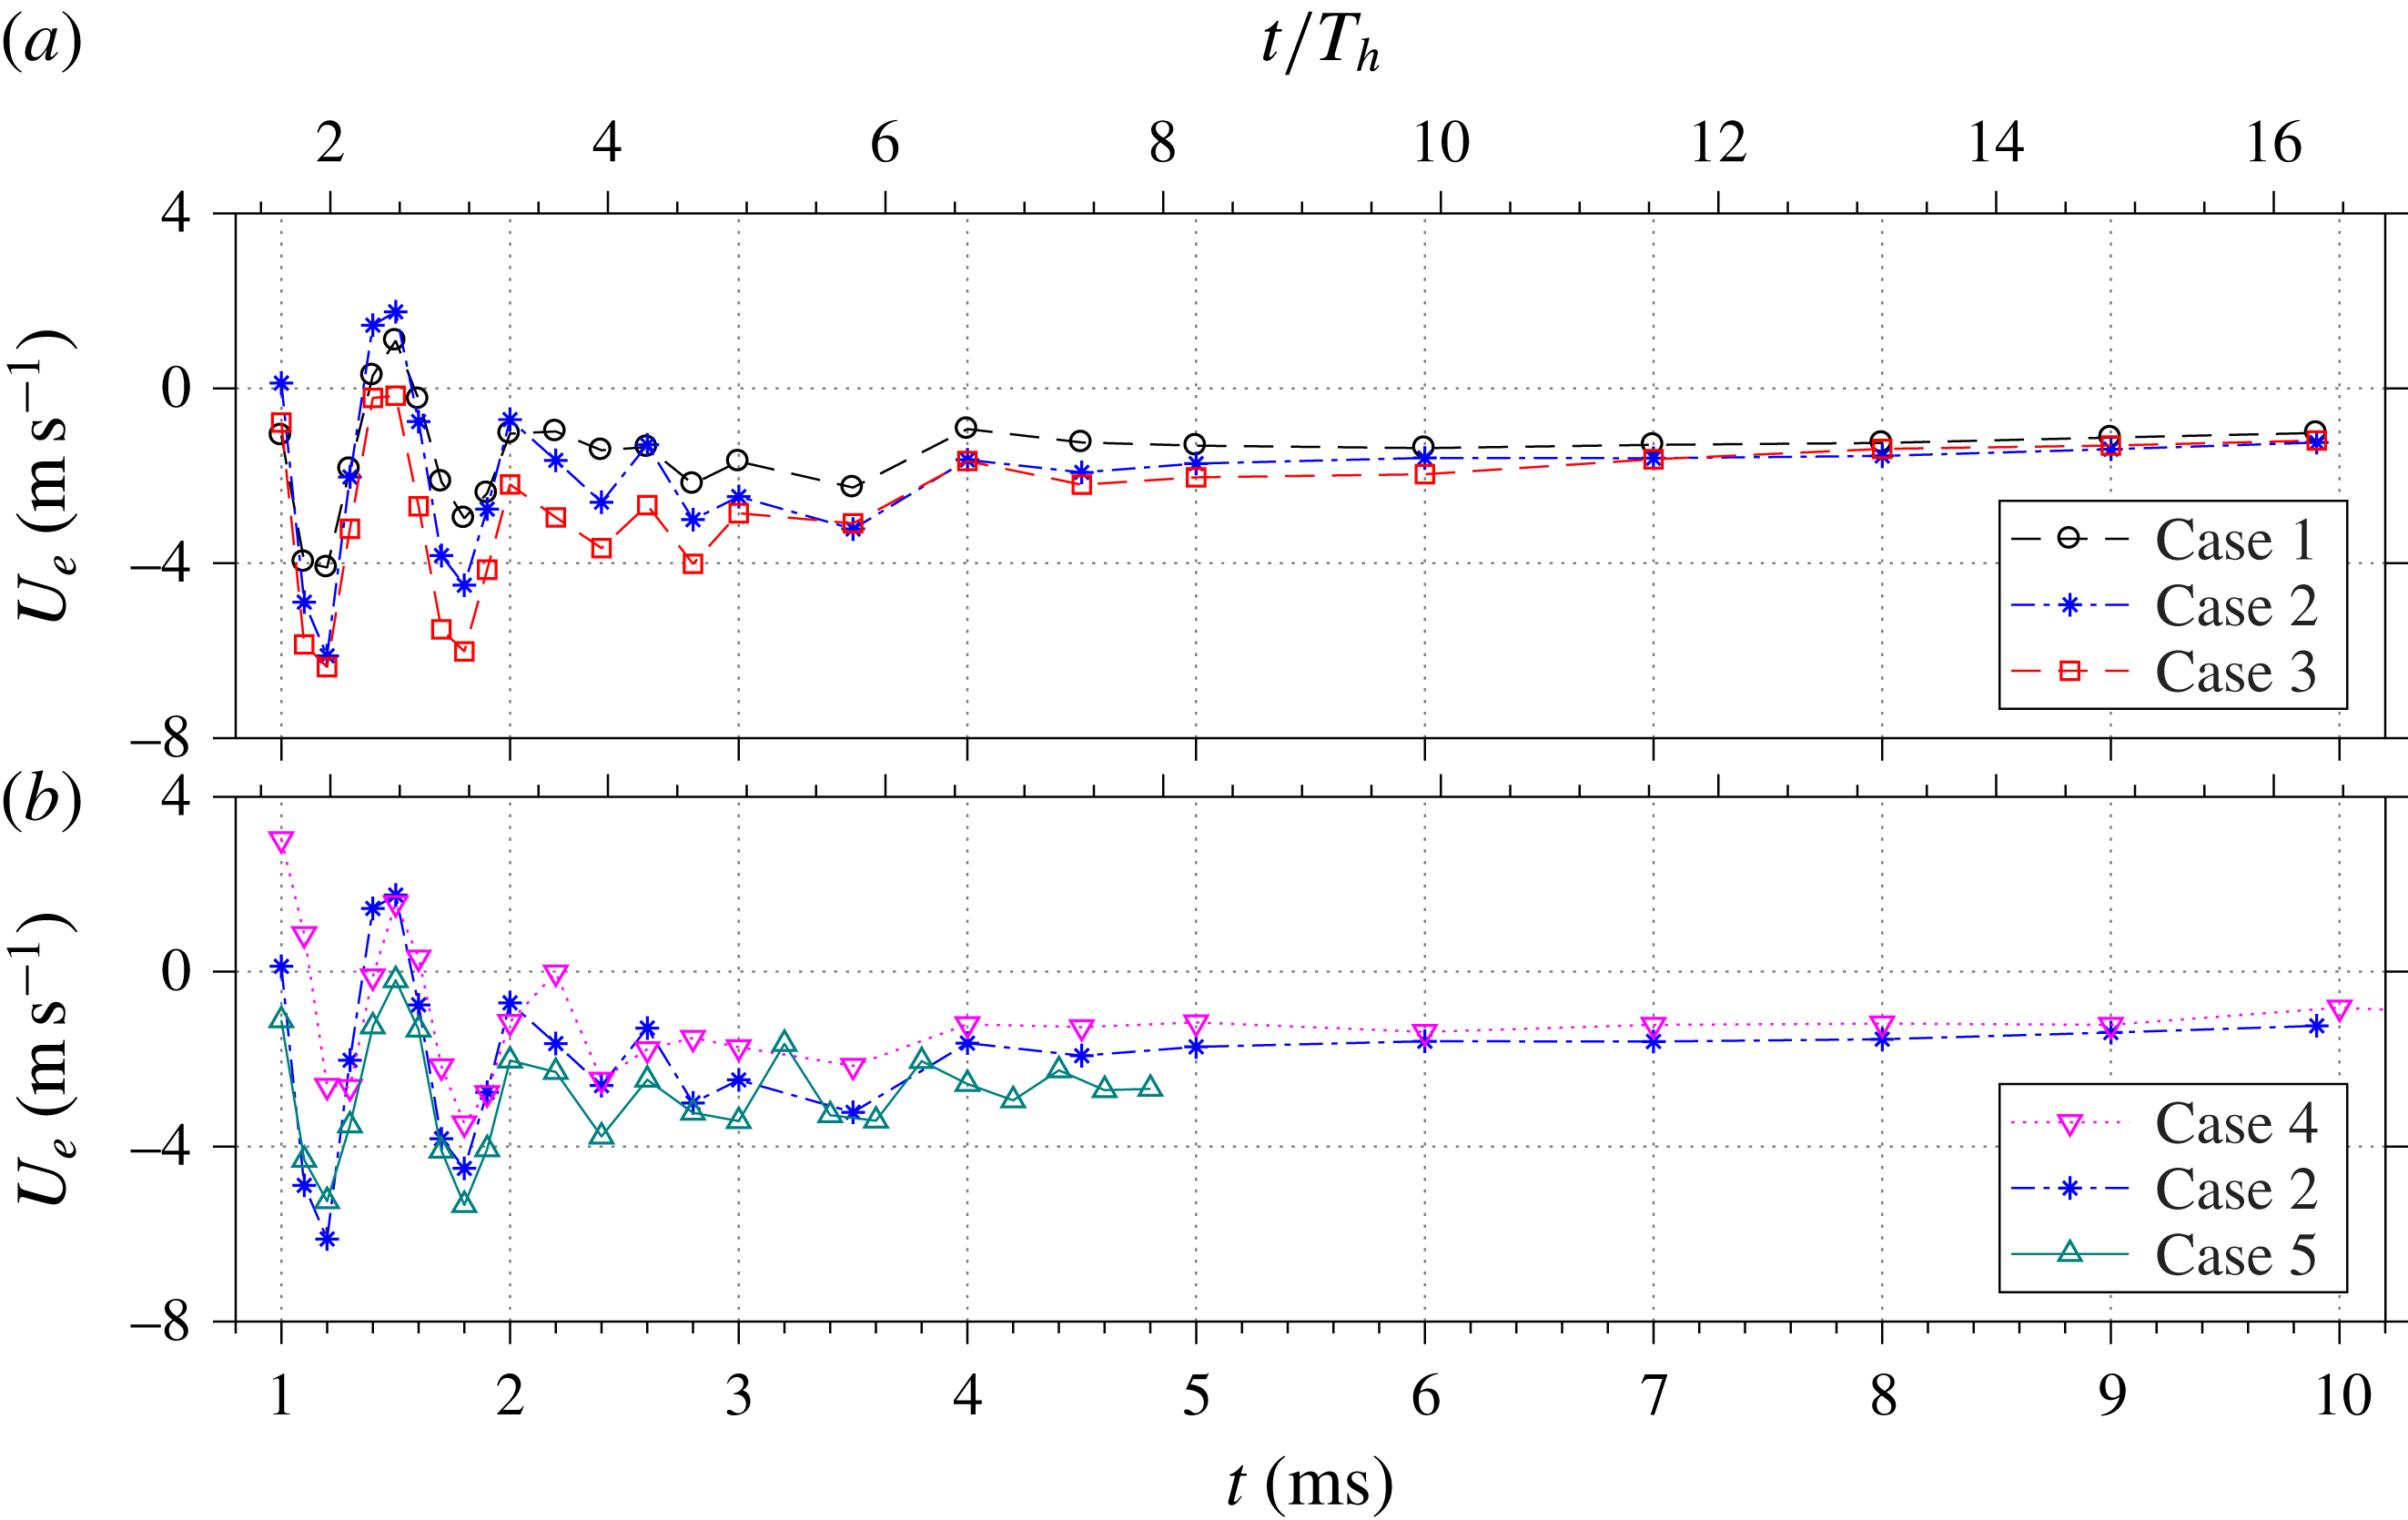
The time evolution of the jet exit velocity for
 $1<t<10~\text{ms}$
: (a) influence of energy deposition and (b) influence of repetition rate.
The PSJ formation parameters.

The negative exit velocity observed after the primary jet stage signifies the onset of suction flow, pertinent to the refresh stage. With the exception of the low-energy case 1, the peak suction velocity for all of the tested cases is approximately
 $10~\text{m}~\text{s}^{-1}$
. Multiple alternations between the jet and refresh stages are testified by the quasi-periodical oscillation of the exit velocity. The oscillation period is estimated to be approximately
 $600~\unicode[STIX]{x03BC}\text{s}$
and is largely insensitive to changes of
 $f^{\ast }$
and
 $\unicode[STIX]{x1D700}$
. The corresponding oscillation frequency (1.67 kHz) agrees well with the predicted Helmholtz natural frequency determined in § 2.1 (
 $f_{h}=1.65~\text{kHz}$
), indicating that the alternation between the jet and refresh stages is essentially an elastic process caused by the stiffness of the cavity gas. It should be noted that for a piezoelectric SJA, the ejection velocity always peaks at
 $f_{h}$
in the velocity–frequency spectrum (de Luca et al.
Reference de Luca, Girfoglio and Coppola2014). However, operation to such high frequencies was beyond the scope of this investigation.
During the later evolution of the exit velocity (
 $t>1~\text{ms}$
), several distinctions should be made between the measured trace (figure 8) and the theoretical traces predicted by Zong et al. (Reference Zong, Wu, Li, Song, Zhang and Jia2015b
) (figure 11 in their paper). Small-amplitude periodic oscillations of the exit velocity after the primary jet stage are evident in these two traces. However, the oscillation in the measured trace is largely asymmetric, pivoting around a continuously negative velocity. For all of the tested cases, the exit velocity after the third jet stage (
 $t>1.6~\text{ms}$
) never recovers back to positive values before the next pulse, indicating a longstanding refresh stage. The aforementioned phenomena are not predicted by the analytical model in Zong et al. (Reference Zong, Wu, Li, Song, Zhang and Jia2015b
) and can be traced to a cooling effect acting on the cavity. Specifically, the cavity temperature increases considerably during high-frequency and high-energy operation (1000 K in Sary et al.
Reference Sary, Dufour, Rogier and Kourtzanidis2014; 500 K in Belinger et al.
Reference Belinger, Hardy, Barricau, Cambronne and Caruana2011). During the refresh stage, the high-temperature gas remaining in the actuator cavity will dissipate heat rapidly to the surrounding environment through heat convection and radiation. As a result of this constant-pressure heat dissipation, the residual gas experiences a reducing temperature and reducing specific volume, thus driving fresh air into the actuator cavity. This quasi-steady suction imposes a negative offset on the exit velocity trace, leading to an asymmetric oscillation as well as the longstanding refresh stage. On comparing the curves shown in figure 8, it is evident that the averaged suction velocity increases with both the energy deposition and the working frequency.
4.2.2 Exit density
Zong & Kotsonis (Reference Zong and Kotsonis2016b
) established an analytical model in order to estimate the time-varying density of the exit fluid
 $(\unicode[STIX]{x1D70C}_{e}(t))$
based on the time evolution of the jet exit velocity. Using the exit density and exit velocity, three crucial integral parameters including the expelled gas mass, jet impulse and jet mechanical energy can be derived to quantify the intensity of the pulsed jet. Nevertheless, the initial cavity density (
 $\unicode[STIX]{x1D70C}_{ca0}$
) has to be provided to initialize the model computation. Two methods are proposed here to estimate the initial cavity density, based on the principle of mass conservation in the actuator cavity, namely
 $$\begin{eqnarray}\displaystyle \int _{0}^{T_{d}}\unicode[STIX]{x1D70C}_{e}(t)\,U_{e}^{+}(t)A_{e}\,\text{d}t=\int _{0}^{T_{d}}\unicode[STIX]{x1D70C}_{0}\,U_{e}^{-}(t)A_{e}\,\text{d}t, & & \displaystyle\end{eqnarray}$$
where
 $U_{e}^{+}$
and
 $U_{e}^{-}$
are the positive (ejection velocity) and negative (suction velocity) portions of
 $U_{e}$
respectively, and
 $\unicode[STIX]{x1D70C}_{0}$
and
 $\unicode[STIX]{x1D70C}_{e}(t)$
represent the ambient (external) density and jet exit density respectively.
The first method relies on the assumptions of relatively low jet velocity (
 $Ma<0.3$
) and small expelled gas mass, which allow an approximation of the jet exit density with the initial cavity density,
 $$\begin{eqnarray}\displaystyle \left.\begin{array}{@{}l@{}}\displaystyle \unicode[STIX]{x1D70C}_{e}(t)\approx \unicode[STIX]{x1D70C}_{ca0},\\ \displaystyle \frac{\unicode[STIX]{x1D70C}_{ca0}}{\unicode[STIX]{x1D70C}_{0}}\approx \frac{\displaystyle \int _{0}^{T_{0}}U_{e}^{-}(t)\,\text{d}t}{\displaystyle \int _{0}^{T_{0}}U_{e}^{+}(t)\,\text{d}t}=\frac{L_{s}}{L_{e}}.\end{array}\right\} & & \displaystyle\end{eqnarray}$$
The integrals of ejection velocity and suction velocity within one actuation cycle are denoted as
 $L_{e}$
and
 $L_{s}$
for simplification. It should be noted that
 $L_{s}/D$
is essentially the non-dimensional stroke length, defined in § 2.3. For the different tested cases,
 $L_{s}$
and
 $L_{e}$
, as well as the estimated initial cavity density during the steady working stage of repetitive operation (
 $\unicode[STIX]{x1D70C}_{ca0}$
), are listed in table 2. As a result,
 $L_{s}/D$
and
 $L_{e}/D$
range from 6 to 15, increasing with energy deposition and decreasing with frequency.
The second method simulates the repetitive working process of the PSJA using a predictor–corrector approach based on the system of (4.4)–(4.6), which is more accurate, but complex, than the first method. During the jet stage, the upper and lower bounds of the exit density are approximated by (4.4) proposed by Zong & Kotsonis (Reference Zong and Kotsonis2016b
). This equation set is derived based on the governing equations during the jet stage, and subsonic throat flow is assumed. The term
 $f_{UL}$
is introduced to simplify the expression and bears no physical meaning. During the refresh stage, the exit density is set as the ambient density (4.5). Following the estimation of the exit density, the cavity density
 $(\unicode[STIX]{x1D70C}_{ca}(t))$
is updated by (4.6) based on mass conservation. Using these equations iteratively, the temporal evolution of the two bounds of
 $\unicode[STIX]{x1D70C}_{e}(t)$
and
 $\unicode[STIX]{x1D70C}_{ca}(t)$
in one cycle can be computed.
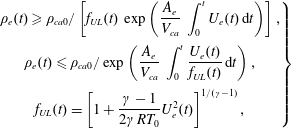 $$\begin{eqnarray}\displaystyle & \displaystyle \left.\begin{array}{@{}c@{}}\displaystyle \unicode[STIX]{x1D70C}_{e}(t)\geqslant \unicode[STIX]{x1D70C}_{ca0}/\left[f_{UL}(t)\,\exp \left(\frac{A_{e}}{V_{ca}}\,\int _{0}^{t}U_{e}(t)\,\text{d}t\right)\right],\\ \displaystyle \unicode[STIX]{x1D70C}_{e}(t)\leqslant \unicode[STIX]{x1D70C}_{ca0}/\exp \left(\frac{A_{e}}{V_{ca}}\,\int _{0}^{t}\frac{U_{e}(t)}{f_{UL}(t)}\,\text{d}t\right),\\ \displaystyle f_{UL}(t)=\left[1+\frac{\unicode[STIX]{x1D6FE}-1}{2\unicode[STIX]{x1D6FE}RT_{0}}U_{e}^{2}(t)\right]^{1/(\unicode[STIX]{x1D6FE}-1)},\end{array}\right\} & \displaystyle\end{eqnarray}$$
 $$\begin{eqnarray}\displaystyle & \displaystyle \unicode[STIX]{x1D70C}_{e}(t)=\unicode[STIX]{x1D70C}_{0}, & \displaystyle\end{eqnarray}$$
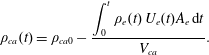 $$\begin{eqnarray}\displaystyle & \displaystyle \unicode[STIX]{x1D70C}_{ca}(t)=\unicode[STIX]{x1D70C}_{ca0}-\frac{\displaystyle \int _{0}^{t}\unicode[STIX]{x1D70C}_{e}(t)\,U_{e}(t)A_{e}\,\text{d}t}{V_{ca}}. & \displaystyle\end{eqnarray}$$
To launch the simulation, the initial cavity density of the first cycle (
 $\unicode[STIX]{x1D70C}_{ca0}$
) is set as the ambient density (
 $\unicode[STIX]{x1D70C}_{0}$
). Since
 $L_{s}>L_{e}$
, the quantity of ejected fluid is more than the quantity of fluid subsequently ingested. As a result, the gas in the cavity has not fully recovered to ambient conditions and the ultimate cavity density of the first cycle
 $(\unicode[STIX]{x1D70C}_{ca}(T_{d}))$
is slightly lower than the ambient density. For the next cycle,
 $\unicode[STIX]{x1D70C}_{ca0}$
is initialized as
 $\unicode[STIX]{x1D70C}_{ca}(T_{d})$
and (4.4)–(4.6) are iteratively solved again. The iterative simulation stops after a dynamic balance of cavity density is reached, namely
 $\unicode[STIX]{x1D70C}_{ca}(T_{d})=\unicode[STIX]{x1D70C}_{ca0}$
.
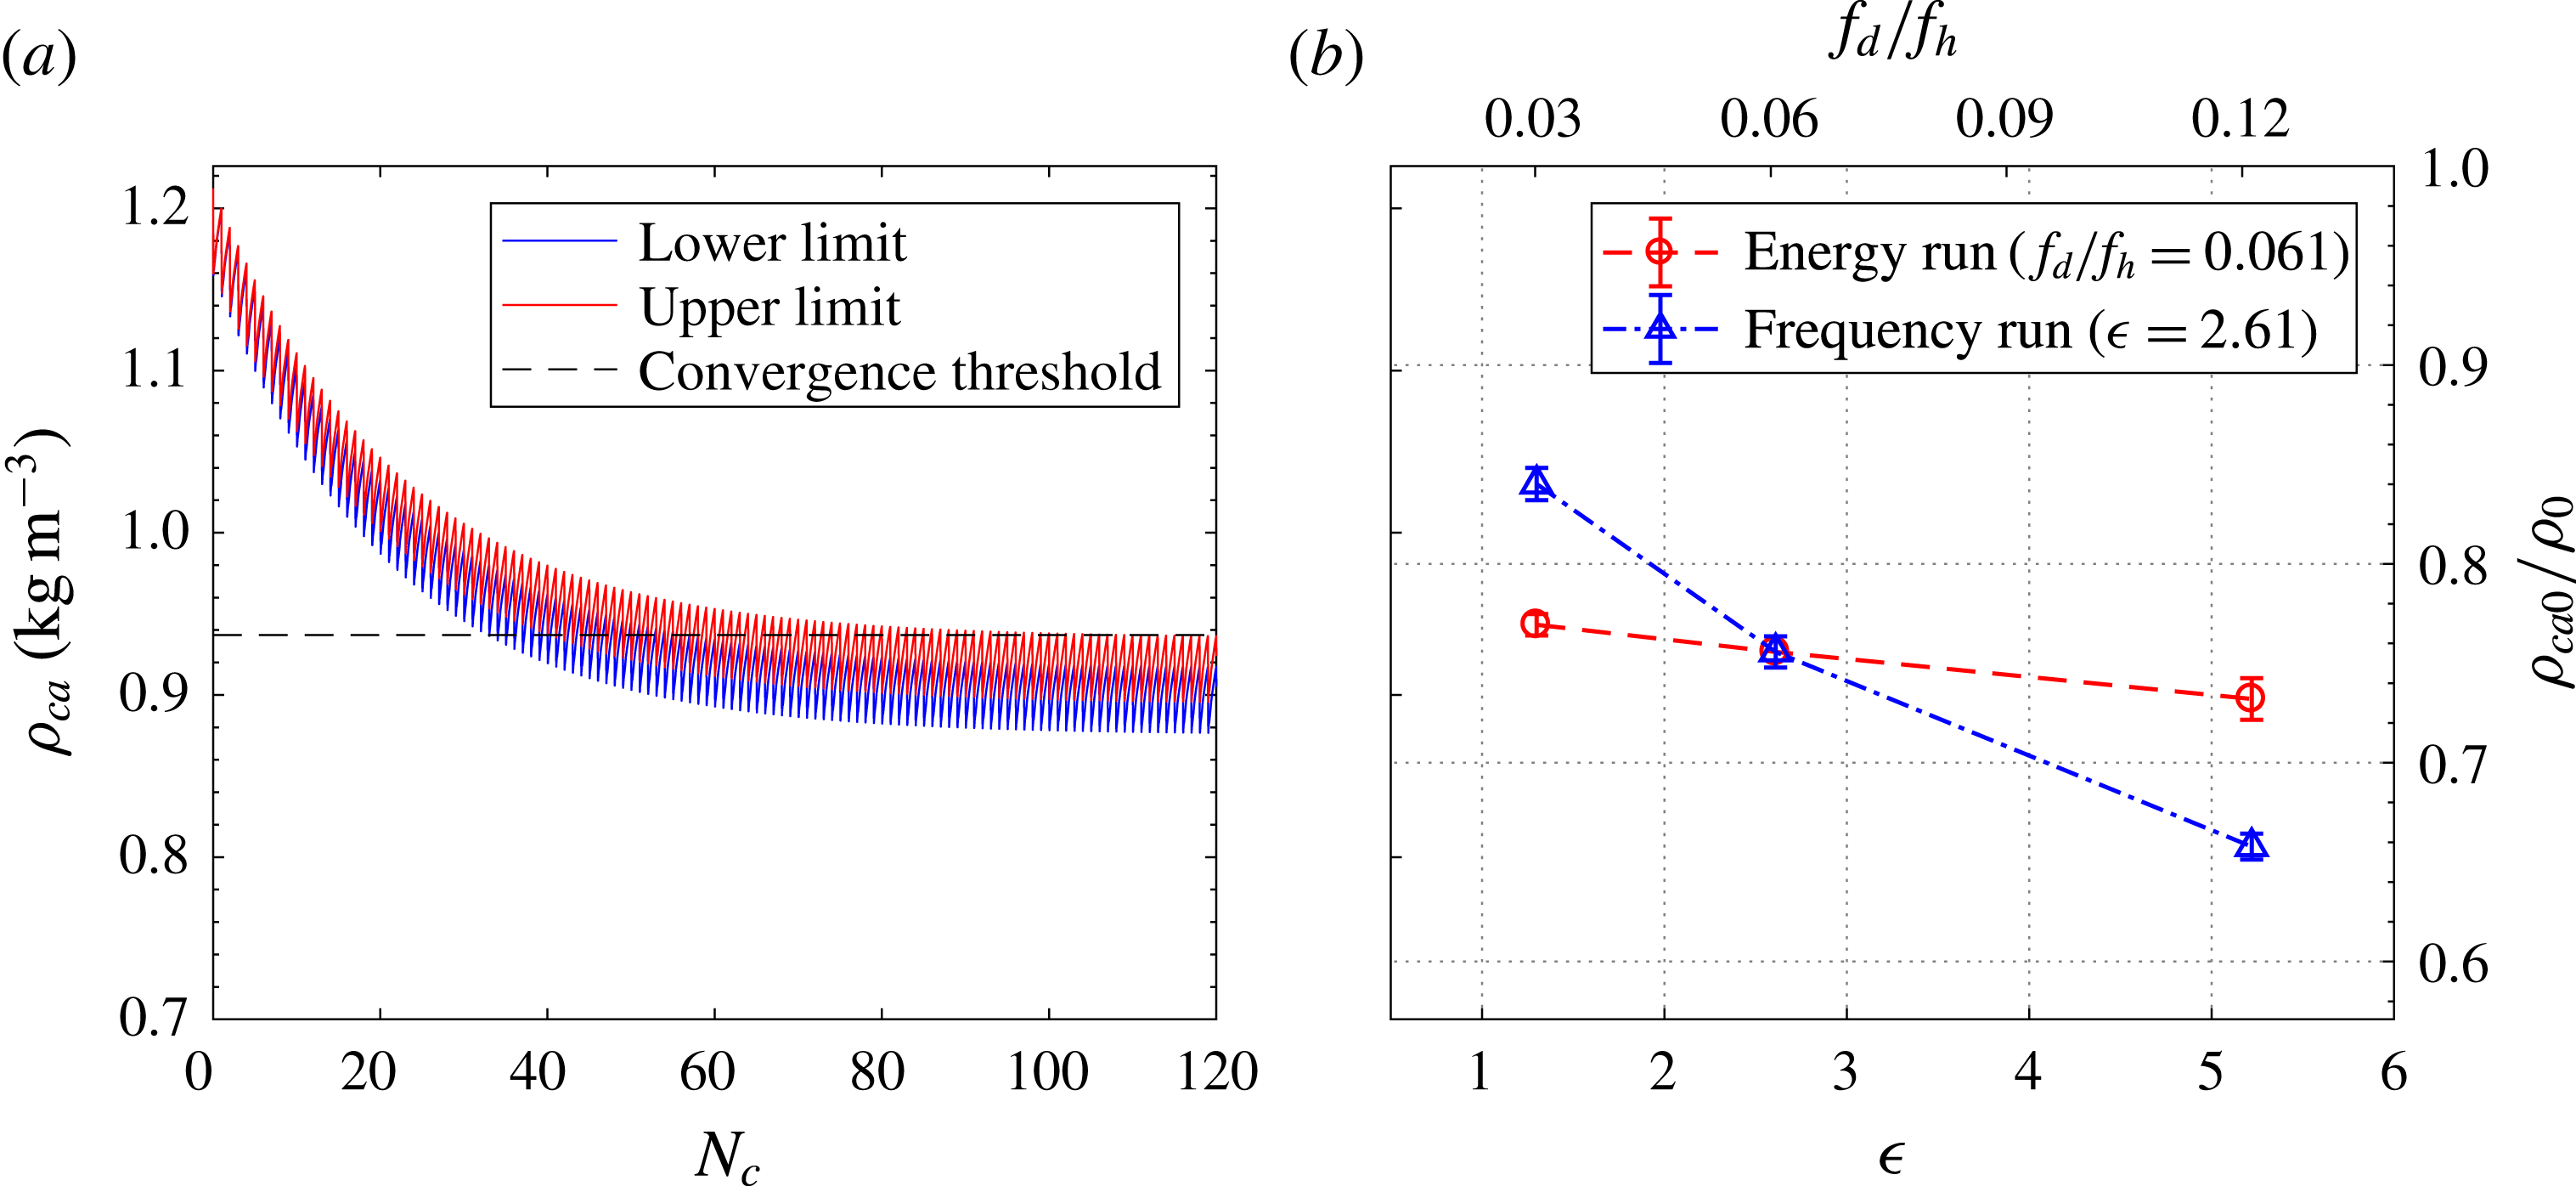
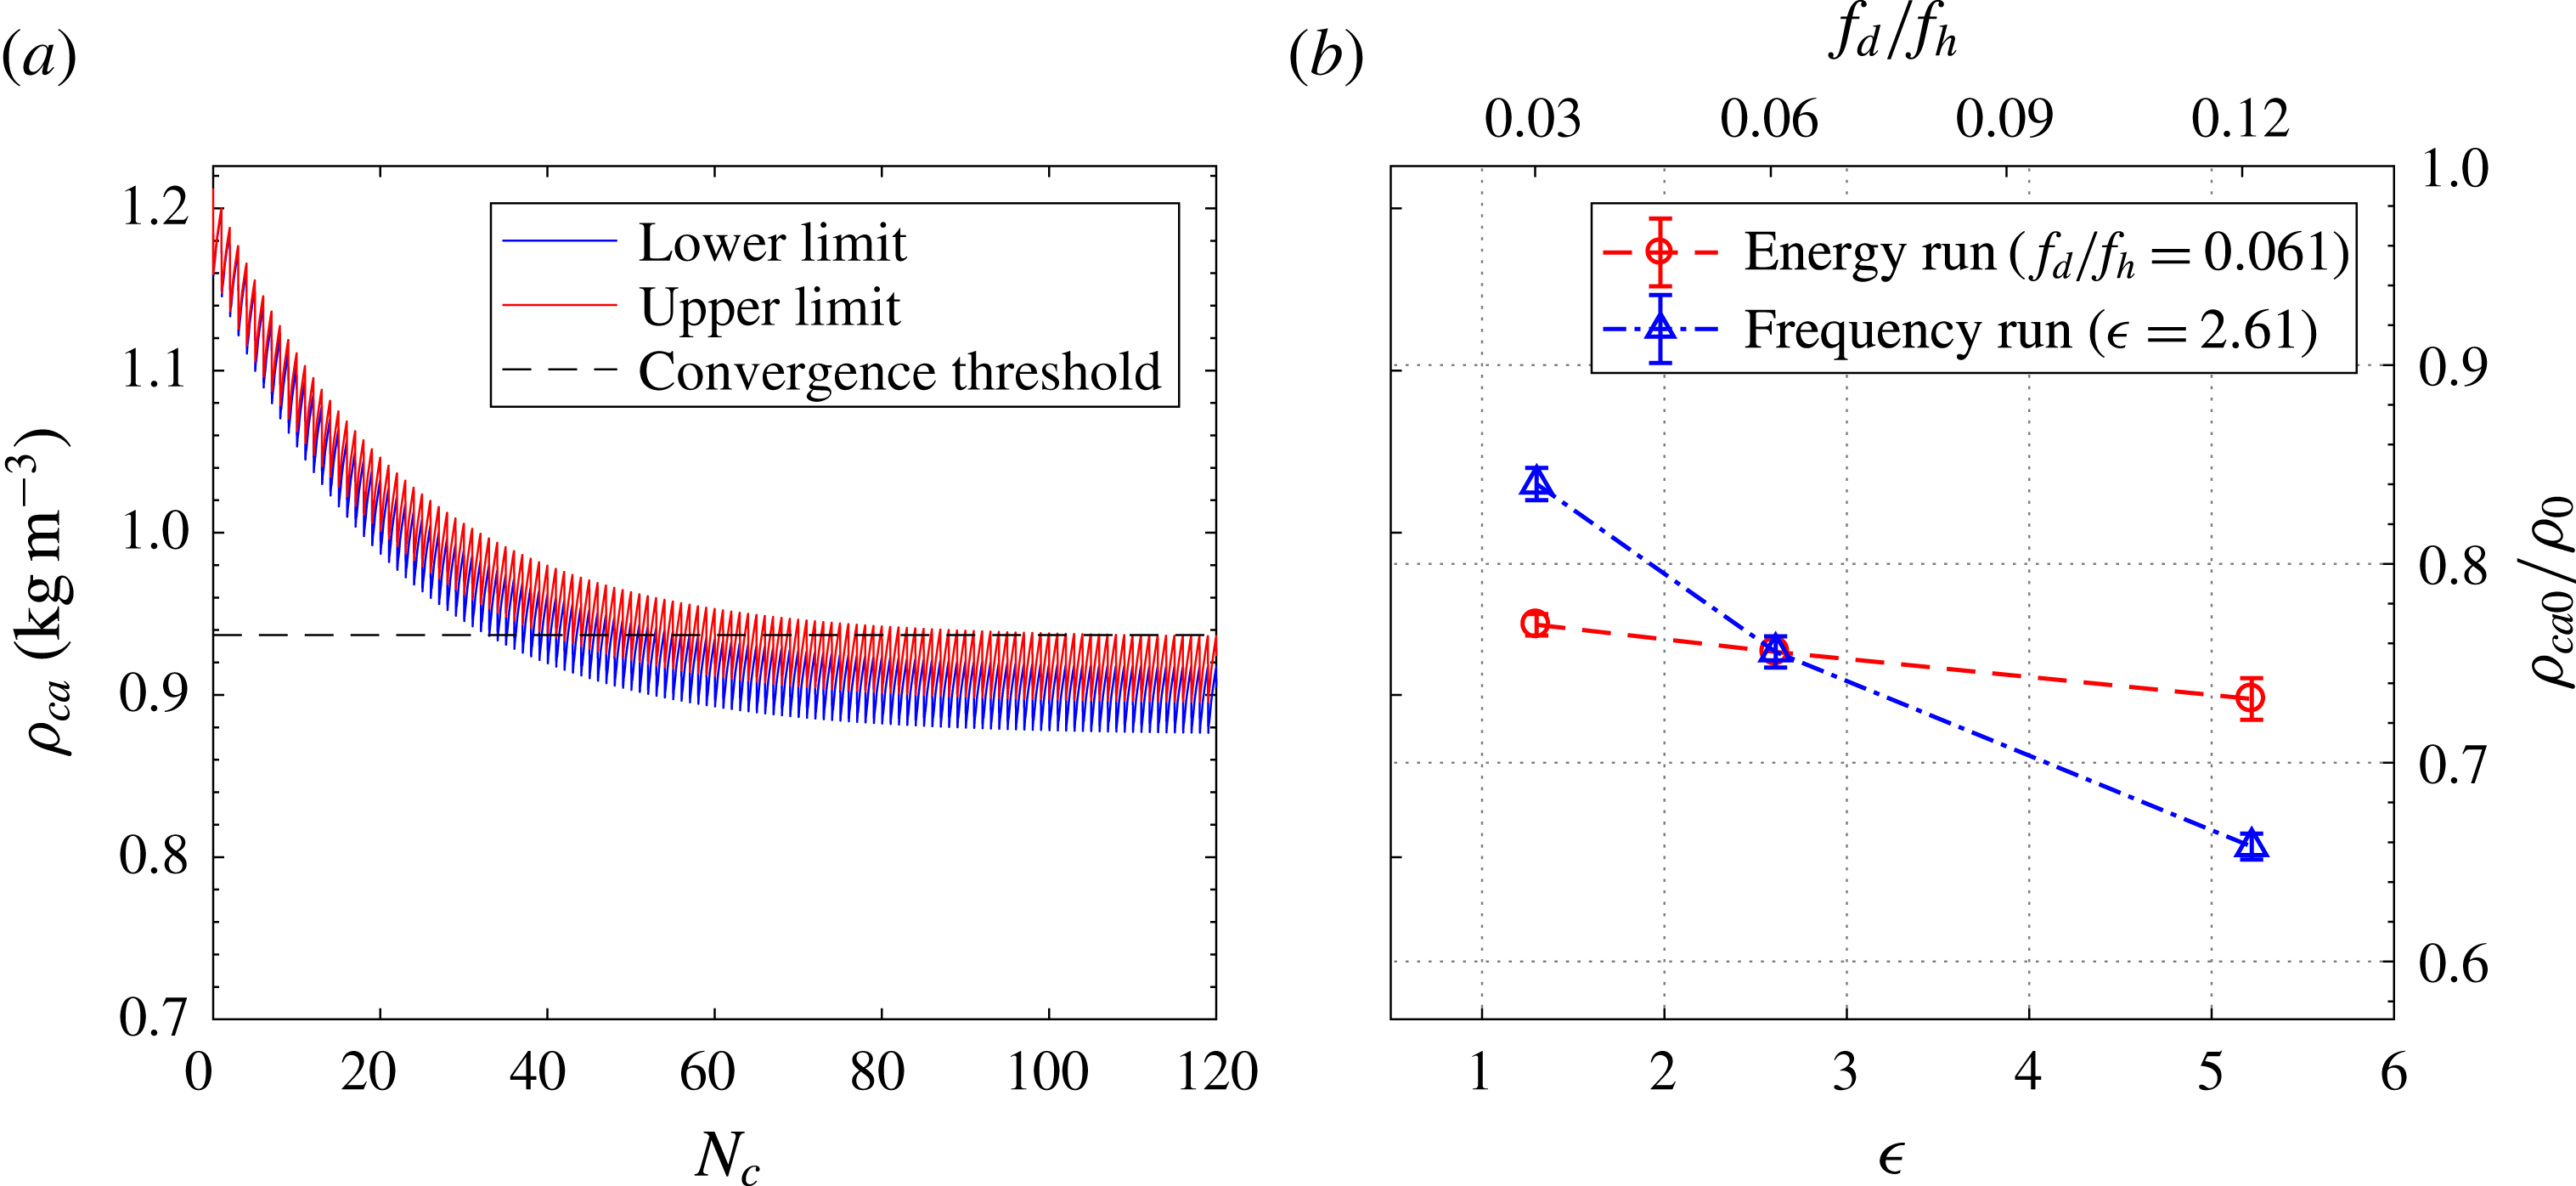
(a) Convergence of the two limits of cavity density within the first 120 iterations for case 2;
 $N_{c}$
denotes the iteration number. (b) Converged steady-state cavity density for different cases.
Convergence traces of the two limits of
 $\unicode[STIX]{x1D70C}_{ca0}$
are shown in figure 9(a). Approximately 109 iterations are needed to arrive at a converged cavity density (threshold: relative variation of
 $\unicode[STIX]{x1D70C}_{ca0}$
in adjacent iterations
 ${<}$
0.0001). The bounding limits of
 $\unicode[STIX]{x1D70C}_{ca0}$
at steady working status (i.e. steady-state cavity density) are listed in table 2 and further illustrated in figure 9(b). Overall, the steady-state cavity density values estimated by the two methods agree well with each other. The ratio of steady cavity density to ambient density drops with both non-dimensional energy deposition and frequency. The effect of frequency is more pronounced than that of energy deposition. For case 5, the steady cavity density remains only 71 % of the ambient density. It should be noted that the range of
 $f^{\ast }$
investigated in this paper is still limited to 0.12. For the cases of dimensionless frequency close to 1 as adopted by Narayanaswamy et al. (Reference Narayanaswamy, Raja and Clemens2010) and Zong et al. (Reference Zong, Wu, Li, Song, Zhang and Jia2015b
), the cavity density is expected to be even lower.
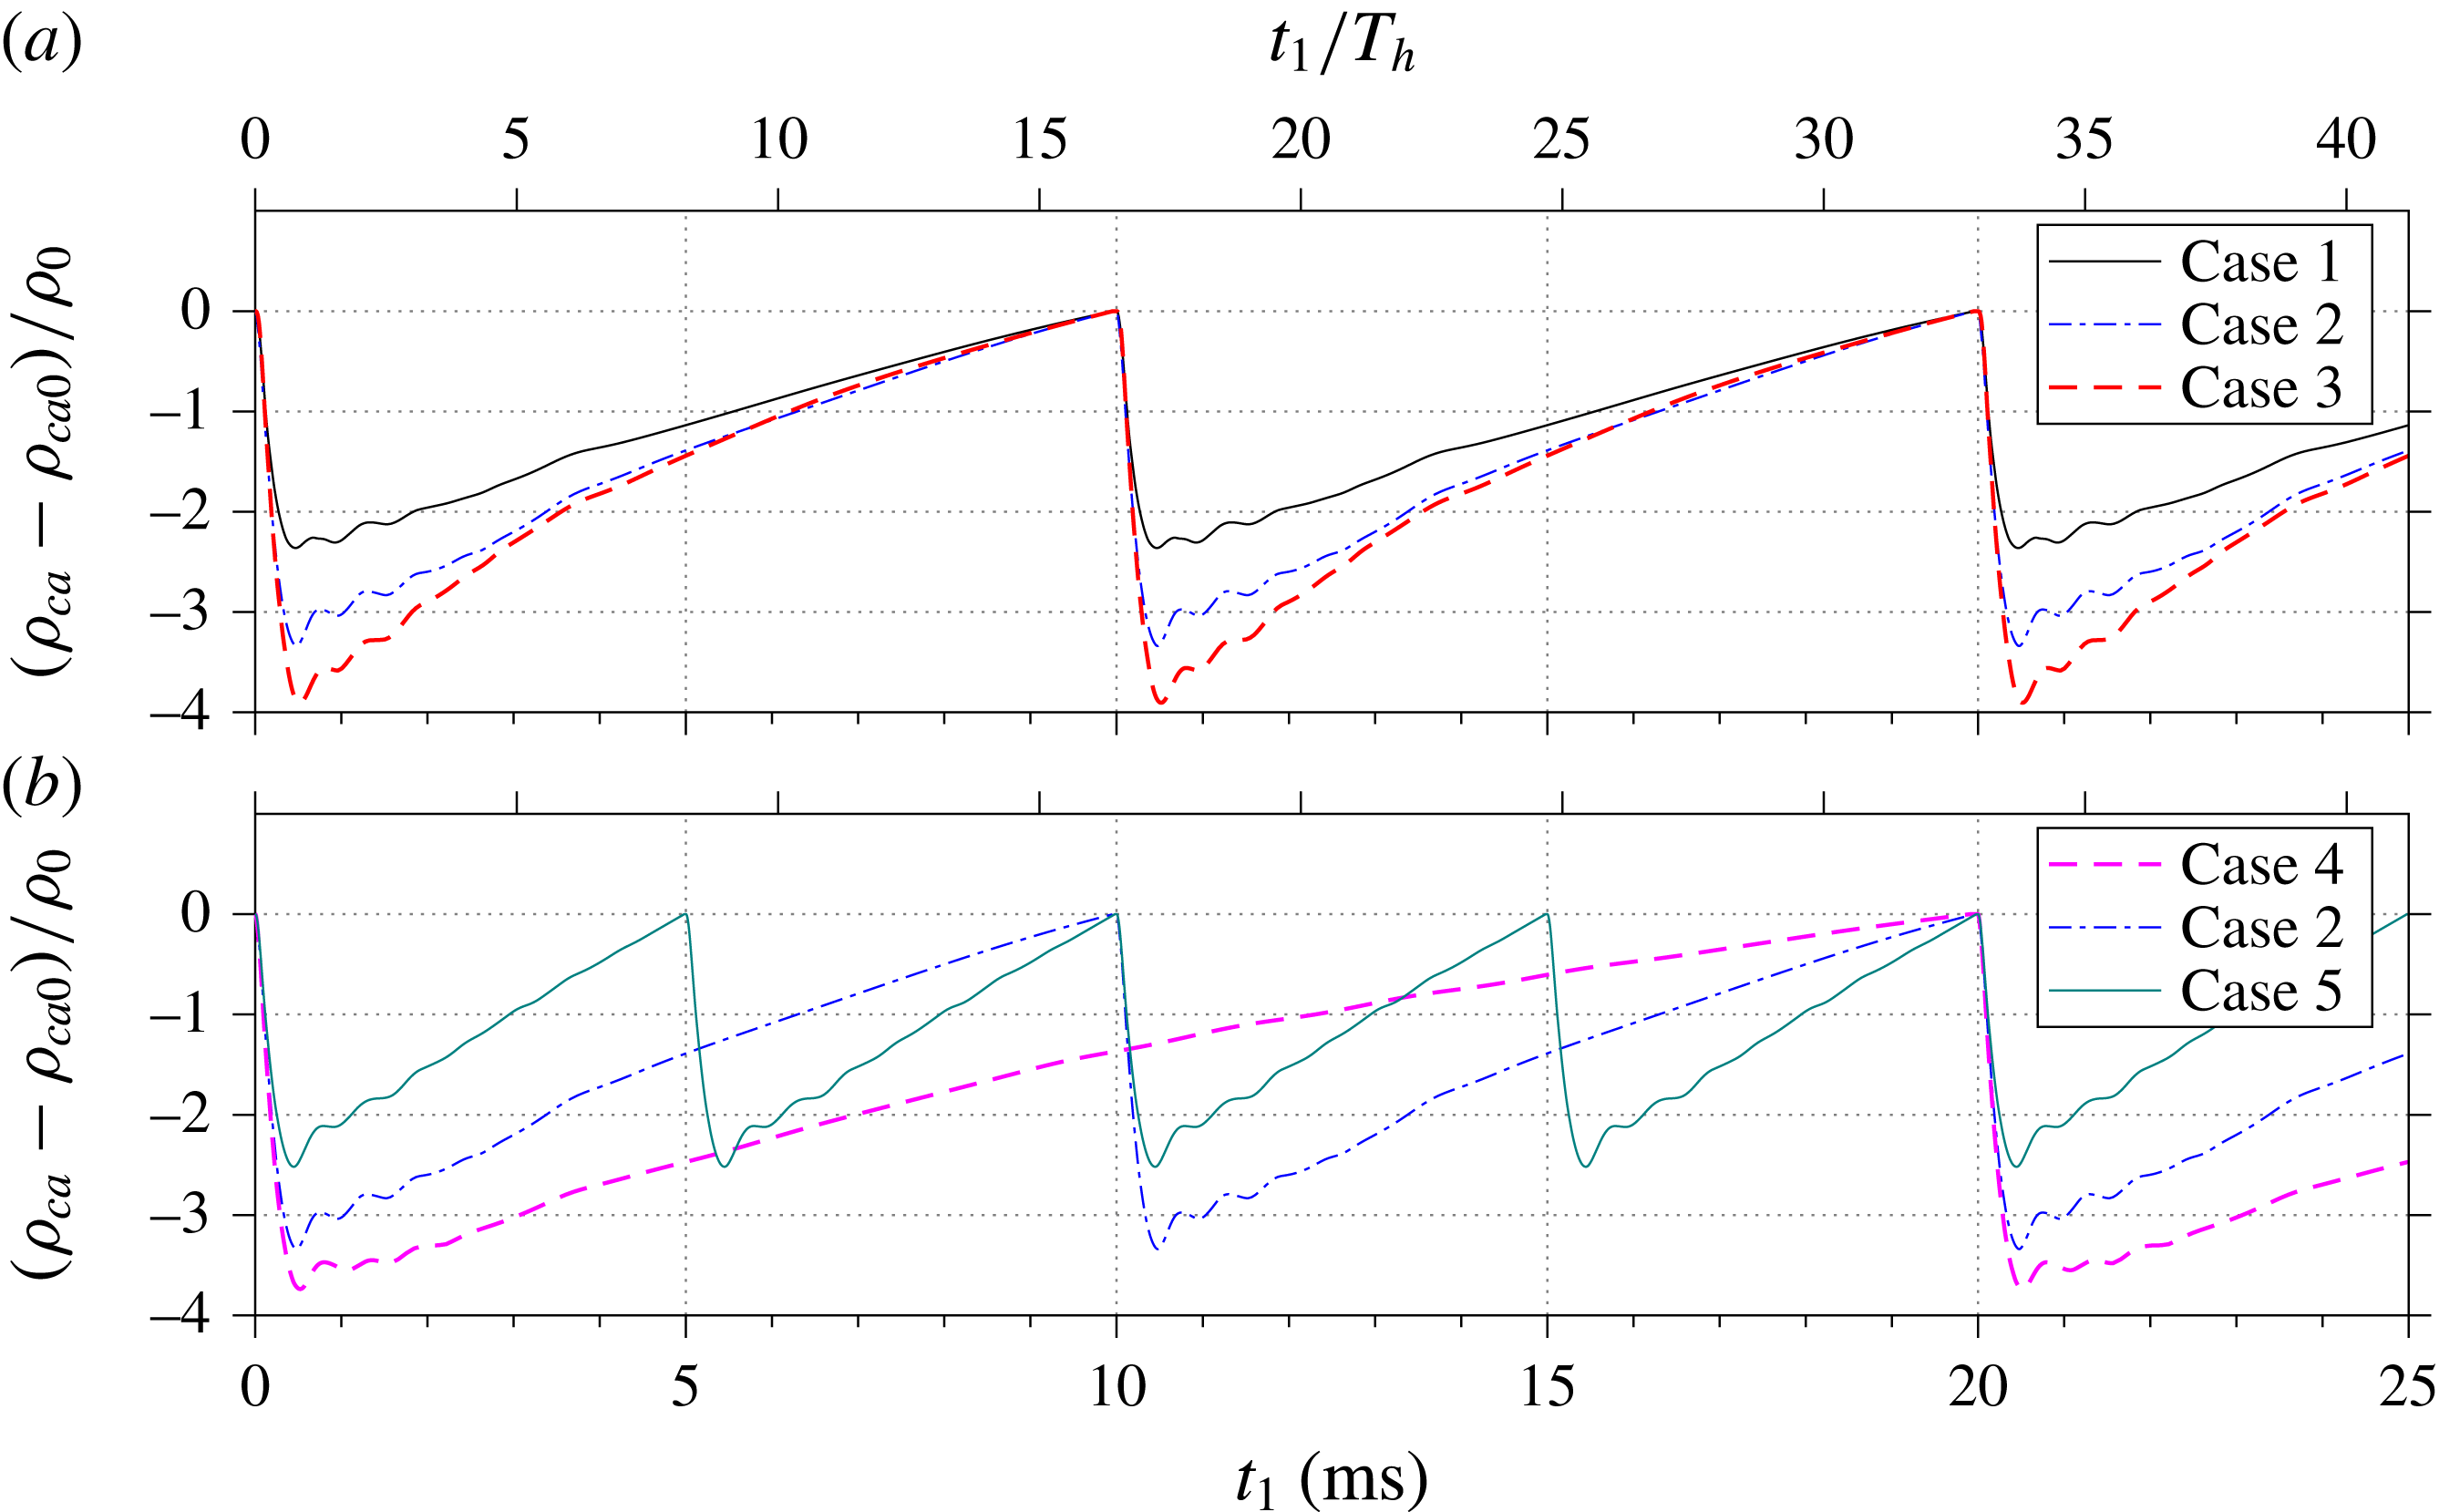
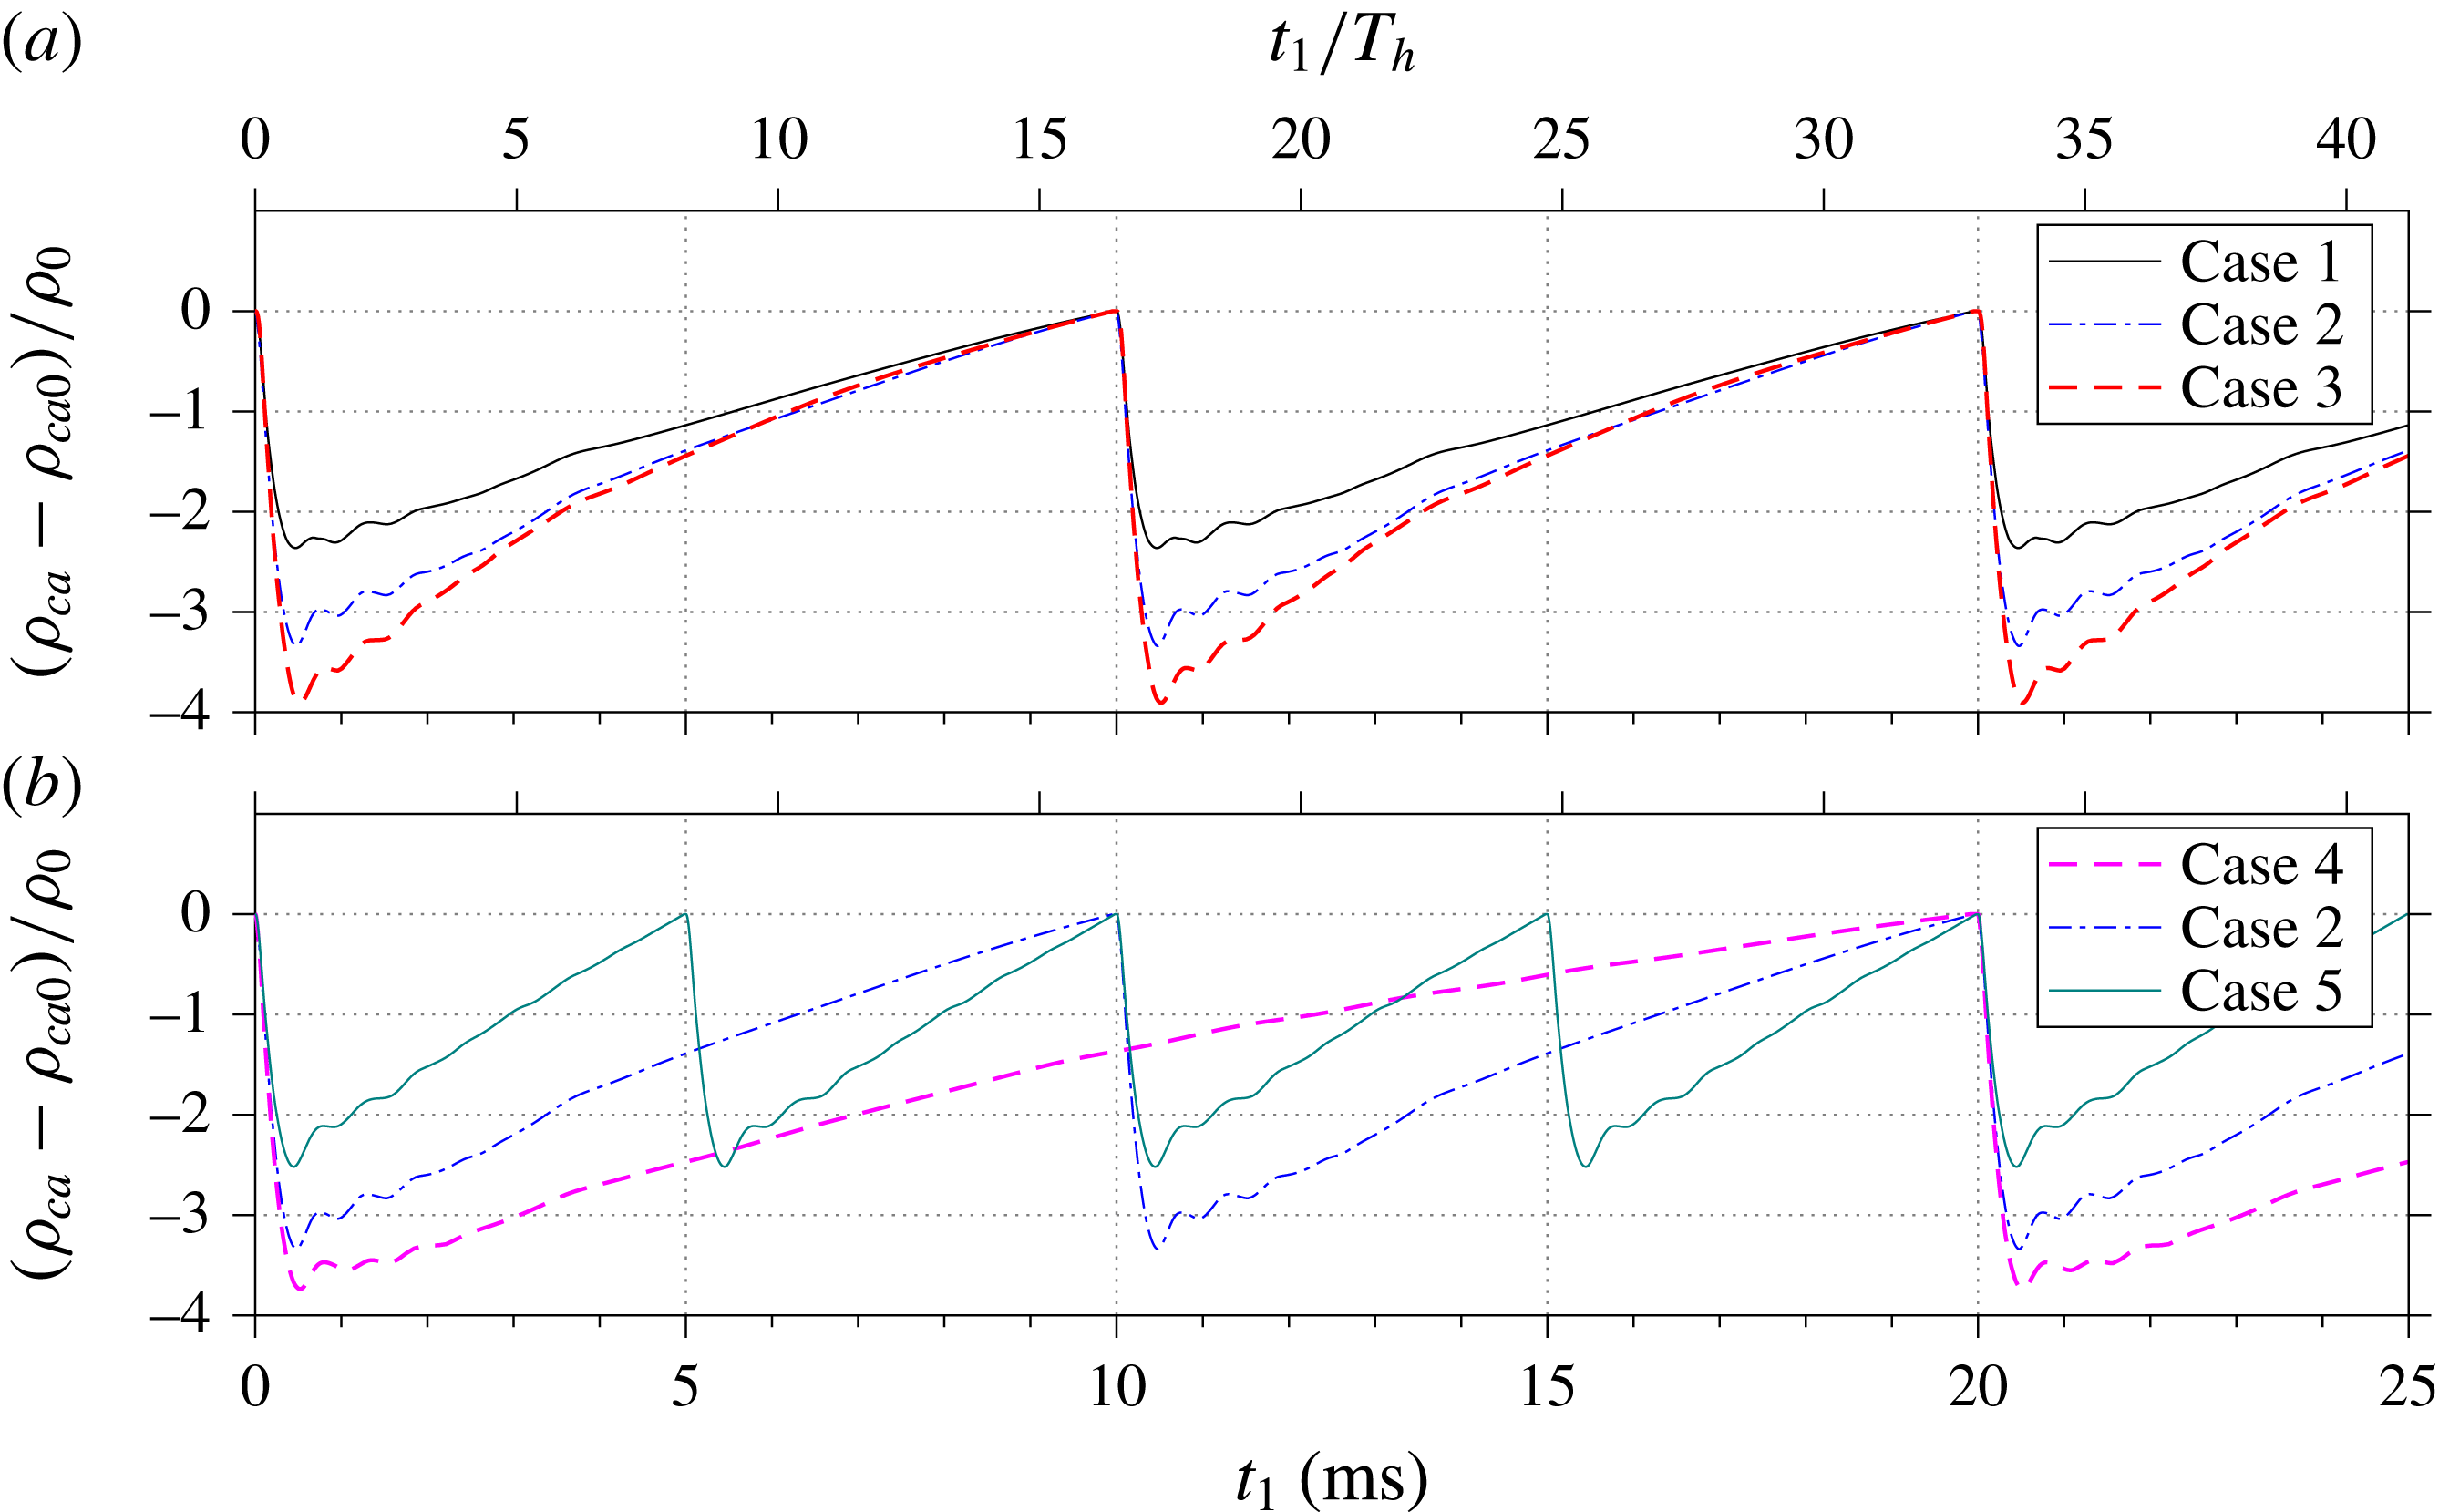
Steady-stage variations of the cavity density are shown in figure 10 for all of the tested cases. It should be noted that the initial cavity density values are subtracted to facilitate intercase comparison. The cavity density drops sharply in the primary jet stage and rises almost linearly in the longstanding refresh stage. The expelled gas mass increases with the energy deposition whereas it decreases with the actuation frequency. The rising rate of the cavity density during the refresh stage increases with both the energy deposition and the actuation frequency, which corroborates the observed variation of the mean suction velocity shown in figure 8.
Steady-stage variation of the relative cavity density,
 $(\unicode[STIX]{x1D70C}_{ca}-\unicode[STIX]{x1D70C}_{ca0})/\unicode[STIX]{x1D70C}_{0}$
: (a) effect of energy deposition and (b) effect of actuation frequency.
4.2.3 Mass flow, impulse and jet mechanical energy
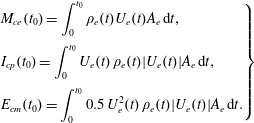
The combination of the estimated exit density and the directly measured exit velocity gives access to the cumulative mass flow (
 $M_{ce}$
), cumulative impulse (
 $I_{cp}$
) and cumulative jet mechanical energy (
 $E_{cm}$
), defined as follows:
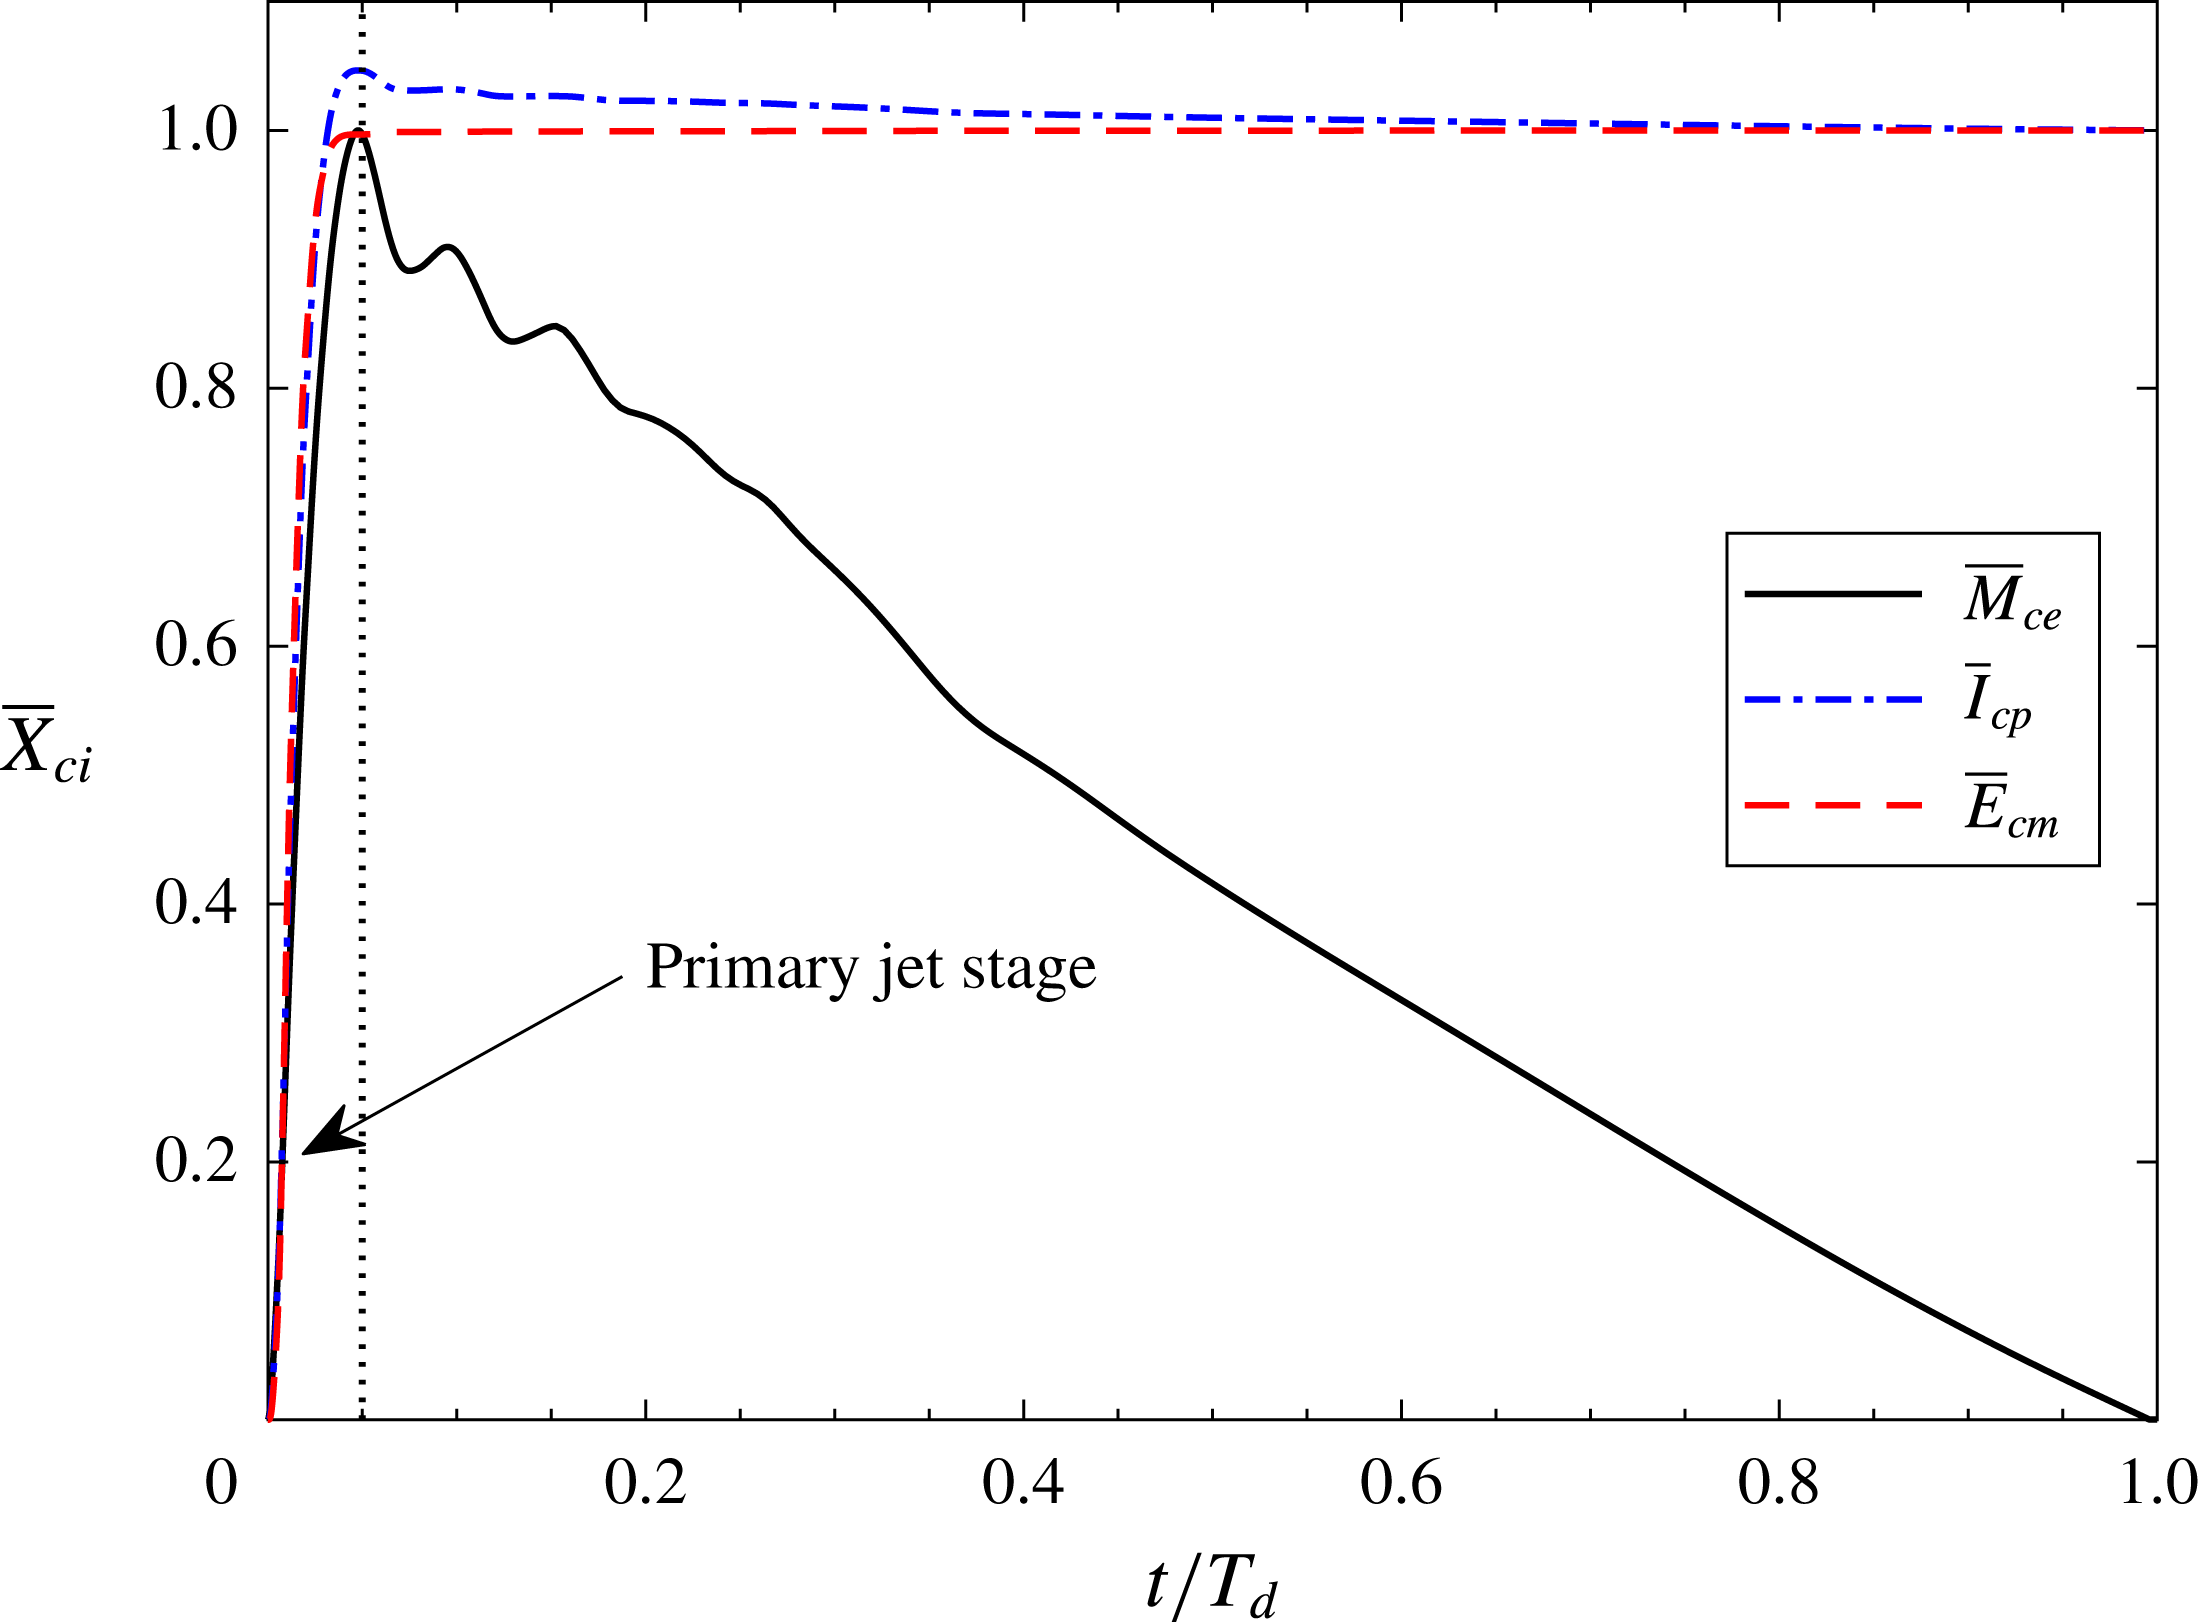
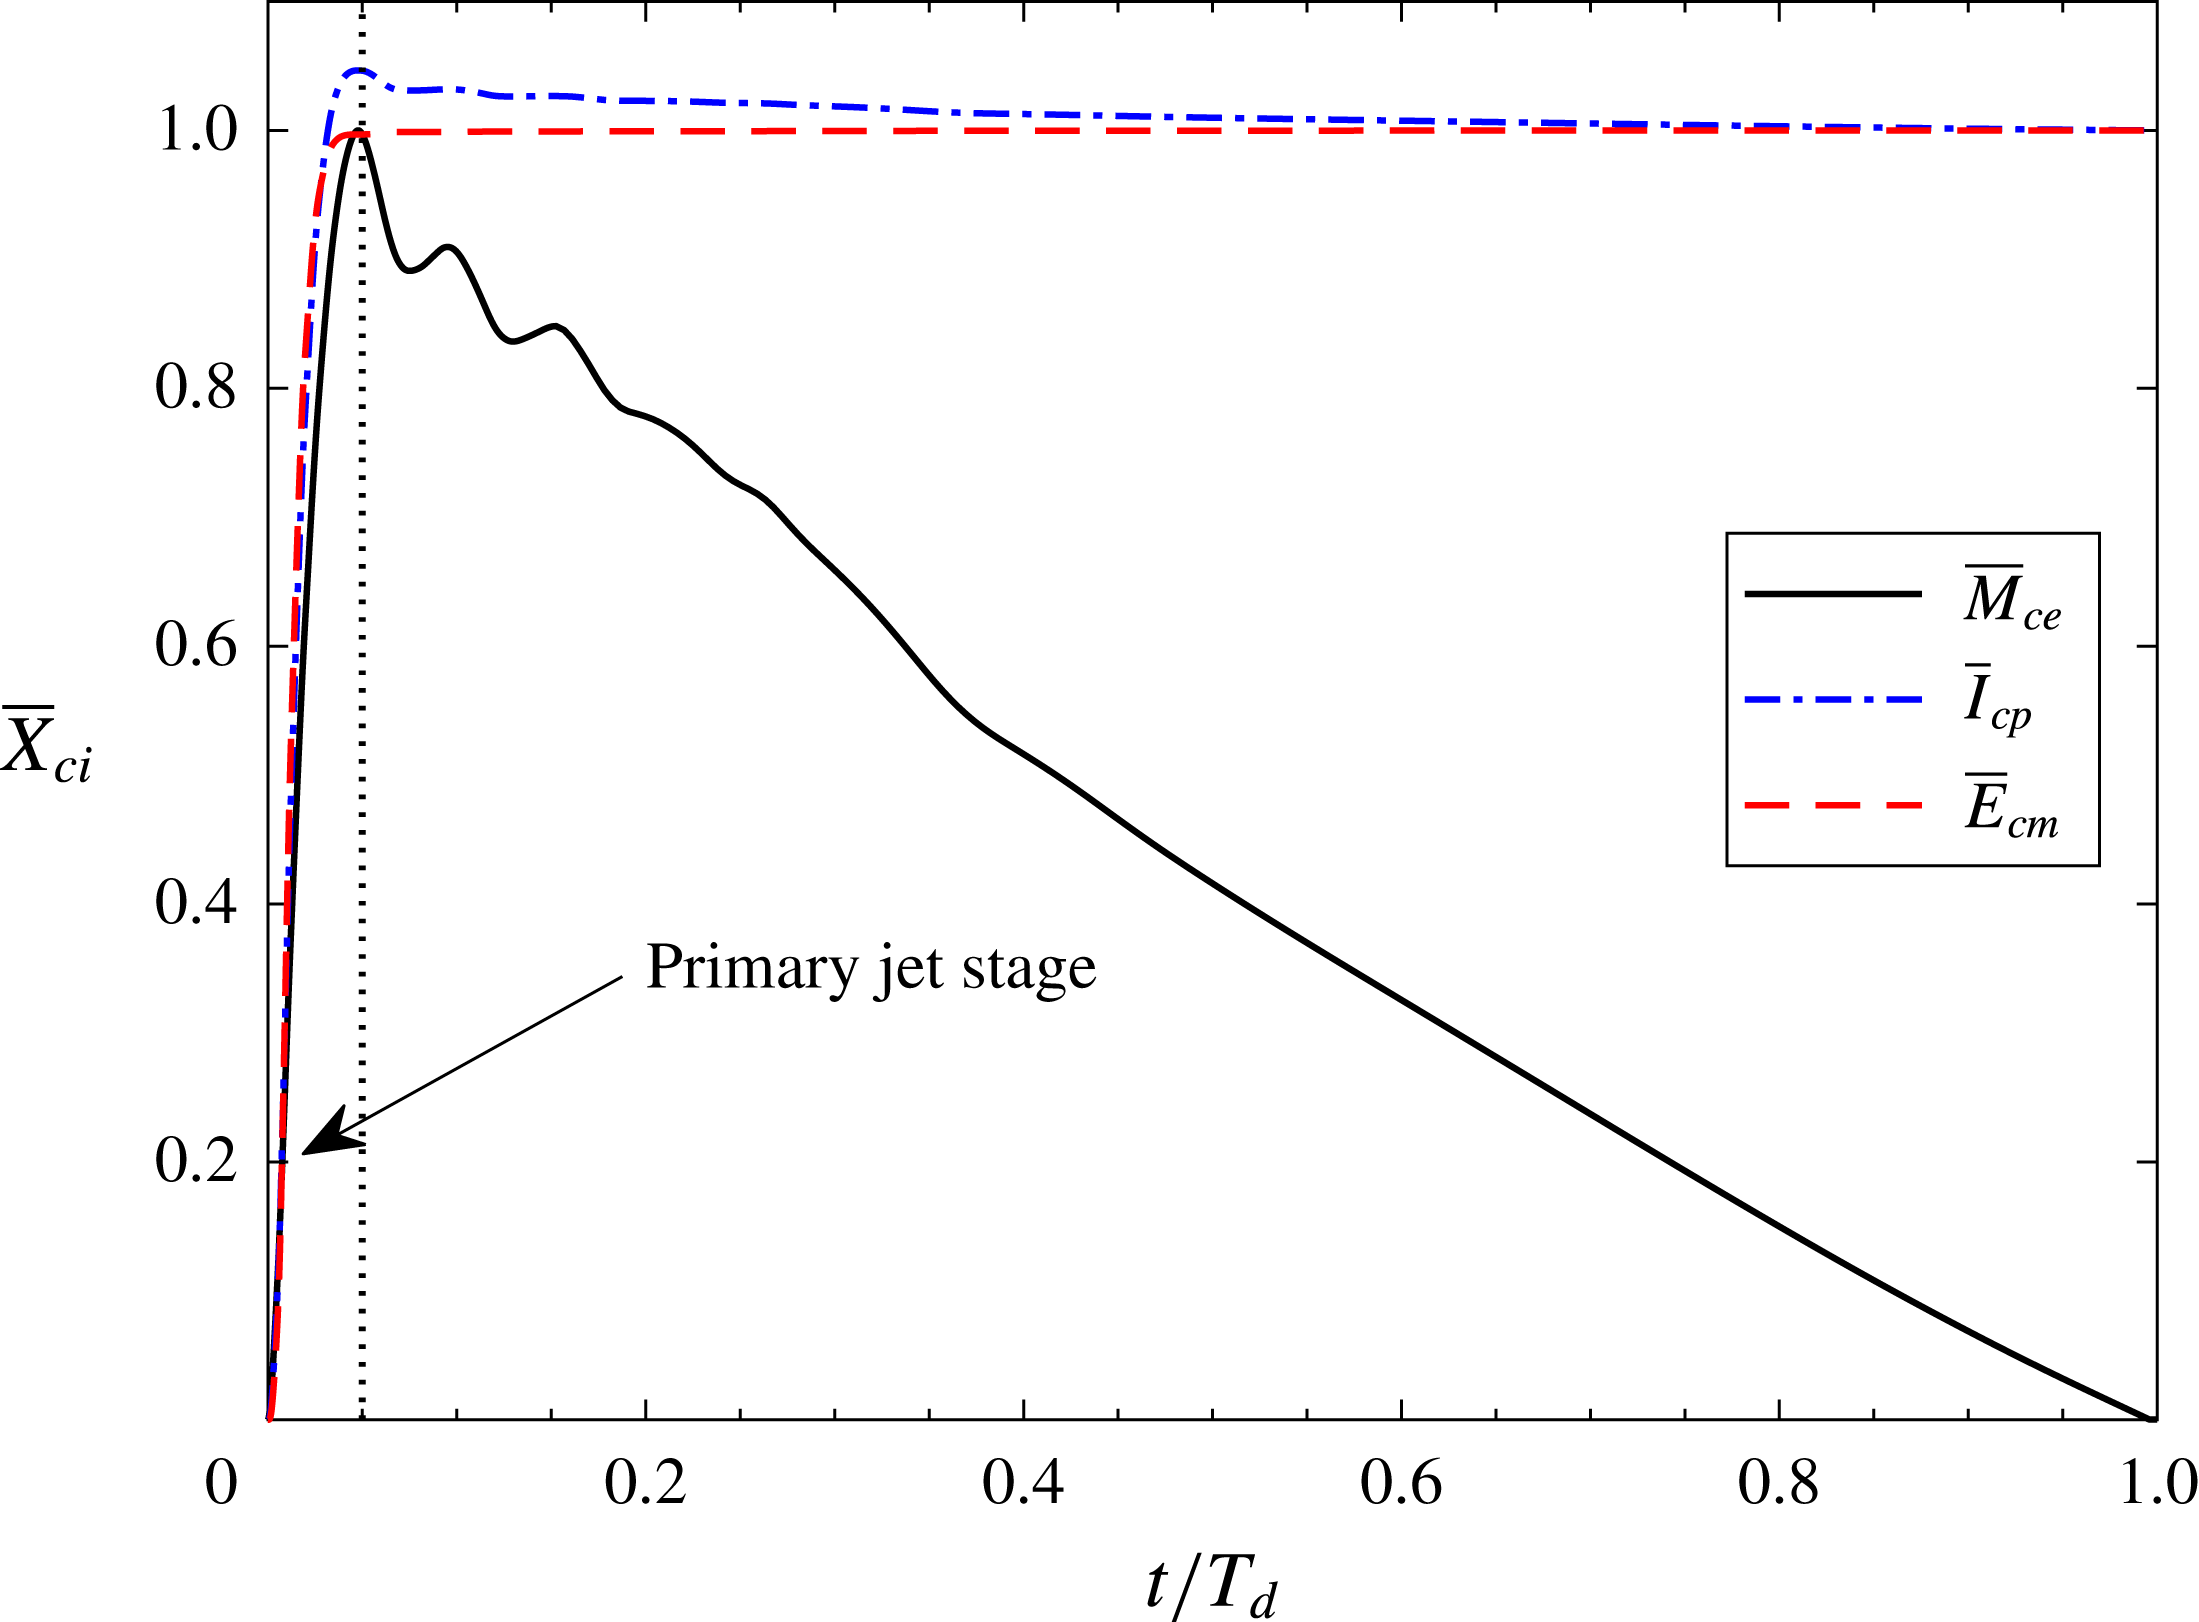
 $$\begin{eqnarray}\displaystyle \left.\begin{array}{@{}l@{}}\displaystyle M_{ce}(t_{0})=\int _{0}^{t_{0}}\unicode[STIX]{x1D70C}_{e}(t)U_{e}(t)A_{e}\,\text{d}t,\\ \displaystyle I_{cp}(t_{0})=\int _{0}^{t_{0}}U_{e}(t)\,\unicode[STIX]{x1D70C}_{e}(t)|U_{e}(t)|A_{e}\,\text{d}t,\\ \displaystyle E_{cm}(t_{0})=\int _{0}^{t_{0}}0.5\,U_{e}^{2}(t)\,\unicode[STIX]{x1D70C}_{e}(t)|U_{e}(t)|A_{e}\,\text{d}t.\end{array}\right\} & & \displaystyle\end{eqnarray}$$
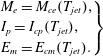
Prior to further analysis, it is necessary here to distinguish the above three time-dependent parameters with the three integral parameters defined in § 2.2. The two sets are associated as follows:
 $$\begin{eqnarray}\displaystyle \left.\begin{array}{@{}l@{}}M_{e}=M_{ce}(T_{jet}),\\ I_{p}=I_{cp}(T_{jet}),\\ E_{m}=E_{cm}(T_{jet}).\end{array}\right\} & & \displaystyle\end{eqnarray}$$
Using these three integral parameters (
 $M_{e}$
,
 $I_{p}$
and
 $E_{m}$
) to normalize the three cumulative parameters (
 $M_{ce}$
,
 $I_{cp}$
and
 $E_{cm}$
), three non-dimensional parameters (
 $\overline{M}_{ce}$
,
 $\overline{I}_{cp}$
and
 $\overline{E}_{cm}$
) can be obtained. For case 2, the variation of
 $\overline{M}_{ce}$
,
 $\overline{I}_{cp}$
and
 $\overline{E}_{cn}$
computed with the phase-averaged exit velocity and exit density within one actuation cycle is shown in figure 11.
Variation of the three cumulative parameters (symbolized as
 $\overline{X}_{ci}$
) within one actuation cycle at quasi-steady working status for case 2.
Integral parameters pertaining to PSJs.
Although multiple jet stages are present in one cycle, the contributions of later jet stages to the three cumulative parameters are negligible. As expected, the net mass flux in one full period is zero. Based on the time division between the jet and refresh stages, the mean mass flow rate during the jet stage is estimated to be 19 times higher than the corresponding mass flow rate during the suction stage. This unique feature (rapid ejection
 $+$
slow ingestion) enables the production of net impulse, which is the essential enabler for energetic flow control (Anderson & Knight Reference Anderson and Knight2012). The cumulative impulse peaks at the end of the primary jet stage. During the later evolution, a small portion (e.g. 5.1 % for case 2) of the previously produced impulse is counteracted by the inevitable suction flow. In Zong & Kotsonis (Reference Zong and Kotsonis2016b
), the overall impulse is defined as
 $I_{cp}(T_{jet})$
, which slightly overestimates the net impulse produced by the PSJA. Additionally, the overwhelming majority of mechanical energy (99.6 %) is produced during the primary jet stage. As such, the mechanical energy brought upon by suction flow can be neglected.
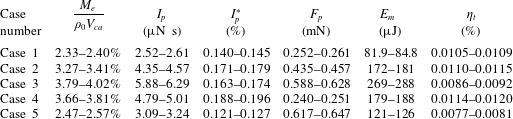
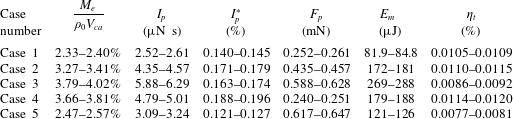
The estimated expelled gas mass
 $(M_{e}/(\unicode[STIX]{x1D70C}_{0}V_{ca}))$
, net impulse (
 $I_{p}$
) and issued mechanical energy (
 $E_{m}$
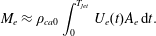
) are listed in table 3 for all tested cases. A 4 times increase of energy deposition results in 1.6, 2.4 and 3.3 times increases in expelled gas mass, jet impulse and jet mechanical energy respectively. This is largely expected. A simplified theoretical analysis is performed to support the interpretation of these trends. Assuming that the non-dimensional expelled gas mass is relatively small (less than 4 % in the current study), the jet exit density (
 $\unicode[STIX]{x1D70C}_{e}$
) in (2.4) can be approximated by the steady cavity density (
 $\unicode[STIX]{x1D70C}_{ca0}$
), leading to a simplified expression for
 $M_{e}$
as follows:
 $$\begin{eqnarray}\displaystyle M_{e}\approx \unicode[STIX]{x1D70C}_{ca0}\int _{0}^{T_{jet}}U_{e}(t)A_{e}\,\text{d}t. & & \displaystyle\end{eqnarray}$$
Further, if the temporal evolution of the exit velocity during the primary jet stage is self-similar (as evident in figure 7),
 $U_{e}(t)$
can be written universally as
 $U_{e}(t)=U_{p}f(t/T_{jet})$
, where
 $f$
is the normalized exit velocity evolution. By substituting this relation into (4.9), (4.10) can be obtained. A similar analysis can also be performed on the expelled gas mass and jet impulse. The respective results are shown in (4.11) and (4.12).
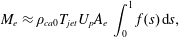 $$\begin{eqnarray}\displaystyle & \displaystyle M_{e}\approx \unicode[STIX]{x1D70C}_{ca0}T_{jet}U_{p}A_{e}\,\int _{0}^{1}f(s)\,\text{d}s, & \displaystyle\end{eqnarray}$$
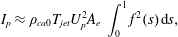 $$\begin{eqnarray}\displaystyle & \displaystyle I_{p}\approx \unicode[STIX]{x1D70C}_{ca0}T_{jet}U_{p}^{2}A_{e}\,\int _{0}^{1}f^{2}(s)\,\text{d}s, & \displaystyle\end{eqnarray}$$
 $$\begin{eqnarray}\displaystyle & \displaystyle E_{m}\approx 0.5\unicode[STIX]{x1D70C}_{ca0}T_{jet}U_{p}^{3}A_{e}\,\int _{0}^{1}f^{3}(s)\,\text{d}s. & \displaystyle\end{eqnarray}$$
For the cases pertaining to the present study as well as the cases in Zong & Kotsonis (Reference Zong and Kotsonis2016b
), the integral of increasing exponents of
 $f(s)$
is largely invariant (relative deviation
 ${<}$
5 %). Thus, the exit velocity temporal evolution shape plays a negligible role in (4.10)–(4.12). For a fixed cavity geometry, the three integral parameters are positively proportional to the steady cavity density, jet duration time and increasing exponents of peak jet velocity.
By combining (4.12) with (2.1), the relation between the peak jet velocity and the energy deposition can be derived,
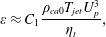 $$\begin{eqnarray}\displaystyle \unicode[STIX]{x1D700}\approx C_{1}\frac{\unicode[STIX]{x1D70C}_{ca0}T_{jet}U_{p}^{3}}{\unicode[STIX]{x1D702}_{t}}, & & \displaystyle\end{eqnarray}$$
where
 $C_{1}$
is a constant depending on the actuator geometry and total efficiency.
For cases 1–3,
 $T_{jet}$
remains almost constant and
 $\unicode[STIX]{x1D70C}_{ca0}$
changes by less than 7 %. Assuming small variations in the total efficiency (0.009–0.011 %, see table 3), the peak jet velocity will increase with the cubic root of the energy deposition as follows:
 $$\begin{eqnarray}\displaystyle U_{p}\propto \unicode[STIX]{x1D700}^{1/3}. & & \displaystyle\end{eqnarray}$$
While subject to several approximations, the simplified model proposed in (4.14) reconciles favourably with the observed trends. A 4 times increase of energy deposition will bring a theoretical increase of 1.6 times in
 $U_{p}$
, which roughly agrees with the experimental observation (
 $81~\text{m}~\text{s}^{-1}\rightarrow 116~\text{m}~\text{s}^{-1}$
, 1.4 times). On propagating the energy deposition increment (1.6 times) to the pertinent performance parameters, the predicted growths of
 $M_{e}$
,
 $I_{p}$
and
 $E_{m}$
are 1.6, 2.5 and 4 times respectively, which are consistent with experimental data (1.7, 2.4 and 3.3 times respectively). The peak estimation error is approximately 20 % and can be attributed to the constant efficiency assumption. A significant outcome of the above analysis is the confirmation that significant improvement of jet intensity with energy deposition is mainly contributed by the peak jet velocity.
In contrast to energy deposition, a 4 times increase of actuation frequency leads to drops of 33 %, 36 % and 33 % respectively for
 $M_{e}$
,
 $I_{p}$
and
 $E_{m}$
. The reductions for the three integral parameters are almost identical since the peak jet velocity is effectively the same in cases 4, 2 and 5 (see table 2). As indicated by (4.10)–(4.12), the performance decay with increasing frequency is mainly related to the reduced cavity density (22 %) and the shortened jet duration time (13 %). Of these two factors, the reduced cavity density plays a dominant role.
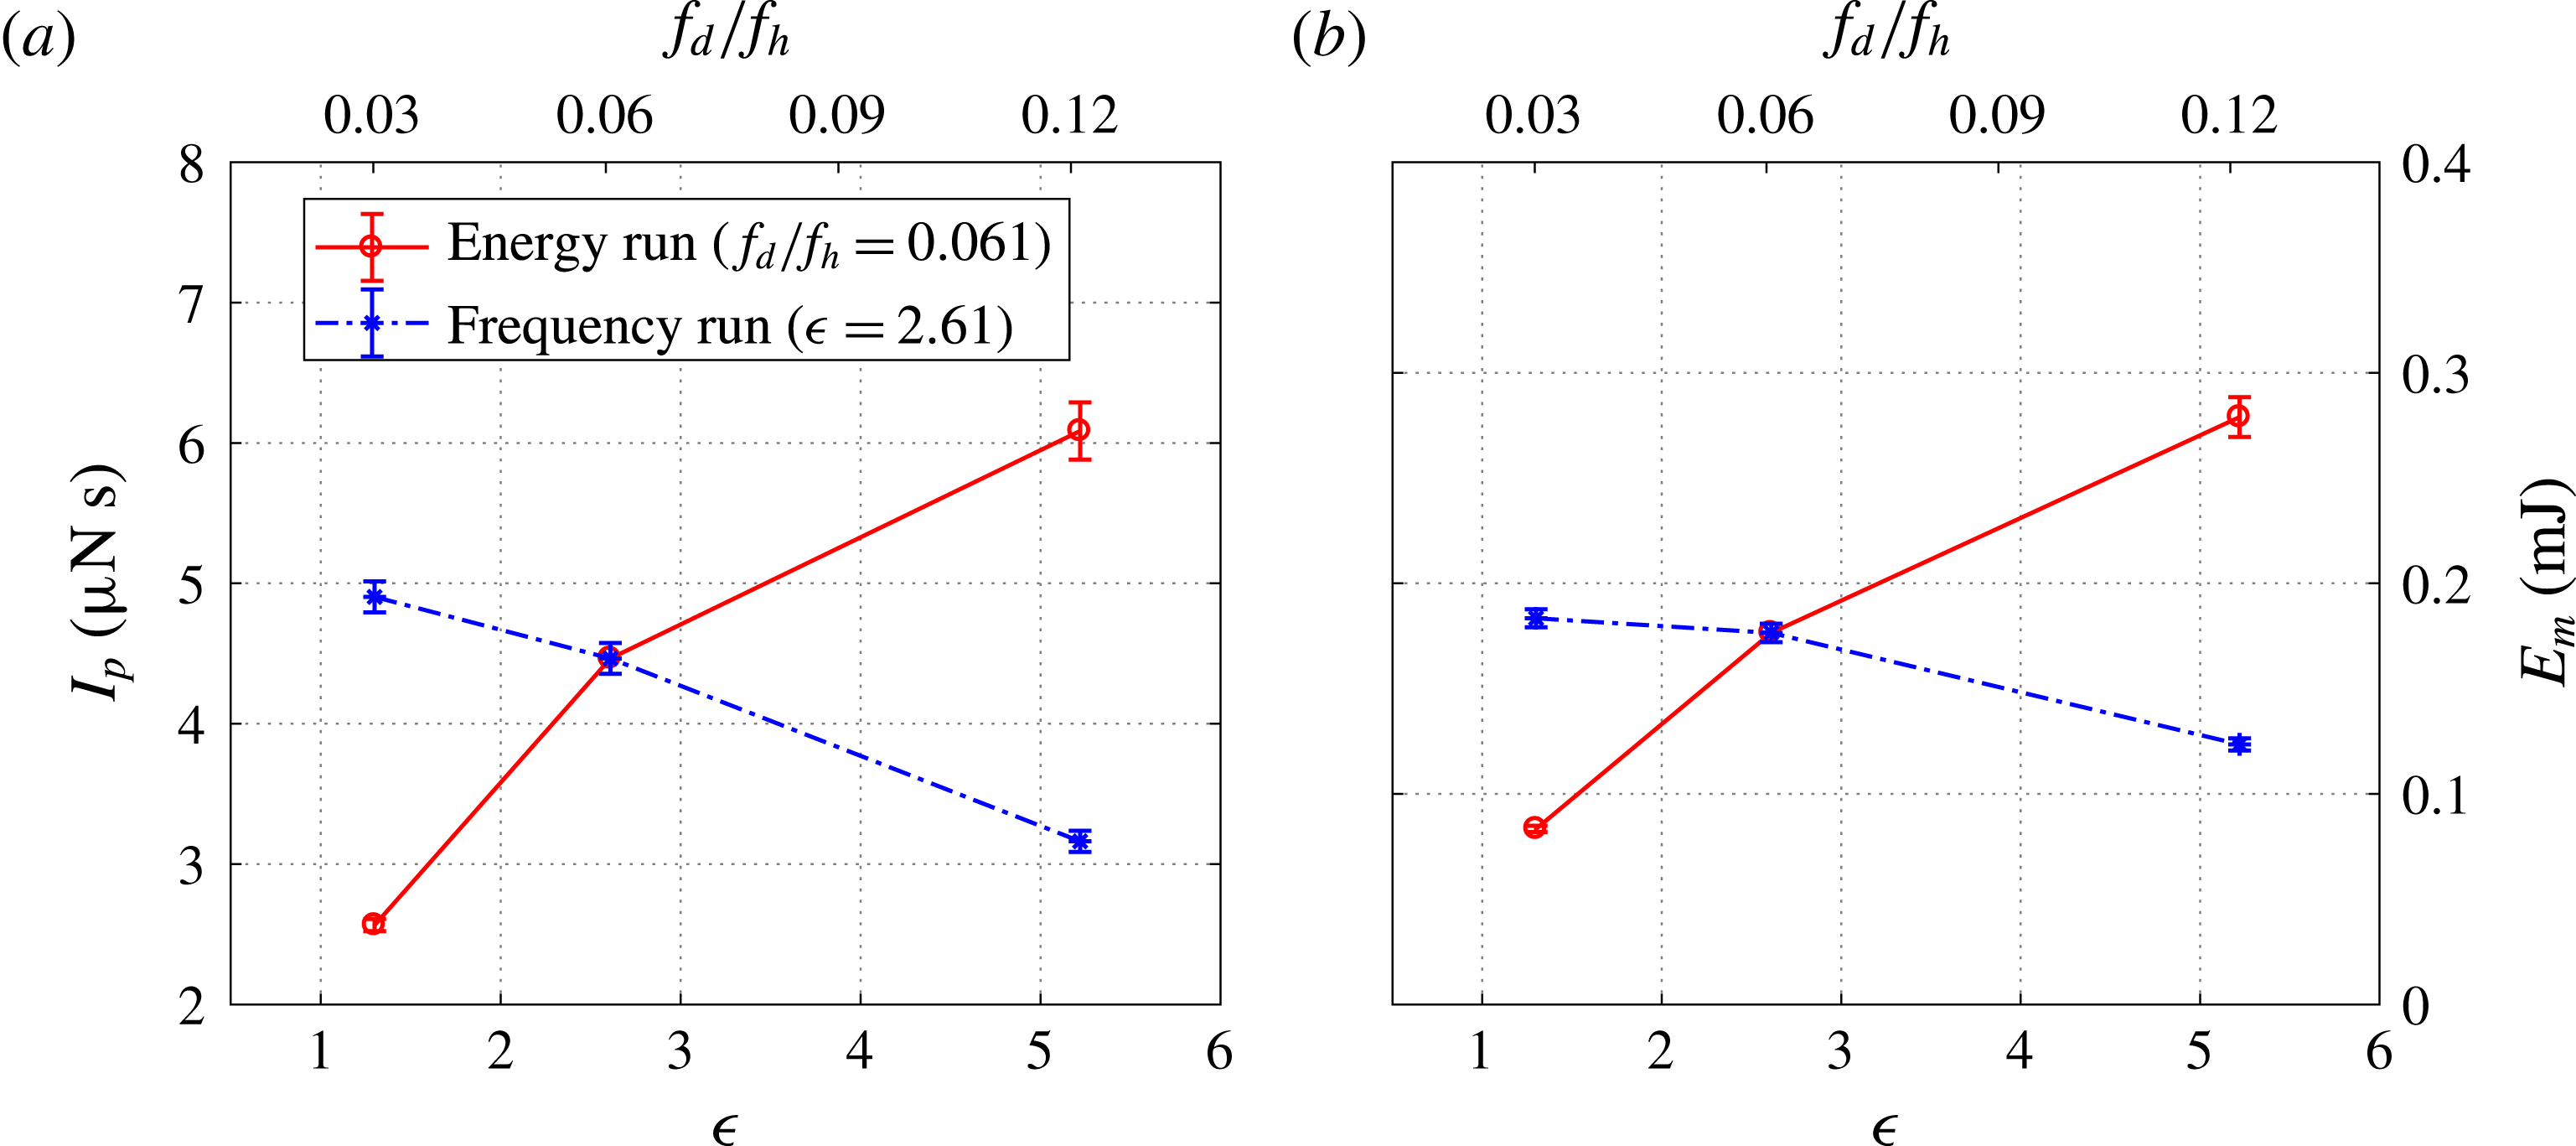
Variation of (a) net impulse and (b) issued mechanical energy with non-dimensional energy deposition and frequency (
 $f^{\ast }$
).
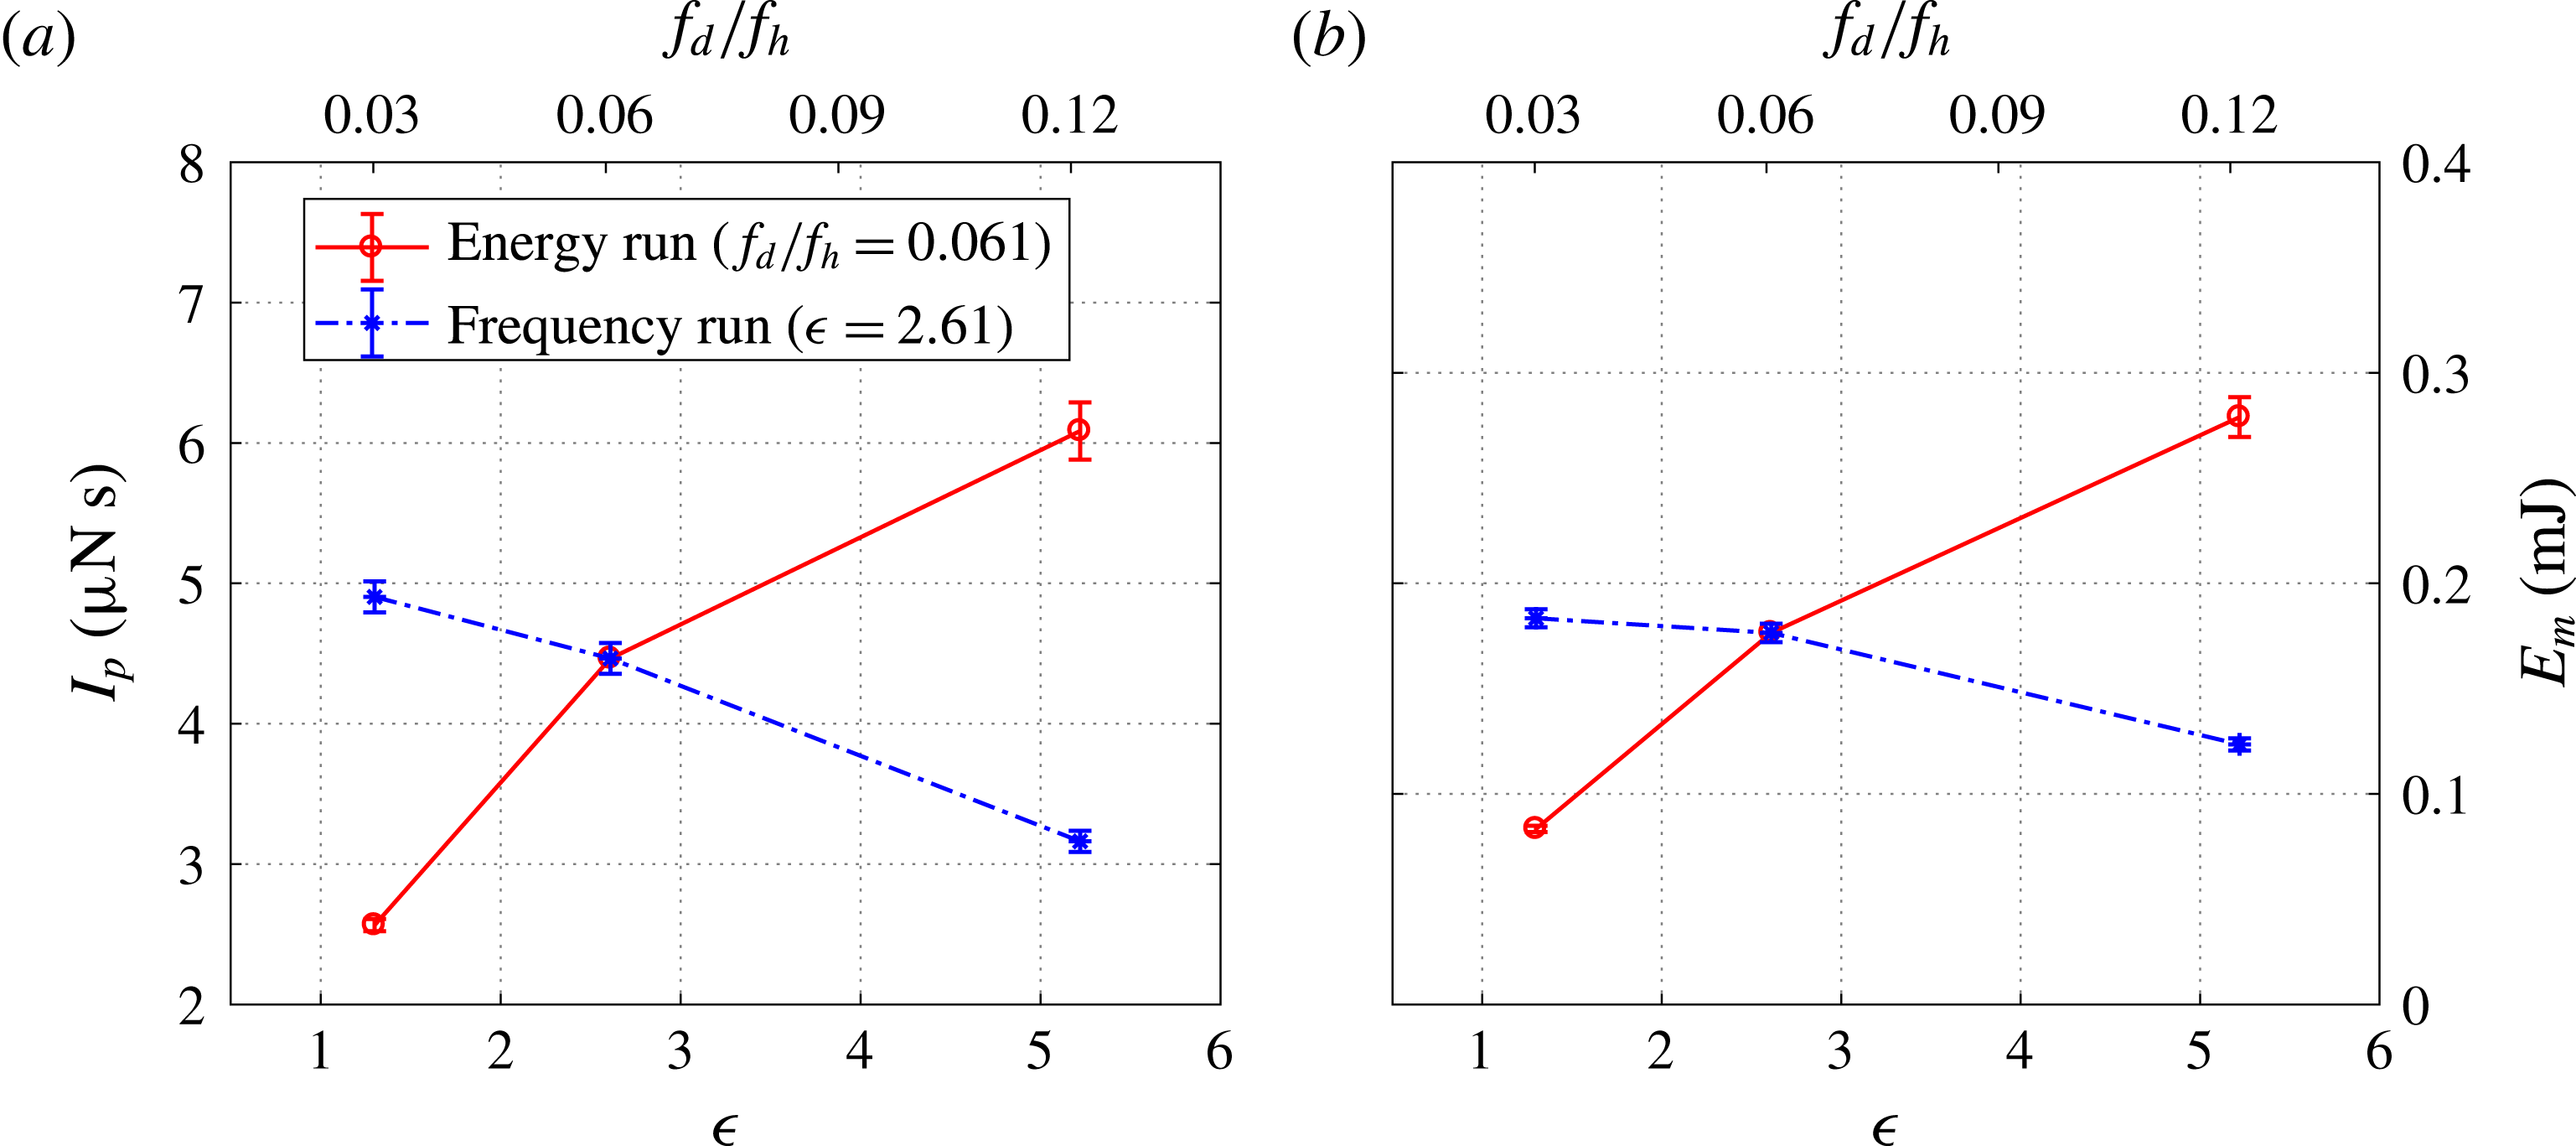
Finally, the variation of
 $I_{p}$
and
 $E_{m}$
with non-dimensional energy deposition and frequency is shown in figure 12. For the tested cases,
 $I_{p}$
changes between
 $2$
and
 $6~\unicode[STIX]{x03BC}\text{N}~\text{s}$
. The product of
 $I_{p}$
and the discharge frequency
 $f_{d}$
gives the time-averaged net thrust produced by the PSJA (denoted as
 $F_{p}$
). As listed in table 3,
 $F_{p}$
is of the order of 0.1 mN and positively proportional to both the energy deposition and the frequency. The issued mechanical energy
 $E_{m}$
is of the order of 0.1 mJ and the peak value observed is 0.246 mJ. The net impulse
 $I_{p}$
and issued mechanical energy
 $E_{m}$
can be further normalized to deduce another two dimensionless parameters,
 $I_{p}^{\ast }$
and
 $\unicode[STIX]{x1D702}_{t}$
respectively (see § 2.2 for their definition). As listed in table 3, both
 $I_{p}^{\ast }$
and
 $\unicode[STIX]{x1D702}_{t}$
reduce with the actuation frequency. However, no obvious trends are found in the energy deposition run. The distinction is caused by the different definitions. Specifically, the efficiency considered here incorporates not only the electro-mechanical efficiency but also the discharge efficiency, which drops with increasing capacitor voltage (Belinger et al.
Reference Belinger, Naudé, Cambronne and Caruana2014).
4.3 Localized suction
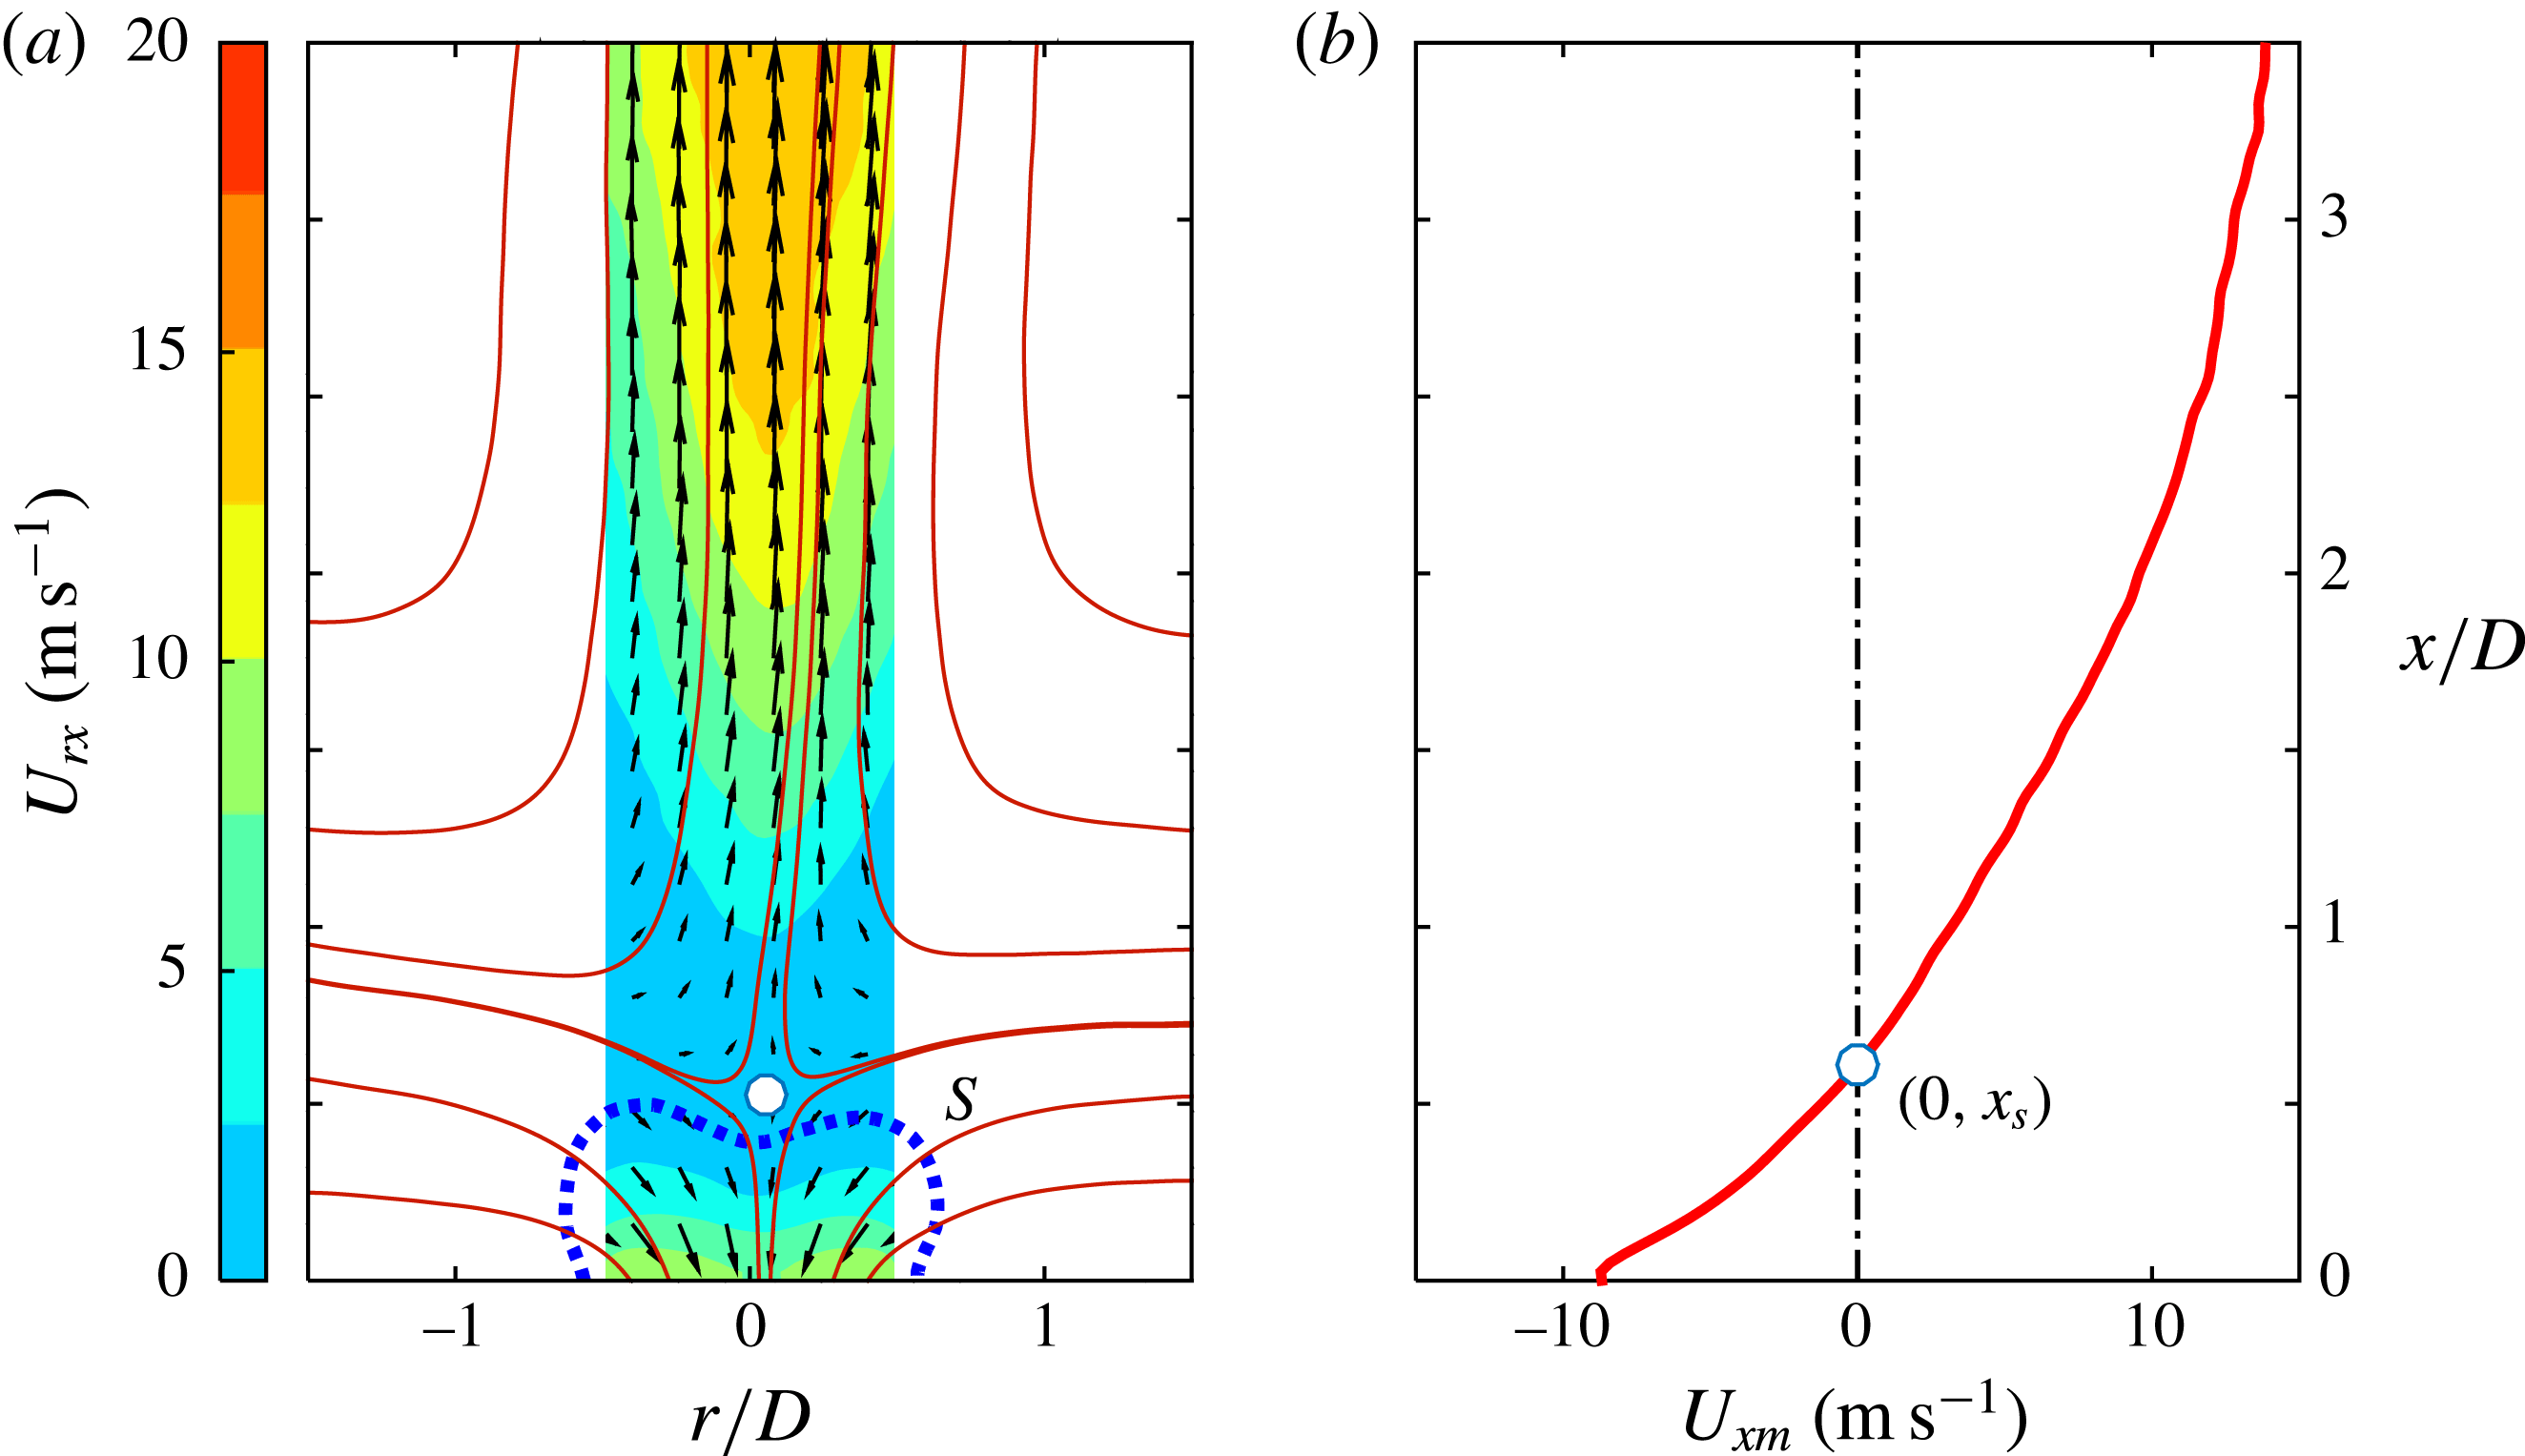
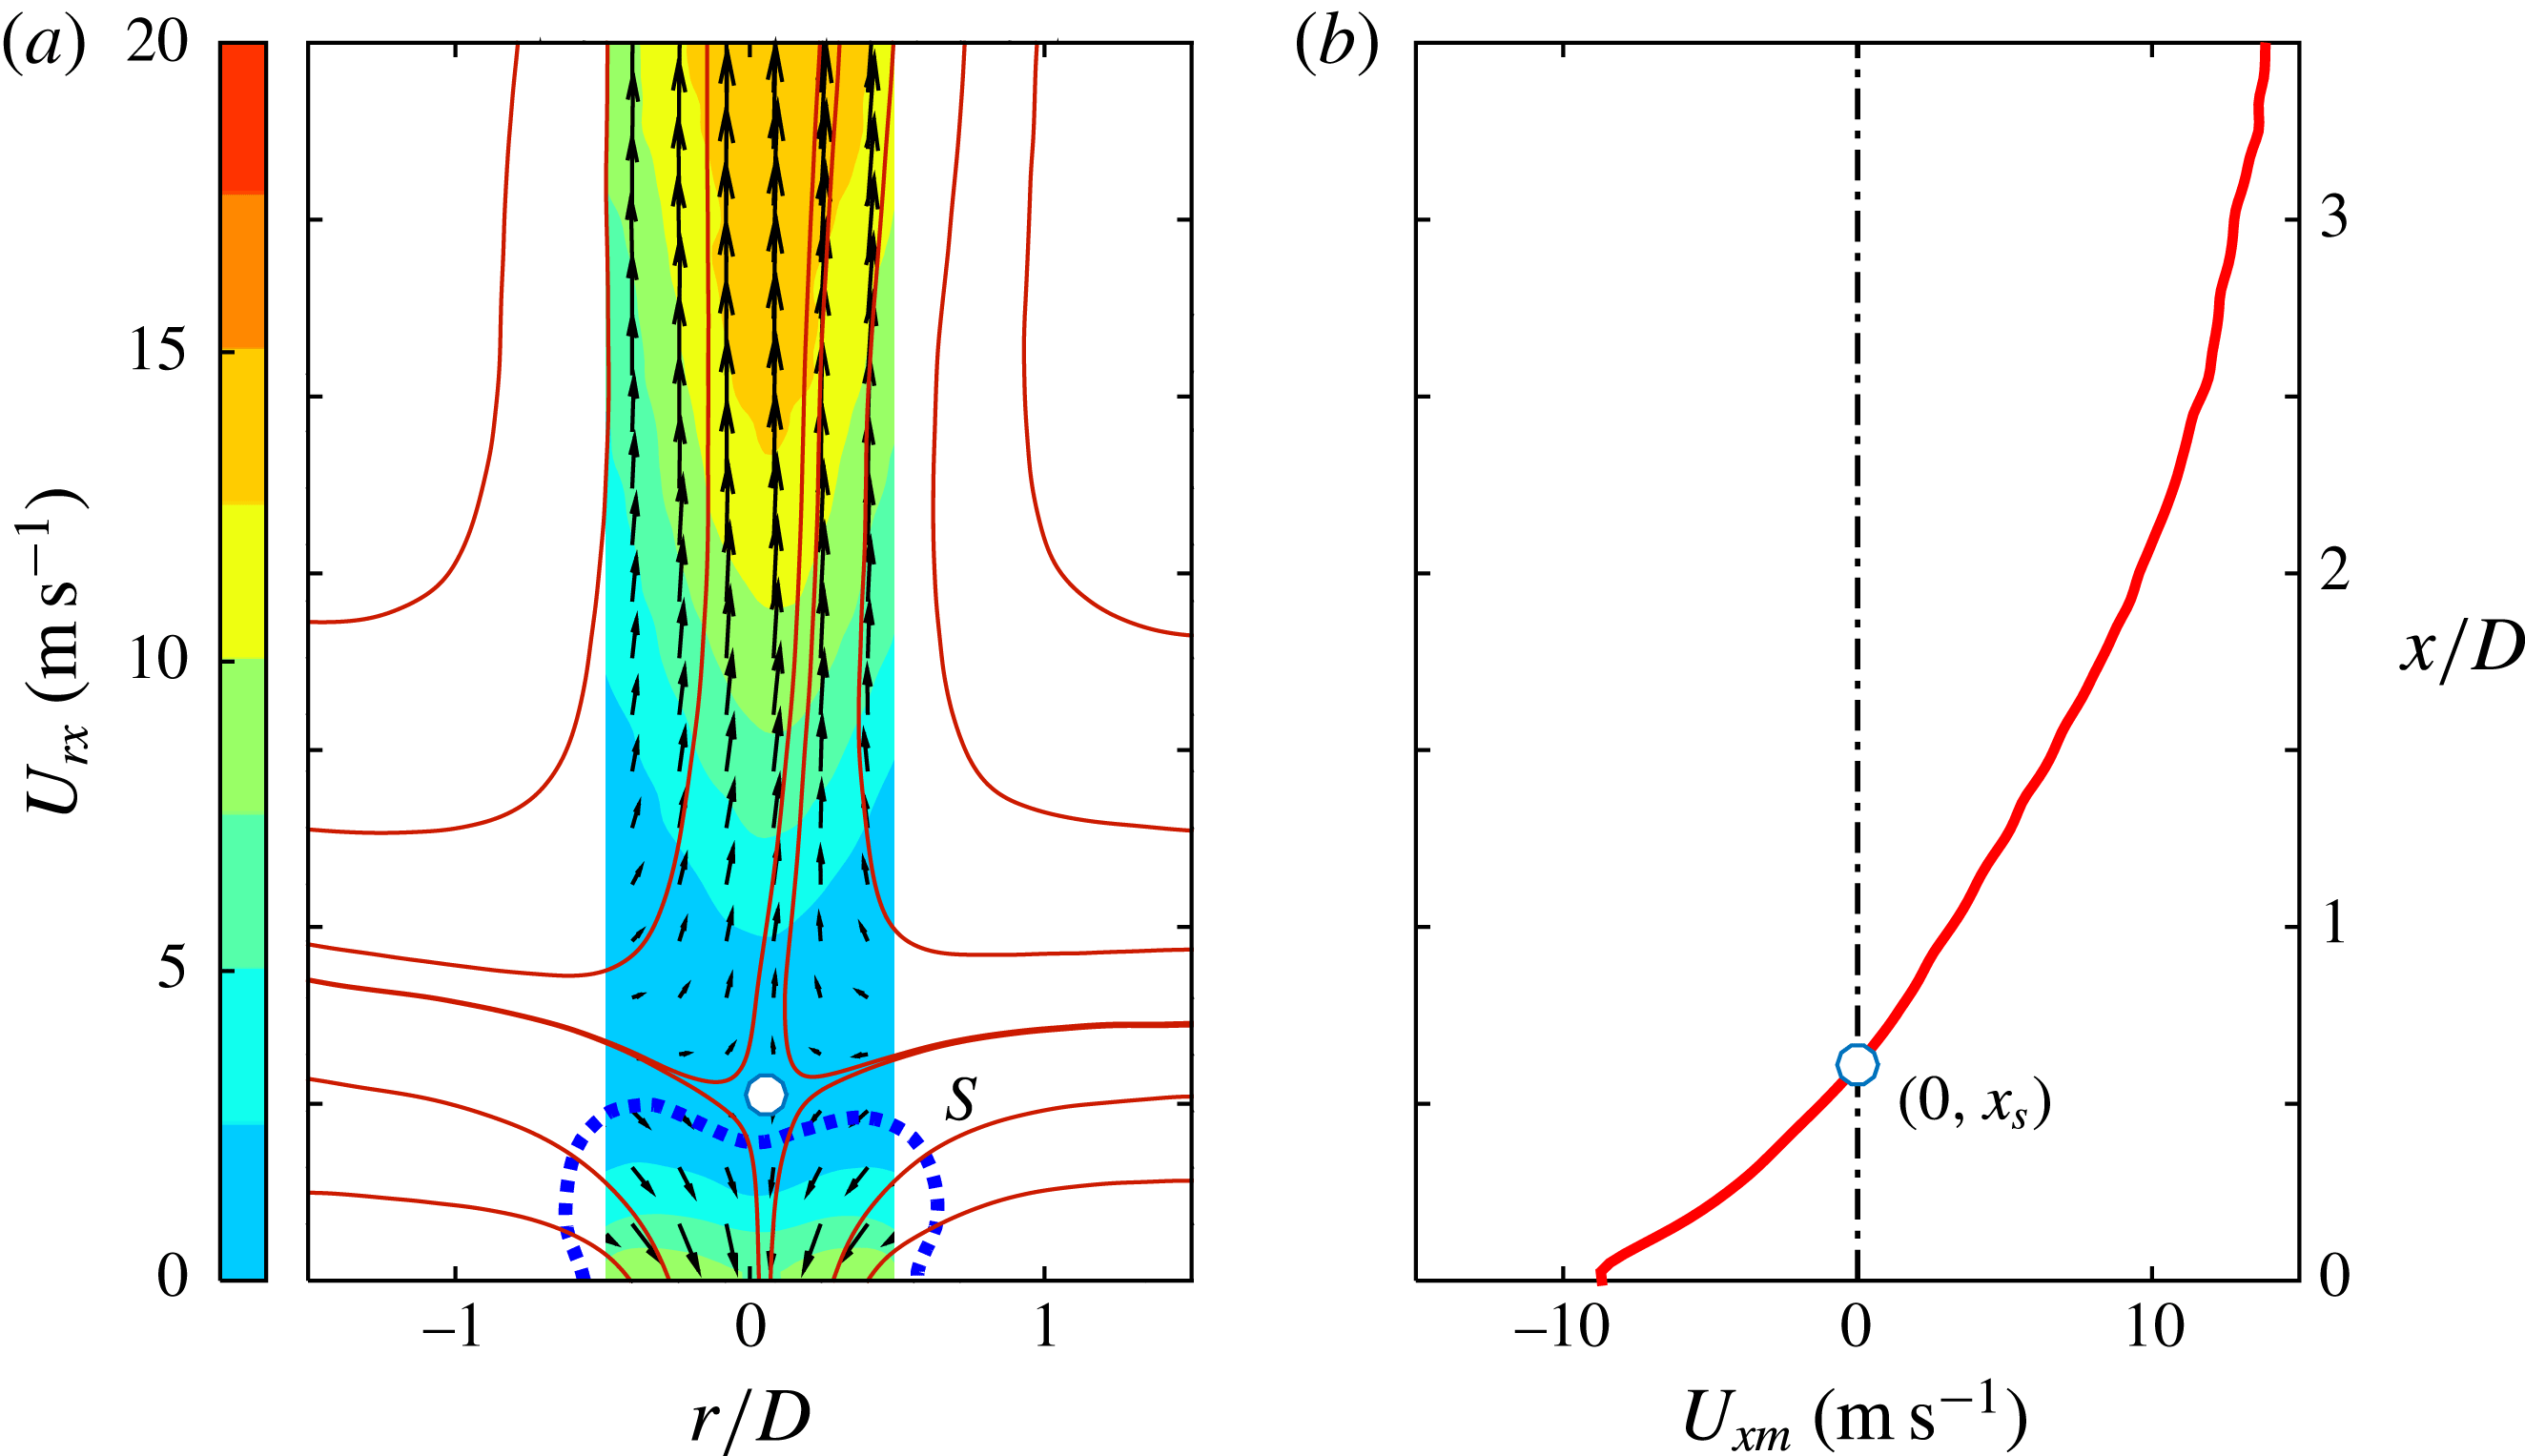
In the following discussion, the suction effect during the refresh stage is further analysed. The flow-field topology in the vicinity of the jet exit is shown in figure 13 for case 3. The data correspond to the phase-averaged PIV measurements at
 $t=700~\unicode[STIX]{x03BC}\text{s}$
. As a result of the concurrent jet expulsion from the completed jet stage and the ongoing suction from the refresh stage, a saddle point is observed at approximately
 $x/D=0.5$
, separating the suction flow from the residual jet flow. The
 $x$
-coordinate of this saddle point gives a first-order approximation of the axial range that is affected by the suction flow (defined as the suction affected length
 $x_{s}$
). To facilitate a more accurate computation of
 $x_{s}$
, the phase-averaged velocity field in the range
 $-0.5<x/D<0.5$
is extracted and the spatially averaged jet velocity along the radial (
 $r$
) direction (defined as
 $U_{xm}$
) is computed as shown in figure 13(b). The suction affected length can be approximated by the intersection of
 $U_{xm}$
with zero.
Extraction of the suction affected length. (a) The near-exit flow pattern at
 $t=700~\unicode[STIX]{x03BC}\text{s}$
for case 3. The contour levels and vectors are based on the phase-averaged velocity; the red lines denote streamlines; the dashed blue line denotes the contour line of 50 % of the peak suction velocity. (b) Axial variation of
 $U_{x}$
, spatially averaged along the
 $r$
direction in the range
 $-0.5<x/D<0.5$
(denoted as
 $U_{xm}$
). The white points indicate the saddle points.
The temporal evolution of
 $x_{s}$
for all tested cases.
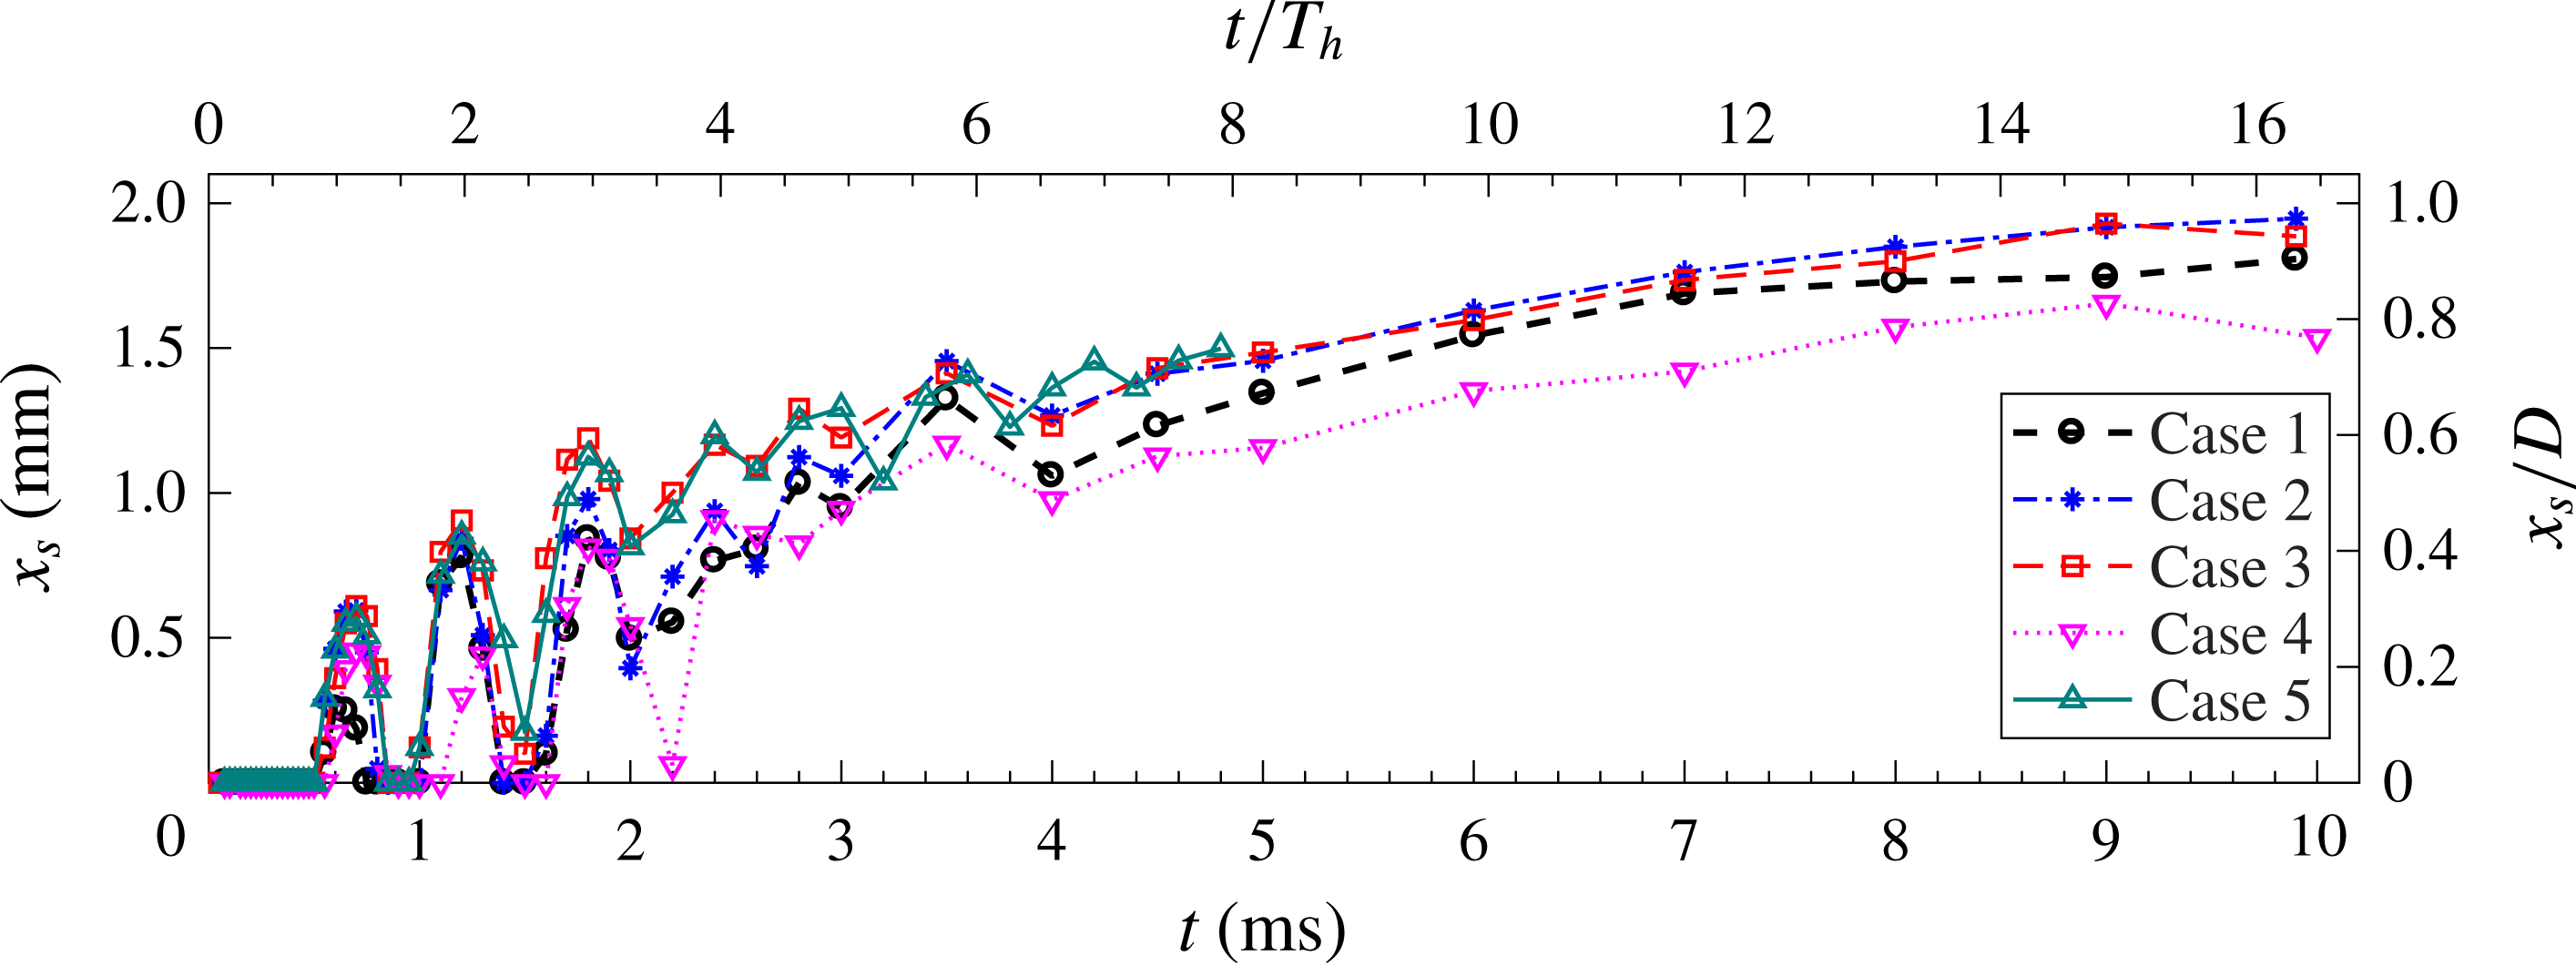
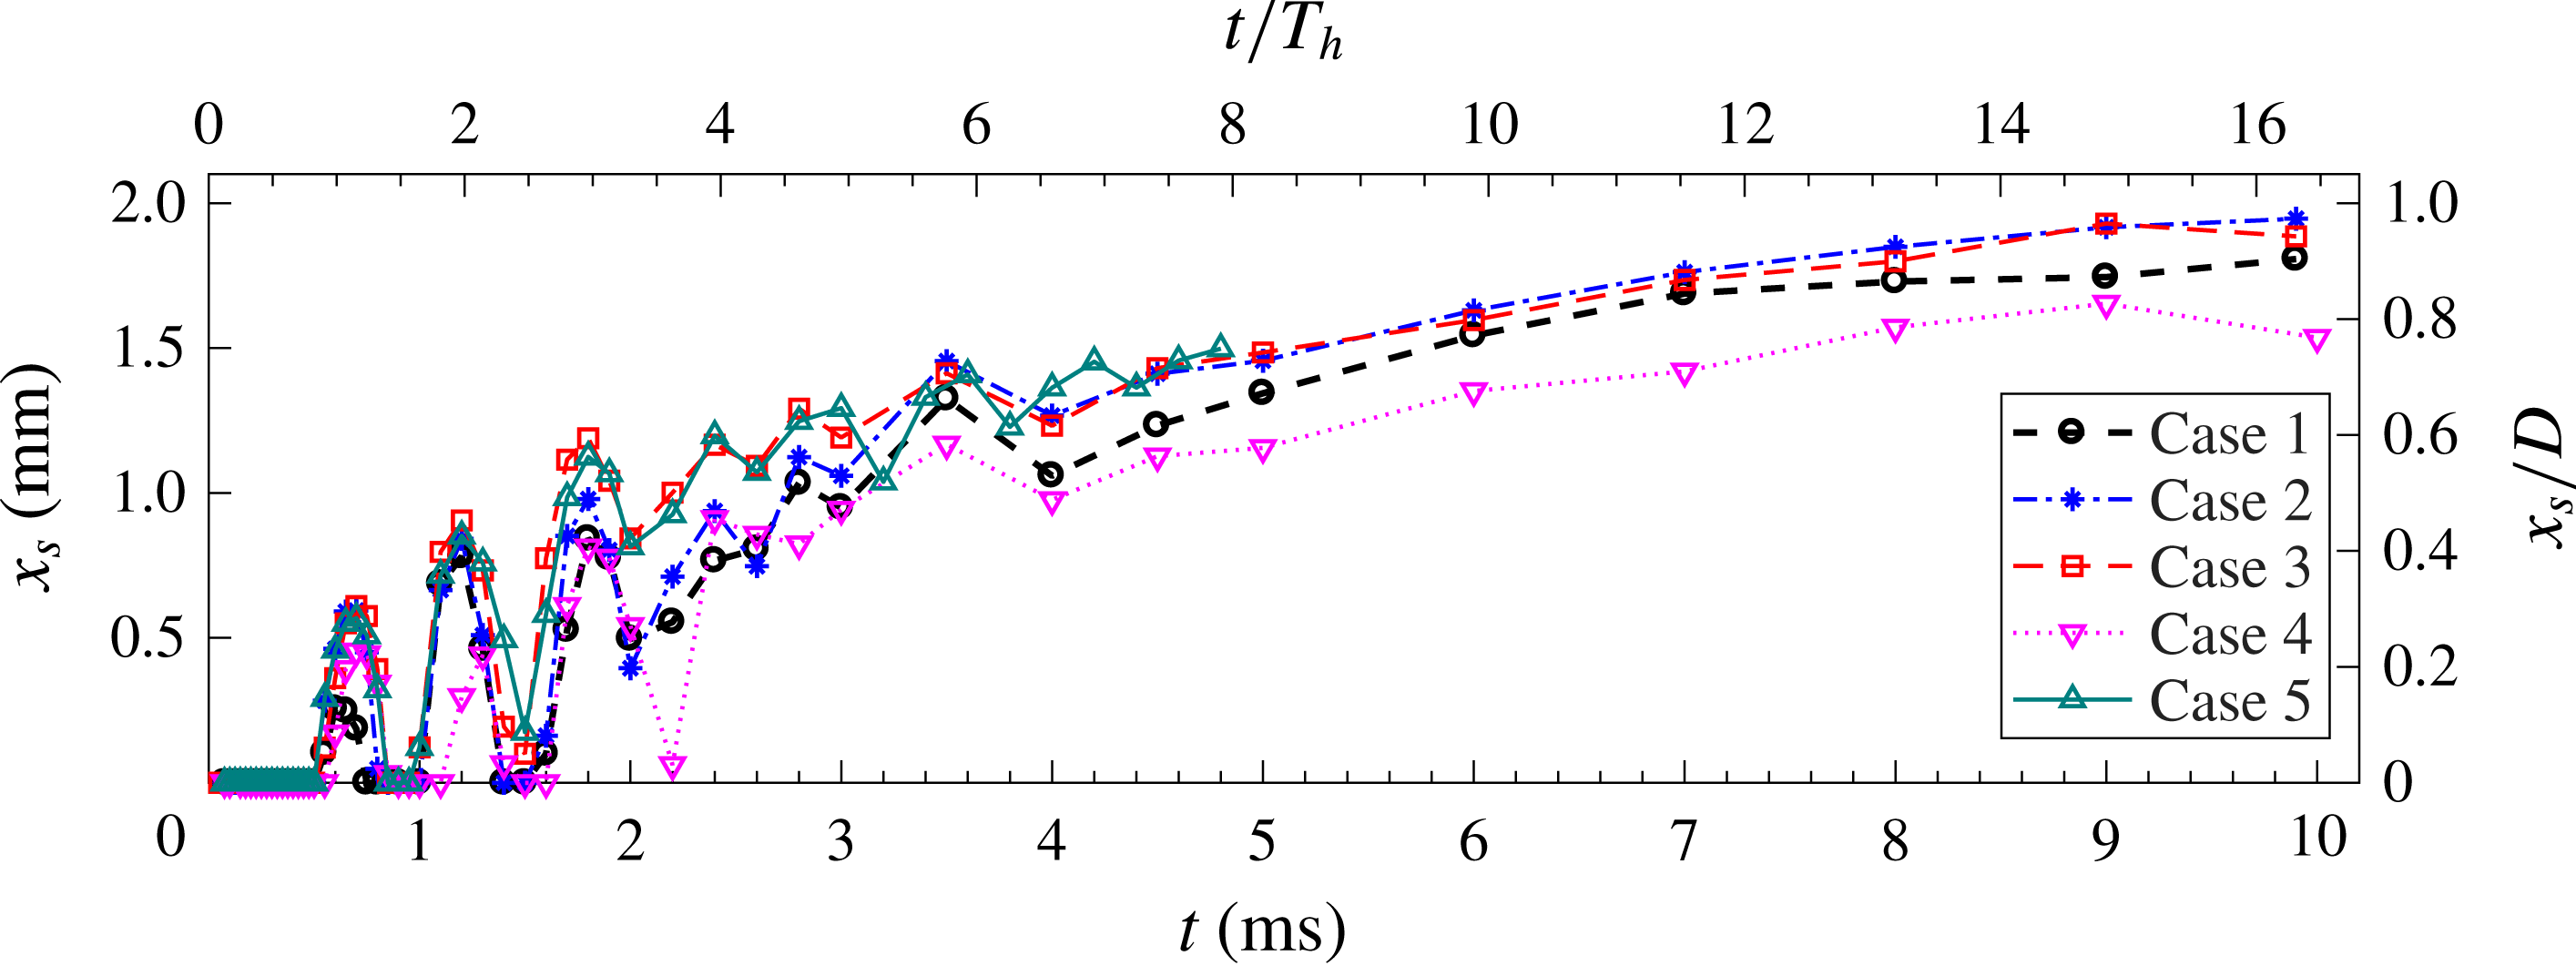
The temporal evolution of the suction affected length (
 $x_{s}$
) is shown in figure 14 for all of the tested cases. By definition, a zero value for
 $x_{s}$
corresponds to the jet stages. Between
 $t=0$
and
 $t=2~\text{ms}$
, the suction affected length experiences considerable oscillations as a consequence of the multiple alternations between the jet and refresh stages. The oscillation period is close to the Helmholtz oscillation period (
 $T_{h}$
). Notwithstanding the oscillation, the jet affected length for all of the tested cases increases slowly with time. Similarly to the time-averaged suction velocity, the jet affected length is positively proportional to both the energy deposition and the working frequency. For all of the tested cases, the peak value of
 $x_{s}$
lies between
 $0.8D$
and
 $1D$
, which is significantly smaller than that of piezoelectric synthetic jets (Glezer & Amitay Reference Glezer and Amitay2002). According to the vortex ring propagation distance shown in figure 6, the jet affected length is determined to be
 $20D$
, approximately 20 times the suction affected length. To summarize, the suction flow induced by a PSJA exhibits three unique features, namely a relatively low suction velocity
 $(O(10~\text{m}~\text{s}^{-1}))$
, a localized affected region (up to
 $x=1D$
) and a rather long duration (to compensate the low suction velocity to maintain mass flow conservation).
4.4 Front vortex ring
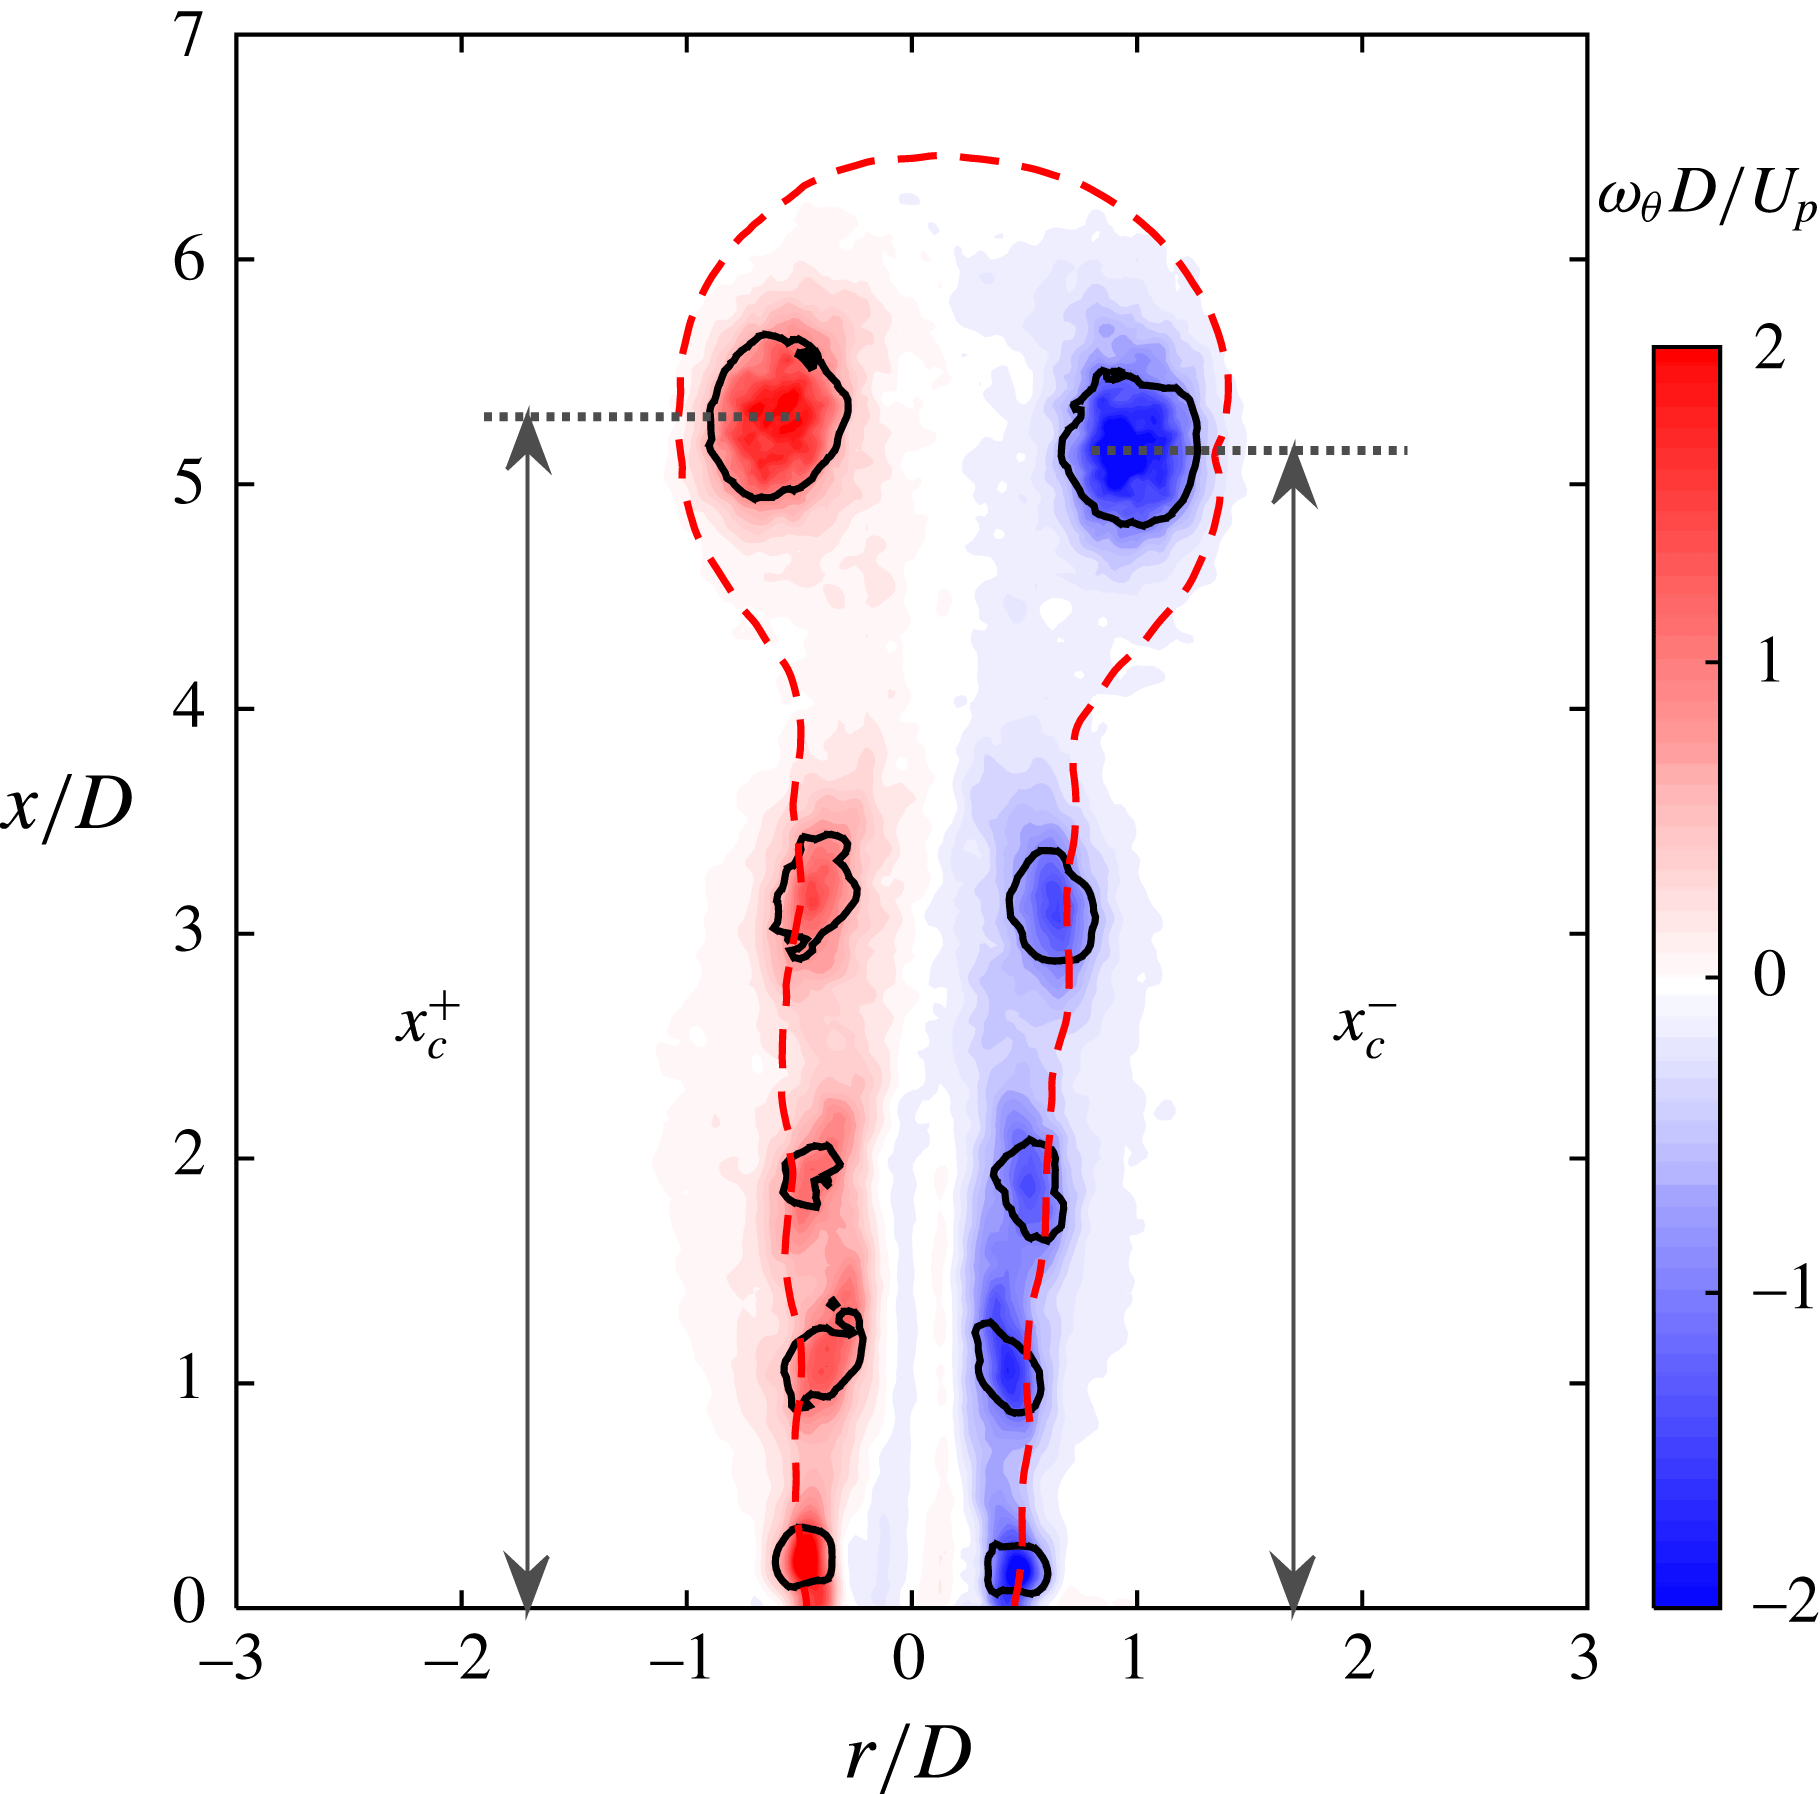
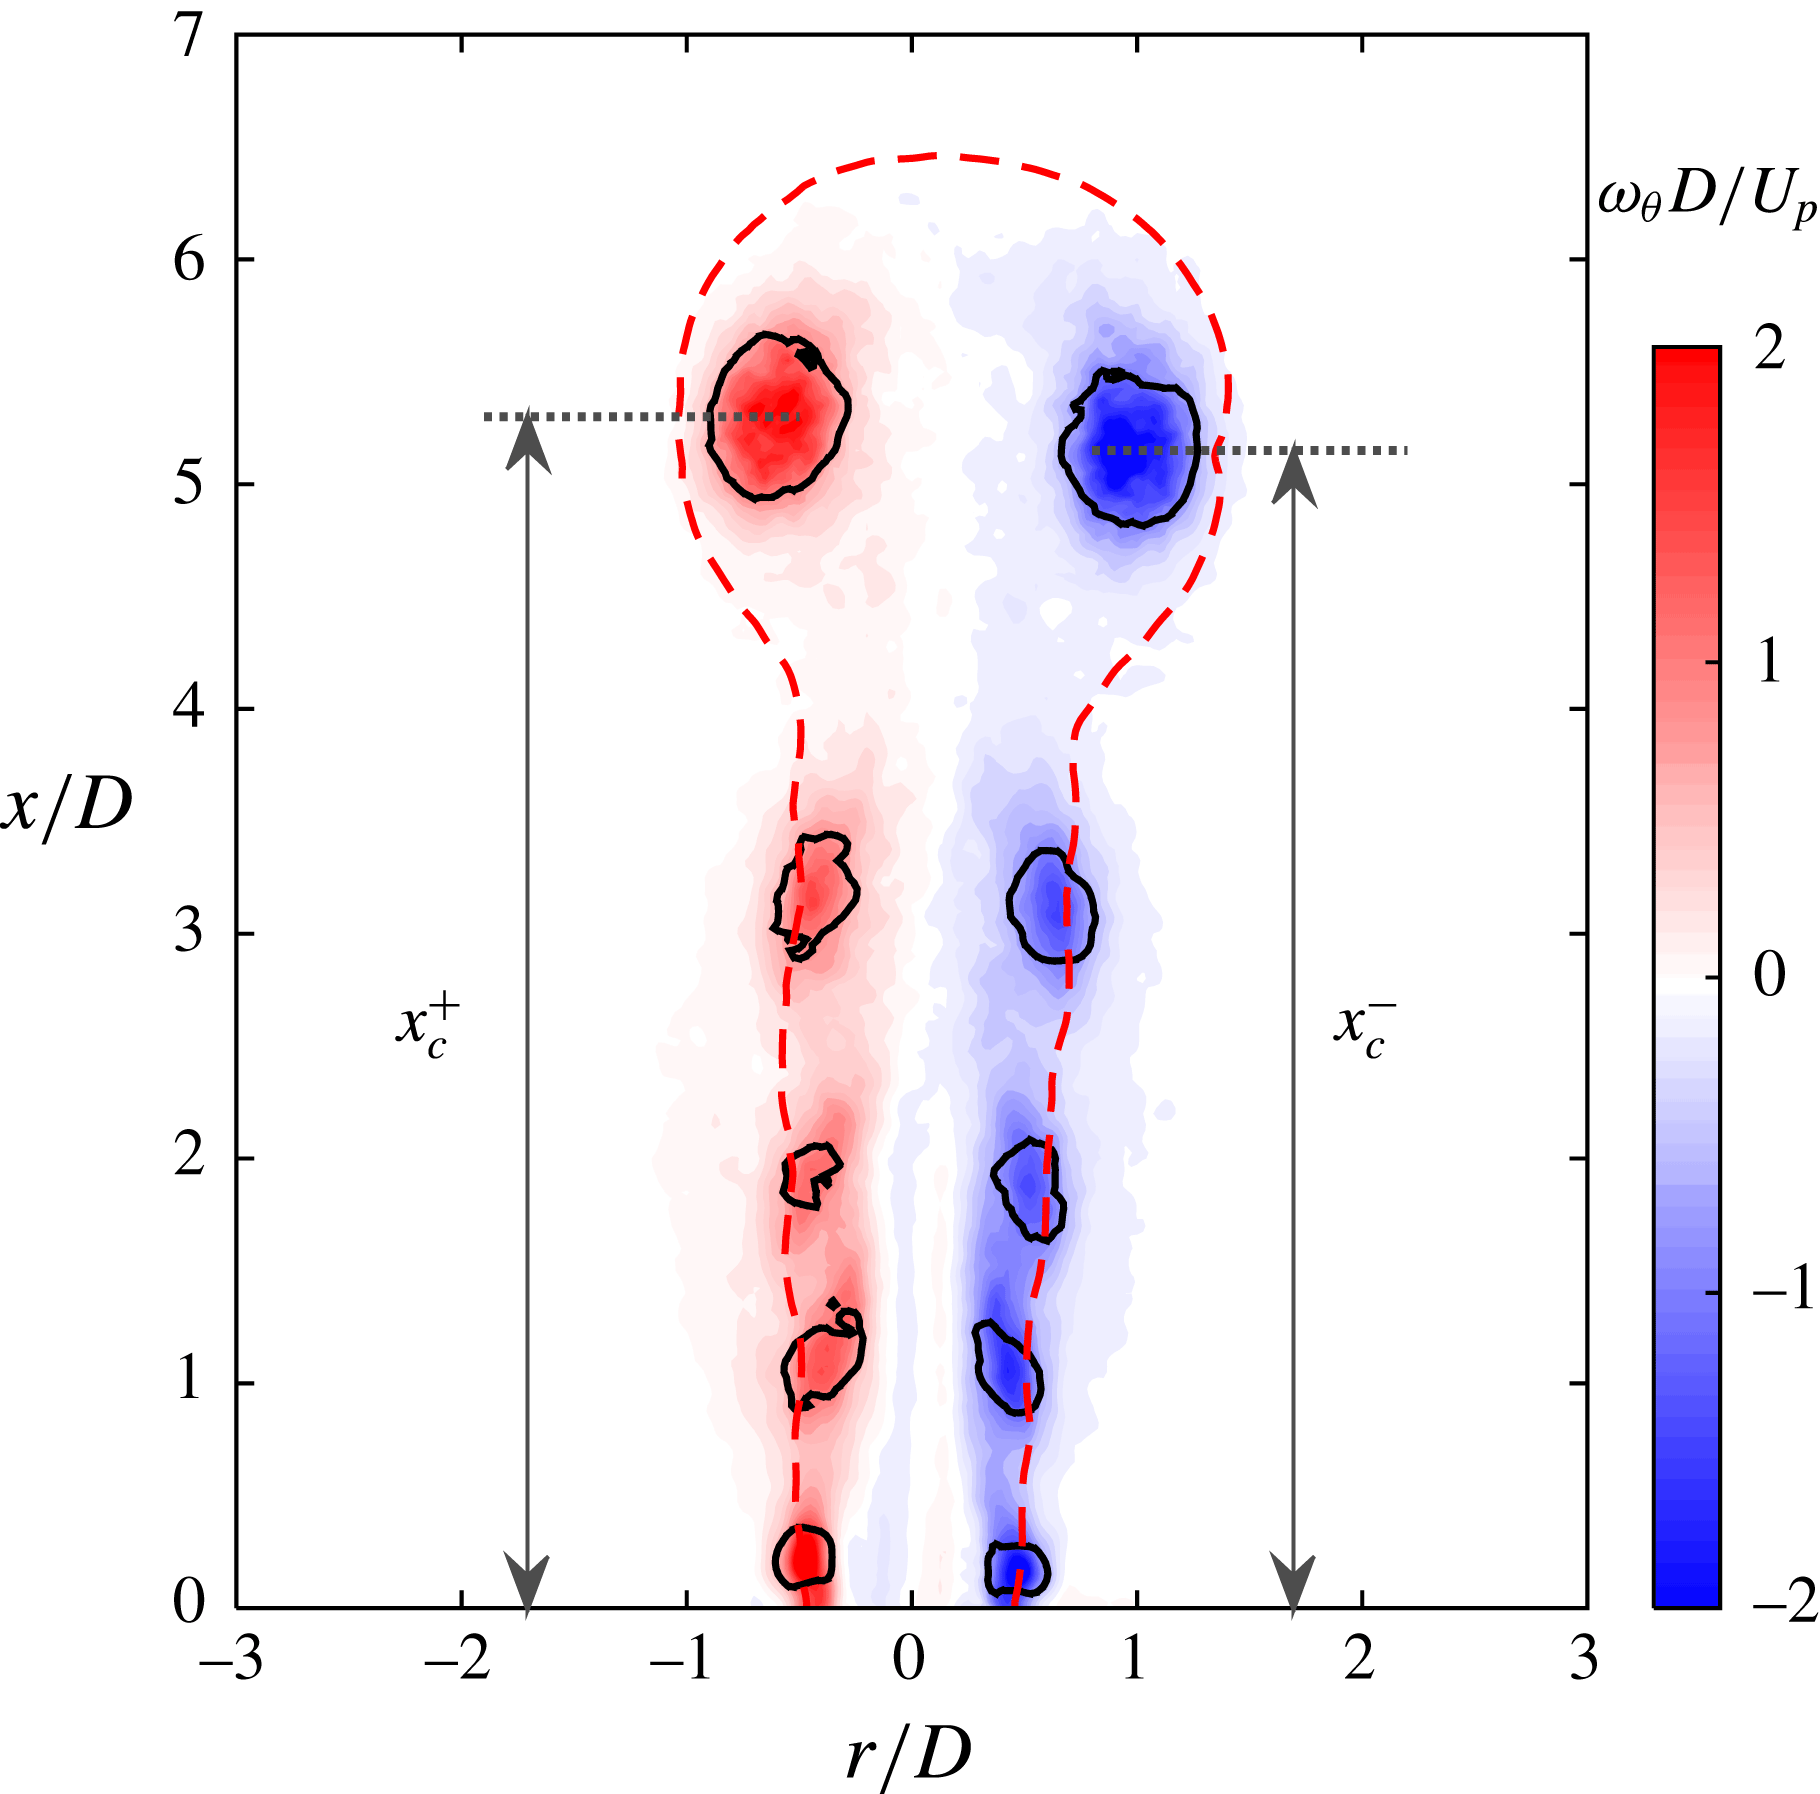
A representative vorticity field at
 $t=300~\unicode[STIX]{x03BC}\text{s}$
is shown in figure 15. As the velocity gradient in the jet shear layer scales with the ratio of the peak jet velocity (
 $U_{p}$
) to the orifice diameter (
 $D$
), the dimensionless vorticity can be defined as
 $\unicode[STIX]{x1D714}_{\unicode[STIX]{x1D703}}U_{p}/D$
, similar to the definition of Gharib, Rambod & Shariff (Reference Gharib, Rambod and Shariff1998) and Zong & Kotsonis (Reference Zong and Kotsonis2017b
). The profile of the jet body is indicated by the red dashed line. The
 $Q$
-criterion is used to detect the vortices, using a threshold value of 5 % of the maximum
 $Q$
-value. The propagation distance (
 $x_{c}$
), diameter (
 $D_{v}$
) and circulation (
 $\unicode[STIX]{x1D6E4}$
) of the FVR are computed, following the procedure proposed by Zong & Kotsonis (Reference Zong and Kotsonis2016a
). Here,
 $x_{c}$
is given by the mean
 $x$
-coordinate of the FVR, namely
 $(x_{c}^{+}+x_{c}^{-})/2$
.
Representative vorticity field at
 $t=300~\unicode[STIX]{x03BC}\text{s}$
for case 3. The solid black lines indicate the vortices detected by the
 $Q$
-criterion, using a threshold value of 5 % of the maximum
 $Q$
-value; the red dashed line is the constant velocity contour line of
 $U_{rx}=20~\text{m}~\text{s}^{-1}$
; the
 $x$
-coordinates of the two centres of the positive and negative vortices are denoted as
 $x_{c}^{+}$
and
 $x_{c}^{-}$
respectively.
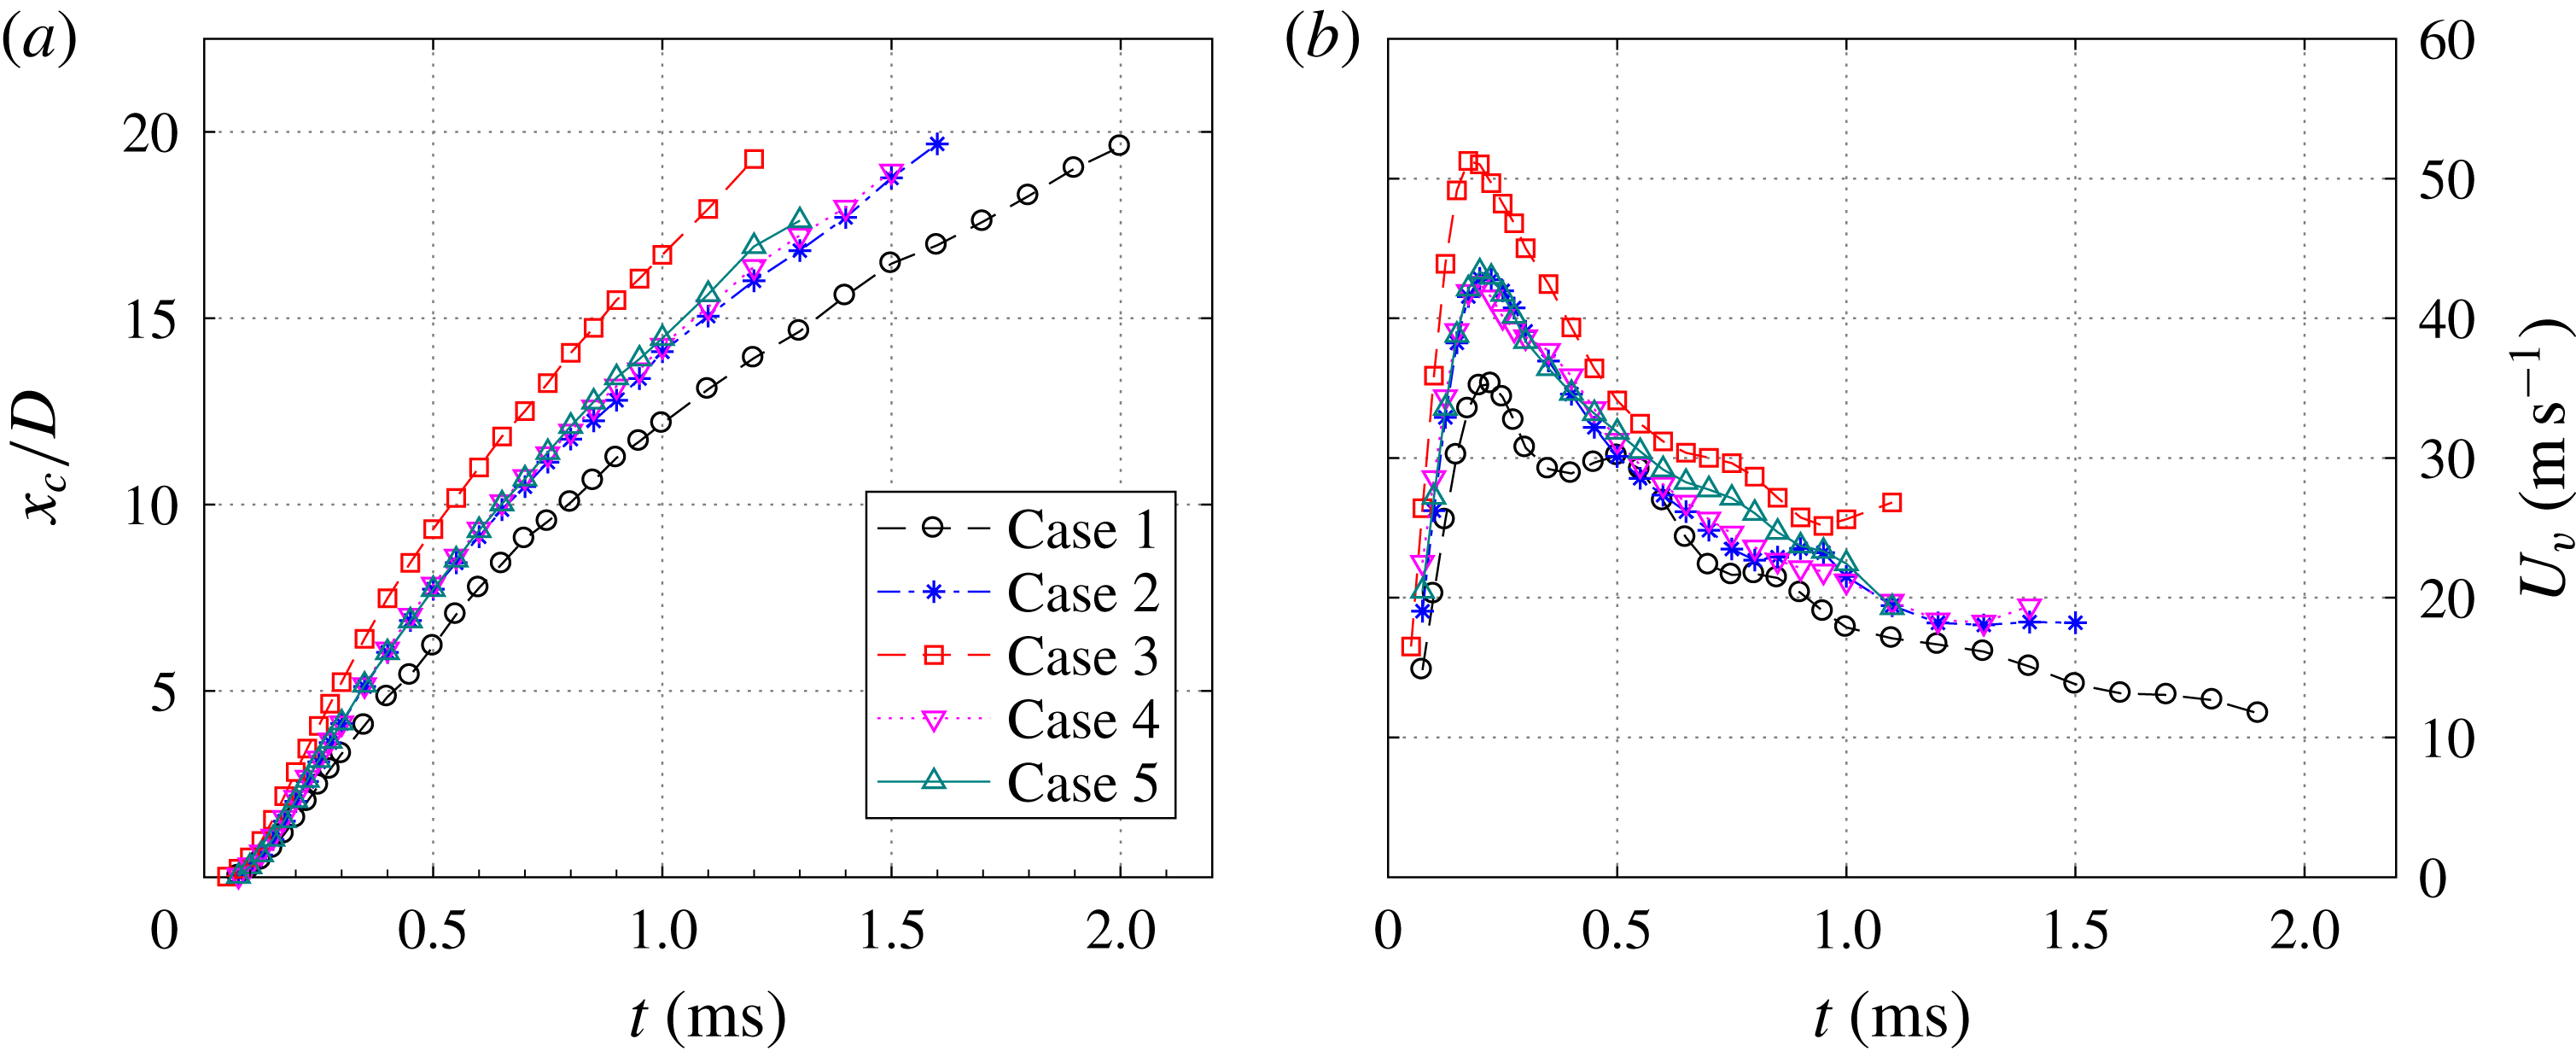
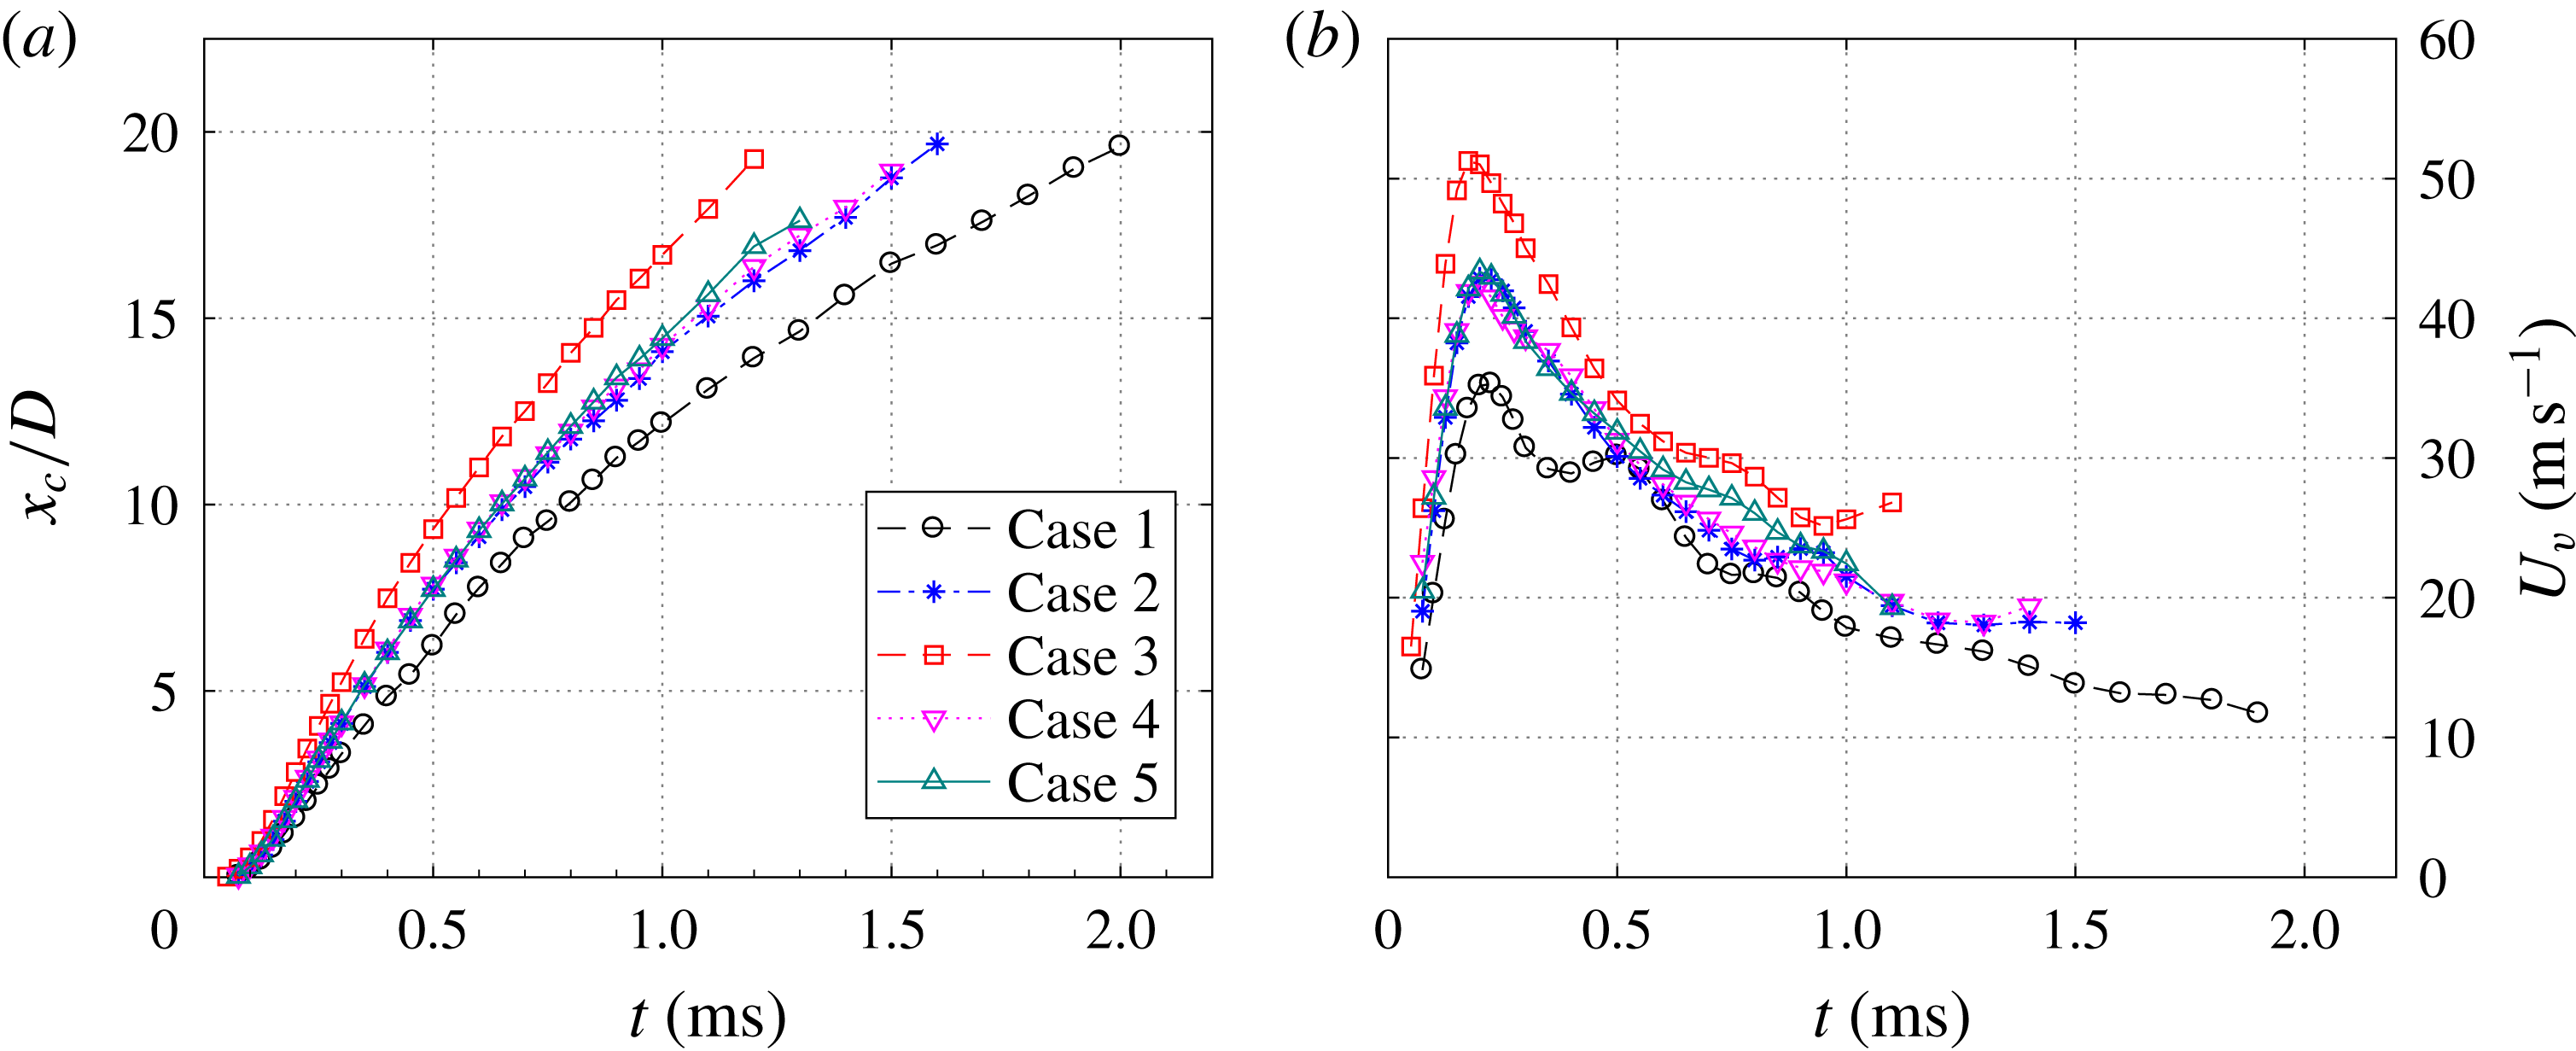
The temporal evolution of
 $x_{c}$
within one cycle is shown in figure 16(a) for the tested cases. It is interesting to note that the trajectories of
 $x_{c}$
are effectively independent of the actuation frequency. In contrast, the FVR lifts considerably faster with increasing energy deposition. The first-order temporal derivative of
 $x_{c}$
gives the propagation velocity of the FVR (
 $U_{v}$
), as shown in figure 16(b). The propagation velocity
 $U_{v}$
increases sharply during the primary jet stage, while it decreases mildly during later stages. The peak FVR propagation velocity is reached at approximately
 $t=200~\unicode[STIX]{x03BC}\text{s}$
, increasing from
 $35~\text{m}~\text{s}^{-1}$
to
 $51~\text{m}~\text{s}^{-1}$
with the energy deposition (cases 1–3) and remaining unchanged with the actuation frequency. The increase of
 $U_{v}$
is related to the accelerated expulsion of cavity gas (see figure 7), which continuously injects high-momentum flow into the vortex ring centre. The decay of
 $U_{v}$
is ascribed to the decrease of momentum input, as well as the entrainment of low-energy fluids by the FVR itself. The dependence of
 $U_{v}$
on
 $\unicode[STIX]{x1D700}$
and
 $f_{d}$
bears significant similarity to that of the peak jet velocity (figure 7), motivating the utilization of
 $U_{p}$
to normalize
 $U_{v}$
.
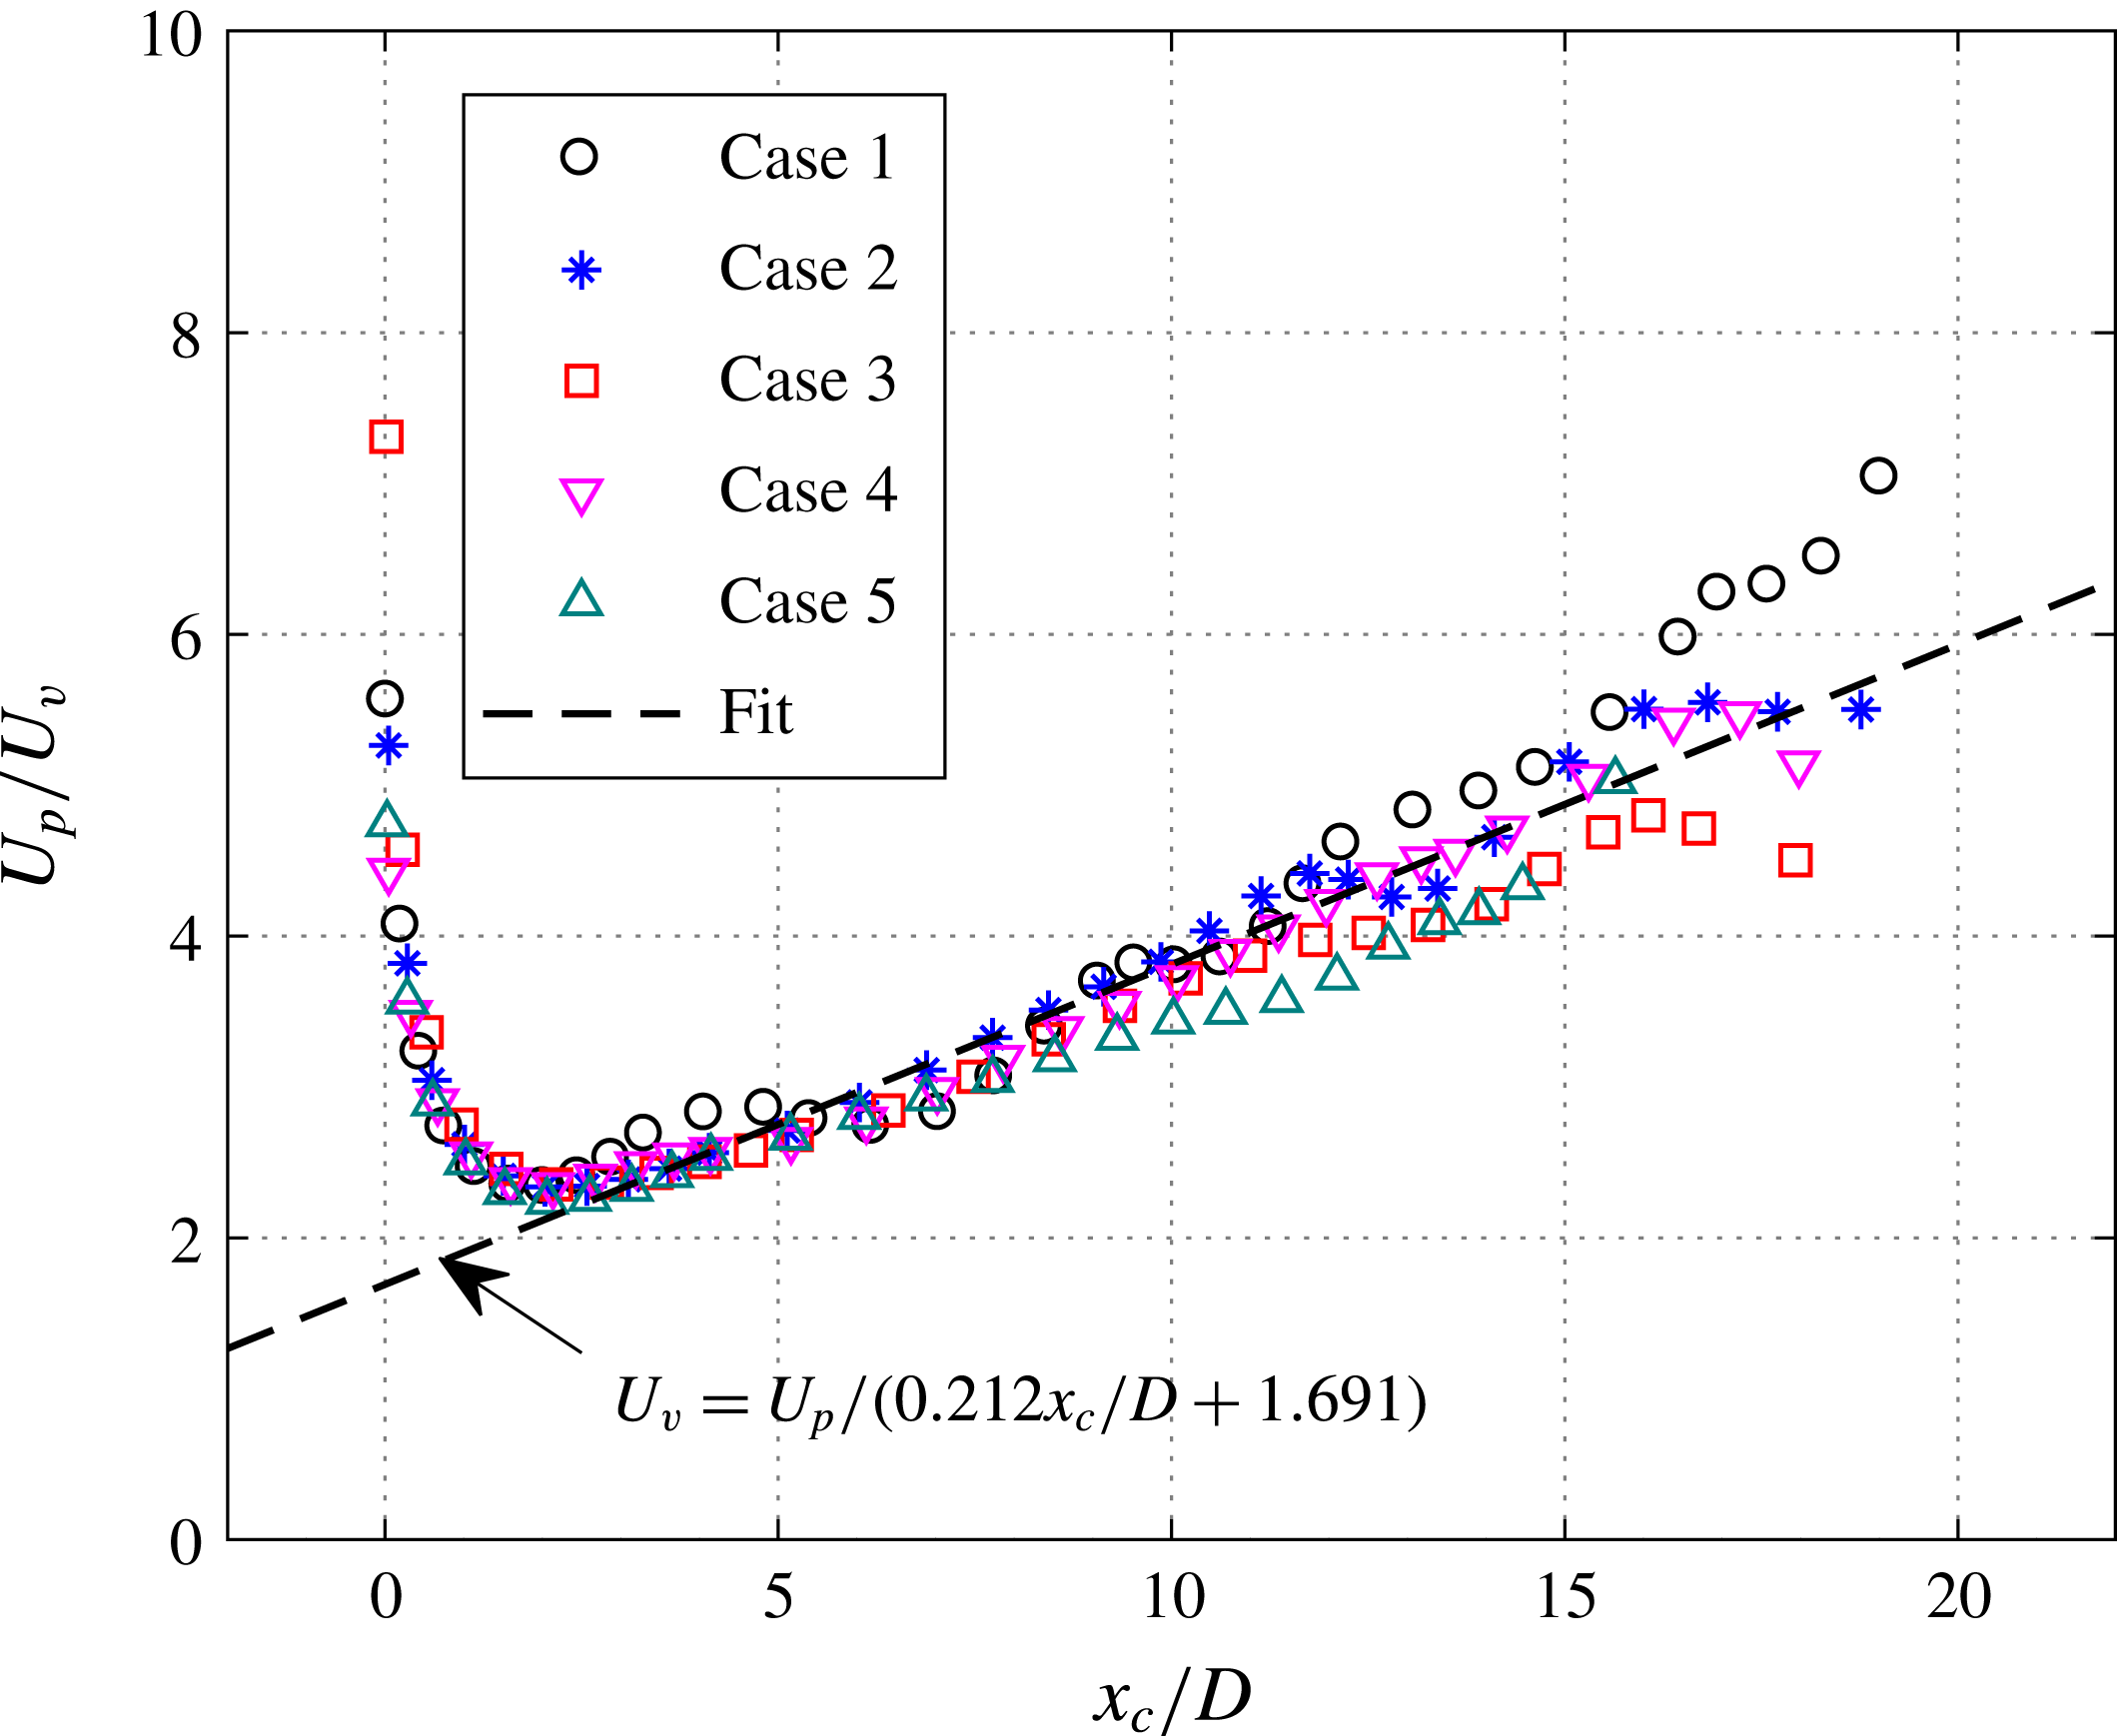
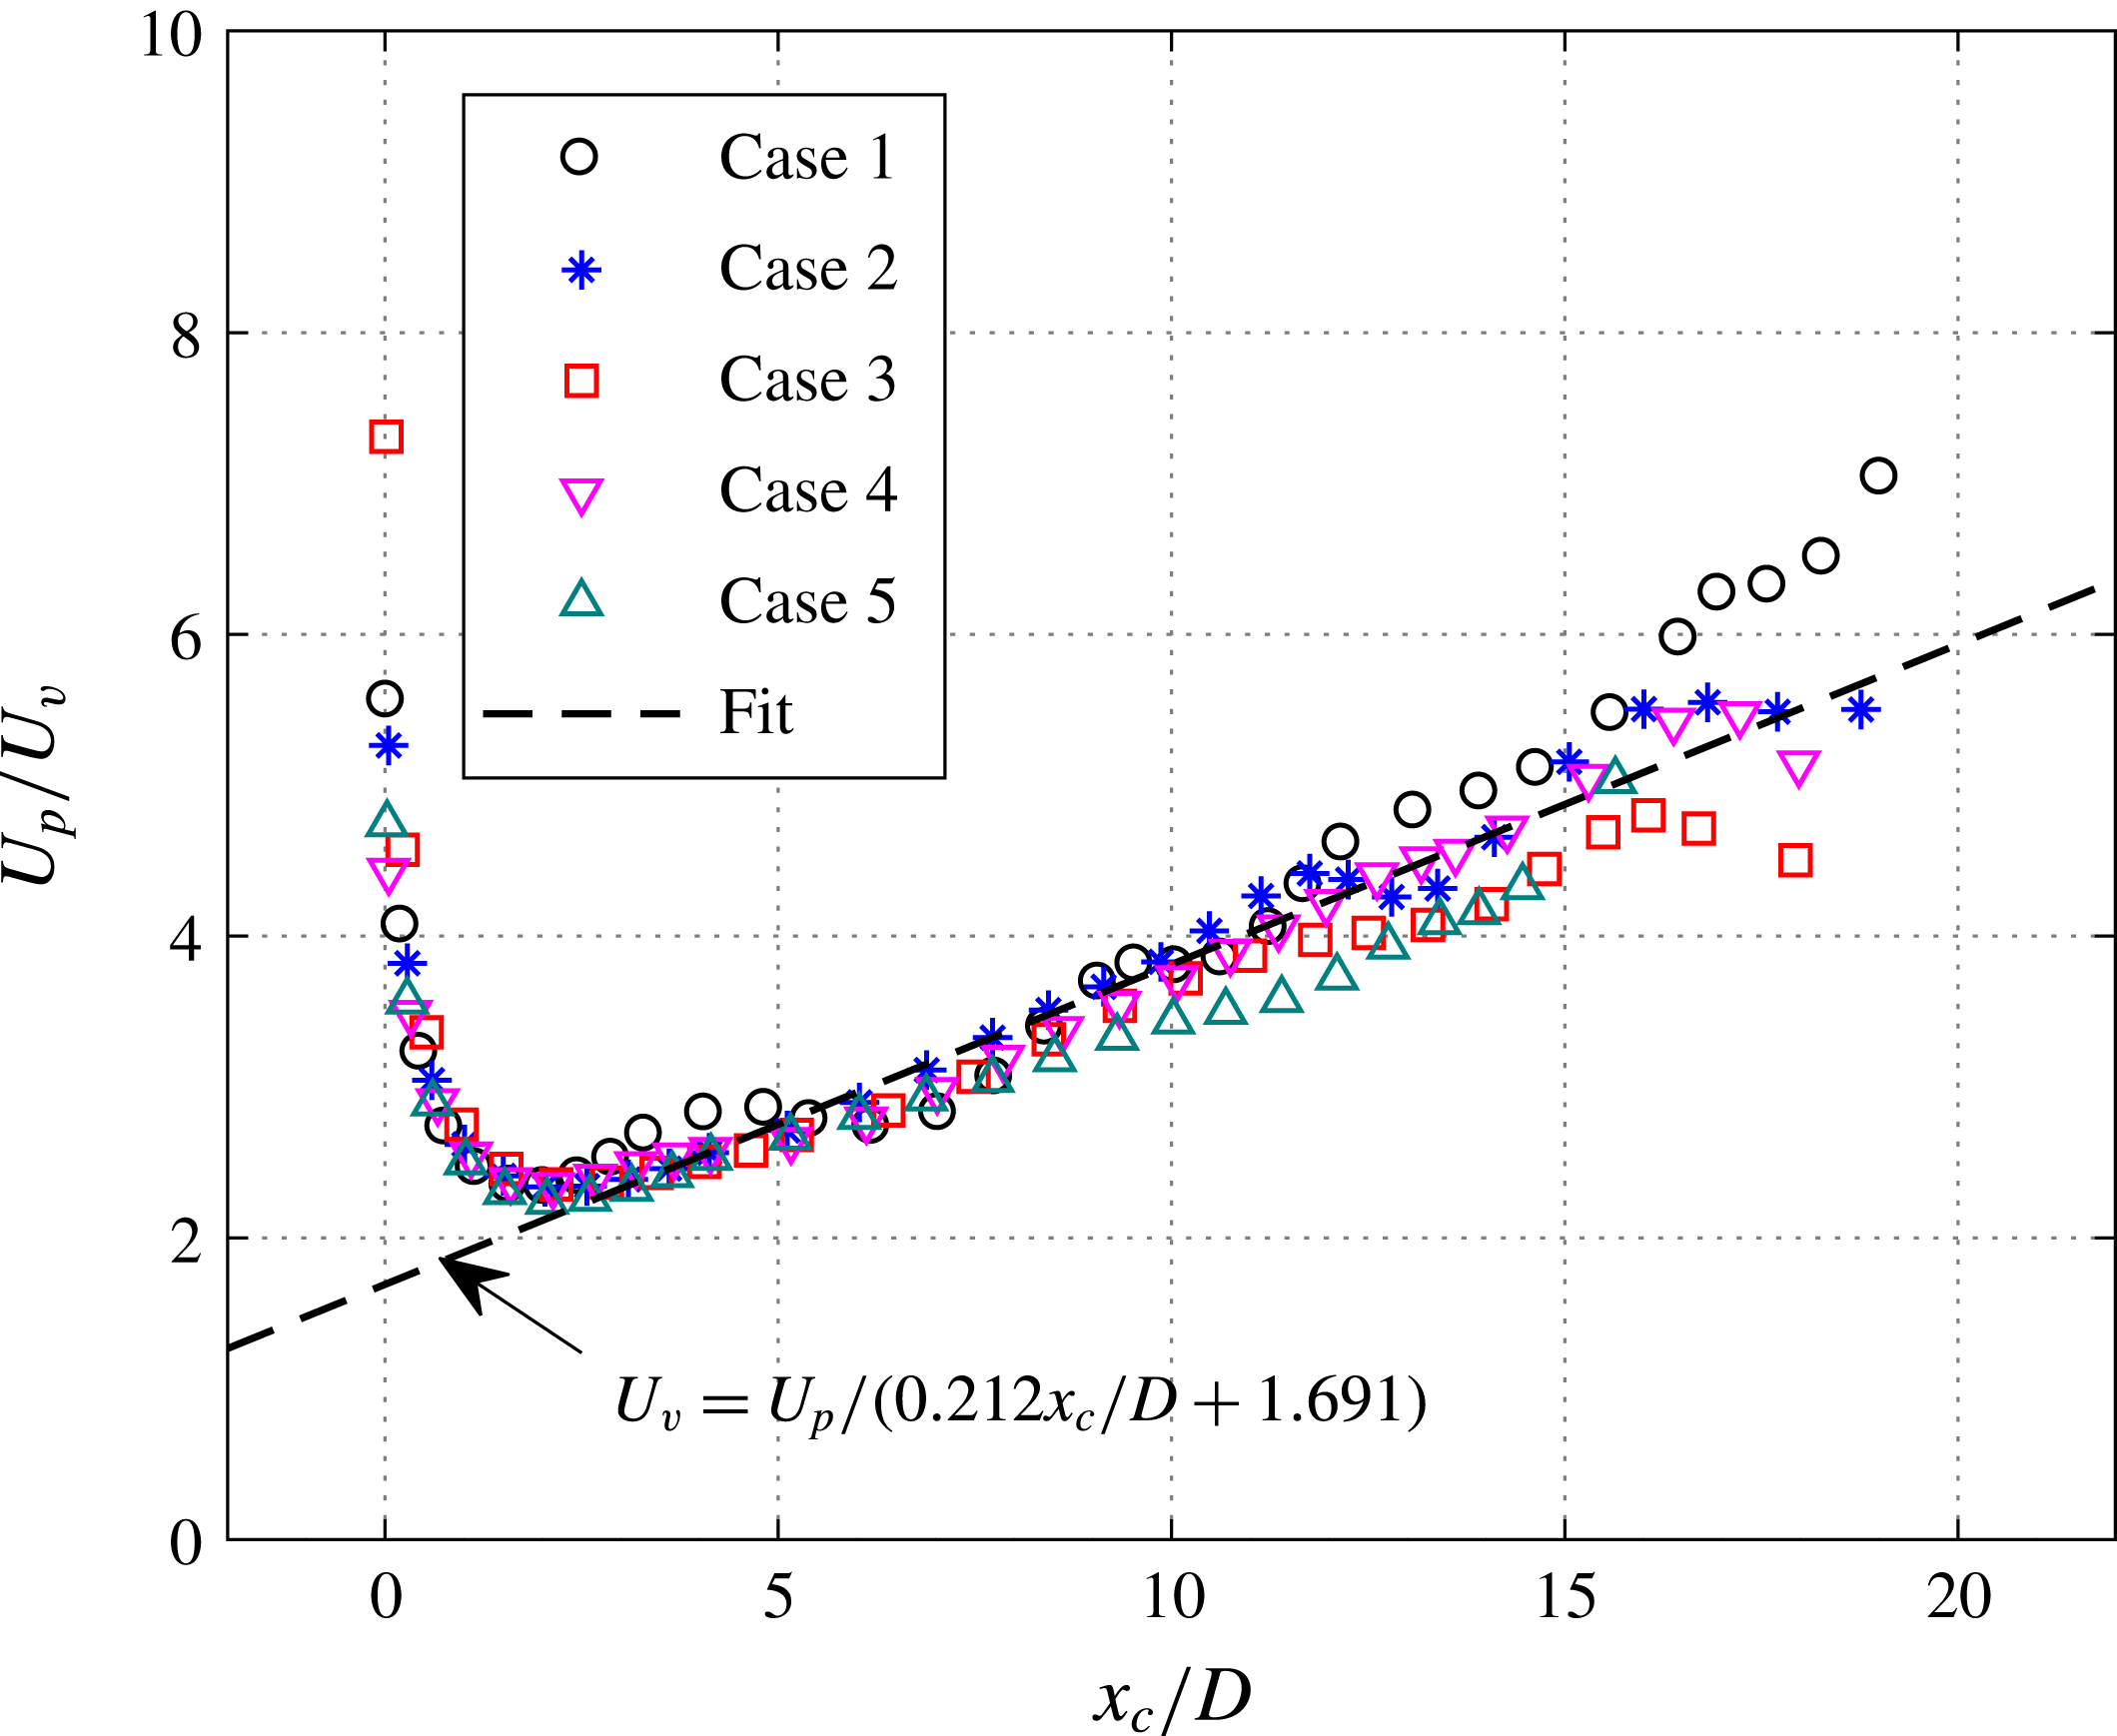
The ratio of the peak jet velocity to the FVR velocity
 $(U_{p}/U_{v})$
is plotted against
 $x_{c}$
in figure 17 for all cases. As a result, all of the data points collapse onto the same curve. Two distinct regimes can be identified. In the vicinity of the exit (
 $x_{c}/D<2$
), the curve drops rapidly. However, once the FVR propagates further, the ratio is approximately linear. A linear regression model is used to fit the data after
 $x_{c}/D>2$
, resulting in a mean relative error of less than 6 %. The minimum value of
 $U_{p}/U_{v}$
reached at
 $x_{c}/D=2$
is approximately 2.3. At this location, the peak propagation velocity of the FVR is roughly half of the peak jet velocity.
(a) Propagation distance and (b) propagation velocity of the FVR.
Normalized FVR propagation velocity with propagation distance.
Zong & Kotsonis (Reference Zong and Kotsonis2016a
) observed the high-velocity region in the vortex ring centre and further demonstrated that the acceleration of the jet exit velocity acts like an impulse, promoting the formation of vortex rings. As such, the peak velocity in the vortex ring centre (denoted as
 $U_{cen}$
; it should be noted that this is different from the propagation velocity) should be close to the peak jet velocity (
 $U_{p}$
). Assuming that a constant spatial velocity gradient (uniform vorticity) is exhibited in the vortex core region,
 $U_{v}$
should lie in between the vortex ring centre velocity (
 $U_{cen}$
) and the outer periphery velocity (
 $U_{out}$
). Since
 $U_{out}$
is a negligible negative value for incipient jets, as shown in figure 5(b),
 $U_{v}\approx U_{p}/2$
. This relation was also confirmed by Zong & Kotsonis (Reference Zong and Kotsonis2017a
) and can assist schlieren analysis to some extent. Specifically, the jet velocity obtained from schlieren imaging is typically based on the motion track of either the warm jet plume or the front vortex ring (Wang et al.
Reference Wang, Xia, Luo and Chen2014; Zong & Kotsonis Reference Zong and Kotsonis2016a
). This method severely underestimates the actual peak jet velocity by a factor of up to 2, further confirming the above identified behaviour.
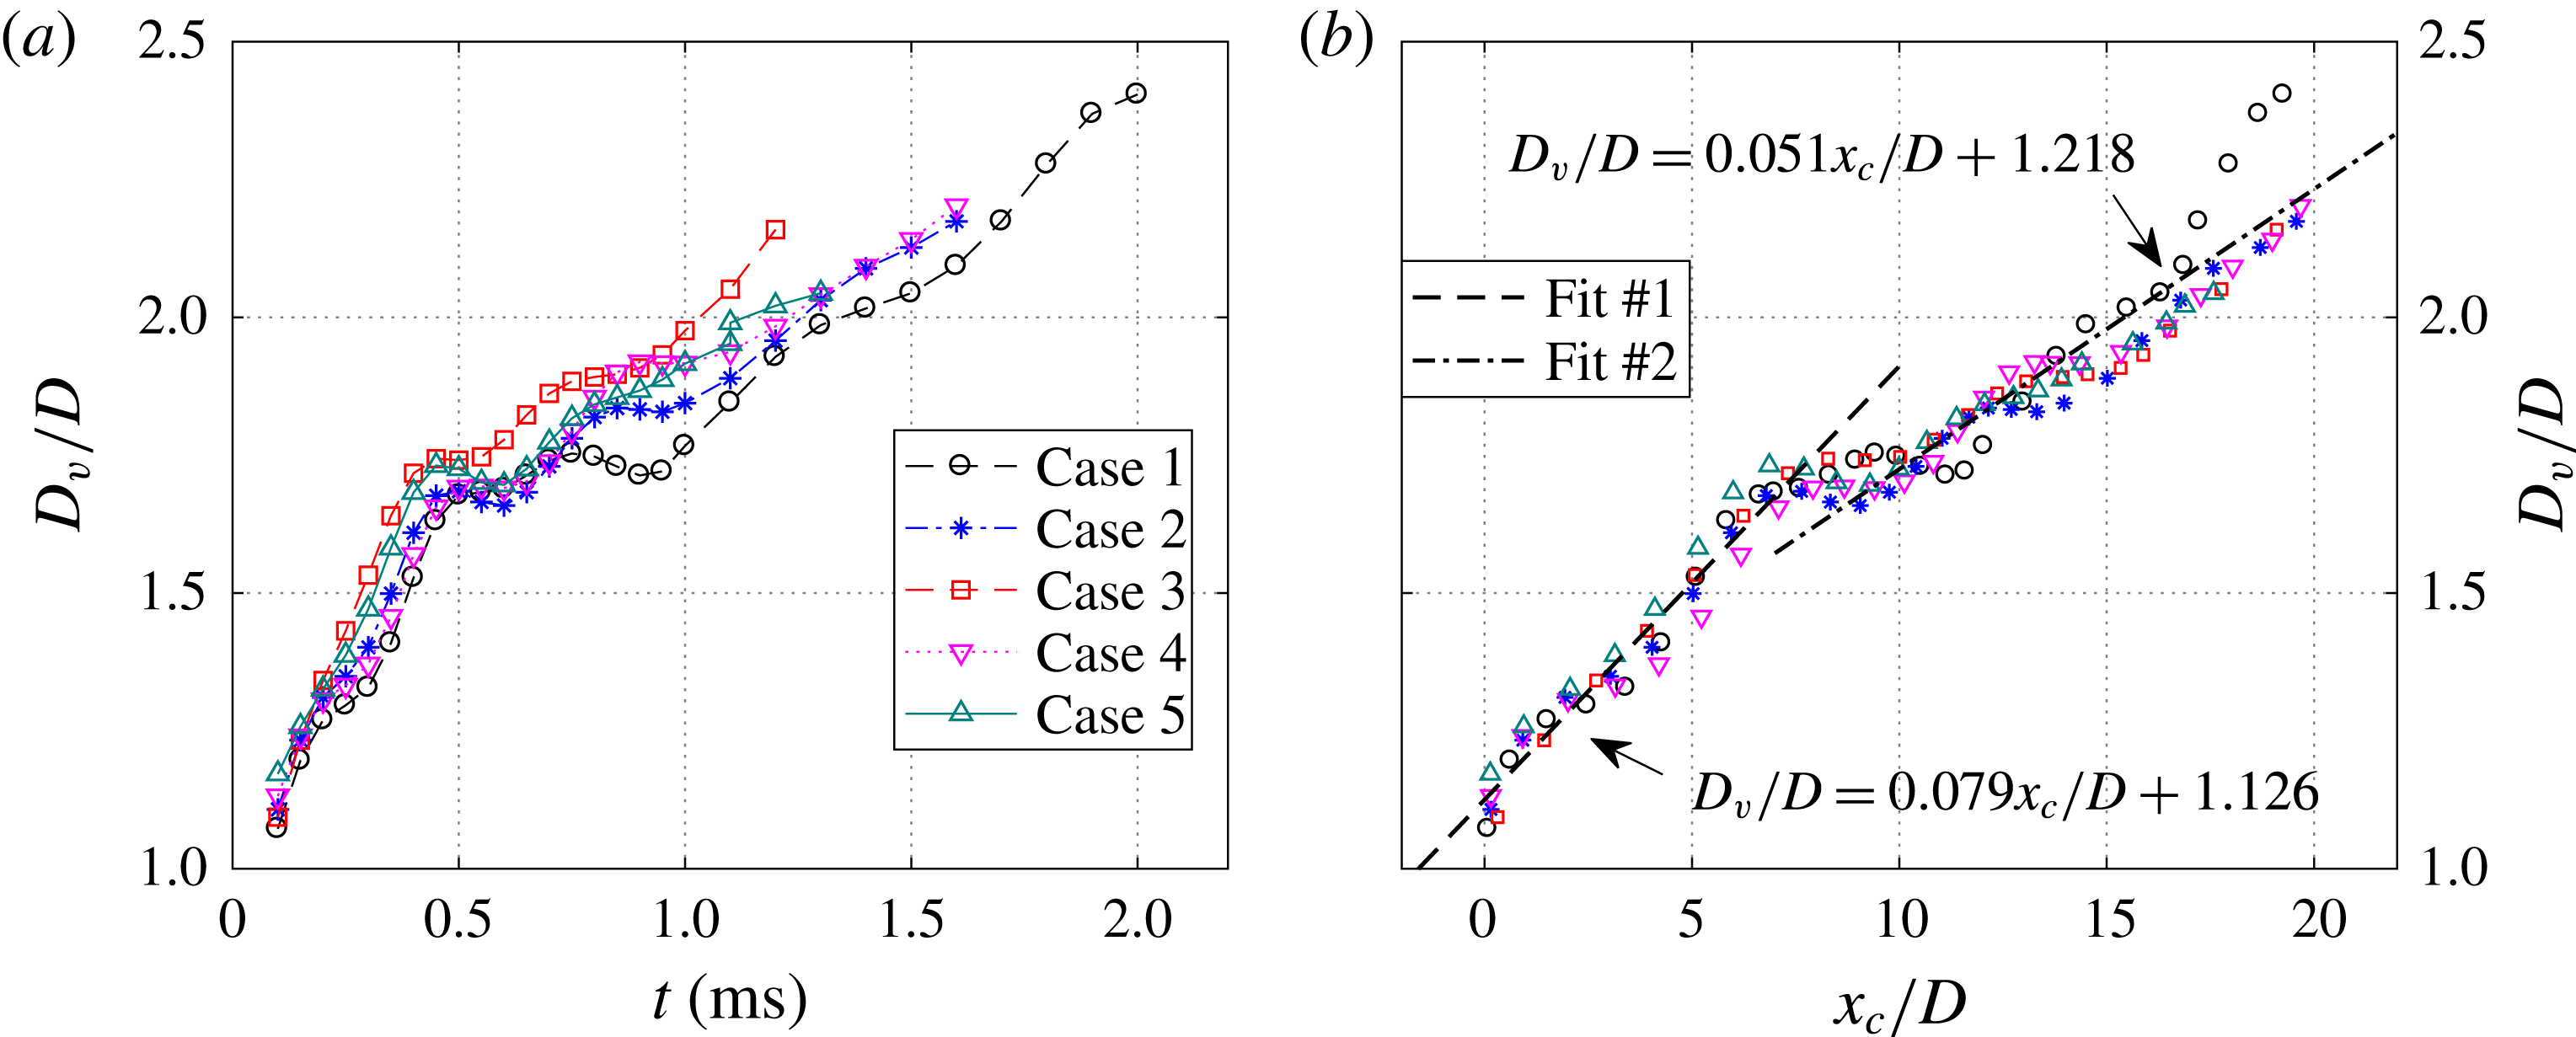
The spacing between the two vortex centres along the radial direction shown in figure 15 defines the vortex ring diameter (
 $D_{v}$
). The time evolution of
 $D_{v}/D$
is shown in figure 18(a). Apart from several small-scale oscillations, the vortex ring diameter increases steadily during propagation within one cycle. For each curve, a kink point can be observed between
 $t=0.4~\text{ms}$
and
 $t=0.5~\text{ms}$
, where the rising rate of
 $D_{v}$
(namely the slope) declines considerably. This variation can be ascribed to the different entrainment rate of the FVR. Specifically, the high-speed jet body beneath the FVR acts as an ‘injector’. When the jet velocity is higher than
 $U_{v}$
, the high-momentum fluid can be fed into the FVR rapidly, leading to a fast expansion of the vortex ring diameter. However, once the jet velocity drops below
 $U_{v}$
, no external momentum input will be experienced by the FVR. As a result of this reduced entrainment rate, the expansion rate of the FVR is reduced. The time evolution of
 $D_{v}$
shown here differs considerably from that in traditional synthetic jets, where the initial increase is followed by a slow decrease (Shuster & Smith Reference Shuster and Smith2007). Intercase comparison indicates that the rising rate of
 $D_{v}$
increases with
 $\unicode[STIX]{x1D700}$
whereas it remains largely unchanged with
 $f^{\ast }$
.
(a) The time evolution of the normalized vortex ring diameter. (b) The normalized vortex ring diameter versus the propagation distance.
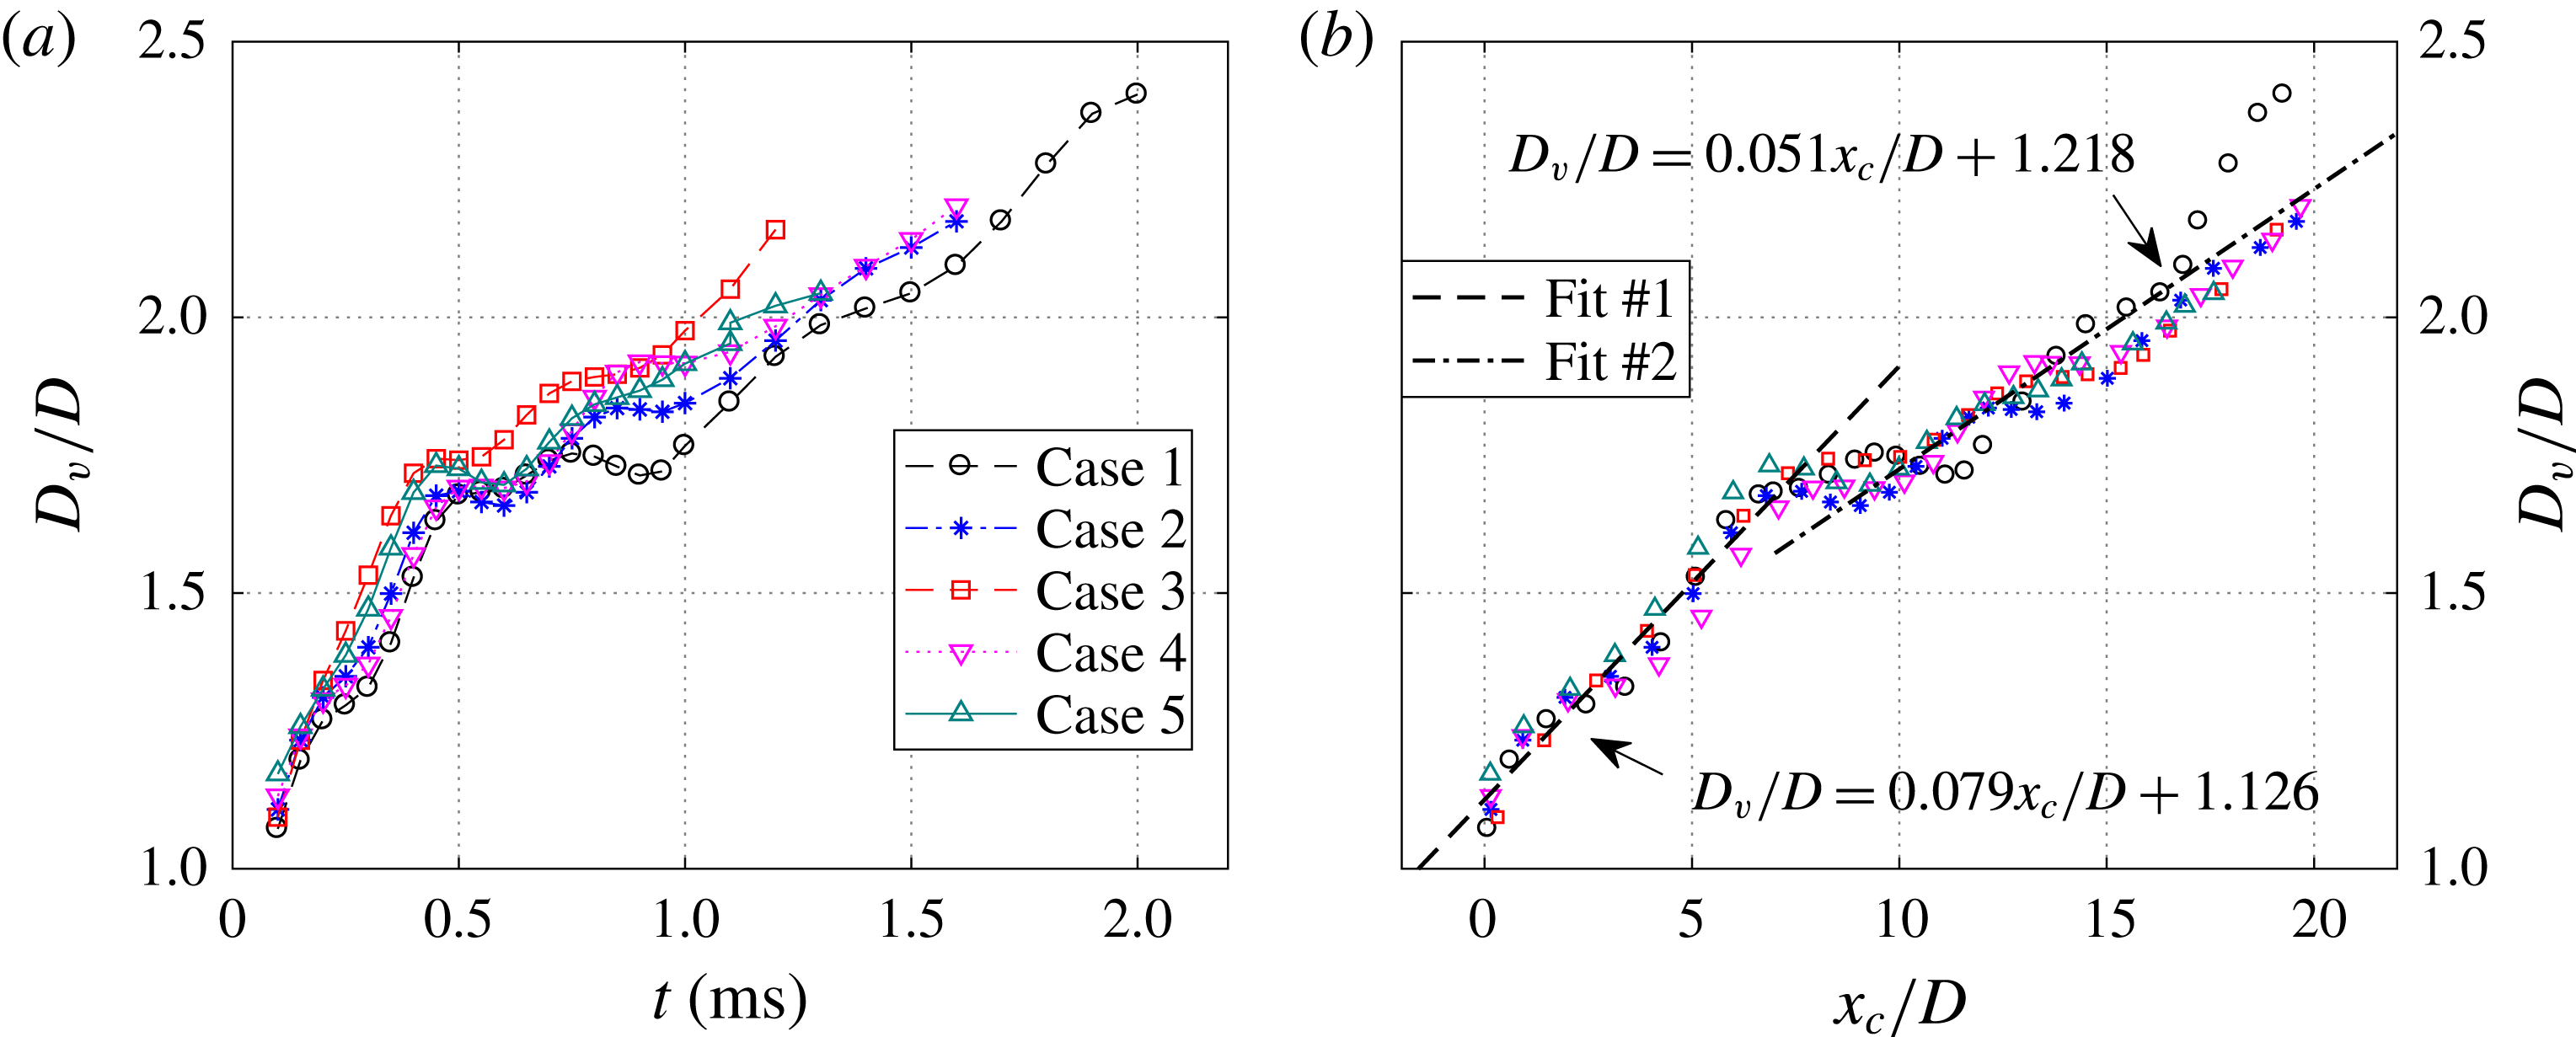
In figure 18(b), an evident collapse is obtained when
 $D_{v}/D$
is plotted against the propagation distance. This is largely expected since the low-velocity vortex ring has a longer time to build up in size before reaching the same propagation distance, which compensates its slow expansion rate. The kink point observed in figure 18(a) collapses at approximately
 $x_{c}/D=8$
, corresponding to a non-dimensional vortex ring diameter of 1.7. It should be noted that in Zong & Kotsonis (Reference Zong and Kotsonis2016a
), the kink point was not observed in the range of
 $x_{c}/D<12$
. The distinction can be ascribed to the different jet duration time (1.1 ms in Zong & Kotsonis (Reference Zong and Kotsonis2016a
), as opposed to 0.5 ms in the present study). Considering the two identified regimes (
 $x_{c}/D<7$
and
 $x_{c}/D>9$
), two linear equations can be fitted, as shown in figure 18(b). The slopes of these two fitting lines differ by a factor of 1.5, further confirming that different dynamics of the FVR growth are in play, depending on the status of the high-speed jet ‘injector’ lying beneath.
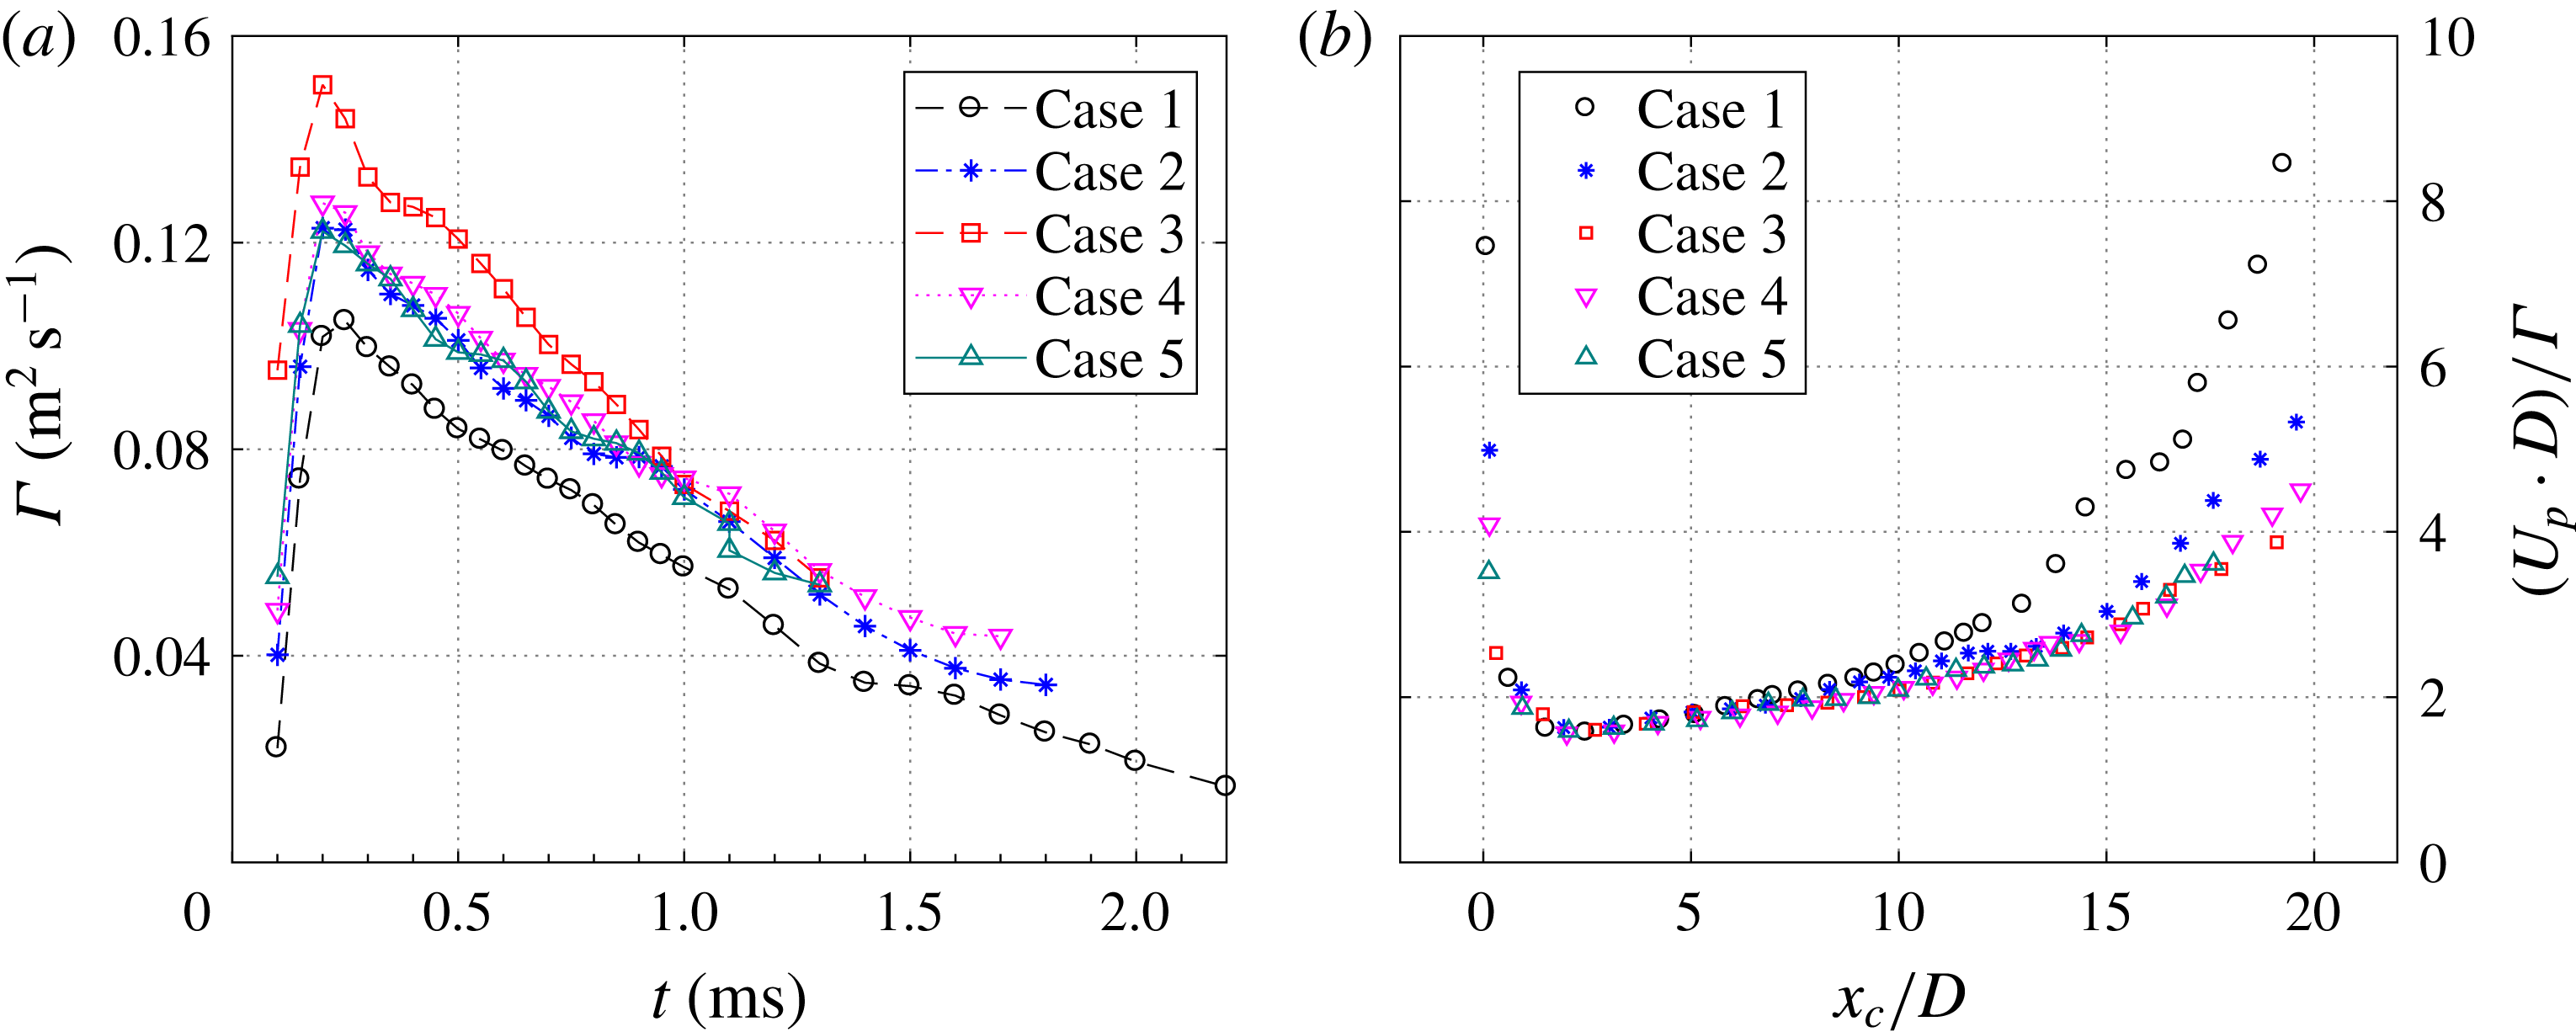
Figure 19(a) shows the time evolution of the vortex ring circulation. Within one cycle, the circulation goes up sharply during the primary jet stage
 $t<0.2~\text{ms}$
, while diminishing slowly at later times, ostensibly in a linear way. The peak circulation attained at approximately
 $t=0.2~\text{ms}$
is unaffected by the actuation frequency and increases with the energy deposition, resembling the behaviour of the peak propagation velocity. This is largely expected. Based on vortex dynamics, the vortex ring propagation velocity is positively proportional to the ratio of the circulation to the diameter,
 $\unicode[STIX]{x1D6E4}/D_{v}$
(Wu, Ma & Zhou Reference Wu, Ma and Zhou2007). The vortex ring diameter at
 $t=0.2~\text{ms}$
is approximately constant for all of the tested cases (figure 18
a). As a consequence, the variation of the peak circulation with
 $\unicode[STIX]{x1D700}$
and
 $f_{d}$
follows the peak propagation velocity closely.
(a) The variation of the vortex ring circulation with time. (b) The variation of the normalized vortex ring circulation with the non-dimensional propagation distance.
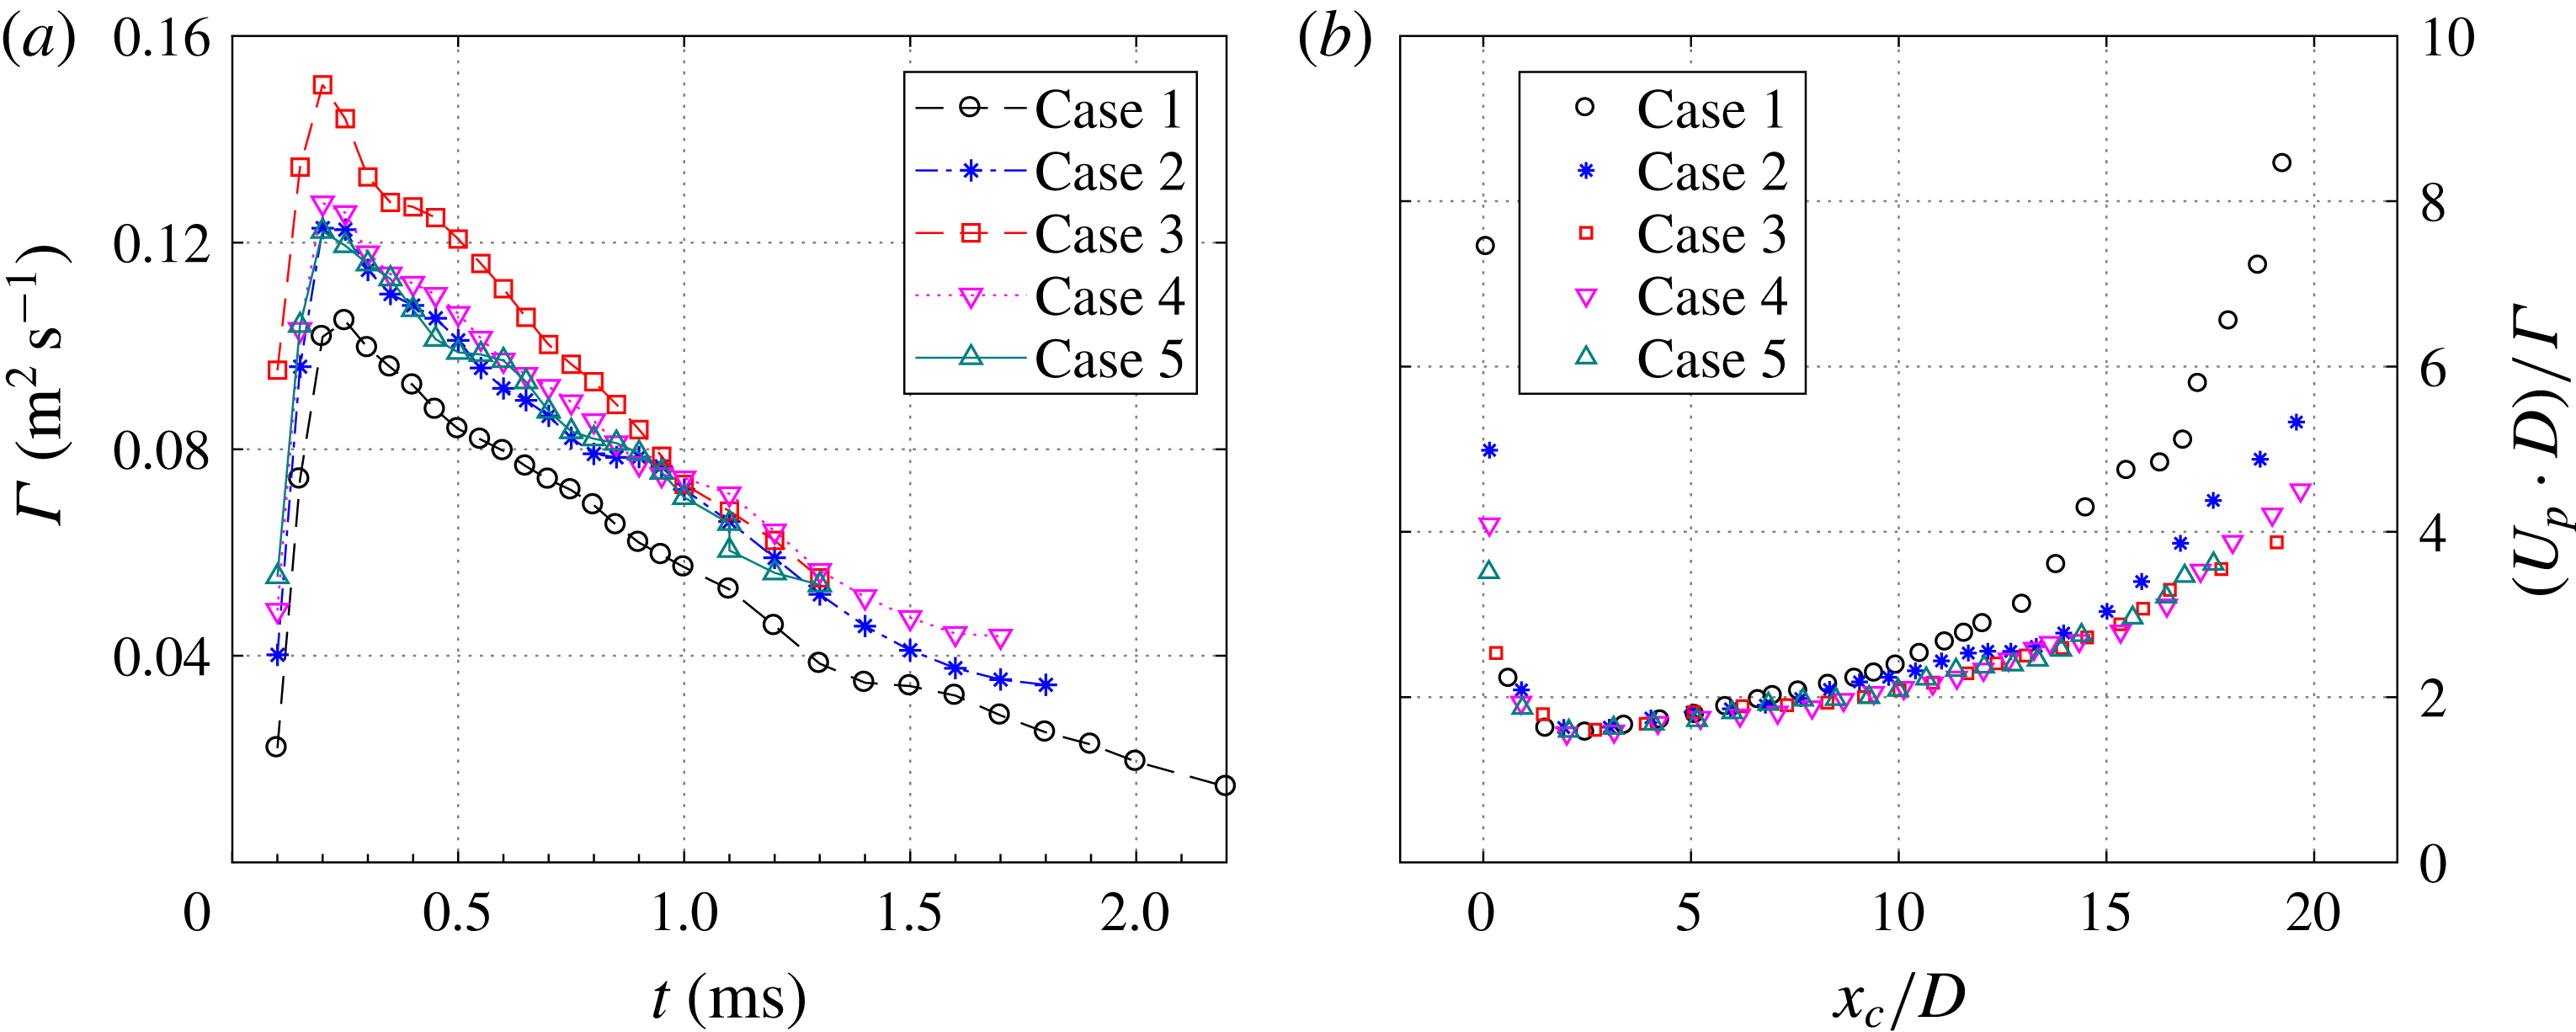
As the circulation is expected to increase with the vorticity (in turn scaling with
 $U_{p}/D$
) and the square of the vortex ring diameter (
 $D^{2}$
), it is instructive to normalize the circulation by
 $U_{p}D$
(Gharib et al.
Reference Gharib, Rambod and Shariff1998; Zong & Kotsonis Reference Zong and Kotsonis2017b
). As shown in figure 19(b), the ensemble of tested cases shows an excellent agreement in the range
 $x_{c}/D<10$
, but diverges afterwards. The peak value of
 $\unicode[STIX]{x1D6E4}$
residing at approximately
 $x_{c}/D=2$
is approximately
 $0.62U_{p}D$
for all cases. Assuming that the diameter of the vortex core region (
 $D$
) and the vorticity (
 $U_{p}/D$
) are uniformly distributed in the vortex core region, a peak circulation of
 $(\unicode[STIX]{x03C0}D^{2}/4)\ast (U_{p}/D)=0.79U_{p}/D$
can be computed, which is a rather good estimation of the experimental value.
In the study of Gharib et al. (Reference Gharib, Rambod and Shariff1998), the maximum circulation of FVRs is attained universally at a ‘formation number’ of 3.6–4.5. The definition of ‘formation number’ is essentially the integral of the time-varying exit velocity. For the incipient jet of the present study, the exit velocity is roughly double the vortex ring propagation velocity (figures 7 and 16). Thus, a ‘formation number’ of 3.6–4.5 corresponds to a non-dimensional propagation distance of 1.8–2.3, which agrees excellently with the present data (approximately
 $x/D=2$
; see figure 19
b). Similar results were also reported by Chang & Vakili (Reference Chang and Vakili1995), where the vortex ring was not fully formed until
 $x=3D$
.
5 Time-averaged results
The PSJ is widely characterized in phase-averaged flow fields (Reedy et al. Reference Reedy, Kale, Dutton and Elliott2013; Zong & Kotsonis Reference Zong and Kotsonis2016a , Reference Zong and Kotsonis2017a ). Nevertheless, significantly fewer studies have focused on the time-averaged flow fields of the PSJ. The time-averaging metrics including the centreline velocity decay, the jet spreading rate and the jet entrainment rate are crucial to evaluate the mean mixing and penetration ability of the PSJ, and need to be extracted and compared with both steady jets and piezoelectric SJAs. The following discussion applies these principles to the tested cases.
5.1 Time-averaged velocity fields
The time-averaged velocity field for each case can be computed by summing up the phase-averaged velocity fields, as shown in (5.1), where
 $\unicode[STIX]{x0394}t$
denotes the time step between adjacent phases within one actuation cycle:
 $$\begin{eqnarray}\displaystyle \overline{U}(x,y,z)=\int _{0}^{T_{d}}U(x,y,z,t)\,\text{d}t\approx \frac{1}{T_{d}}\mathop{\sum }_{i=1}^{N}U(x,y,z,t_{1})\unicode[STIX]{x0394}t_{i}. & & \displaystyle\end{eqnarray}$$
As the time-averaged velocity is expected to increase with both the stroke length and the repetition rate, a non-dimensional velocity can be defined as
 $\overline{U}_{x}/(L_{s}\cdot f_{d})$
. For the five different tested cases, the time-averaged velocity fields are shown in figure 20. As is evident, the time-averaged flow organization of the PSJ has considerable similarity to that of steady jets and conventional (mechanically operated) synthetic jets (Hussein, Capp & George Reference Hussein, Capp and George1994; Cater & Soria Reference Cater and Soria2002). During the axial propagation, the jet expands as a result of entrainment. In contrast to steady jets, no potential core region is observed. The high-velocity region produced by the PSJ lies approximately in the range
 $2D<x<10D$
, instead of just above the exit. The peak values of the time-averaged velocity are approximately 1.2–1.6 times
 $L_{s}\,f_{d}$
. The jet flow for all cases is not symmetric, leaning slightly to one side. This asymmetry was also observed by Zong & Kotsonis (Reference Zong and Kotsonis2016a
) and can be attributed to the non-uniform arc heating within the cavity. Specifically, due to the high electric field experienced locally, the near-cathode region produces more heat than other regions in the electrode gap, leading to higher gas pressure (Rekalić & Vukanović Reference Rekalić and Vukanović1974; Braithwaite Reference Braithwaite2000). Affected by this asymmetric pressure distribution, the jet is issued from the exit orifice at a small inclination. The angle is estimated to be approximately
 $2^{\circ }$
and is largely inconsequent to the outcomes of the present study.
Time-averaged flow fields for cases 1–5 (a–e). The velocity vector field is indicated by arrows; the normalized axial velocity
 $\overline{U}_{x}/(L_{s}\cdot f_{d})$
is displayed as coloured contours; the red lines in (a) pertain to the left and right bounds of the jet, determined by 50 % of the peak jet velocity at each axial position; the thin red lines in (b) denote streamlines.
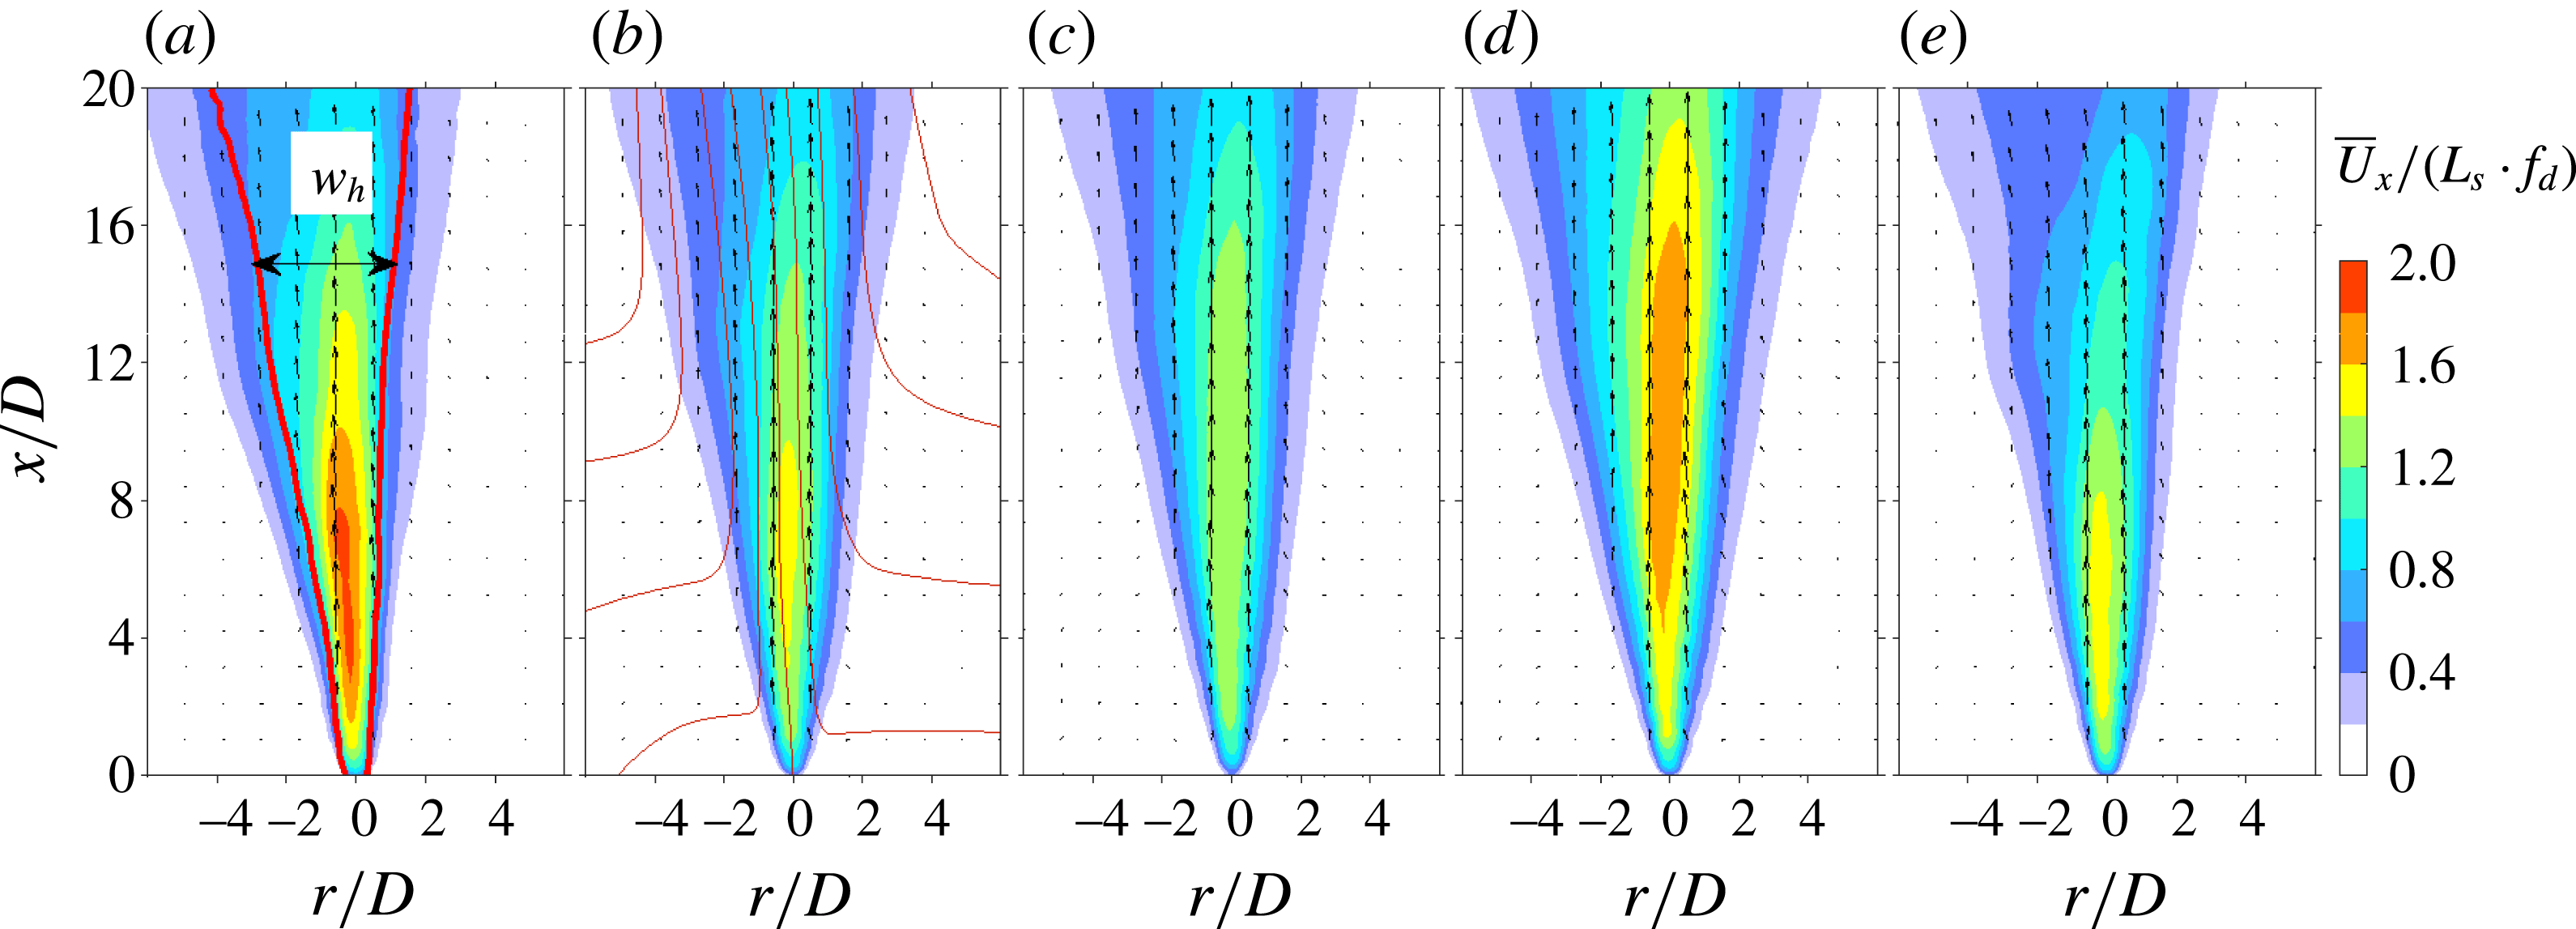
Several velocity profiles at increasing axial distance from the jet exit are extracted and shown in figure 21(a) for case 2. Traces of suction flow (negative velocity) can only be observed at
 $x/D=1$
. The asymmetry in velocity profiles is imperceptible for locations below
 $x/D=5$
, but significantly pronounced after
 $x/D=10$
(Zong & Kotsonis Reference Zong and Kotsonis2016a
). Based on these velocity profiles, the peak velocity (
 $\overline{U}_{c}$
) and the full width at which the jet velocity falls to 50 % of the centreline velocity (
 $w_{h}$
) can be computed. For the sake of consistency with previous literature,
 $\overline{U}_{c}$
will be termed as the centreline velocity hereafter although it does not always occur in the nominal centre of the jet. A detailed definition of
 $w_{h}$
is sketched in figure 20(a). When
 $\overline{U}_{c}$
and
 $w_{h}$
are used to normalize the velocity profiles, a fairly universal collapse is obtained between
 $x/D=2$
and
 $x/D=20$
, as shown in figure 21(b). The normalized velocity profile agrees well with the profile from steady turbulent jets (Hussein et al.
Reference Hussein, Capp and George1994), and thus can be approximated by
 $\overline{U}_{x}/\overline{U}_{c}=1/(1+a(r-r_{0})^{2}/w_{h}^{2})^{2}$
, where
 $a$
is a constant (Pope Reference Pope2000). Nevertheless, it must be stressed that the similarity in velocity profiles does not indicate that the time-averaged flow of the PSJ is momentum-preserving, since the FVR dissipates a considerable proportion of kinetic energy during its axial propagation.
(a) Normalized time-averaged jet velocity profiles at different axial positions for case 2. (b) Comparison of normalized velocity profiles between the PSJ of the present study and steady jets (Hussein et al.
Reference Hussein, Capp and George1994). Here,
 $r_{0}$
represents the radial coordinate of the velocity peak.

5.2 Centreline velocity and jet width
The axial variation of
 $\overline{U}_{c}$
in linear coordinates is shown in figure 22(a). As expected, the centreline jet velocity is positively proportional to both the actuation frequency and the capacitor energy. Departing from the typical behaviour of incompressible ZNMF jets, the time-averaged velocity at the jet exit (
 $x/D=0$
) is non-zero (Smith & Glezer Reference Smith and Glezer1998; Cater & Soria Reference Cater and Soria2002). For the tested cases,
 $\overline{U}_{c}$
ranges from
 $0.5~\text{m}~\text{s}^{-1}$
to
 $6~\text{m}~\text{s}^{-1}$
, which is one order of magnitude less than
 $U_{p}$
due to the low jet duty cycle (
 $D_{e}$
, 0.01–0.1 for all of the tested cases). In linear coordinates, all cases show an initial sharp increase in the region of
 $x/D<2$
and an ultimate slow decrease in the region of
 $x/D>15$
. The shape of these curves remains largely invariant with increasing energy (cases 1–3) but differs with actuation frequency (cases 4, 2 and 5). Specifically, for case 4 (
 $f_{d}=50~\text{Hz}$
), a plateau is observed between
 $x/D=2$
and
 $x/D=15$
, where
 $\overline{U}_{c}$
exceeds 80 % of its maximum. The peak value of
 $\overline{U}_{c}$
is reached at approximately
 $x/D=9$
. As a result of increasing frequency (
 $f_{d}=200~\text{Hz}$
, case 4), the plateau region shrinks to
 $2<x/D<8$
and the peak position of
 $\overline{U}_{c}$
moves close to the exit (
 $x/D=2$
).
The non-dimensional centreline velocity is normalized by
 $L_{s}\,f_{d}$
and plotted in semilogarithmic coordinates in figure 22(b). As a result, two linear regimes can be identified on each curve, following results from piezoelectric synthetic jets (Smith & Glezer Reference Smith and Glezer1998). The first linear regime (
 $x<2D$
) is related to the weakened influence of suction flow and collapses reasonably for the different investigated cases. The second linear regime corresponds to the fast momentum dissipation in the far field (
 $x/D>15$
) attributed to the detachment of vortex rings from the high-speed jet body as a result of relatively short jet duration (see § 4.2). The second linear segment collapses for varying capacitor energy. However, at increasing frequency, a rapid decay of the centreline velocity is exhibited. The peak values of
 $\overline{U}_{c}/(L_{s}\cdot f_{d})$
are 1.6 and 1.5 for cases 1 and 4 (relatively weak suction) and 1.2 for the rest of the cases.
The decay of the normalized centreline velocity with the axial distance in (a) linear coordinates and (b) semilogarithmic coordinates.
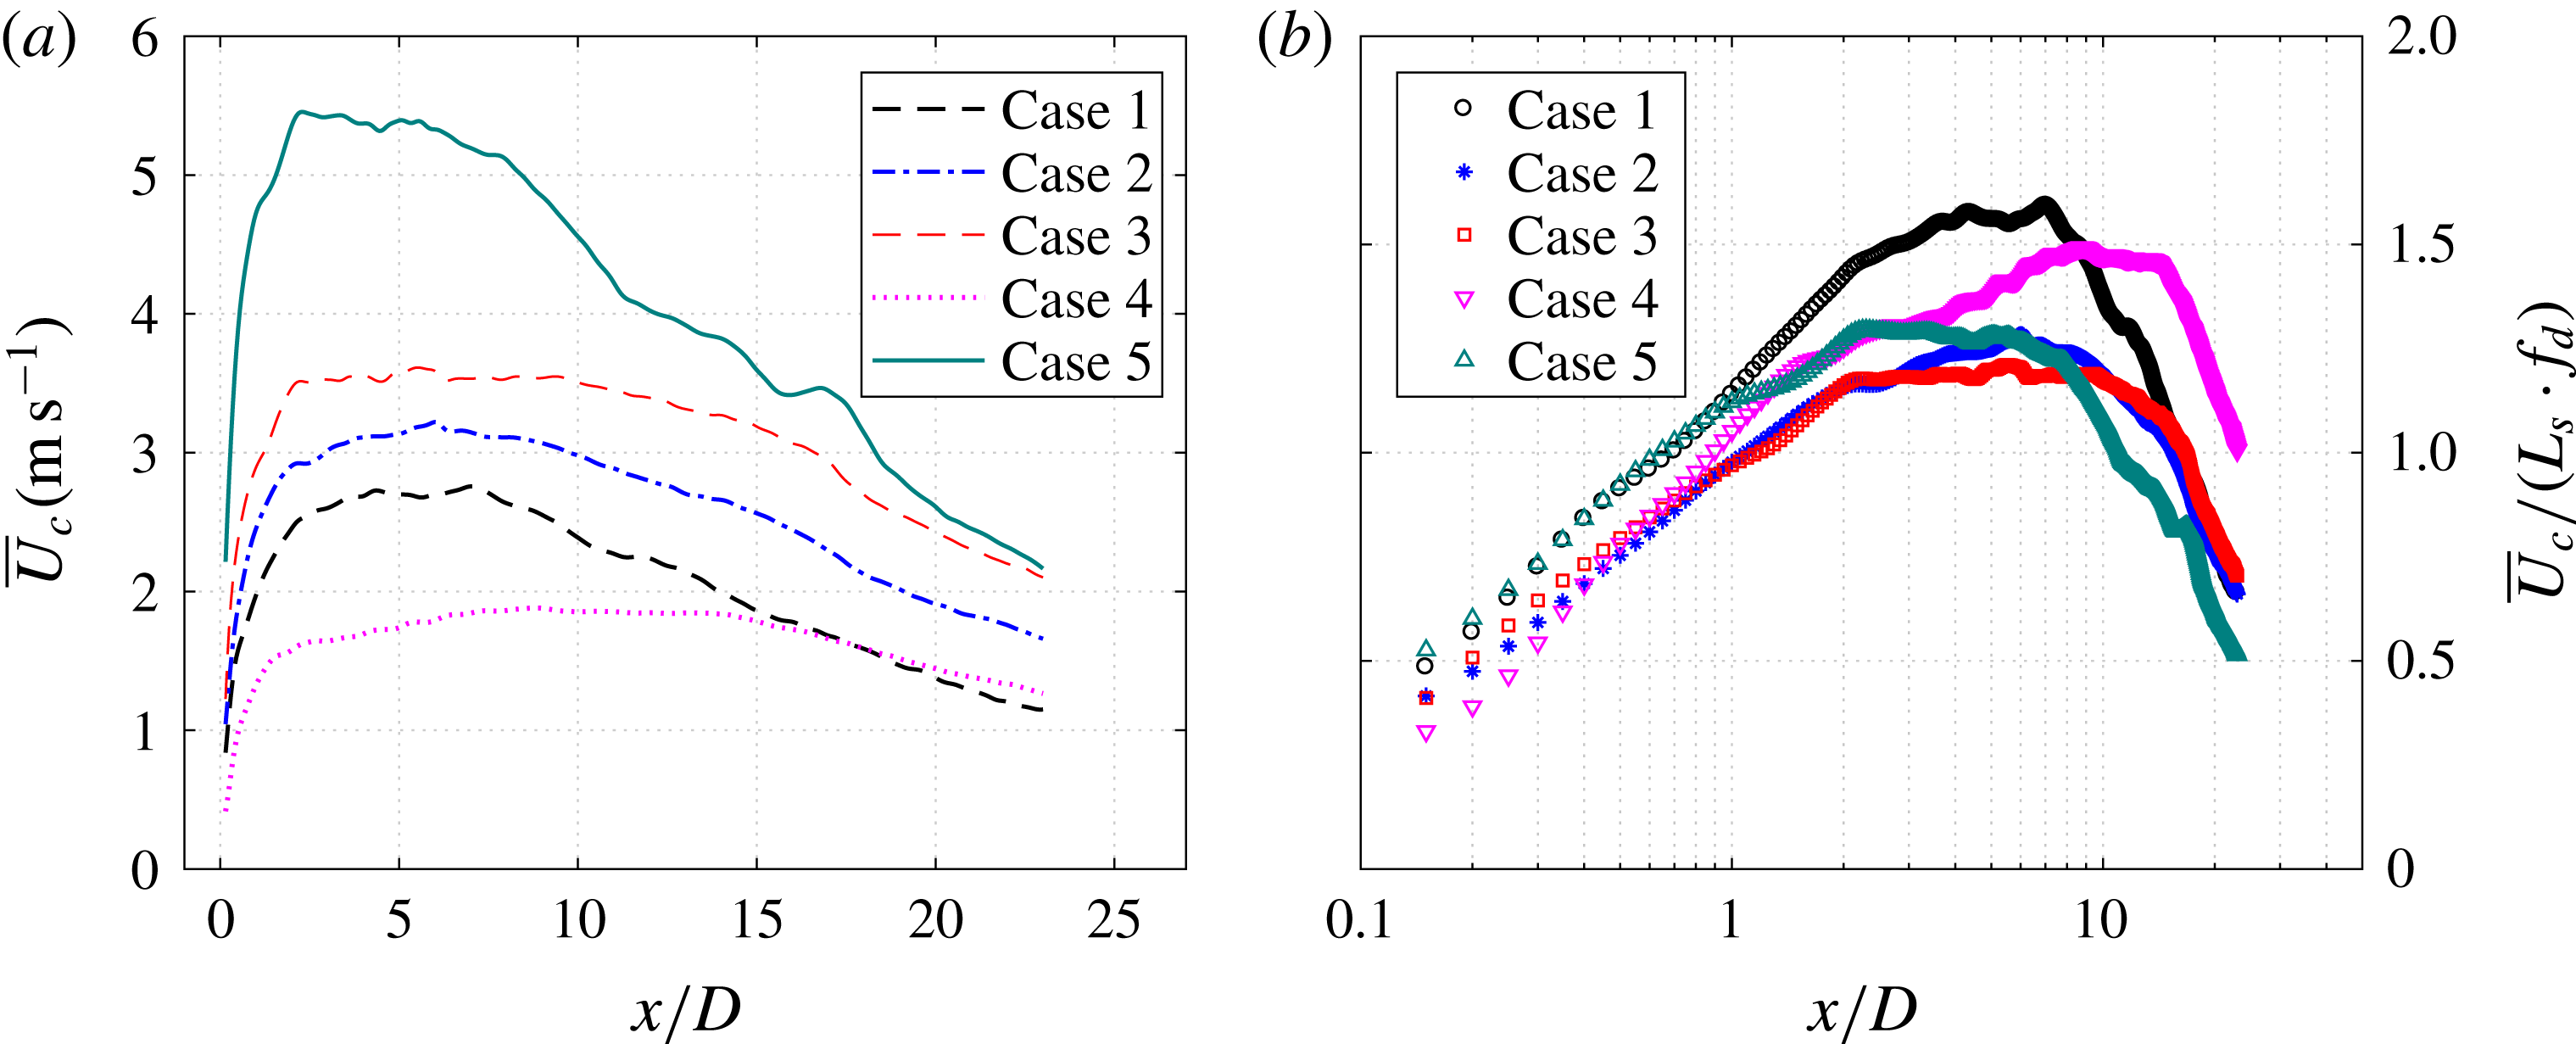
The evolution of the jet width with the axial distance in (a) linear coordinates and (b) semilogarithmic coordinates. The fitting law is indicated in (a).
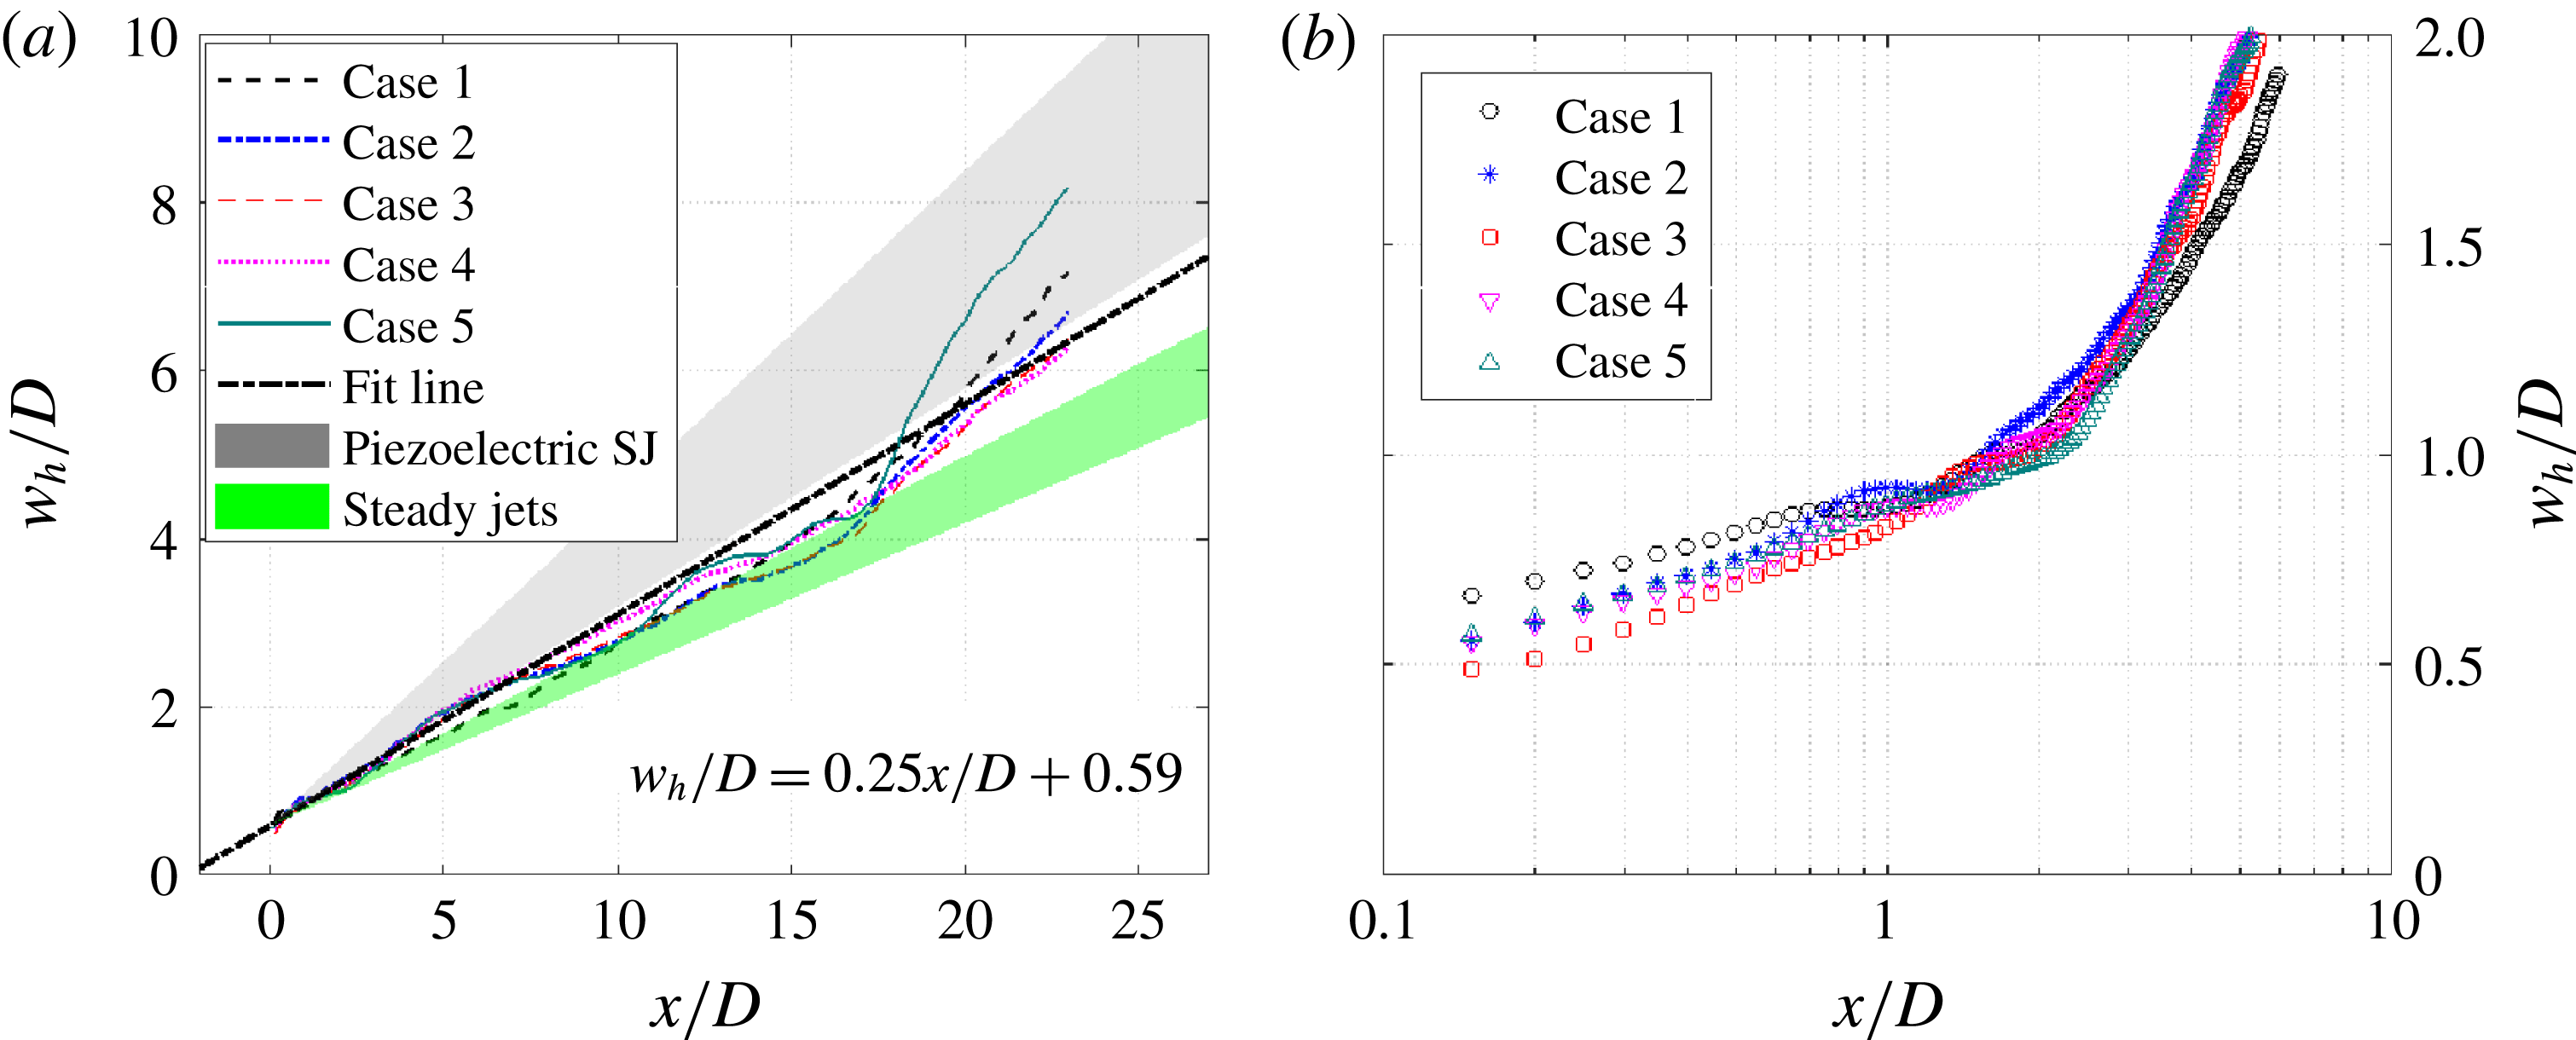
Figure 23(a) shows the axial variation of the jet width (
 $w_{h}$
) in linear coordinates. As is evident, the jet width increases linearly and remains independent of the actuation frequency and capacitor energy. This monotonic variation is similar to that observed in turbulent jets, but differs from the respective width evolution in piezoelectric synthetic jets, since no local minimum is observed (Hussein et al.
Reference Hussein, Capp and George1994; Shuster & Smith Reference Shuster and Smith2007). A linear regression model is used to fit the data sets in figure 23(a). Half of the slope of this linear equation defines the mean jet spreading rate of the PSJ (approximately 0.13), which is higher than the values for steady turbulent jets (0.09–0.11) but lower than the values for piezoelectric synthetic jets (0.13–0.195) (Hussein et al.
Reference Hussein, Capp and George1994; Shuster & Smith Reference Shuster and Smith2007). This relatively high jet spreading rate indicates a high entrainment rate of surrounding fluid, which will be quantified in the following subsection. A zoomed-in view of the near-exit variation is further provided in figure 23(b) in semilogarithmic coordinates. A kink point is observed at
 $x/D=2$
, prior to which the jet width shows a steady increase.
5.3 Jet entrainment
For incompressible flow, the mass flow entrained by jets (denoted as
 $Q_{ent}$
) can be computed by the integral of the mass flow rate along the radial direction (Hussein et al.
Reference Hussein, Capp and George1994) as follows:
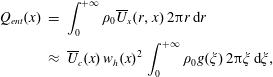 $$\begin{eqnarray}\displaystyle Q_{ent}(x) & = & \displaystyle \int _{0}^{+\infty }\unicode[STIX]{x1D70C}_{0}\overline{U}_{x}(r,x)\,2\unicode[STIX]{x03C0}r\,\text{d}r\nonumber\\ \displaystyle & {\approx} & \displaystyle \overline{U}_{c}(x)\,w_{h}(x)^{2}\,\int _{0}^{+\infty }\unicode[STIX]{x1D70C}_{0}g(\unicode[STIX]{x1D709})\,2\unicode[STIX]{x03C0}\unicode[STIX]{x1D709}\,\text{d}\unicode[STIX]{x1D709},\end{eqnarray}$$
where
 $\unicode[STIX]{x1D709}$
equals
 $r/w_{h}$
and
 $g$
denotes the normalized velocity profile. Considering a self-similar velocity profile where
 $g$
depends only on
 $\unicode[STIX]{x1D709}$
,
 $Q_{ent}$
is proportional to the product of the jet centreline velocity and the square of the jet width. In the case of a PSJ, the expelled gas is of somewhat lower density than ambient (figure 9). However, (5.2) can still give an acceptable estimation of the jet-entrained mass flow, since the expelled gas mass (
 $f_{d}\cdot M_{e}$
) is one order of magnitude less than
 $Q_{ent}$
after
 $x>2D$
(see figure 24
b).
The axial variation of the jet-entrained mass flow is shown in figure 24(a). For all cases, a linear variation is exhibited. The entrained mass flow
 $Q_{ent}$
increases with both the actuation frequency and the capacitor energy. The actuation frequency has a larger effect than the energy deposition. The variation of
 $Q_{ent}$
with
 $f_{d}$
and
 $\unicode[STIX]{x1D700}$
resembles that of the centreline velocity, as expected, since the jet width and the normalized velocity profile change slightly for all of the tested cases. In figure 24(b),
 $Q_{ent}$
is normalized with the expelled gas mass (
 $f_{d}\cdot M_{e}$
). Cases 2, 3 and 5 show a good agreement. For cases 1 and 4 (weak suction), the slope of these curves is steeper, indicating essentially a high entrainment rate.
The variation of the entrained mass flow in the axial direction: (a) absolute values and (b) normalized values.
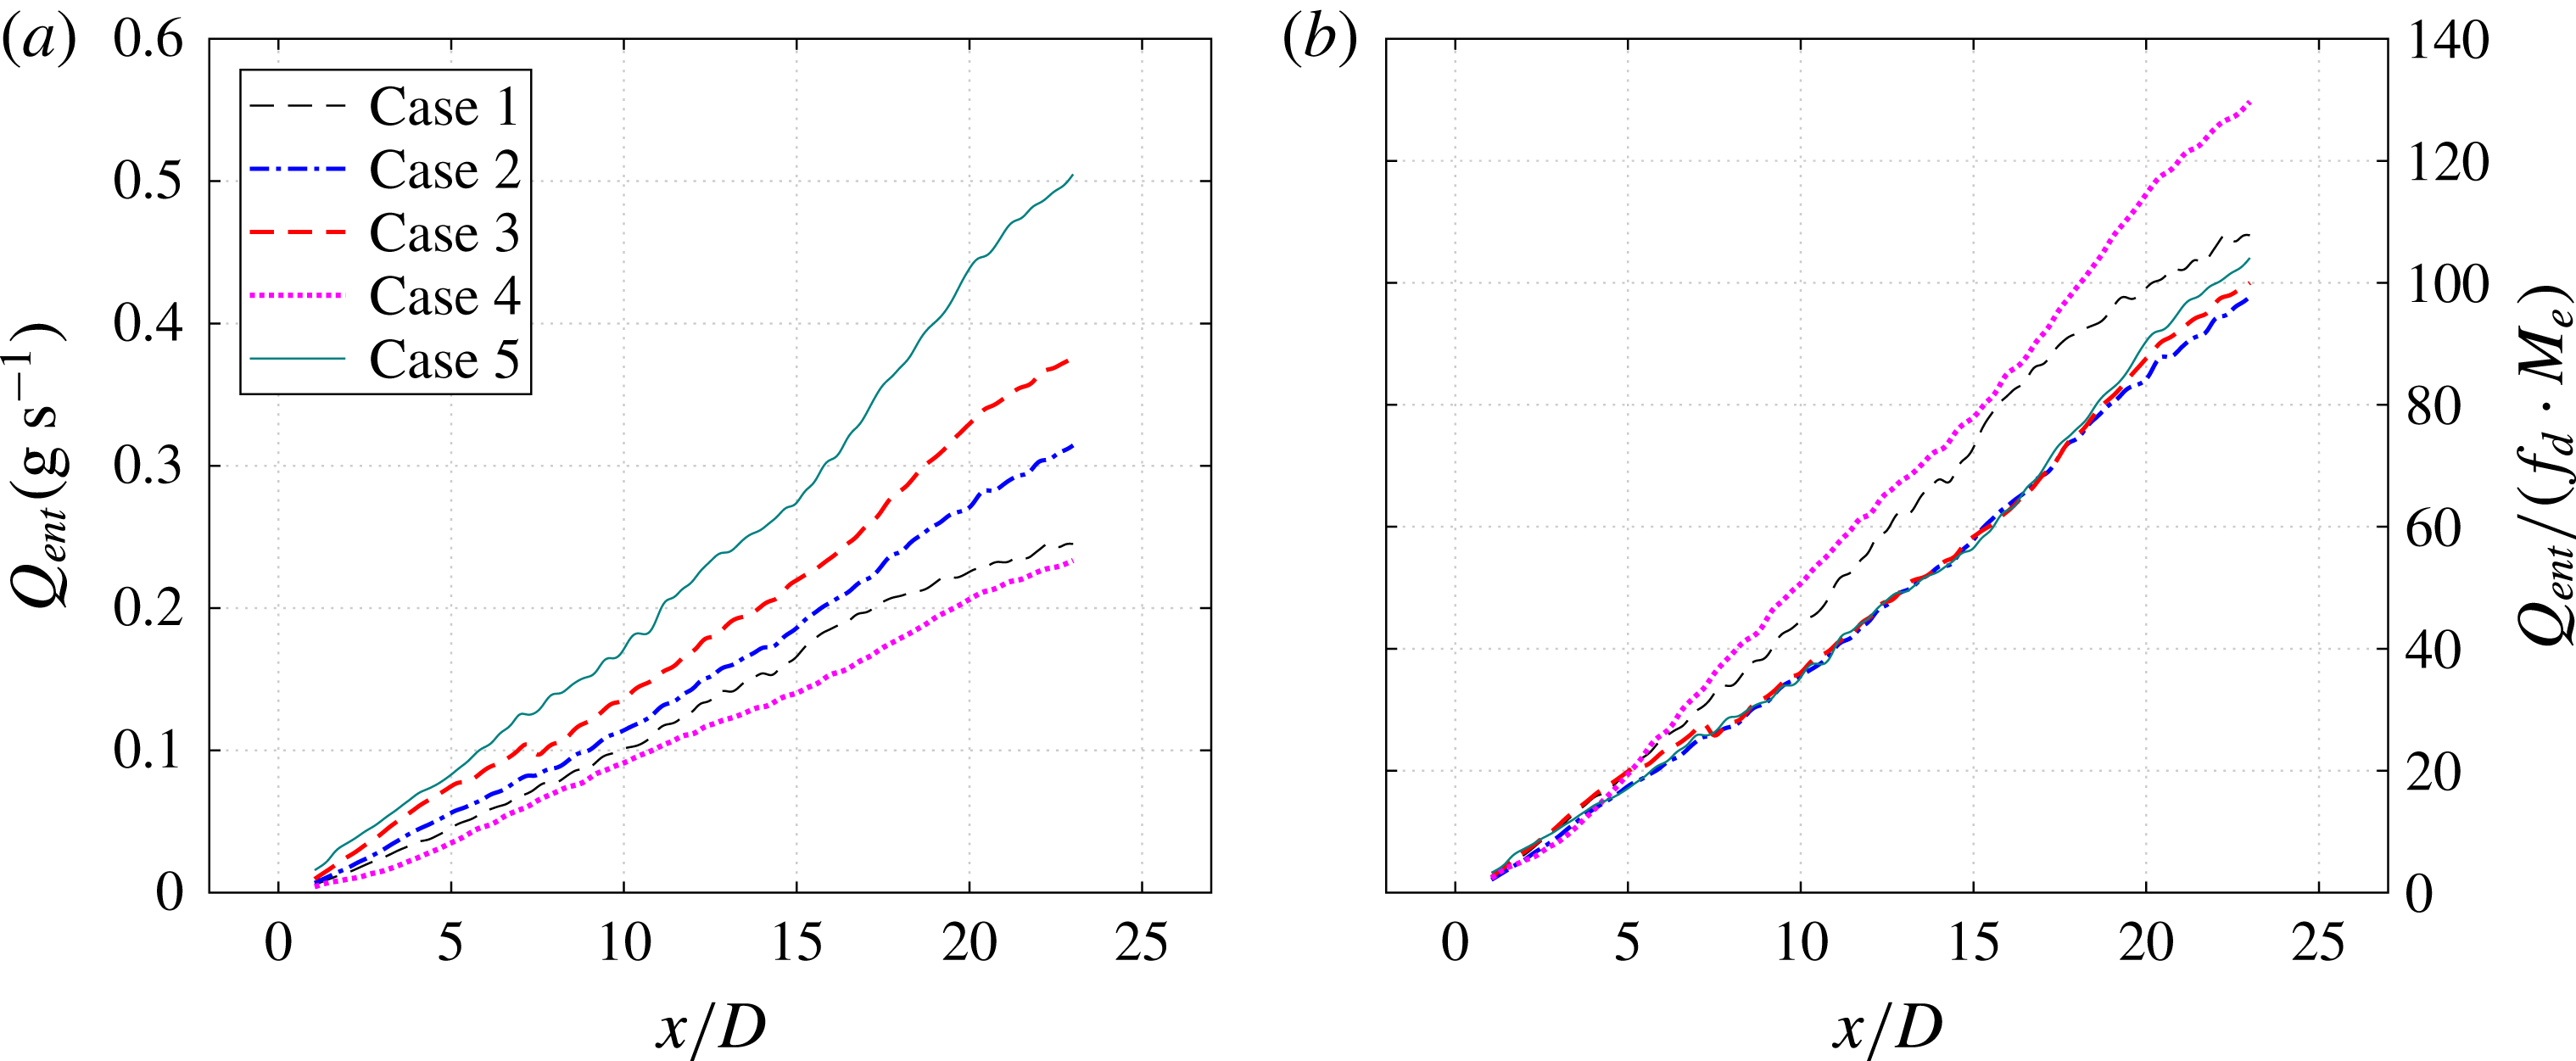
The entrainment coefficient for round turbulent jets defined by Morton, Taylor & Turner (Reference Morton, Taylor and Turner1956) and Hussein et al. (Reference Hussein, Capp and George1994) can be reformulated as follows:
 $$\begin{eqnarray}\displaystyle & \displaystyle \unicode[STIX]{x1D6FC}=\frac{\displaystyle \text{d}\left(2\int _{0}^{+\infty }\overline{U}_{x}\,r\,\text{d}r\right)/\text{d}x}{L_{ref}\overline{U}_{ref}}, & \displaystyle\end{eqnarray}$$
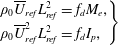 $$\begin{eqnarray}\displaystyle & \displaystyle \left.\begin{array}{@{}l@{}}\displaystyle \unicode[STIX]{x1D70C}_{0}\overline{U}_{ref}L_{ref}^{2}=f_{d}M_{e},\\ \displaystyle \unicode[STIX]{x1D70C}_{0}\overline{U}_{ref}^{2}L_{ref}^{2}=f_{d}I_{p},\end{array}\right\} & \displaystyle\end{eqnarray}$$
where
 $L_{ref}$
and
 $\overline{U}_{ref}$
are the equivalent top-hat length and velocity defined by (5.5). Based on (5.2)–(5.4), the relationship between the slope in figure 24(b) (denoted as
 $k$
) and the entrainment coefficient can be derived by
 $$\begin{eqnarray}\displaystyle k & = & \displaystyle \text{d}\left(\frac{Q_{ent}}{f_{d}M_{e}}\right)/\text{d}\left(\frac{x}{D}\right)\nonumber\\ \displaystyle & = & \displaystyle \frac{\unicode[STIX]{x03C0}D}{M_{e}}\sqrt{\frac{I_{p}\unicode[STIX]{x1D70C}_{0}}{f_{d}}}\,\unicode[STIX]{x1D6FC}.\end{eqnarray}$$
As a result, the entrainment coefficient ranges from 0.19 to 0.26 for the tested cases, twice as high as the values (0.08–0.1) reported in Hussein et al. (Reference Hussein, Capp and George1994) for steady jets. This observation together with the jet spreading rate demonstrates that the entrainment ability of the PSJ is considerably higher than that of steady turbulent jets, which makes the PSJA a promising tool in mixing-enhancement applications (e.g. engine combustion chambers; Johari & Paduano Reference Johari and Paduano1997).
6 Concluding remarks
A two-electrode large-volume PSJA is devised and fed by a sequential discharge power supply. A high-speed phase-locked planar PIV system is used to measure the jet induced flow in the axisymmetric plane (
 $rx$
-plane). The influence of the non-dimensional energy deposition (
 $\unicode[STIX]{x1D700}$
) and the dimensionless frequency (
 $f^{\ast }$
) on the formation and evolution characteristics of the PSJ is investigated in detail, from the perspective of both phase-averaging and time-averaging.
A high-speed jet, localized weak suction and an FVR are the three prominent features in phase-averaged flow fields. With fixed
 $f^{\ast }$
and increasing
 $\unicode[STIX]{x1D700}$
, the peak jet velocity (
 $U_{p}$
) increases monotonically, whereas the jet duration time (
 $T_{d}$
) extends moderately. When
 $\unicode[STIX]{x1D700}$
remains unchanged and
 $f^{\ast }$
is increased, the peak jet velocity remains approximately constant and the jet duration time drops steadily. The steady cavity density declines with increasing energy deposition and frequency, ranging from 70 % to 90 % of the ambient density for the tested cases. The theoretical model developed reveals that the expelled gas mass, impulse and jet mechanical energy are proportional to the jet duration time, cavity density and increasing powers of the peak jet velocity. When the total efficiency, jet duration time and cavity density remain unchanged,
 $U_{p}$
increases with
 $\unicode[STIX]{x1D700}^{1/3}$
.
Within one actuation cycle, approximately 5 % of the jet impulse produced by the primary jet stage is counteracted by the inevitable suction flow. The increasing jet intensity with
 $\unicode[STIX]{x1D700}$
is mainly contributed by the increasing peak jet velocity, while the decreasing jet intensity with
 $f^{\ast }$
is attributed to both the reduced cavity density (primary factor, 22 %) and the reduced jet duration (secondary factor, 13 %). The time-averaged thrust produced by the PSJA (
 $O$
(1 mN)) is positively proportional to both
 $\unicode[STIX]{x1D700}$
and
 $f^{\ast }$
. The total energy efficiency (
 $O$
(0.01 %)) reduces with increasing frequency.
The velocity of the FVR (
 $U_{v}$
) initially shows a sharp increase and subsequently a moderate decay. The peak propagation velocity reached at
 $x=2D$
is approximately 0.43
 $U_{p}$
. For the tested cases, the diameter of the FVR (
 $D_{v}$
) increases monotonically in one cycle and collapses well when plotted against the dimensionless propagation distance. The peak circulation is also attained at
 $x=2D$
and remains
 $0.62U_{p}/D$
for different cases.
The time-averaged velocity fields of the PSJ resemble those of steady jets, but without the presence of a potential core region. The jet centreline velocity first increases and then decays with the axial coordinate. The peak value observed in the range
 $2<x/D<9$
is approximately 1.2–1.6 times
 $L_{s}\cdot f_{d}$
. The decay rate of the jet centreline velocity increases with the frequency whereas it remains unchanged at different energy deposition levels. The mean jet spreading rate (0.13) for all of the tested cases is higher than the values for steady jets (0.1) but lower than the values for piezoelectric synthetic jets (0.13–0.195). The entrainment coefficient of the PSJ ranges from 0.19 to 0.26, which is twice as high as the values for steady jets (0.08–0.1), indicating a fast mixing rate.
In summary, the characteristics of formation, evolution and scaling suggest that PSJAs are appropriate for both flow control and mixing-related purposes. In both applications, the actuators are commonly flush-mounted on the wall to impact the cross-flow. Since the performance of PSJAs operating in quiescent and cross-flow conditions differs negligibly in the low-speed regime (Zong & Kotsonis Reference Zong and Kotsonis2017b ), the non-dimensional jet formation and evolution laws obtained in this study can be transplanted directly into cross-flow conditions to estimate the required peak velocity, jet momentum and energy deposition during concept design phases. For applications where the free-stream velocity is comparable to the PSJ velocity, further characterization would be necessary, especially for the later stages of the jet evolution.