





Key summary
Summarise the established knowledge on this subject:
-
• Inflammatory bowel disease (IBD) is a chronic inflammatory condition, and patients with IBD frequently suffer from malnutrition related to reduced energy intake, malabsorption, nutrient loss and inflammation.
-
• Nutritional status can be compromised in individuals with IBD even during remission, and malnutrition impacts disease outcomes in IBD. It increases the risk of complications, susceptibility to infections, length of hospital stay, hospital costs and even the risk of death in most patients.
What are the significant and/or new findings of this study?
-
• The observed improvements in measurements during the dietary treatment suggest that nutritional interventions and recommendations for a healthy diet can influence the anthropometric measurements of individuals.
-
• This study indicate that enteral nutritional support can modulate intestinal immune responses and correct deteriorated nutrition, resulting in a positive impact on inflammatory bowel processes.
Introduction
In inflammatory bowel disease (IBD), which is divided into Crohn’s disease (CH) and ulcerative colitis (UK), inflammation in the ulcerative colon is usually confined to the mucosa and submucosa and affects only the colon. In Crohn’s disease, inflammation extends from the mucosa to the entire serosa wall and any part of the gastrointestinal tract may be affected. Both diseases are chronic and lifelong(Reference Hanauer and Hommes1–Reference Zonderman and Vender3). The pathogenesis of IBD has not been fully elucidated(Reference Özgürsoy Uran, Sarıtaş Yüksel and Ünsal Avdal4). In general, it is believed that genetic factors, environmental factors (transition to modern life, dietary habits, etc.) and immune factors may play a role in the occurrence and development of the disease(Reference Silverberg, Satsangi and Ahmad5).
IBD is a chronic inflammatory condition with challenges extending beyond intestinal symptoms(Reference Mulinacci, Pirola and Gandola6). Patients with IBD frequently suffer from malnutrition, sarcopenia and poor clinical outcomes related to reduced energy intake, malabsorption, nutrient loss and inflammation(Reference Liu, Ding and Maggiore7). Nutritional status can be compromised in individuals with IBD even during remission, and as in all diseases, malnutrition impacts disease outcomes in IBD. It increases the risk of complications, susceptibility to infections, length of hospital stay, hospital costs and even the risk of death in most patients(Reference Vidarsdottir, Johannsdottir and Thorsdottir8,Reference Zhang, Cao and Cao9) . According to the European Association for Clinical Nutrition and Metabolism (ESPEN) definition, malnutrition is a dietary pattern that has measurable negative effects on the structure and function of body tissues due to an imbalanced intake of energy, protein and other nutrients(Reference Cederholm, Barazzoni and Austin10). Malnutrition has a multifactorial aetiology. Malnutrition due to fragmentation of endogenous energy sources in cases where food intake cannot meet the metabolic rate is also due to inadequate nutrient intake in IBD, increased gastrointestinal nutrient losses, decreased anabolic activity and protein synthesis, increased energy requirements and the effects of medications used in treatment, making the disease more complex(Reference Triantafillidis, Vagianos and Papalois11–Reference Lochs, Allison and Meier13). In Crohn’s patients, muscle mass loss and significant malnutrition are more common; in ulcerative colitis, nutritional status is generally maintained, but nutritional deficiencies can occur rapidly due to disease activity(Reference Takaoka, Sasaki and Kurihara14). These high risks for malnutrition have shown that malnutrition should be treated with care, not just disease treatment, and have turned nutrition therapy from support to a treatment method(Reference Ünal and Fırat12).
The aim of this study is to investigate the effect of protein dietary treatments on the severity of the disease and the state of malnutrition, supported by dietary treatment and enteral nutrition containing high protein for inflammatory bowel patients with malnutrition, and to determine which dietary treatment is more effective.
Materials and methods
Participants and procedure
This is a randomised experimental study of IBD patients treated in the gastroenterology outpatient clinic of Cerrahpaşa School of Medicine between September 2020 and November 2021. A total of sixty volunteer patients with IBD who attended the gastroenterology outpatient clinic, were diagnosed with malnutrition and met the study inclusion criteria were enrolled in the study. The inclusion criteria were being between 19 and 64 years of age, having a diagnosis of IBD and malnutrition, not being under cardiology, neurology, oncology or psychiatric follow-up, having no gastrointestinal disease other than IBD (e.g. peptic ulcer disease or celiac disease), not having diabetes mellitus, not being pregnant or lactating and not having followed any specific diet within the previous month. The exclusion criteria were being younger than 19 years or older than 64 years, not having a diagnosis of IBD or not meeting the criteria for malnutrition, being pregnant or lactating, being under cardiology, neurology, oncology or psychiatric follow-up, having a gastrointestinal disease other than IBD, having diabetes mellitus or having followed any specific diet within the previous month.
Participants were randomly assigned to either the high-protein diet (HPD) group or the enteral nutrition-supported high-protein diet (HPDE) group. Randomisation was performed using a simple lottery method. Eligible patients were listed consecutively upon enrolment, and group allocation was determined by drawing lots. Thus, assignment to either study group was entirely random. Participants were not informed of any presumed superiority of either dietary intervention during the study period.
This study was approved by the Clinical Research Ethics Committee of Yeni Yüzyıl University with decision number 2020/035. All patients were informed in detail about the study and received informed consent.
Data collection tool
In the study, participants were presented with a questionnaire in the form of a personal interview. The questionnaire recorded demographic (age and sex) and anthropometric characteristics (e.g. height and body weight).
The severity of illness for CD was evaluated according to Best’s Crohn’s Disease Activity Index (CDAI), published in 1979. According to the CDAI calculation, it is classified as remission below 150 points, mild disease 150–220, moderate disease 221–450 and severe disease above 450 points(Reference Best, Becktel and Singleton15). The severity of the disease in patients with ulcerative colitis was evaluated according to the Mayo score criteria published in 1955. The Mayo score for ulcerative colitis disease activity provides an assessement of disease severity. The score can range from 0 to 12 with higher scores indicating worse severity. According to the Mayo score, the disease is classified as less than 2 points in remission, mild between 3 and 5 points, moderate between 6 and 10 points and over 11 points(Reference Lewis, Chuai and Nessel16).
In all the patients, a Nutritional Risk Screening (NRS-2002) was done at the beginning, middle and the end of study, to determine the level of malnutrition. Nutritional status screening and assessment were performed using the three-component NRS-2002 Questionnaire(Reference Kondrup, Allison and Elia17). The first component assesses the nutritional status across three separate items: BMI categories (<18·5, 18·5–20·5 (plus an additional item of impaired general condition for these two categories) and>20·5 kg/m2), weight loss categories (>5 % in 3 months, >5 % in 2 months and >5 % in 1 month (>15 % in 3 months)) and food intake as a proportion of the normal requirement in the preceding week (0 %–25 %, 25 %–50 %, 50 %–75 % and >75 %). The second and third components assess disease severity and age, respectively, with all subjects over 70 years being given an additional weighting. Weight loss was evaluated using either the patient’s own history or previous medical records, where available. Decreased food intake was assessed either subjectively by the patient’s history or objectively by nutritional diaries. The BMI cut-off value for diagnosing malnutrition was 18·5 kg/m2. The total NRS-2002 score (range 0–7) is the sum of the nutritional score, the disease severity score and the age adjustment. Patients with a total score of ≥3 were classified ‘nutritionally at risk’, and a nutritional care plan was initiated.
Anthropometric measurements
Participants’ body compositions were measured by TANITA MC 730 brand scale using the bioelectrical impedance analysis method. Body fat percentage, the amount of fat around the waist and BMI of patients were determined with the bioelectrical impedance analysis method. Upper middle arm circumference was measured by marking the midpoint between the acromion of the shoulder and the olecranon of the elbow, with the individual in an upright position and the arm flexed 90° at the elbow. Triceps skinfold thickness was also measured at the location marked with the Holtain Skinfold Caliper, after the upper middle arm circumference was measured, and the arm was released. Measured values were compared with age-appropriate NCHS percentile criteria. According to NCHS, <15th percentile: below normal, 15–85 percentile: normal and >85 percentile: above normal(Reference Pekcan and Alphan18).
Design of the study
At the beginning of the study, after the completion of the questionnaires, scale assessments and anthropometric measurements, participants were randomly assigned to one of two groups: a HPD or a high-protein diet supported with a HPDE. The medical nutrition therapy to be followed for 12 weeks was explained in detail, and individualised nutrition plans were provided to all participants.
A medical nutrition programme providing 1·5–2 g/kg/d protein and 25–30 kcal/kg/d energy was applied to the HPD group. The dietary energy distribution in the HPD group was approximately 25 % from protein, 40 % from carbohydrate and 35 % from fat. Participants in the HPDE group also received 1·5–2 g/kg/d protein and 25–30 kcal/kg/d energy; however, approximately half of their protein requirements were met through enteral nutrition support (Figure 1). In the HPDE group, approximately 85 % of total energy was provided by the enteral product and 15 % by dietary intake. Overall, the dietary intervention was designed to provide approximately 25 % of total energy from protein, 40 % from carbohydrate and 35 % from fat. Nestle Health Science’s enteral product Modulen IBD®, a polymeric whole-protein formula providing up to 1·5 kcal/mL and specifically designed for the nutritional management of IBD, was used for oral or tube feeding.
Diet therapy diagram. HPE, high-protein diet; HPDE, high-protein content diet group supported by enteral product.

Figure 1. Long description
A flowchart illustrating dietary treatment plans for individuals with different dietary groups. The dietary treatment plan involves providing 25-30 kcal/kg/d energy and 1.5-2 g/kg/d protein. The flowchart splits into two main groups: HPD and HPDE. In the HPD group, all protein requirements are met through dietary foods, and 100 percent of total energy comes from dietary nutrients. The energy distribution from food is 25 percent protein, 40 percent carbohydrate, and 35 percent oil. In the HPDE group, half of the protein requirement is met through enteral products and half through dietary nutrients. 85 percent of total energy comes from the enteral product, with a distribution of 12 percent protein, 38 percent carbohydrate, and 35 percent oil. 15 percent of total energy comes from dietary nutrients, with a distribution of 13 percent protein and 2 percent carbohydrate. The final energy distribution for the HPDE group is 25 percent protein, 40 percent carbohydrate, and 35 percent oil.
All participants were monitored weekly through face-to-face visits or telephone interviews to assess adherence to dietary treatment and disease-related symptoms. During these follow-up visits, participants were asked about their compliance with the prescribed dietary recommendations and enteral nutrition product use. Dietary counselling was reinforced. However, detailed quantitative data regarding actual energy intake, protein intake and enteral product consumption were not systematically recorded throughout the intervention period. Participant compliance with the prescribed nutritional intervention was evaluated by the researcher during the weekly follow-up visits based on self-reported adherence and enteral product use. At the second visit (week 6) and the third visit (week 12), the NRS-2002, CDAI and Mayo score were re-administered. In addition, anthropometric measurements were reassessed to evaluate treatment outcomes. The flow chart of the study is shown in Figure 2.
Study flow chart. HPD group included thirty patients, and HPDE group included thirty patients. HPE, high-protein diet; HPDE, high-protein content diet group supported by enteral product.

Statistical analysis
Statistical analyses were performed using the Statistical Package for the Social Sciences (SPSS) software (version 25.0, IBM Corp.). Categorical data were presented as numbers and percentages, while continuous data were summarised as mean ± standard deviation or median (percentiles), depending on the distribution of the data. If the assumptions for parametric tests were met, both intragroup and intergroup comparisons of measurements were performed using ANOVA. Post hoc pairwise comparisons were conducted using the Bonferroni test. Independent-groups t tests were used to compare patient characteristics and initial assessments between groups for continuous measurements, while the χ 2 test was employed for categorical data. To evaluate the time-dependent variation of intergroup scales, a two-factor variance analysis (two-way repeated-measures ANOVA) test was used for repeated measurements. Time-dependent intragroup comparisons of variables were determined using t tests and post hoc tests. The therapeutic effect size of the diets was calculated for hypothesis scales, namely NRS-2002, CDAI and Mayo, using the formula [(Average before Treatment)/Standard Deviation before Treatment]. Results were assessed at a 95 % CI, and a p-value <0·05 was considered statistically significant.
Results
33·3 % of individuals in the HPD group have a diagnosis of Crohn’s disease, and 66·7 % have a diagnosis of ulcerative colitis; 66·7 % of individuals in the HPDE group have a diagnosis of Crohn’s disease, and 33·3 % have a diagnosis of ulcerative colitis. 45·8 % of the respondents were men (n 22), and 54·2 % were women (n 26).
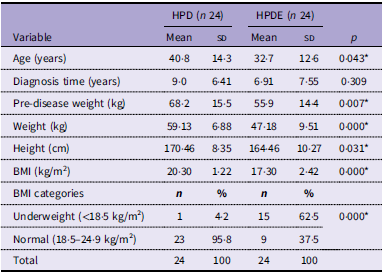
As indicated in Table 1, the mean age of the subjects participating in the study was 36·8 (sd 13·9) years, 40·8 (sd 14·3) years in the HPD group and 32·7 (sd 12·6) years in the HPDE group. The time of diagnosis was 9·0 (sd 6·41) years in the HPD group and 6·91 (sd 7·55) years in the HPDE group, and the pre-disease weight was 68·2 (sd 15·5) kg in the HPD group and 55·9 (sd 14·4) kg in the HPDE group. There is a statistically significant difference between the pre-disease weight according to the groups of participants; it was found that the HPD group had more weight than the HPDE group (p < 0·05).
Baseline characteristics of participants according to dietary groups

Table 1. Long description
The table presents baseline characteristics of participants divided into two dietary groups: HPD and HPDE, each with 24 participants. It includes variables such as age, diagnosis time, pre-disease weight, weight, height, and BMI. The table is structured with columns for each variable, showing mean values and standard deviations for both groups, along with p-values indicating statistical significance. The variables are grouped into two sections: continuous variables and BMI categories. The BMI categories section includes counts and percentages of participants classified as underweight or normal weight in each group. Notable trends include significant differences in age, pre-disease weight, weight, height, BMI, and BMI categories between the two groups.
HPD, high-protein diet group; HPDE, high-protein diet supported with enteral nutrition.
* p < 0·05.
The anthropometric measures measured at the beginning of the study and the categorical distribution of BMI are shown in Table 1 according to the dietary groups of the subjects. All subjects participating in the study had BMI values below 25 kg/m2. 95·84 % of subjects in the HPD group were of normal weight (18·5–24·9 kg/m2), and 62·5 % of subjects in the HPDE group were of low weight (<18·5 kg/m2). There is a statistically significant association between the groups of subjects in the study and the BMI (p < 0·05).
Table 2 presents the changes in anthropometric measurements during the 12-week intervention period. Both dietary groups showed significant improvements in body weight, BMI, upper arm circumference and triceps skinfold thickness from baseline to week 12 (p < 0·05). Body fat percentage remained stable in the HPD group, whereas a significant change was observed in the HPDE group during the study period. Furthermore, the improvements in body weight, BMI, upper arm circumference and triceps skinfold thickness were significantly greater in the HPDE group than in the HPD group (p < 0·05).
Changes in anthropometric measurements during the study period according to dietary groups

Table 2. Long description
A table comparing anthropometric measurements across dietary groups over 12 weeks. The table has 12 rows and 14 columns. Column headers include Group, Weight (kg), BMI (kg per square meter), Body fat percentage (percent), Upper centre arm circumference (centimeters), and Triceps (millimeters). Row labels include HPD and HPDE groups, with measurements at baseline, 6 weeks, and 12 weeks, along with changes over these periods. Notable trends include significant improvements in body weight, BMI, upper arm circumference, and triceps skinfold thickness from baseline to week 12 in both dietary groups. Body fat percentage remained stable in the HPD group, whereas a significant change was observed in the HPDE group. The improvements in body weight, BMI, upper arm circumference, and triceps skinfold thickness were significantly greater in the HPDE group than in the HPD group.
HPD, high-protein diet group; HPDE, high-protein content diet group supported by enteral product.
*p < 0·05.
Δ: Beginning of the study.
p 1: Intergroup comparison.
p 2: In-group between beginning of the study and 6-week comparison.
p 3: In-group between 6-week and 12-week comparison.
p 4: In-group between beginning of the study and 12-week comparing values.
p 5: Comparison of differences between beginning of the study and 12-week values of groups.
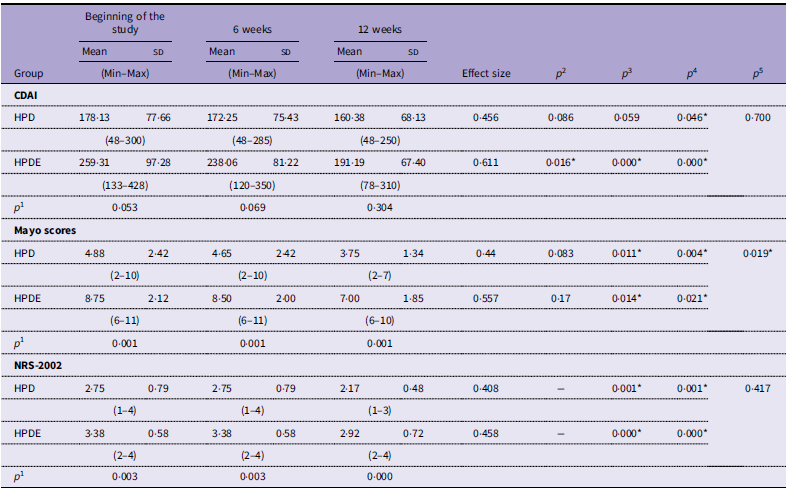
Table 3 presents the changes in disease activity and nutritional risk scores during the study period. Significant improvements in CDAI, Mayo and NRS-2002 scores were observed from baseline to week 12 in both the HPD and HPDE groups (p < 0·05). The magnitude of improvement from baseline to week 12 was significantly greater for Mayo scores in the HPDE group than in the HPD group (p < 0·05), while changes in CDAI and NRS-2002 scores were comparable between the groups (p > 0·05).
Changes in disease activity and nutritional risk scores during the study period according to dietary groups

Table 3. Long description
The table presents data on disease activity and nutritional risk scores for two dietary groups, HPD and HPDE, over a 12-week study period. It includes measurements at the beginning of the study, at 6 weeks, and at 12 weeks. The table is divided into three main sections: CDAI, Mayo scores, and NRS-2002. Each section lists the mean, standard deviation (SD), minimum, and maximum values for each time point. Additionally, the table includes effect sizes and p-values for statistical comparisons. Row 1: CDAI, HPD, Beginning of the study, Mean 178-13, SD 77-66, Min-Max (48-300). Row 2: CDAI, HPD, 6 weeks, Mean 172-25, SD 75-43, Min-Max (48-285). Row 3: CDAI, HPD, 12 weeks, Mean 160-38, SD 68-13, Min-Max (48-250). Row 4: CDAI, HPDE, Beginning of the study, Mean 259-31, SD 97-28, Min-Max (133-428). Row 5: CDAI, HPDE, 6 weeks, Mean 238-06, SD 81-22, Min-Max (120-350). Row 6: CDAI, HPDE, 12 weeks, Mean 191-19, SD 67-40, Min-Max (78-310). Row 7: CDAI, p1, Beginning of the study, 0.053. Row 8: CDAI, p1, 6 weeks, 0.069. Row 9: CDAI, p1, 12 weeks, 0.304. Row 10: Mayo scores, HPD, Beginning of the study, Mean 4.88, SD 2.42, Min-Max (2-10). Row 11: Mayo scores, HPD, 6 weeks, Mean 4.65, SD 2.42, Min-Max (2-10). Row 12: Mayo scores, HPD, 12 weeks, Mean 3.75, SD 1.34, Min-Max (2-7). Row 13: Mayo scores, HPDE, Beginning of the study, Mean 8.75, SD 2.12, Min-Max (6-11). Row 14: Mayo scores, HPDE, 6 weeks, Mean 8.50, SD 2.00, Min-Max (6-11). Row 15: Mayo scores, HPDE, 12 weeks, Mean 7.00, SD 1.85, Min-Max (6-10). Row 16: Mayo scores, p1, Beginning of the study, 0.001. Row 17: Mayo scores, p1, 6 weeks, 0.001. Row 18: Mayo scores, p1, 12 weeks, 0.001. Row 19: NRS-2002, HPD, Beginning of the study, Mean 2.75, SD 0.79, Min-Max (1-4). Row 20: NRS-2002, HPD, 6 weeks, Mean 2.75, SD 0.79, Min-Max (1-4). Row 21: NRS-2002, HPD, 12 weeks, Mean 2.17, SD 0.48, Min-Max (1-3). Row 22: NRS-2002, HPDE, Beginning of the study, Mean 3.38, SD 0.58, Min-Max (2-4). Row 23: NRS-2002, HPDE, 6 weeks, Mean 3.38, SD 0.58, Min-Max (2-4). Row 24: NRS-2002, HPDE, 12 weeks, Mean 2.92, SD 0.72, Min-Max (2-4). Row 25: NRS-2002, p1, Beginning of the study, 0.003. Row 26: NRS-2002, p1, 6 weeks, 0.003. Row 27: NRS-2002, p1, 12 weeks, 0.000.
CDAI, Crohn’s Disease Activity Index Mayo score: the Mayo score for ulcerative colitis disease activity; HPD, high-protein diet group; HPDE, high-protein content diet group supported by enteral product; NRS-2002, Nutritional Risk Screening.
*p < 0·05.
p 1: Intergroup comparison.
p 2: In-group between beginning of the study and 6-week comparison.
p 3: In-group between 6 week and 12-week comparison.
p 4: In-group between beginning of the study and 12-week comparing values.
p 5: Comparison of differences between beginning of the study and 12-week values of groups.
Discussion
In clinical environments, patients with IBD often experience various nutritional deficiencies and have shown changes in anthropometric parameters. They typically have low body weight, reduced fat body composition, muscle mass and bone mineral density. Most studies, based on BMI analysis, have reported a high prevalence of malnutrition among patients with IBD, particularly those with Crohn’s disease(Reference Scaldaferri, Pizzoferrato and Lopetuso19,Reference Ulitsky, Ananthakrishnan and Naik20) . All participants had baseline BMI values below 25 kg/m². The mean BMI was 20·30 (sd 1·22) kg/m² in the HPD group and 17·30 (sd 2·42) kg/m² in the HPDE group, indicating that the study population was generally characterised by low body weight and an increased risk of malnutrition.
When the changes in anthropometric measurements, taken at the beginning of the study, in the sixth week, and in the twelfth week, are examined, a statistical difference is observed in all categories for changes in weight, BMI, upper middle arm circumference and triceps values (p < 0·05), as shown in Table 2. Triceps and upper middle arm circumference measurements, which are criteria for detecting malnutrition, exhibited notable increases. The observed improvements in measurements during the dietary treatment suggest that nutritional interventions and recommendations for a healthy diet can influence the anthropometric measurements of individuals.
The European Parenteral and International Nutrition Association has published guidelines for assessing the nutritional status of hospitalised patients and recommends the use of NRS-2002 to identify patients at risk of malnutrition in a hospital setting(Reference Kondrup, Allison and Elia17,Reference Barendregt, Soeters and Allison21) . Therefore, NRS-2002, as proposed by ESPEN, was utilised in this research. At baseline, NRS-2002 scores differed significantly between the HPD and HPDE groups (p < 0·05). NRS-2002 scores decreased significantly from baseline to week 12 in both groups (p < 0·05), indicating an improvement in nutritional risk status. However, the magnitude of change did not differ significantly between the groups (p > 0·05). These results suggest that nutritional interventions may contribute to reducing malnutrition risk in patients with IBD.
According to previous studies, the factors that have the most significant impact on malnutrition include clinical activity, a history of abdominal surgery and the ability to maintain a diet during disease flare-ups(Reference Casanova, Chaparro and Molina22). In the present study, CDAI scores decreased over the 12-week intervention period in both dietary groups. A statistically significant reduction in CDAI scores from baseline to week 12 was observed in both the HPD and HPDE groups (p < 0·05). However, the magnitude of change in CDAI scores did not differ significantly between the groups (p > 0·05), suggesting that both nutritional interventions were associated with improvements in disease activity.
To date, two studies have examined the impact of enteral nutrition support on the quality of life of patients diagnosed with Crohn’s disease. Both studies reported a significant improvement in the quality of life of patients receiving enteral nutrition(Reference Kuriyama, Kato and Morimoto23,Reference Guo, Wu and Zhu24) .
In a retrospective study conducted in 2017, it was observed that the utilisation of enteral products in patients with Crohn’s disease was associated with a reduction in the need for surgical interventions. Enteral nutrition support for patients requiring surgery was linked to increased albumin levels, lower C-reactive protein levels, a decreased risk of post-operative complications and shorter post-operative hospitalisation times compared with the group not receiving enteral nutrition support(Reference Zhu, Xu and Liu25). The European Society for Clinical Nutrition and Metabolism recommends nutritional support for individuals with identified malnutrition in IBD(Reference Li, Ney and Eslamparast26). The improvements in CDAI scores observed in the present study are consistent with these results and support the beneficial role of nutritional support in the management of Crohn’s disease.
As presented in Table 3, Mayo scores decreased over the course of the study in both dietary groups. Statistically significant reductions were observed between week 6 and week 12, as well as between baseline and week 12, in both the HPD and HPDE groups (p < 0·05). In addition, the magnitude of change in Mayo scores from baseline to week 12 differed significantly between the groups (p < 0·05). Numerically, the reduction in Mayo scores was greater in the HPDE group than in the HPD group, suggesting a potentially greater effect of enteral nutrition-supported dietary treatment on ulcerative colitis disease activity. However, this result should be interpreted cautiously because baseline Mayo scores were higher in the HPDE group.
Unlike Crohn’s disease, there is limited research on the efficacy of enteral nutrition in patients with active ulcerative colitis. In a prospective randomised study, the effectiveness of total enteral nutrition and total parenteral nutrition as additional treatments for patients with acute severe ulcerative colitis receiving intensive corticosteroid therapy was compared. Neither group showed significant changes in anthropometric parameters. In another study, seventeen patients with severe ulcerative colitis were treated with enteral nutrition using a polymeric formula after 48 h of intensive medical treatment. The formula concentration and volume were gradually increased. Enteral nutrition was well tolerated by fourteen out of seventeen patients, with eleven patients meeting more than 80 % of their daily calorie requirements. This suggests that enteral nutrition support is safe and effective for patients experiencing severe ulcerative colitis attacks(Reference Triantafillidis, Vagianos and Papalois11). The results of the present study are in agreement with these observations, demonstrating significant improvements in Mayo scores over time in both dietary groups. Although greater numerical improvements were observed in the enteral nutrition-supported group, baseline differences between groups warrant cautious interpretation of this result.
Overall, the results of the present study suggest that nutritional support, whether provided through a HPD alone or in combination with enteral nutrition, may contribute to improvements in anthropometric measurements, nutritional risk status and disease activity in patients with IBD. The enteral nutrition-supported group showed greater improvements in several anthropometric parameters and Mayo scores; however, no significant between-group differences were observed in CDAI or NRS-2002 score changes.
This study has several limitations that should be acknowledged. First, the sample size was relatively small, which may limit the generalisability of the results. Second, baseline differences were observed between the study groups. Participants in the HPD group were older and had a higher baseline body weight than those in the HPDE group. These differences may have influenced nutritional requirements, body composition changes and the response to nutritional intervention during follow-up. Therefore, the observed differences between groups should be interpreted with caution. Nevertheless, both groups demonstrated improvements in nutritional risk scores, disease activity indices and anthropometric parameters throughout the study period. Future studies with larger and more homogeneous populations are needed to confirm these results.
Conclusions
The results of this study suggest that both high-protein dietary treatment and high-protein dietary treatment supported with enteral nutrition were associated with improvements in nutritional status, anthropometric measurements and disease activity scores in patients with IBD. Significant improvements were observed for all participants in body weight, BMI, upper arm circumference, NRS-2002 scores and disease activity indices during the 12-week intervention period.
Although greater improvements were observed in several outcome measures in the enteral nutrition-supported group, baseline differences between the groups should be considered when interpreting these results. Therefore, the potential additional benefits of enteral nutrition support require confirmation in larger, well-controlled studies.
Regular nutritional risk screening and individualised nutrition therapy delivered by experienced dietitians as part of a multidisciplinary team may contribute to improved nutritional and clinical outcomes in patients with IBD.
Data availability statement
The data that support the findings of this study are available from the corresponding author upon reasonable request.
Acknowledgements
The authors thank all participants.
Kübra Derya İpek: Conceptualization-Equal, Data curation-Equal, Formal analysis-Equal, Investigation-Equal, Methodology-Equal, Project administration-Equal, Writing - original draft-Equal, Writing - review & editing-Equal. Hande Öngün Yılmaz: Conceptualization-Equal, Data curation-Equal, Formal analysis-Equal, Methodology-Equal, Project administration-Equal, Writing - original draft-Equal, Writing - review & editing-Equal.
All authors contributed to the study’s conception and design. K.D.İ. conceived and designed the study, collected the data, conducted the intervention and drafted the manuscript. H.Ö.Y. contributed to the study design, supervised the research process, interpreted the data, drafted the manuscript critically revised the manuscript and approved the final version. Both authors read and approved the final manuscript.
This research received no specific grant from any funding agency, commercial or not-for-profit sectors.
The authors have no competing interests to declare that are relevant to the content of this article.
The study was approved by the Clinical Research Ethics Committee of Yeni Yüzyıl University (Decision No: 2020/035 dated 13 August 2020). All procedures were in accordance with ethical standards of the institutional and/or national research committee and with the 1964 Helsinki declaration and its later amendments or comparable ethical standards.
Informed consent was obtained from all individual participants included in the study.




 Open access

