Introduction
Compelling evidence shows that early life adversity, including prenatal conditions, can negatively impact cognitive development and social functioning and increase the risk for acute and chronic health problems, mental illness, and deviant behaviorReference Anda, Butchart, Felitti and Brown1,Reference Felitti, Anda and Nordenberg2 . In particular, adverse childhood experiences (ACEs) resulting from childhood abuse (physical, sexual, or emotional) and neglect (physical or emotional), household dysfunction (e.g., intrafamilial violence) and hostile social environment have detrimental consequences on the well-being at long term, decreasing life expectancy and increasing the risk of noncommunicable chronic diseasesReference Brown, Anda and Tiemeier3,Reference Dong, Giles and Felitti4 .
Based on the strong relationship with adult health and the long-term consequences of ACE, many studies have aimed to identify molecular mediators that may register early-life experiencesReference Ridout, Coe and Parade5,Reference Ridout, Khan and Ridout6 . In this regard, epigenetic mechanisms, such as DNA methylation, histone modifications, and ncRNAs, may result in a distinctive epigenetic signature of genes whose potential expression has been previously primed during early stages of life, and these epigenetic signatures may differ from that impinged by pregnancy or neonatal stressReference Oh, Jerman and Silverio Marques7,Reference Lang, McKie and Smith8 . Pioneer studies from Weaver and colleagues showed that maternal neglect in rats affects stress responses in the adult offspring, an effect mediated by the altered expression of the glucocorticoid receptor, resulting from changes in the DNA methylation pattern of the Nr3c1 gene promoterReference Weaver, Cervoni and Champagne9. Since that report, several studies have reported epigenetic changes in peripheral tissues (i.e., circulating blood cells and saliva) from subjects with a history of ACEReference Krause, Artigas, Sciolla and Hamilton10.
Moreover, it appears that different forms of childhood maltreatment, not surprisingly, produce distinct effects on particular brain regions and circuits and the heterogeneity of the patient’s past and more recent experience represents another important variableReference Walsh, Dalgleish and Lombardo11,Reference Narita, Fujihara and Takei12 . Evidence from combined imaging genetics and genetic studies has revealed the importance of selective polymorphisms of candidate genes as particularly impactful on provocative funtional magnetic resonance imaging (fMRI) studies of, for example, amygdala responsiveness to fearful stimuliReference Nemeroff13. Nonetheless, there is no consensus regarding an epigenetic biomarker or profile for ACEReference Krause, Artigas, Sciolla and Hamilton10,Reference Jiang, Postovit, Cattaneo, Binder and Aitchison14 . The latter may result from the interaction of multiple factors such as age, sex, degree of adversity, and lack of transcriptional effects of DNA methylation changes studiedReference Krause, Artigas, Sciolla and Hamilton10,Reference Jiang, Postovit, Cattaneo, Binder and Aitchison14 . For instance, scoring ACE is difficult considering the retrospective and subjective evaluation of each subject that can be influenced by additional positive childhood experiences and current life stress at the moment in which a subject participates in a studyReference Oh, Jerman and Purewal Boparai15. Similarly, several reports show a sex-dependent effect of ACE, as well as accelerated aging that is more evident in older subjectsReference Lang, McKie and Smith8. In this regard, many of the reported DNA methylation changes occur in intergenic regions whose biological significance remains unsolved and therefore may bias the identification of epigenetic markers playing a role in gene expression.
To tackle these issues, a meta-analysis of genome-wide DNA methylation based on Gene Expression Omnibus (GEO) datasets focused on gene regions that show a DNA methylation–gene expression relationship was performed, in subjects with very high and very low exposure to ACE, according to their Childhood Trauma Questionnaire (CTQ) score (Fig. 1). Furthermore, comparison between control and ACE subjects considered sex, age ranges, and were complemented with transcriptomic reports in a comparable group.
Methylome and transcriptome datasets selection diagram. The current Childhood Adverse Events (ACE) meta-analysis begins with the selection of 26 Gene Expression Omnibus (GEO) datasets identified with the keywords “ACE” and “Epigenetics.” The attention was focused on those ACE reports having methylome and transcriptome available arrays, specifically on those including raw and meta-data, as well as the Childhood Trauma Questionnaire (CTQ) score for each patient. Finally, two studies were selected: GSE72680 Cohort 1, used as the Discovery Library (methylome arrays), and GSE70603 45-min pre-stress group, used as the Comparison Library (transcriptomic arrays).

Methods
Methylome arrays datasets selection and databases construction
Data search was conducted according to PRISMA guidelines (https://www.equator-network.org/reporting-guidelines/ prisma/). This meta-analysis concerning Childhood Adverse Events (ACE) was based on the selection of 26 GEO databases, under the keywords ACE and epigenetics. Even though the output of the mentioned approach included ACE, post-traumatic stress disorders, panic disorders, and others, this study focused on reports based on ACE and methylome/transcriptomic platforms, specifically those having available raw and meta-data, including the CTQ score for each patient. Based on all the above, two studies with epigenomic data from the same array (Illumina 450K) were selected; however, preliminary analysis showed a considerable batch effect, and the dataset with the large number of cases was used for the study (Fig. 1, Supplementary Figure 1). From GSE72680Reference Zannas, Arloth and Carrillo-Roa16 used samples belonging to Cohort 1 group of the “DNA Methylation of African Americans from the Grady Trauma Project” (referred as Discovery Library) and GSE70603Reference Schwaiger, Grinberg and Moser17 in the case (German subjects from the study “Investigation of gene expression responses to acute stress exposure in adults with early childhood adversity experience”), 45-min pre-stress group was included in the current analysis, being used as the Comparison Library.
After downloading the available meta-data, as well as the methylome and transcriptomic arrays raw data, methylome databases were constructed. To identify the effect that the methylation within the promoter and the first gene segment has on its expression, probes were filtering, keeping only those probes that localize within one of the following gene segments: first exon, 5’UTR, TSS200, or TSS1500 based on previous observation related with DNA methylation levels and gene expression in human cellsReference Luo, Bai and Yang18. The CTQ scores range and the number of total samples corresponding to each one of the CTQ terciles, as well as the number of selected probes, are shown in Table 1.
Discovery Library tertiles description

CTQ, childhood trauma questionnaire.
Exploratory analysis
Discovery Library samples were divided into terciles (i.e., T1, T2, and T3), according to CTQ score distribution, where T1 represents patients with the lowest CTQ scores, while T3 the highest (Table 1). Considering the difficulties to establish clear cutoff for substantial and non-substantial exposure to ACE, only T3 (high CTQ score, ACE) and T1 (low CTQ score, controls) were used for analysis. Exploratory steps carried out, in both for Discovery and Comparison libraries, were based on principal component analysis (PCA), to visualize the distribution and grouping of the samples, and based on their clinical ACE versus control condition. Since this algorithm reduces the dimensionality of the data keeping the directions with the highest variability, the distribution of the sample is plotted in the base of these directions or principal components and the samples are expected to group according to the main differences or similarities between themReference Ringner19. Samples grouping according to other variables, such as sex, age, and BMI, were explored in the base of their PCAs was also performed. For differentially methylated CpG sites (DMCs) analysis, data were fitted using linear models for microarrays data, using the R limma packageReference Ritchie, Phipson and Wu20, and data were normalized by quantilesReference Liu, Li and Liu21. All the analyses were performed using the R Software, 3.6.3 version (https://cran.rproject.org/).
Differentially expressed genes analysis
Differentially expressed genes (DEGs) analysis was performed in parallel in groups over 40 years old (40<age<49 and 50<age) belonging to the Comparison Library, following the same procedure used for DMCs obtention. After DMCs and DEGs were determined in parallel, common genes between the resultant hypo-/hypermethylated CpG sites and the up-/downregulated genes were obtained, respectively. The integration of these results with DMC was performed in both 40<age<49 and 50<age groups, independently.
Functional analysis
Overlapping genes between DNA methylome and transcriptome data were detected visually through Venn diagrams analysis using Venny 2.1 (https://bioinfogp.cnb.csic.es/tools/venny/). Concordance in DMC among different age ranges studied were analyzed by chord plots using the web tool Circos (http://mkweb.bcgsc.ca/tableviewer/visualize/) Reference Krzywinski, Schein and Birol22. Gene subsets were created including these overlapping genes, and these gene subsets were labeled according to the direction of the changes (downregulated/hypomethylated; upregulated/hypomethylated; downregulated/hypermethylated; upregulated/hypermethylated). Each subset was submitted to Gene Ontology (GO) biological process enrichment analysis using the web tool InnateDB (https://www.innatedb.com/).
Statistical analysis
Comparison of DNA methylation profiling was based on Limma statistical analysis, by comparing the mean methylation level of each probe (beta value). Differences considered the following cutoff, a P-value < 0.05 with and adjustment for multiple comparisons using a false discovery rate (FDR, Benjamini–Hochberg) < 0.05. Fold changes were expressed as mean methylation level of a probe relative to contrast condition (i.e., non-ace, age, sex), and transformed to log(2) for graph ploting. Analysis of global changes in DNA methylation was compared by one-way ANOVA using the software GraphPad Prism 8.
Results
Methylome array exploratory analysis and DMCs
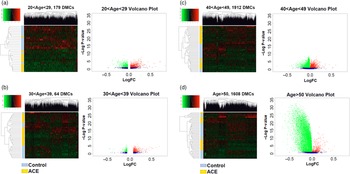
Comparison of genome-wide DNA methylation changes between control and ACE subjects, as well as comparison by sex in the Discovery Library, showed no clear separation by PCA (Fig. 2a and 2b), with very few DMCs, after correction with an FDR < 0.05 (data not shown). Nevertheless, when subjects within each group were separated by age ranges (i.e., 20–29; 30–39; 40–49; 50–77), no clear PCA grouping was observed (Fig. 2c–2f), but epigenetic differences between ACE and control conditions were higher and with several DMCs over the cutoff values applied, especially in subjects above 40 years. After DMCs analysis for each one of the age ranges, samples partially clustered according to their ACE history (Fig. 3), and this effect resulted more evident in 20<age<29 and in 30<age<39 groups (Fig. 3a and 3b). The number of the epigenetic differences associated with ACE was higher in older subjects (Fig. 3 volcano plots), and most of them were hypomethylation marks. The number of DMCs and genes with changes in methylation within each age range is detailed in Table 2. In young adults (20–39 years old) most of the DMCs occurred as single-gene changes, while older subjects showed a higher proportion of DMC within each gene (Supplementary Table 1).
Visualization of Discovery Library samples distribution. Principal component analysis (PCA) was performed on the samples from the Discovery Library (n = 189) for visual analysis. An initial assessment was performed with the whole library based on (a) CTQ score terciles and (b) sex. To evaluate the impact of age, PCA was performed based on CTQ score terciles at different age ranges: (c) 20–29 years; (d) 30–39 years; (e) 40–49 years; and (f) 50 years old and older. Red: ACE (n = 95); blue: control (n = 94); purple: female (n = 137); yellow: male (n = 52).

Age-dependent fluctuations on DNA methylation associated with ACE. Heatmaps for the DMCs and their respective gene and CpGs dendrograms obtained in the different age groups based on CTQ score and sex (a–d). Volcano plots are also included showing significant differences in CpG methylation. Green: hypomethylated; red: hypermethylated. Values expressed as log(2) of fold change and log of P-value.

Differentially methylated CpG sites obtained according to age ranges

DMCs, differentially methylated CpG sites
Comparison of DMC profiles by decades in adults with ACE history
Considering that the number of DMCs in young adults with ACE history were less than 10% of those observed in subjects over 40 years, DMC occurring in the first two decades were searched in older groups showing a partial and non-preserved representation of hypomethylations across different ages (Fig. 4a). Furthermore, none of the hypermethylation changes observed in young adults were found in subjects over 50 years old (Fig. 4b). Additionally, global changes in DNA methylation across decades were different for hypomethylation (values as mean of fold change with [interquartile range]; 20s, 0.93 [0.88–0.95]; 30s, 0.96 [0.95–0.97]; 40s, 0.96 [0.93–0.97]; 50s, 0.84 [0.81–0.86]) (Fig. 4c) and hypermethylation (20s, 1.14 [1.08–1.20]; 30s, 1.08 [1.06–1.37]; 40s, 1.05 [1.04–1.08]; 50s 1.18 [1.17–1.23]) (Fig. 4d). The lack of concordance in genes with DMC among age ranges, either considering general changes or hyper- and hypomethylation, was also observed between the 40s and 50s (Supplementary Figure 2). Independently of probes or genes with DMC, comparison of top 10 hypo- and hypermethylated probes within each decade showed that fold changes were comparable among highly variable probes (Table 3).
Similarities in age-dependent changes in DNA methylation associated with ACE. Schematic representation of genes with DMC found in 20–29 years and 30–39 years, and their occurrence in older groups for (a) hypo- and (b) hypermethylations. Age–gene connecting ribbons represent the occurrence of a DMC for that gene in the corresponding decade, and concordance among age ranges is denoted by the concurrence of ribbons to a defined gene. Violin plots showing the distribution of changes in methylation (c, hypomethylation; d, hypermethylation) at different age ranges in ACE subjects. Values expressed as median (solid line) and interquartile range (red dotted lines), small letters denoting significant differences (P < 0.05) with 20–29 years (a), 30–39 years (b), 40–49 years (c), and over 50 years (d), one-way ANOVA.

Top 10 hypo- and hypermethylated probes by decade

Data expressed as mean DNA methylation (DNAm; 0–1) and fold change of DNAm in ACE relative to control; Adj. P-val, adjusted P-value.
Comparison of epigenomic and transcriptomic effects of ACE
To compare the epigenetic and transcriptomic changes related to ACE as molecular markers of childhood adversity, DEG analysis was performed using a dataset of peripheral blood mononuclear cells (PBMCs) in adult subjects reporting CTQ score. A unique dataset (GSE70603) with transcriptomic results in a comparable sample type (i.e., PBMC) was found according to the search term used, representing data from a cohort comprised of adults over 40 years old from Germany. As occurred with DNA methylation analysis, transcriptomic changes, in subjects between 40 and 49 years old, did not separate samples according to CTQ or sex in PCA (Fig. 5a and 5b). However, clear clustering was noticed according to DEG (Fig. 5c) between ACE and control subjects aged between 40 and 49 years, with a higher proportion of upregulated genes (876 up- vs. 688 downregulated transcripts) (Fig. 5d). Similarly, transcriptomic changes in subjects over 50 years old did not separate samples according to CTQ or sex in PCA (Fig. 6a and 6b), but there was a clear clustering according to DEGs, (Fig. 6c), with a higher proportion of upregulated genes (1016 up- vs. 856 downregulated transcripts) (Fig. 6d).
Differential expression analysis of subjects between 40 and 49 years old from the Comparison Library. (a) PCA for gene expression data of subjects between 40 and 49 years old (n = 17), classified according to their CTQ score category. Red: ACE. (n = 8); light blue: control (n = 9). (b) PCA for gene expression data from the samples classified by sex. Purple: female (n = 10); yellow: male (n = 7). (c) Heatmap for gene expression data classified by the CTQ score category. Orange: ACE; light blue: control; red: downregulated; green: upregulated. The sex of each subject is indicated on the right side of the heatmap. (d) Volcano plot for gene expression data of the samples. Red: downregulated, green: upregulated.

Differential expression analysis of 50-year-old subjects or older from the Comparison Library. (a) PCA for gene expression data of 50-year-old subjects or older (n = 42), classified according to their CTQ score category. Red: ACE. (n = 22); light blue: control (n = 20). (b) PCA for gene expression data from the samples classified by sex. Purple: female (n = 29); yellow: male (n = 13). (c) Heatmap for gene expression data classified by the CTQ score category. Orange: ACE; light blue: control; red: downregulated; green: upregulated. The sex of each subject is indicated on the right side of the heatmap. (d) Volcano plot for gene expression data of the samples. Red: downregulated, green: upregulated.

The concordance between genes with DMCs and differential expression was addressed by Venn diagram analysis. Based on those genes sharing transcriptional and methylation changes in subjects over 50 years of age (Fig. 7a), functional enrichment of GO biological processes were determined (Table 4, Supplementary Table 2). Most of the hypomethylation changes were associated with upregulated genes. More than 50% of biological processes associated with upregulated genes and hypomethylation were also associated with downregulated genes (Fig. 7b). Additionally, most of these biological processes, common in upregulated genes as well as in hypomethylated CpG sites, were related to nervous system physiology and development (Fig. 6c).
Associations and functional analysis of differentially methylated and differentially expressed genes in 50+ years old ACE subjects. (a) Differentially methylated (n = 818) and expressed (n = 1232) genes (adjusted P-value < 0.05) listed in the 50+ years old ACE subject subsets from the Discovery and Comparison libraries were selected. Venn diagram analysis revealed that 48 genes are present in both subsets. (b) Venn diagram analysis for the genes from the databases included in the study, classified according to the direction of the change in DNA methylation (hypo- or hypermethylated) and gene expression (down- or upregulated) (adjusted P-value < 0.05 for all the genes included). (c) List of biological processes enriched in the subset of hypomethylated/upregulated genes (n = 33), in the 50+ years old ACE subject subset.

Enriched pathways for upregulated genes with hypomethylated regions in ACE subjects over 50 years old

Discussion
This meta-analysis aimed to determine the effect of high levels of ACE on the DNA methylation profile within gene expression-related regions in circulating cells, to further identify potential markers of childhood trauma. Further comparative analysis of transcriptomic changes related to ACE was performed to support the programming of biological processes. These data showed that ACE did not result in methylome changes when ACE subjects from different ages are considered, but there was an evident effect in subjects over 40 years old, in a sex-independent manner. Progressive changes in DNA methylation were associated with hypomethylation, which was more consistent in aged subjects and paralleled by increased gene expression in the comparison cohort. Furthermore, DNA methylation and transcriptomic profiles allowed to cluster subjects within each age range (40–49 years and over 50s) according to their exposure to ACE, and both profiles were associated with enriched biological processes related to the nervous system homeostasis and cortisol response. Altogether, these results suggest that ACE primes epigenetic and transcriptomic changes more evident in mature adults and suggest a potential window for interventions in young adults in which no prominent changes are observed.
Compelling evidence shows that ACEs, including prenatal conditions, can negatively impact cognitive development, chronic health problems, mental illness, impaired social functioning, and deviant behavior during the life courseReference Anda, Butchart, Felitti and Brown1–Reference Dong, Giles and Felitti4. Current knowledge largely relied on observational data and are thus limited by endogeneity bias, have retrospective designs, and show substantial heterogeneity in ACE definitions; therefore, there is a lack of causal relationships, with mechanisms and pathways poorly understood. Several reports have suggested that epigenetic mechanisms are at the forefront of how early-life experiences alter gene expression, frequently over the lifetime of the organismReference Nemeroff13. Despite a growing number of studies concerning gene-specific and genome-wide DNA methylation changes, no consensus epigenetic biomarker for ACE has been identifiedReference Krause, Artigas, Sciolla and Hamilton10,Reference Palma-Gudiel, Cordova-Palomera, Leza and Fananas23 . One of the main issues in DNA methylation profiling studies is the functional relationship between changes in CpG methylation and gene expression. DNA methylation has been frequently associated with decreased gene expression; however, there is a complex interplay between the context and time in which a change in DNA methylation occurs and its effect on gene expression, and there is no clarity regarding the biological significance of intergenic DNA methylation changesReference Jones24,Reference Luo, Hajkova and Ecker25 . Nonetheless, a recent study in human embryos suggests that DNA methylation within the gene promoter and first exon shows the best correlation with gene expressionReference Luo, Bai and Yang18. Conversely, diverse samples and methods to determine DNA methylation have been applied, decreasing the applicability of the current knowledgeReference Teschendorff and Relton26,Reference Chatterjee, Rodger, Morison, Eccles and Stockwell27 . To overcome these issues, and to unveil an epigenomic mark for ACE with potential biological consequences, we searched DNA methylation datasets from studies reporting CTQ score, using peripheral blood cells, and similar profiling platforms to perform a meta-analysis only considering CpG sites within gene promoters and first exons. Based on the selection criteria, a dataset from the Grady Trauma Project sample was selected (GSE72680), and extreme CTQ score terciles were defined as control (no ACE, low CTQ score tercile) and ACE (high CTQ -tercile).
A comparison of DNA methylation profile between ACE and control subjects showed very few DMCs between ACE and no ACE subjects. Further analysis considering sex showed no differences. Notably, there are no comparable results between the present data and the original study from Zannas and colleaguesReference Zannas, Arloth and Carrillo-Roa16 on this cohort, which focused on DNA methylation as an aging predictor. Furthermore, other related studies using data from this cohort have validated some epigenetic markers with partial successReference Clive, Boks and Vinkers28,Reference Rosen, Robertson and Hlady29 . In contrast, a study including two cohorts of adult women with ACE history shows no association between cumulative ACE score and DMCs, but some differentially methylated regions are scarcely replicated between each cohortReference Houtepen, Hardy and Maddock30. Another study comparing epigenetic markers in young adults with ACE shows comparable changes in females and malesReference Guillemin, Provencal and Suderman31, suggesting that sex-specific epigenetic marks of ACE remain elusive. Additionally, other studies have revealed a relatively low number of, either, CpG sites or regions differentially methylated (<1,000) in adult subjects, considering the large number of sites assayed (from 20,000 up to more than 400,000)Reference Suderman, Borghol and Pappas32–Reference Prados, Stenz and Courtet35. Altogether, this suggests that potential epigenetic markers of ACE may be masked by analysis strategies used, and further studies to identify common markers of childhood adversity are required.
Considering chronological age as an important source for changes in DNA methylation, this study compared the methylation profile among age ranges in ACE subjects. As the main result, DMC in young adults was barely found in older subjects with ACE history. While chronological age is arguably the strongest risk factor for aging-related death and disease, it is important to distinguish chronological time from biological aging. One potential biomarker that has gained significant interest in recent years is DNA methylation (DNAm), which may reflect a marker for aging using the Horvath’s clockReference Horvath36. In this regard, it has been demonstrated in the cohort from which the dataset for this meta-analysis was obtained, that ACE is associated with accelerated agingReference Zannas, Arloth and Carrillo-Roa16. In this study, nested comparison of control and ACE subjects according to decades showed that either low CTQ or high CTQ subjects show epigenomic modifications unstable in time. Additionally, aged subjects with ACE showed the highest intensity and number of DMCs, and similar findings have been observed in terms of the Horvath’s clock. These differences found in subjects with ACE over 50 years old occurred in spite of this group have a narrow age range (i.e., 50–63 years, mean age 55 years) compared with control group (i.e., 50–77 years, mean age 56 years). Differentially methylated genes reported in studies considering subjects in the 20sReference Guillemin, Provencal and Suderman31,Reference Roberts, Gladish and Gatev33,Reference Provencal, Suderman and Guillemin34,Reference Naumova, Hein and Suderman37 , 30sReference Prados, Stenz and Courtet35, and over 40sReference Houtepen, Vinkers and Carrillo-Roa38–Reference Marinova, Maercker and Kuffer40 are not comparable, supporting that the methylome profile of aged ACE subjects is not comparable with ACE young adults.
In contrast, several studies have shown the association between different sources of ACE and epigenetic markers of accelerated aging in adultsReference Lang, McKie and Smith8,Reference Austin, Chen and Ross41–Reference Lawn, Anderson and Suderman43 , an effect that may be evident since childhoodReference Austin, Chen and Ross41,Reference Jovanovic, Vance and Cross44,Reference Marini, Davis and Soare45 . To address the consequences of these differences in age-related epigenetic markers of ACE, we performed a by-decade analysis of transcriptomic datasets from circulating blood cells in datasets including subjects in middle and late adulthoodReference Schwaiger, Grinberg and Moser17. Complementary to the data in DNA methylation, differentiation by decades resulted in a sex-independent clustering of ACE and non-ACE subjects, with a higher effect in upregulated genes in older subjects. However, there was a poor concordance among differently methylated and DEGs, but a significant correspondence in enriched biological processes. It is worth noting that several of these enriched processes in older subjects were related to nervous system homeostasis and stress response. A limited correlation between DEGs and their promoter methylation has been reported in adults with ACE; however, that study only reports the enriched biological processes related to gene expression with no further data on DNA methylationReference Mehta, Klengel and Conneely46. Furthermore, the relationship between DNA methylation and gene expression in these samples can be moderated by cis- and trans-regulatory mechanismsReference Kennedy, Goehring and Nichols47. Conversely, previous studies show that the aging-related magnitude of epigenetic changes associated with ACE differs between subjects in early and middle-to-late adulthood, with a higher effect in the latter groupReference Fiorito, Polidoro and Dugue42,Reference Lawn, Anderson and Suderman43 , which may result from further exposure to adversity after childhoodReference Zannas, Arloth and Carrillo-Roa16. Altogether, this data suggest that ACE may prime aging and support our findings regarding a progressive epigenetic differentiation in middle and late adulthood, which potentially involves the regulation of nervous system-related biological processes.
A considerable limitation in the current evidence in that inclusion of genetic and biological evidence is necessary for understanding the effects of ACEs and their intergenerational transmissionReference Nemeroff13. A growing body of evidence suggests that genotypes can modify sensitivity to environmental adversity. Promising avenues of research in this area include gene–experience interaction, the influence of early-life experience on genomic expression (epigenetics), and the role of inflammationReference Krause, Artigas, Sciolla and Hamilton10. In this regard, further studies should integrate genetic and epigenetic markers with transcriptomic profiling, considering more restricted age ranges and non-biased methodologies (e.g., machine learning analysis) to unveil the effects of ACE. Additionally, these results may be biased by a different number of subjects within each range compared, but no association between the number of subjects in each group and the number of probes differentially methylated, as it evidenced in 40s and <50 comparisons, was observed in this report. Additionally, adjusted P-values were comparable between the three youngest decades, despite the low number of subjects in 20s group. Conversely, the datasets used for the Discovery and Comparison studies comprised subjects from two different populations, which limits the potential significance of the proposed pathways involved in the long-term effects of ACE suggested in this study. In this regard, further studies are required to confirm a potential epigenetic-mediated regulation of gene expression in ACE adults, including the factors previously discussed, with special attention in the effect of ageReference Krause, Artigas, Sciolla and Hamilton10.
Conclusions
This study provides evidence that the epigenetic effects of ACE are age-dependent and not defined in the long term. DNA methylation in ACE subjects changes as aging proceeds, an effect characterized by increased hypomethylation in middle and late adult subjects, which are related to up- and downregulated biological processes involved in nervous system physiology, development, and behavior. The differences in the DNA methylation profile, and aging effects between early, middle, and late adulthood, suggest a very interesting window for interventions aimed to prevent the detrimental effects of ACE in young adults.
Supplementary material
To view supplementary material for this article, please visit https://doi.org/10.1017/S2040174420001075
Authors Contributions
RA carried out the data mining, database construction, data analysis process including both the DMCs and the DEGs obtention, and the manuscript writing. FV performed the functional analysis. JH and BJK conceived the study and contributed to the experimental design, teamwork supervision, and manuscript writing.
Conflict of interest
None.