


Introduction
Endometrial cancer is the sixth most common malignant disorder worldwide. Reference Koskas, Amant, Mirza and Creutzberg1 The incidence is increasing due to high rates of obesity, physical inactivity, and also an increased ageing population. Reference Concin, Matias-Guiu, Vergote, Cibula, Mirza, Marnitz, Ledermann, Bosse, Chargari, Fagotti, Fotopoulou, Martin, Lax, Lorusso, Marth, Morice, Nout, O’Donnell, Querleu, Raspollini, Sehouli, Sturdza, Taylor, Westermann, Wimberger, Colombo, Planchamp and Creutzberg2 The mortality rate is higher in low socio-economic countries due to a lack of evidence-based care. Reference Kogevinas and Porta3,Reference Benoit, Pauly, Phelippeau and Koskas4 The management essentially includes surgical staging followed by adjuvant treatment in the form of radiotherapy and/or chemotherapy. Adjuvant radiotherapy is delivered through external beam radiation therapy (EBRT) and intravaginal brachytherapy (IVBT). IVBT is almost integral to adjuvant management of all stages of endometrial cancer. 5 The selection of applicators, such as cylinders or ovoids for IVBT, usually depends on the shape of the vagina and the extent of the lesion. Reference Nag, Erickson, Parikh, Gupta, Varia and Glasgow6
In general, single catheter-based IVBT is delivered mostly with 2D planning methods such as plain-film radiograph-derived plans or library plans. Reference Nag, Erickson, Parikh, Gupta, Varia and Glasgow6,Reference Anderson, Stea, Hallum, Rogoff and Childers7 It can also be performed by three-dimensional (3D) imaging (CT- and MRI-based) forward planning, that is, point normalisation, manual dwell time optimisation and graphically optimised (GrO) plans. In the modern brachytherapy system, inverse planning options such as hybrid inverse planning optimisation (HIPO) and inverse planning simulated annealing (IPSA) are available in the treatment planning system (TPS) software to improve the plan quality.
The conventional 2D planning methods are disadvantageous: first, due to consideration of ICRU-defined points for the bladder and rectum which may not represent the actual 3D volume, Reference Russo, Armeson and Richardson8 and second, in post-hysterectomy status, small bowel loops and the sigmoid colon tend to migrate to the pelvis and lie in close proximity to these organs which can be neglected completely. 9
Although there is some positivity with 3D imaging-based forward planning to surpass the first problem of conventional planning methods (2D), Reference Kim, Kim, Houser and Beriwal10 to address the second problem, GrO method requires a lot of iteration leading to a time-consuming process and depends on the expertise of the planner as well. Reference Jamema, Sharma, Mahantshetty, Engineer, Shrivastava and Deshpande11
3D imaging (CT and MRI) for target delineation has strengthened the foundation for the study of inverse planning optimisation in the last two decades in brachytherapy. Reference Bahadur, Constantinescu, Hassouna, Eltaher, Ghassal and Awad12 It has been proven that HIPO could generate smoother dwell time distribution which may result in more clinically desirable dose distribution in comparison with the IPSA method for cervical brachytherapy planning. Reference Fu, Xu, Zuo, An, Huang and Yang13 Here, our prime objective is to investigate the efficacy of the HIPO relative to forward planning with GrO for single catheter-3D-based IVBT.
Material and Methods
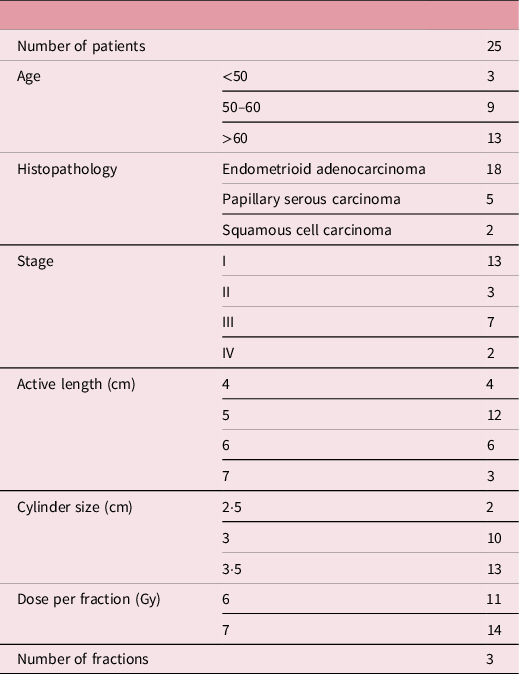
Twenty-five patients of endometrial cancer who underwent total abdominal hysterectomy and bilateral salpingo-oophorectomy were included in this retrospective study. Endometrioid adenocarcinoma was the most common histopathology (72%), and the majority were early-stage tumours (64%). Twenty patients had received EBRT with or without chemotherapy before IVBT, and five patients received only IVBT as per the PORTEC-2 (post-operative radiation therapy for endometrial cancer-2) trial. At the time of treatment, cylindrical vaginal applicators having a diameter ranging from 2·5 cm to 3·5 cm were used depending on the anatomical flexibility of the vaginal cavity. The treatment length for each patient was specified according to the stage and grade. The patients in this study were treated with a treatment length in the range of 4 cm to 7 cm. The detailed characteristics of the patients included in this study are given in Table 1. Computed tomography scans of all the patients were taken, with a slice thickness of 2·5 mm, and the axial images, along with the reconstructed images, were obtained and used for treatment planning. The CT-based plan with point normalisation was performed for the first fraction only and presumed similar applicator positioning with the same dosimetric parameters for the remaining fractions.
The characteristics of the patients included in this study and the patient’s age, histopathology, stage, active treatment length, cylinder size, and fractionation schedule

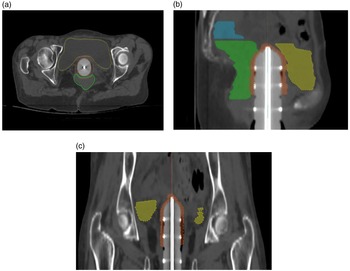
To perform the re-optimisation, the previous CT data of all the patients were used from the Oncentra brachytherapy TPS version 4.6.0. The American Association of Physicists in Medicine Task Group-43 dose calculation algorithm was employed for 3D re-optimisation for every patient by different optimisation techniques, that is, GrO and HIPO. For both GrO and HIPO planning, the volume of interest for the target, as well as organs at risk, was contoured. To perform optimisation in both the cases, clinical target volume (CTV) was created for all the patients by creating a 0·5 cm strip around the vaginal cylinder as per the required treatment length. The detailed delineation of the target volume is shown in Figure 1.
(a) The axial CT section containing the target volume (CTV in sandy brown), bladder (in yellow) and rectum (in green). (b) & (c) The sagittal and coronal section of the same volume of interests in solid colours

Graphical optimisation (GrO)
Vaginal brachytherapy treatment by point prescription with GrO is one of the most practised 3D image-based planning methods. In this study, all the plans were previously optimised by point-based prescription, where axis points were created at a distance of 0·5 cm from the surface of the cylindrical applicator. A dose prescription of 6 Gy in three fractions or 7 Gy in three fractions was prescribed to the axis points throughout the desired treatment length. To meet the requirement of target coverage and limit the dose to organs at risk, as recommended by ICRU 89 14 was performed by GrO method, that is, by dragging the isodose line locally with the help of a computer mouse. For adequate dose coverage to the target volume, we tried to optimise at least 95% of the prescription dose (PD) to 95% of the CTV and at the same time kept the normal tissue dose to as low as practically possible.
HIPO optimisation
HIPO is one of the widespread inverse optimisation methods to create quality-improved brachytherapy plans for intracavitary as well as interstitial brachytherapy. The features of HIPO planning techniques are available in Oncentra brachytherapy V4.3 onwards. In this method, along with the definition of volume of interest, there is a requirement of the objective function for the target and dose constraints for the normal structures. The HIPO optimisation window provides the user to designate different target volumes, specify target objectives and apply the constraints to organs at risk. Amongst the dose–volume constraints, there is an option to set priority levels for the different contoured regions of interest.
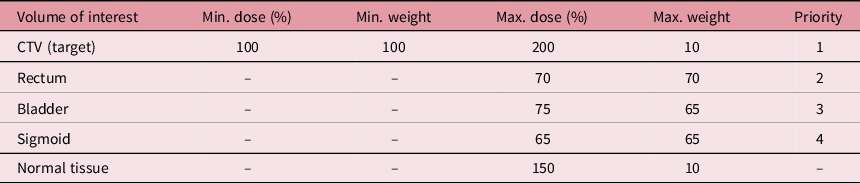
The HIPO inverse optimisation was performed for each case as per the desired objective function for target and dose constraints for normal tissues. The parameters explaining the target objective and normal tissue constraints are in Table 2.
The dose–volume constraints for the target and organs at risk

For HIPO optimisation, the highest priority is given to the target volume, followed by the normal structure. During the inverse planning, the target volume was prioritised to be covered by the PD while restricting the maximum dose up to 200% of the PD.
According to the sensitivity of different normal structures and considering the total EQD2 for the rectum as 75 Gy, bladder 90 Gy and sigmoid 75 Gy, the priority levels and weights were considered in this study. 14 Selection of priority and weights can be altered as per the application geometry. In this study, for most of the cases, adjacent structures such as the bladder, rectum and sometimes sigmoid were seen near the tip of the applicator. In this situation, the GrO method cannot control the high dose spread to normal tissue as it is a trial-and-error, manual planning method, while HIPO can control more efficiently.
Dosimetric evaluation
The dosimetric parameters for GrO and HIPO optimisation were computed as follows: D90% (dose received by 90% target volume), V95% (volume receiving 95% of PD), conformity index (CI), homogeneity index (HI) and overdose index (ODI) for CTV from the planning system. To account for the high dose inside the target volume, V150% (volume receiving 150% of the PD) was evaluated. The HI and CI were assessed by the following formulas: HI = (V100%–V150%)/V100% and CI = volume receiving the 95% of PD/target volume (CTV), respectively. For the calculation of ODI, the following formula was considered: ODI = V200%/V100%. Normal tissue tolerance doses were evaluated in terms of D0·1 cc, D1·0 cc and D2·0 cc for the bladder, rectum and sigmoid, respectively. 14
Results
All the dosimetric parameters for CTV and the doses to normal structures were evaluated for both optimisations.
Statistical analysis and plots
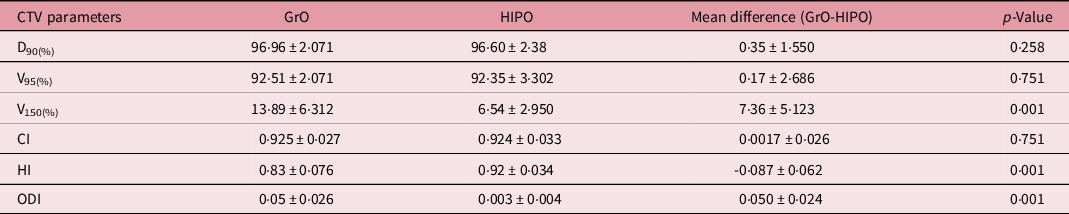
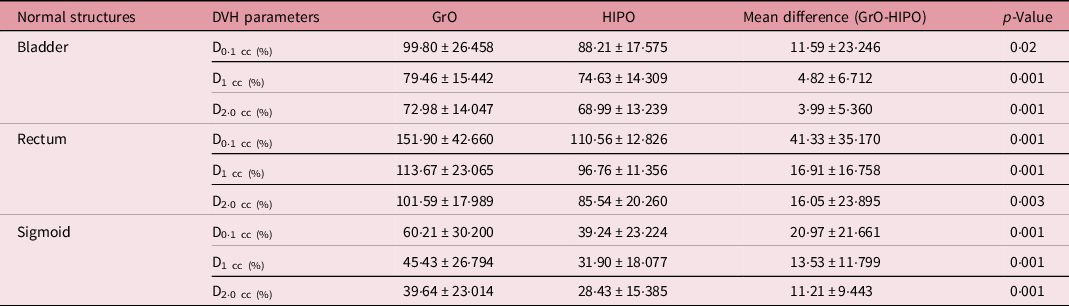
The paired sample t-test was conducted using the statistical package IBM SPSS version 26, and Origin Pro 8.5 was used to make the graphical representation of those data. In this analysis, it is found that there is no significant difference between the target coverage (for D90%, p-value = 0·258) for both optimisations (Table 3). Optimisation with the HIPO showed a significant reduction in the doses to the bladder, rectum and sigmoid colon (Table 4). All values obtained from the cumulative dose–volume histogram were recorded with mean difference between two methods for quantitative analysis.
The DVH parameters for the target volume, D90(%) = dose received by 90% of the CTV, V95(%) = volume covered by 95% of prescribed dose, V150(%) = volume receiving 150% of the prescribed dose, CI = conformity index, HI = homogeneity index and ODI = over dose index

The dose volume parameters for normal structures such as the bladder, rectum, and sigmoid in terms of D0·1 cc, D1·0 cc, and D2·0 cc, respectively, where D0·1 cc is the dose received by 0·1 cc volume of the normal structure, D1·0 cc for 1·0 cc volume and D2·0 cc for 2·0 cc volume

From the analysis, it is found that in HIPO optimisation, to cover the target and at the same time to restrict the high-dose volume (V150%) the difference between V100% and V150% increases; for this reason the HI index is higher than the GrO method, and it is desired in brachytherapy.
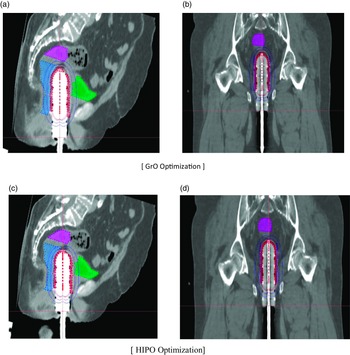
The isodose line covering the target volume with the dose to normal organs in both methods is compared and shown in Figure 2. This section contains information regarding the volume covered by 100% isodose line in white colour and 50% isodose line in blue colour. In both optimisations, the prescription isodose line encroached the target volume, but in GrO optimisation process at the tip of the applicator along with the target volume, the isodose line (white line) covered more than 0·5 cm distance, and there is a more spreading of dose to the rectum. While in the case of HIPO, no such scenario was observed. So only the target volume is covered with the desired dose, and the dose to normal structures is restricted.
The isodose distribution for GrO as well as HIPO optimisation: (a) sagittal section showing dose distribution (100% in white colour and 50% in blue colour) for GrO optimisation; (b) coronal section for GrO optimisation; (c) the sagittal CT dose distribution for HIPO optimisation and (d) the coronal section for HIPO optimisation

Discussion
The 2D library plan can be inferior in terms of an overestimation or underestimation of the target coverage alongside its inability to assess the OAR doses for IVBT. 2D plan considers ICRU points for bladder and rectum which may not correlate with the actual 3D volume. 2D plan has no allowance to account for this alteration, but 3D imaging-based forward planning method does overcome these above issues finely. However, the altered anatomy of pelvis post-hysterectomy allows bowel loops into the target volume, which results higher dose to bowel. This problem can be solved by HIPO instead of GrO. In some clinical situations like recurrent cases and also for young patients who are sexually active, the use of the most advanced treatment method which can lead to a better OAR sparing with no compromise to target dose is necessary. In order to achieve such a plan with as low as reasonable dose to OARs with optimised coverage, a lot of iterations are needed for GrO-based plan, leading to a time-consuming process as mentioned in Jemema et al. Reference Qi, Ruan, Lee, Pham, Kupelian, Low, Steinberg and Demarco15 It too depends on the expertise of the planner as well.
Fu et al. showed that HIPO generates plans with smoother dwell time distribution which are closer to clinically preferable distribution in comparison with IPSA for cervical brachytherapy. Reference Fu, Xu, Zuo, An, Huang and Yang13 Another method provided by Bahadur et al. for vaginal HDR brachytherapy showed that the use of a multichannel vaginal applicator with inverse planning is advantageous over a single-channel cylinder. Reference Bahadur, Constantinescu, Hassouna, Eltaher, Ghassal and Awad12 However, in practical scenarios, the use of a multichannel vaginal applicator for every patient is not suitable due to patient discomfort. For such cases, inverse planning method could be a better choice of the treatment optimisation method.
Here in our study, we obtained these findings regarding target coverage. D90% was 96·96 ± 2·071% and 96·60 ± 2·686%, and V95% was 92·51 ± 2·071% and 92·35 ± 3·302% for GrO and HIPO plan, respectively, with p-values of 0·258 and 0·751, respectively, which were not significant. For OARs, HIPO plans achieved lesser dose as compared to GrO with mean differences of: bladder D0·1 cc = 11·59 ± 23·24%, D1 cc = 4·82 ± 6·712%, and D2 cc = 3·99 ± 5·36%, rectum D0·1 cc = 41·33 ± 35·170%, D1 cc = 16·05 ± 23·895%, and D2 cc = 41·33 ± 35·170, and sigmoid D0·1 cc = 20·97 ± 21·661%, D1 cc = 13·53 ± 11·799, and D2 cc = 11·21 ± 9·443% (all with significant p-values). It was also seen that there is a slight increase of HI for HIPO over GrO with a mean difference of 0·087 ± 0·062%, which shows a better dose gradient as far as brachytherapy is concerned. Reference Jamema, Kirisits, Mahantshetty, Trnkova, Deshpande and Shrivastava16–Reference Westerveld, Schmid, Nout, Chargari, Pieters, Creutzberg, Sturdza, Lindegaard, van Kesteren, Mazeron, Nesvacil and Fokdal18 Also, ODI was found to be lower in the HIPO, and it may be prudent to say that a decreased ODI may translate into a decreased dose to OARs which may result in lower toxicities.
As far as IVBT is concerned, repeated planning for each fraction using the same applicator and geometry may not affect the dosimetry. In this study, we have considered all the previous geometry for re-optimisation and data analysis. In addition to it, Holloway et al. have shown that repeated planning for each fraction does not make much significant difference in dosimetry. Reference Holloway, Macklin, Cormack and Viswanathan19
Conclusion
3D inverse planning is a simple and fast technique with better dose-sparing of normal tissues without compromising the target coverage. HIPO as a planning tool can be helpful to all levels of planners to make optimum treatment planning, unlike GrO, where better planning skills are required to control normal tissue toxicity.
Acknowledgements
None.
Financial support
This study did not receive any financial support from any sources.
Competing interests
None.