


Introduction
The Greenland ice sheet both indicates and reacts to climate. Recent warming has led to increases in summer melt extent (Reference Abdalati and SteffenAbdalati and Steffen, 2001), melt duration and meltwater production/runoff (Reference BoxBox and others, 2006). Outlet glacier velocities have increased during this period of warming (Reference Rignot and KanagaratnamRignot and Kanagaratnam, 2006) in apparent response to enhanced water supply via a meltwater lubrication mechanism (Reference Zwally, Abdalati, Herring, Larson, Saba and SteffenZwally and others, 2002; Reference Vieli, Jania, Blatter and FunkVieli and others, 2004), signifying the important role of ice-sheet mass budget changes in global sea level and regional ocean circulation forcing.
Seasonal surface melting produces water that collects in surface undulation basins on the surface of the ice sheet (Reference Thomsen, Thorning and BraithwaiteThomsen and others, 1988; Reference Echelmeyer, Clarke and HarrisonEchelmeyer and others, 1991; Reference Lüthje, Pedersen, Reeh and GreuellLüthje and others, 2006). Reference Thomsen, Thorning and BraithwaiteThomsen and others (1988) observed: ‘Many lakes exist on the ice surface, in many cases without any detectable surface outlets. They vary in size from only a few hundred meters in diameter up to about 1500 m and soundings in the lakes show mean water depths of 2–5 m. The lakes tap periodically. From visits to empty lakes it can be seen that moulins often exist in the bottom of the lakes and from visits to the same locations in spring it is reasonable to assume that these moulins are filled with snow during winter, thus stopping the outlet. Lakes are then filled during summer until the moulins are reopened by a combination of pressure and melting. Similar observations were made in Spitsbergen (Reference Liestøl, Repp and WoldLiestøl and others, 1980).’ The role of melt lakes in providing water to lubricate glacier flow in lake-outburst events has been hypothesized by Reference Joughin, Tulaczyk, Fahnestock and KwokJoughin and others (1996), Reference Boon and SharpBoon and Sharp (2003) and Reference Parizek and AlleyParizek and Alley (2004), yet melt lake depth and volume statistics for the Greenland ice sheet, including their time variation, remain unresolved.
The relationship between surface melting, melt lakes and water discharge into englacial conduits (moulins) is also incompletely understood. Theoretical calculations by Reference WeertmanWeertman (1973), Van der Reference Van der VeenVeen (1998) and Reference Alley, Dupont, Parizek and AnandakrishnanAlley and others (2005) lead to the conclusion that a water-filled crevasse has unlimited capacity, acting under gravity, to force water to the bottom surface of a glacier. Water emanating from the glacier front, commonly laden with glacial silt, further indicates that water has been communicating with the bed some significant distance inland.
As water depth increases, scattering and absorption reduce the surface reflectance of solar radiation (Reference Morassutti and LeDrewMorassutti and LeDrew, 1996), amplifying melt (e.g. Reference Curry, Schramm and EbertCurry and others, 1995; Reference Perovich, Tucker and LigettPerovich and others, 2002).
The present study exploits the water-depth-driven solar radiation extinction effect on spaceborne satellite-sensed surface reflectance, to develop an empirical parameterization to remotely sense melt lake depth and volume over the ice-sheet ablation region. Before applying depth parameterization, the surface is classified as flooded using thresholds in visible-band reflectance ratios and absolute reflectance, yielding lake area statistics. Downscaling methodologies are applied to coordinate the in situ depth measurements with satellite image data. Estimates of lake-dimension change are then made for southwestern ice-sheet lakes in 2000–05 cloud-free imagery. Uncertainty is discussed in conjunction with the development and application of the methods.
Data
MODIS data
The moderate-resolution imaging spectroradiometer (MODIS) on the NASA Terra and Aqua satellites provides daily coverage of Greenland in optical and infrared wavelength bands. MODIS data spanning the visible spectrum, i.e. band 1 (0.62–0.67 µm, red), band 4 (0.54–0.57 µm, green) and band 3 (0.46–0.48 µm, blue) are employed in this study. Band 1 has greater horizontal resolution (250 m) than bands 3 and 4 (500 m). For simplicity, bands 1, 4 and 3 are occasionally also referred to as red (R), green (G) and blue (B), respectively.
MODIS data are advantageous for melt lake monitoring, given a 2330 km wide (cross-track) swath, capable of imaging the entire Greenland ice-sheet ablation zone daily. The wide swath in polar orbit also affords sub-daily repeat coverage. Relatively high-resolution Terra ASTER (Advanced Spaceborne Thermal Emission and Reflection Radiometer) or Landsat Enhanced Thematic Mapper (ETM) sensors have superior resolving power, making them desirable for melt lake investigations, but, with 60 and 185 km swath width, respectively, and a 4–16 day repeat coverage, do not provide adequate temporal sampling to investigate lake-dimension change considering the observed timescales of development (Reference Bryzgis and BoxBryzgis and Box, 2005). Thus, this study relies upon MODIS image data. MODIS imagery spanning April–September 2000–05 (170 images, ~28 per year) was gathered for use in this study.
The Terra (Earth Observing System) satellite overpasses Greenland with favorable solar illumination and near-nadir view, between 1410 and 1600 UTC, corresponding to a time of day within 2 hours after solar noon. For the relevant intervals of latitude (67–70° N) and time of year (1 May to 31 August), the image data solar elevation angles are in the 25–44° range.
Lakes selected for investigation in this study are indicated on a maximum lake extent (2000–05) composite image (Fig. 1). The 16 August 2005 1445 UTC MODIS Terra imagery was selected to compare with ground-survey data to develop the depth–reflectance parameterizations. The lakes were obscured by clouds on 14 and 15 August 2005 when the surveys were undertaken.
MODIS 250 m true-color image composite, showing maximum melt lake extent (minimum reflectance) for ‘region 1’, where a high concentration of lakes is found. The background image was acquired by MODIS, 26 August 2003 1540 UTC. Melt lakes investigated in this study are illustrated, including ground-surveyed lakes A and B, melt lakes with no obvious outburst events and lakes with annually recurring outbursts.

In situ data
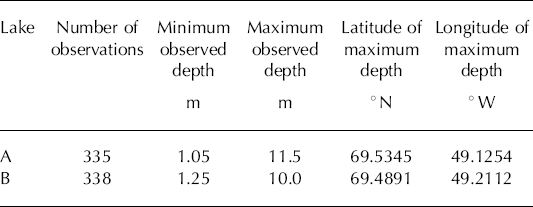
In situ depth surveys for lakes A and B (see Fig. 1) were made on 14 and 15 August 2005, respectively, using a 10 ft (3 m) inflatable raft propelled either by oars or by 5 h.p. outboard motor. Depth data were obtained using a Garmin ‘Fish Finder 100’ depth sounder with readings spoken into a microcassette recorder at waypoints recorded by a handheld GPS (global positioning system). Depth measurement precision was 0.1 m, with accuracy matching that precision, according to measurement validation using a boat oar. Measurement position uncertainty is approximately 20 m, as GPS data contained no differential correction. Table 1 provides additional depth-survey information.
Melt lake survey statistics
Automatic weather station (AWS) data from the Greenland Climate Network (Reference Steffen, Box and AbdalatiSteffen and others, 1996; Reference Steffen and BoxSteffen and Box, 2001) are referred to in terms of the Jakobshavn ablation region (JAR). The AWS JAR1 station continued to operate without damage while its surroundings were flooded by melt lake waters in 1996 and 1997.
Aerial reconnaissance
Hughes 500 helicopter aerial-reconnaissance flights were conducted on 12–15 August 2005 from the Greenpeace Motorized Yacht Arctic Sunrise, anchored in de Quervain harbor (69.7612° N, 50.3748° W) near Eqip sermia. Helicopter GPS measurements of lake A’s elliptical major and minor axes suggest a lake area of 1.3 km2. The center of lake A is 8.4 km from the ETH/CU ‘Swiss Camp’ (see Fig. 1).
Methods
MODIS resolution sharpening
A resolution–sharpening algorithm (L. Gumley and others, http://rapidfire.sci.gsfc.nasa.gov/faq/MODIS_True_Color.pdf) re-projects the 500 m band 3 and 4 data to 250 m, relying on (band 1 at 500 m)/(band 1 at 250 m) resolution–reflectance ratios. The band 1 result is then applied to band 3 and 4 data, resampled to the 250 m grid on a pixel-by-pixel basis. The working assumption is that the band 3 and 4 resolution-reflectance ratios would be equivalent with that implicit in band 1. The spectral information in sharpened (250 m) band 3 and 4 data is used in surface classification, but not in lake-depth determination. For the latter, only band 1, with 250 m native ground resolution, is used.
Atmosphere correction
The MODIS corrected reflectance algorithm (CREFL) developed by J. Descloitres at the NASA Goddard Space Flight Center removes gross atmospheric effects, such as Rayleigh scattering, from MODIS visible bands 1–7. The MODIS land surface reflectance product (MOD09) has a more complete atmospheric correction algorithm, one that includes an aerosol correction. In clear atmospheric conditions, with no heavy aerosol loading, the CREFL reflectance product is very similar to the MOD09 product (http://rapidfire.sci.gsfc.nasa.gov/faq/MODIS_True_Color.pdf). Yet aerosol concentration remains an unknown source of error. While no aerosol correction is included in CREFL, by parameterizing observed depth to reflectance data some aerosol effect is implicit and therefore minimized in the calibration.
Cloud clearing
MODIS band 6 (1.628–1.652 µm) reflectance is sensitive to solid- and liquid-phase clouds. Here, surface classification is made for pixels in which band 6 reflectance is less than 0.15. Clouds did not hamper lake classification owing to the distinctly different color between clouds and lake pixels. However, optically thin clouds with band 6 reflectance below 0.15 can bias CREFL calculations.
Depth–reflectance parameterization and data geo-coordination
A major challenge in this study was co-registering the point-based depth measurement data with the area-based image data. A preliminary data coordination experiment involved selecting the nearest pixel to each depth measurement. This, ‘nearest-neighbor’ coordination of depth and reflectance data produces a depth/reflectance scatter that is reasonably approximated by a least-squares fit of the form:

where D is depth and R is MODIS band 1 reflectance (Fig. 2). The shape of the fit represents the exponential decay in water reflectance noted by Reference Morassutti and LeDrewMorassutti and LeDrew (1996). The accuracy of this function is questionable owing to the lack of spatial precision in the reflectance data.
Pattern of reflectance vs depth with data co-registered by the nearest-neighbor method.

A more precise treatment of the spatial variation is obtained by exploiting spatial autocorrelation in reflectance. The lake pixel values are not spatially independent, but include a spatial trend across the lake in two dimensions from relatively high reflectance at the lake margin to relatively low reflectance near the lake center. The reflectance spatial trend surfaces on the equal-area grid were determined for each lake using LABFit software (W. Pereira da Silva and C. Pereira da Silva, http://www.labfit.net). Adequate fits were found using seven-parameter functions. The two ‘independent’ variables (x in north–south and y in east–west directions) are the horizontal grid coordinates. The ‘dependent’ variable in this case is band 1 reflectance (R). As such, the trend surface fit to the 7 × 7 250 m grid subset for lake A (Fig. 3a) is given by:

Illustration of LABFit spatial trend surface fits to lake reflectance data.

Similarly, the parameterization for lake B spatial reflectance distribution on the 8 × 9 grid subset (Fig. 3b) is:

The residual reflectance error (ε), i.e. the standard deviation of the statistical model minus the observed reflectance, lies in the 0.04–0.07 range. The fact that the lake B error is larger is linked to lake B’s shape being more asymmetric and thus harder to fit. Table 2 lists the fit parameters (α0−α6), correlation coefficients and residual error. Equations (2) and (3) are then applied to compute reflectance at points corresponding to the in situ depth measurements. The results are shown after applying a technique to refine the image data geolocation.
Lakes A and B trend surface fit results

Image georeferencing
The geolocation of the 250 m MODIS pixels was accomplished in two steps. The first geolocation (G 0) is based on the NASA 1 km gridded viewing and illumination geometry product (MOD03) processed using the MODIS Swath-to-Grid Toolbox (MS2GT) (Reference Haran, Khalsa, Knowles and GumleyHaran and others, 2001). To determine a more precise geolocation (G 1), the equal-area grid is nudged in 0.5 m increments with respect to G 0, 125 m in all horizontal directions, while computing residual error of a least-squares-fit function of the form D = α 0/(R + α 1) + α 2, as in Equation (1). The x and y geolocation offsets producing the minimum residual error are assumed to represent the most precise geolocation possible with the given data. This assumption seems valid because the offsets are roughly equivalent for the two independent lakes in the same MODIS image. Lake A and B east–west offsets were 55.0 and 52.5 m, respectively. The north–south offsets were more disparate, but still within 15 m of each other, that is, 30.0 and 15.0 m, respectively. Figure 4 illustrates the MODIS data shown as a true-color image, i.e. red = band 1, green = band 4 and blue = band 3 pixels, with lake survey depth sample positions plotted at the two levels of georeferencing.
Survey paths over lakes A and B with two levels of image georeferencing.

Figure 5 illustrates the band 1 reflectance data coregistered with depth measurements using Equations (2) and (3), including best-fit curves. The sampling seems adequate in the range 3m < D < 10 m. For depths less than 3 m, the sparsity of observations suggests a greater depth uncertainty. As the depth approaches zero, the bare-ice MODIS band 1 reflectance is observed to be 0.6 ± 0.1. One would thus expect the function to intercept the depth axis at R ≈ 0.6. Rather than forcing the function in this regard, surface classification discussed in the next subsection is taken to dictate whether or not the surface is flooded.
Lake A and B MODIS band 1 reflectance vs depth with best-fit functions.

It is noteworthy that, in the deep limit, there may be a threshold beyond which the lake no longer has reflection depletion (Reference Morassutti and LeDrewMorassutti and LeDrew, 1996), suggesting that depth–reflectance parameterization may underestimate maximum lake depths.
Lake detritus, that is, aolian terrestrial and extraterrestrial dust (cryoconite, e.g. Reference Gerdel and DrouetGerdel and Drouet, 1960), is dark in color and is observed to collect at the base of some lakes. Aerial-reconnaissance flight inspection of several other lakes in the northern Jakobshavn ablation region suggests detritusladen lakes are few. These lakes are the lowest-elevation lakes and are relatively small in area, that is < 1 km2. Thus, cryoconite does not seem to pose a major obstacle in accurately sounding the relatively large lakes. Since cryoconite is a relatively low-reflectance material, it would cause depth overestimation if it was of significant abundance in other, non-surveyed, lakes.
The similarity of the fit functions (Fig. 5) suggests a generalized function. That is, a fit to the scatter from lake A and B data taken together is useful for sounding un-surveyed lakes. Fit parameters are listed in Table 3. Note that secondary geolocation (G 1) yields a considerable reduction in the least-squares-model error compared to the primary MOD03 geolocation (G 0). The combined A + B function is used to sound all image pixels classified as flooded (see Fig. 1).
Depth–reflectance parameterization results

Image classification
Image pixels that represent flooded areas are classified using image reflectance data. Firstly, non-flooded areas have reflectance in the 0.5–0.8 range. At the low end of that reflectance interval is bare ice or dust/cryoconite-covered bare ice, as observed in August 2005 reconnaissance flights. The high end of the non-flooded reflectance scale represents snow-covered ice, which has melted, is melting or is in a refrozen state. Reflectance over the non-flooded areas in MODIS bands 1, 4 and 3 varies more uniformly (Fig. 6a), corresponding with the gray surface color. More precisely, a mean band-3/band-1 ratio, that is, blue/red (B/R), of 1.03 ± 0.02 is evident in the non-flooded area between lakes A and B.
Lake A transects: (a) reflectance and (b) reflectance ratios. Red, blue, green are indicated by R, B, G, respectively, and (B/R)T is the blue/red reflectance threshold.

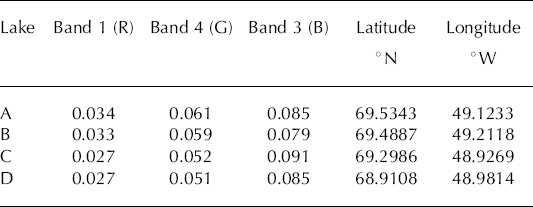
Reflectance over flooded areas surveyed drops to the minima listed in Table 4. Red reflectance is more reduced by the presence of lake water (Fig. 6a) than blue or green. Thus red reflectance is the most sensitive to water depth of the three bands. The relatively high blue reflectance, compared to red and green, is, of course, what gives the lakes their striking blue color. Over flooded areas, the blue/red ratio increases toward the lake centers, where water is deepest (Fig. 6b).
MODIS 250 m grid minimum reflectance values for selected melt lakes
Band ratios that correspond to flooded areas can thus be expressed using a threshold, (blue/red)T, in the 1.05–1.25 range, as determined experimentally, and with knowledge of the areas of lakes A and B. However, (blue/red)T does not consider differing concentrations of ice impurities, requiring more conservative (higher) (blue/redT) values to be chosen in some cases. Also, because there is some overlap in reflectance in the low range for non-flooded areas and the high-reflectance range for flooded waters, that is, 0.5 < R < 0.7, a red reflectance threshold, (red)T, in the 0.5–0.6 range was chosen on a lake-by-lake basis to avoid obvious misclassification. Once the classification is made, it is straightforward to compute lake area (A), with 250 m × 250 m pixels equalling 0.0625 km2. Lake depths (D) and volume (V) are calculated by applying a depth–reflectance function to classified pixels. By comparing images over time, statistics of lake-dimension changes are gathered. In addition, the maximum lake depth (Dmax) and its location can be determined at 250 m horizontal precision.
Lake-outburst event detection
A geographic region containing a high concentration of lakes, i.e. 67.55–69.95° N, 47.40–51.65° W, was chosen to search for abrupt lake-drainage events. We refer to this as ‘region 1’;the extent is illustrated in Figure 1. Time-spans of 1–12 days were considered in the search for lake-outburst events. Outburst events were identified manually using sequential cloud-free images for the 6 year period covered by 2000–05 MODIS imagery. The lake center grid coordinates were used to identify lakes which occurred year after year and the lakes were assigned ID letters. For instance, lake X4 refers to lake X in the year 2004. Lake-dimension changes (area, volume and maximum depth) were calculated for each lake outburst individually.
A larger geographic region, ‘region 0’ (see Fig. 1), between 69.87, 65.76° N and 47.28, 51.55° W is used to compute regional statistics of total multi-lake volume and fractional areal coverage of the zone of melting by lakes. The zone of melting is approximated to that ice area where MODIS band 1 reflectance is below 0.7.
Results and Discussion
Lake dimensions
The maximum area (A) of a single lake in 2000–05 appears to be 8.9 km2 for lake Q (68.6263° N, 49.0055° W) on day 199 (17 July) 2004. A 16.9 km2 lake resulted from the merging of lakes F and G through a channel on day 193 (12 July) 2003. The fractional lake coverage of the region 0 zone of melting reached a maximum 2.7% on day 177 (26 June) 2005. Comparable fractional coverages are observed in other years.
The maximum depth (D max) appeared to be 12.2 m, for lake Q on day 188 (7 July) 2002. It seems either that the lake reflectance cannot decrease below a value of 0.027 in MODIS band 1, causing the extinction–depth relationship to lose sensitivity beyond some depth, or that lakes do not grow deeper than 12 m on average over areas greater than 250 m × 250 m before top-over or outburst occurs.
The volume (V) of individual lakes peaks in the 106–108m3 range. Lake Q yielded the maximum estimated volume of any single lake, that is 53 × 106m3 on day 199 (17 July) 2004. The F–G lake system registered a volume of 98.3 × 10⁶m3 on day 193 (12 July) 2003. Over the southwest Greenland ablation zone (region 0), lake area reached a maximum of 332 km2 with a combined water volume of 1.284 km3 on day 175 (24 June) 2003. Comparable regional volumes are observed in other years, such as 1.157 km3 on day 201 (20 July) 2005 when lake area was 293 km2.
The maximum area, volume and depth does not always occur on the same day. Nonetheless, expected patterns of positive correlation between area and volume, volume and maximum depth, and area and maximum depth are evident from the 2000–05 imagery (Tables 5 and 6). The patterns of scatter between area, volume and maximum depth (not shown) suggest two classes of lake shape, i.e. narrow and deep or wide and shallow, and seem to relate to surface topography expressions of the ice-sheet bed. While lake bathymetry varies with surface topography, it is interesting to consider that given increased solar energy absorption, the lake position is self-reinforcing, as the albedo feedback leads to larger surface ablation than for surrounding non-flooded ice.
Melt lake depth and volume statistics for selected lakes in 2005

West Greenland melt lake dimension statistics for selected outburst events, sorted by discharge volume

Table 5 lists dimensional statistics for selected relatively large melt lakes for the 2005 melt season, including results for lakes A and B that have in situ surveys. As maximum area, volume and depth results do not always occur on the same day, up to three dates are listed for each lake.
Lake-outburst events
In MODIS imagery, numerous melt lakes are observed that decrease in area completely in as little as 1 day. The recurring loss of a lake in the vicinity of the JAR1 AWS site was captured in hourly in situ acoustic-ranging sensor data. Roughly constant filling-rate episodes at JAR1 were terminated by comparatively rapid drainage events lasting 10 hours in 1996 and 8 hours in 1997.
Lake-dimension changes associated with selected lake-outburst events detected by remote sensing are listed in Table 6. Of the lake-outburst events detected in region 1 in 2000–05, the earliest was on day 168 (17 June) 2005. The latest lake outburst detected was on day 221 (9 August) 2005. Lake outbursts appear to migrate inland throughout the melt season. The average outburst date is day 191 (10 July). The average lake volume change is −15.7 × 10⁶ m3, with an average of more than eight events per year. The actual number of lake outbursts is very likely greater, with some relatively small events missed due to spatial resolution or during visual inspection of imagery. The largest outburst event found is that of the two large interconnected lakes F and G, forming a 98.3 × 10⁶ m3 reservoir draining some time between days 193 and 196 (12–15 July) 2003. The reflectance changes imply a 97.4 × 10⁶m3 water discharge, corresponding to a constant drainage rate of 16.2 × 10⁶ m3 d−1, though the drainage rate peaks in time. In another lake-outburst case, lake G on days 188–189 (7–8 July) 2002, i.e. in the G2 event, a discharge of 31.5 × 10⁶m3 occurred in 24 hours or less. Table 6 lists some of the largest (of 50) drainage events identified in the 2000–05 imagery. The 2003 imagery yielded the most drainage events. However, in other years, such as 2004, relatively cloudy conditions may have obscured drainage events. Lakes F, G, O, T, U, V, W and X exhibited outbursts in more than one year (Table 6). These recurrent drainage events do not necessarily have consistent drainage time intervals, as clouds occasionally obscure precise determination of drainage time. The surface morphological characteristics of these lakes should be further investigated to examine whether these are top-over or bottom-drainage events.
Depth changes indicate lake surface height changes of −6.2 m in as little as 1 day (Table 6). Blue/red and red thresholds, B/RT and RT, respectively, are listed to indicate that surrounding surface reflectance properties were variable from lake to lake, and were refined, but can affect dimensional retrieval accuracy to a second order.
Considerations of lake-outburst flooding mechanisms and ice flow
The implications of lake-outburst events are of critical interest for the better understanding of ice-sheet flow dynamics and the hydraulic response of the ice sheet to climate warming. Reference Parizek and AlleyParizek and Alley (2004) parameterized flow enhancement related to surface meltwater production in global-warming scenarios using information from Reference Zwally, Abdalati, Herring, Larson, Saba and SteffenZwally and others (2002), but did not directly consider the pulses of water provided by lake outbursts. Reference EngelhardtEngelhardt (1978) and Reference BindschadlerBindschadler (1983) reported basal water-pressure observations that are linked to enhanced basal sliding in cases of summer peak meltwater production or after heavy rainfall. Reference Vieli, Jania, Blatter and FunkVieli and others (2004) confirmed this link on Hansbreen, Svalbard, stating: ‘The close correlation between water pressure recorded in a moulin and the observed surface velocities suggests that the speed-ups are caused by a strong increase of basal water pressure which leads to enhanced basal sliding.’ The strong increase in basal water pressure can be provided by melt lake outburst. A moulin kept full of water would produce a greater basal pressure than that exerted by the same overburden of ice, no matter what the ice-sheet thickness, given the higher density of water than ice.
The 8000 m3 of water needed to fill a moulin with 10 m2 effective cross-sectional area at an ice thickness of 800 m is less than 0.1% of the available water volume in the case of an average lake-outburst event (Table 6). Thus, basal pressurization could be maintained over a period of hours to days.
It is worth considering over what subglacial area this water would spread. If subglacial void thickness were effectively 1 m, the water volume from the large FG2003 outburst could spread over an area of 97 km2. If the subglacial cavities were constrained laterally, as in the case of a subglacial valley channel, it seems more likely that basal pressure could be maintained.
Conclusions
In situ depth and remotely sensed reflectance data can be combined to estimate supraglacial melt lake depth and volume, once the lake surface area has been derived from image classification. Lake classification is achieved using the MODIS band 1–3 reflectance ratio; a lake has 1.05 < B/RT < 1.25 and a band 1 reflectance less than 0.4–0.6. A lake-depth parameterization is proposed, based on the exponential decay of lake reflectance with water depth. The empirical fit is made between satellite-observed reflectance and in situ observed depth. The implicit relationship between depth and reflectance was equivalent at two independent lakes where depth surveys were made. Thus, a generalized depth–reflectance parameterization seems applicable to other lakes, at least to those lakes with no significant concentrations of dark-colored cryoconite dust.
Uncertainty in the remotely sensed lake dimensions stems from errors in co-registration of in situ point-based depth data with area-based image data, variable detritus concentration in some lakes, limited MODIS spatial resolution (250 m) and mixed pixels along lake margins. Precise in situ depth data were georeferenced with image data in an iterative procedure to refine geolocation to sub-pixel precision.
Cloud-free images spanning 6 years (2000–05) yield information on maximum lake depth (12.2 m), maximum single-lake area (8.9 km2) and maximum single-lake volume (53 × 106m3). Many lakes recur year after year in the same topographic basin. The peak combined volume for all lakes on the western slope of the ice sheet between 69.87 and 65.76° N was 1.284 km3 on day 175 (24 June) 2003, with similar maxima in other years.
Cases of abrupt drainage, up to 31.5 × 10⁶ m3 d−1, provide englacial and basal water fluxes that seem to be important in the enhancement of hydraulic basal sliding. Based on observations at the surface of moulin diameters, on the order of 10 m2, a moulin can contain only a small fraction of the lake-outburst water volume. Thus, a pressurized basal environment can be maintained during outbursts lasting hours to days, given the conditions necessary to hydraulically lubricate and even uplift the ice-sheet surface, at least locally. Melt lake outburst waters thus have the capacity to play a significant role in ice-sheet response to surface climate via seasonal meltwater production.
Acknowledgements
This study was supported by The US National Science Foundation Office of Polar Programs grant ARC-0531306 and The Ohio State University Geography Department Lawrence Brown Faculty Fellowship. Logistical support for fieldwork was provided by Greenpeace. We thank J. Hoelscher for boating expertise. G. Bryzgis gathered many of the raw MODIS data. J. Bamber, W. Wang and an anonymous reviewer are thanked for their input. This is Byrd Polar Research Center contribution No. 1340.



