I. INTRODUCTION
Phosphate-based systems offer a range of compositional and structural possibilities (Ultra, Meta, Pyro, and Ortho) that facilitate tailoring chemical and physical properties of interest for specific applications. They are capable of forming polymers having a series of rings or chains by P–O bonds and have potential applications as technological materials due to their good thermal and chemical stabilization.Reference Brixner1 They offer better homogeneity, chemical and thermal stability with lower sintering temperatures.Reference Zhao, Li, Zheng, Yang and Li2–Reference Song, Zhao, Zhou, Dou, Ming and Yi4
The structures of pyro- and metaphosphate systems are well known. Metal ion polyhedra clusters by sharing corners, forming a cation subnetwork that links the separate phosphate anions. Special interest in pyrophosphate arises from the unique spectroscopic behavior of the metal cation polyhedra with well-defined and low symmetry coordination.Reference Day, Wu, Ray and Hrma5 Pure and doped pyrophosphates are technologically important because of their luminescent, dielectric, semiconductor, catalytic, magnetic, fluorescent and ion-exchange properties. Therefore, the synthesis of pyrophosphates is an active field of research for many investigators. Moreover, pyrophosphate A2P2O7 (A = Ca, Sr, Ba, Mg, Zn, Mn) have been reported to possess good microwave dielectric properties as well as relatively low sintering temperature.Reference Marasinghe, Karabulut, Ray, Day, Shuh, Allen, Saboungi, Grimsditch and Haefner6 Among them, thortveitite-type pyrophosphate α-Zn2P2O7 exhibits rather low sintering temperature (875 °C) and is a very promising low temperature cofired ceramic material.Reference Karabulut, Marasinghe, Ray, Day, Waddill, Booth, Allen, Bucher, Caulder and Shuh7 The size of the An+ and B(7−n) + cations plays an important role in determining the type of the crystalline structure. When the ionic radius of B is greater than 0.5 Å, the observed structure types are pyrochlore or weberite, and if the ionic radius of B is less than 0.5 Å, the observed structure types are dichromate or thortveitite.Reference Boukhari8 These compounds have been obtained with phosphorus, vanadium, silicon, and chromium in their highest oxidation state. The crystal structure can therefore be formulated as ionic with A as the cation and B2O7 as the anion. B2O7 consists of two BO4 tetrahedra sharing an oxygen atom with a B–O–B angle of approximately 130°. The crystal structures of the diphosphates A2P2O7, where A is a divalent cation, have been widely studied. A2P2O7 (A = Ca, Sr, Ba, Mg, Zn) is a large family of pyrophosphate compounds, which have been found to crystallize in two structural types that can be predicted from the ionic radius of A cation. When radius of A2+ is smaller than 0.97 Å (A = Mg, Mn, Fe, Co, Ni, Cu, Zn), A2P2O7 is of the thortveitite structure, in which [P2O7]4− groups are in the staggered configuration, and when the radius of A2+ is larger than 0.97 Å (A = K, Ca, Sr, Rb, Ba, Pb, Cd), A2P2O7 is of the dichromate structure, in which [P2O7]4− groups are in eclipsed configuration.Reference Boukhari8 Therefore, Zn2P2O7 is having thortveitite structure, in which [P2O7]4− groups are in the staggered configuration. Two polymorphic transformations of zinc pyrophosphate have been known to exist. They are α and β modifications connected with each other by reversible transformation at 405 K. The high temperature β-modification exists at the temperature of congruent melting, 1288 K.Reference Brown and Calvo9
Zinc pyrophosphate, Zn2P2O7, is one of the families which are isostructural in their high temperature (β) phase. The low temperature (α) phase falls into three groups, each a multipartite, defined by Lefkowitz et al.,Reference Lefkowitz, Lukaszewez and Megaw10 of its parent phase. These groups consist of Cu2P2O7, which is bipartite along c-axes; Mg2P2O7, Ni2P2O7, and Co2P2O7, which are bipartite along both c and a axes; and Zn2P2O7, which is bipartite along c axis and tripartite along a axis.Reference Robertson and Calvo11 The length of b-axes and the β-angles remains substantially the same through the transitions. In terms of the gross structure, α-Zn2P2O7 is the most complex of the series.
The structure of thortveitite β-Zn2P2O7 is characterized by having a staggered (noneclipsed) conformation of [P2O7]4− anions, with almost linear P–O–P bonds and an irregular octahedral coordination for Zn2+. Endothermic reversible transitions have been reported for Zn2P2O7 at 405 KReference Katnack and Hummel12 and for Mg2P2O7 at 341 K.Reference Roy, Middleswarth and Hummel13 Cu2P2O7 has a phase transition at 345 K, whereas in contrast no phase transition has been found in Mn2P2O7. Phase transition in single crystals of Zn2P2O7 has been investigated by electron paramagnetic resonance (EPR) using Mn2+ as a probe.Reference Chambers, Datars and Calvo14 We could detect the phase transition in powder sample also. EPRReference Labrinia, Saadounea, Almaggoussib, Elhaskouric and Amoros15–Reference Falin, Gerasimov, Latypov, Leushin and Khaidukov18 and XRDReference Zhang, Yan, Zhao, Xu and Li19–Reference Rani and Sahare21 as techniques have been extensively used to understand the phase transition in various inorganic systems.
EPR experiments are used to get information about the oxidation state, the site occupancy, and the coordination sphere of the transition metal ions doped in different inorganic matrices.Reference Bottcher, Langhammer, Muller and Abicht22,Reference Sengupta, Kadam, Rajeswari, Dhobale, Babu and Godbole23 It is also useful in getting information about the local site symmetry around the paramagnetic ion and in quantifying the number of unpaired spins of different paramagnetic ions.
Mn2+ being EPR sensitive is chosen as a probe ion to investigate structural phase transformation in powder zinc pyrophosphate because the isostructural relationship of the high-temperature forms permits a definite assignment of the Mn2+ site in the structure and more importantly because the relatively high sensitivity of the electron spin resonance (ESR) spectra to the Mn2+ environment might permit a detailed study of the various phase transitions. Divalent Cu and Mn have previously been studied in Zn2P2O7 by ESR.Reference Chambers, Datars and Calvo14 This study confirmed the reported first-order phase transition at 405 K.Reference Katnack and Hummel12 In the present work, zinc pyrophosphate (both pure and doped sample) has been synthesized by the wet chemical route and characterized by x-ray diffraction (XRD), differential scanning calorimetry (DSC), and EPR. Moreover, structural phase transformation was investigated by high-temperature EPR. The same was corroborated with high-temperature XRD (HTXRD) and DSC.
II. EXPERIMENTAL
A. Sample preparation
Zinc hydrogen phosphate was precipitated from zinc nitrate solution containing Mn2+ (2 mol%) by adding (NH4)2HPO4. The pH of the solution was adjusted to be around 7–8. Analytical grade zinc nitrate, (NH4)2HPO4, and very pure MnCO3 (99.999%) were used for the preparation. The precipitate was filtered and dried with alcohol. Later, it was ground thoroughly and heated at 950 °C for 3–4 h in air.
B. Instrumentation
The phase purity of the prepared phosphors was confirmed by XRD. The measurements carried out on a STOE x-ray diffractometer (Germany) equipped with a Ni filter, a scintillation counter, and a graphite monochromator. The diffraction patterns were obtained using monochromatic Cu Kα radiation (λ = 1.5406 Å) keeping the scan rate at 1 s/step in the scattering angle range (2θ) of 10–60°. The Kα2 reflections were removed by a stripping procedure to obtain accurate lattice constants and grain sizes. The EPR spectra were recorded on a Bruker ESP-300 spectrometer (Switzerland) operating at X-band frequency (9.5 GHz) equipped with 100-kHz field modulation and phase sensitive detection to obtain the first derivative signal. Diphenyl picrylhydrazyl (DPPH) was used for the calibration of g values of paramagnetic species. The EPR parameters have been precisely determined from the calculated spectra, obtained using BRUKER SIMFONIA program. The simulations were carried out assuming mixed line shape (Lorentzian/Gaussian = 0.5) with a peak-to-peak line width of 0.01 T. HTXRD studies of Zn2P2O7 were carried out using a STOE diffractometer fitted with HDK-2.4 high temperature attachment. About 10 mg of the finely ground sample was mounted on a Pt-Rh strip, which acts as both a sample holder and a heater for HTXRD studies. Pt/Pt-13% Rh thermocouple spot welded at the bottom of the sample holder was used for the measurement of temperature. The temperature calibration and alignment of the diffractometer was checked by measuring the thermal expansion coefficient of MgO. The sample was heated under vacuum (∼10–5 mbar) at the rate of 15 K/min to the predetermined temperature and held for 30 min prior to data collection. The XRD pattern was recorded in the range of 10 ≤ 2θ ≤ 50° from room temperature to 1273 K.
Determination of phase transitions of samples was carried out using a heat flux type differential scanning calorimeter (DSC-131, SETARAM Instrumentation, France). Temperature calibration for the calorimeter was done using the phase transition temperatures of NIST reference materials (indium: T fus = 429.748 K; tin: T fus = 505.078 K; lead: T fus = 600.600 K; mercury: T fus = 234.316 K; potassium nitrate: T trs = 400.850 K; and silver sulfate; T trs = 703.150 K). Heat calibration of the calorimeter was carried out using the transition heats of the above-mentioned materials. For determination of the phase transition temperature, in the first run, two empty aluminum crucibles of identical masses (10−4 dm3 capacity) covered with lid were kept in the sample and reference cells, and the heat flow versus temperature were measured in the temperature range of 300–473 K at a heating rate of 2 K/min with high purity argon as the carrier gas with a flow rate of 2 dm3/h. In the second run, the heat flow versus temperature were measured by loading the sample in the powder form (∼200 mg) in the sample cell while the reference cell was left empty.
III. RESULTS AND DISCUSSION
A. Characterization: XRD and EPR spectroscopy
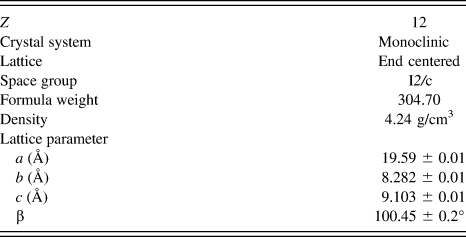
The XRD patterns of the pure and Mn-doped zinc pyrophosphate sample are shown in Fig. 1, from which it can be seen that all the diffraction peaks of both samples can be indexed to the monoclinic phase of α-Zn2P2O7 (ICDD card No. 08–0238). This indicates that Mn2+ occupies the zinc lattice position and has not distorted the crystal structure. Since no impurity peaks are observed, it is feasible to suggest that both samples exist in single phase, i.e., α-Zn2P2O7. The crystallographic data of α-Zn2P2O7 lattice is listed in Table I. The XRD data of the relatively intense peak (I/I 0 > 10) were indexed on a monoclinic system with space group I2/c having cell parameters a = 19.59 ± 0.01 Å, b = 8.282 ± 0.01 Å, and c = 9.103 ± 0.01 Å and β = 100.45 ± 0.2° as represented in Table II. These parameters were obtained by Rietveld refinement of α-Zn2P2O7 (ICDD card No. 08–0238) having a space group I2/c.
XRD pattern of the undoped Zn2P2O7 and 2 mol% Mn2+-doped Zn2P2O7 annealed at 950 °C (as prepared sample).

Crystallography data for α-Zn2P2O7 lattice.
XRD data of α-Zn2P2O7 (λ = 0.15406 nm) annealed at 950 °C.
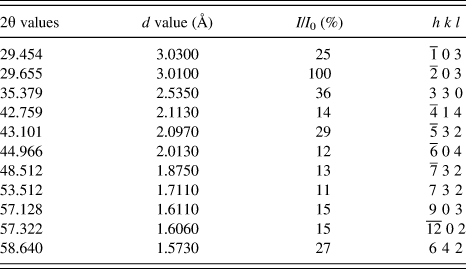
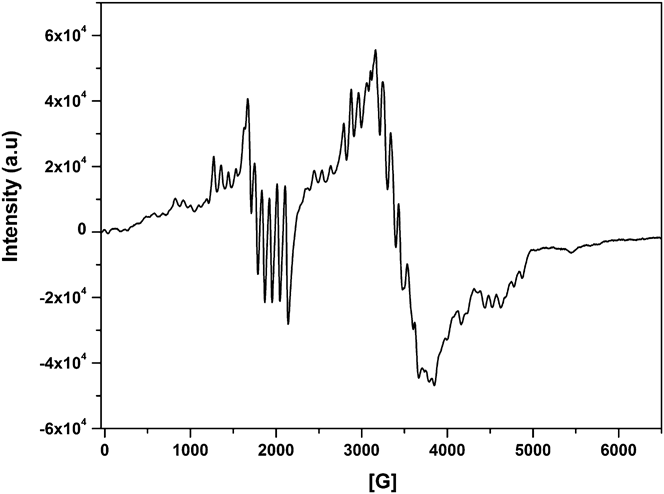
Figure 2 shows the room temperature EPR spectrum of Mn2+-doped Zn2P2O7. EPR can differentiate between Mn2+ and Mn4+ due to the difference in the number of fine transitions and the g values (Mn4+, S = 3/2, three fine transitions and g < 2.00; Mn2+S = 5/2, five fine transitions and g = 2.00). However, Mn3+ (nonKramer ion with S = 2), though paramagnetic, may not be detected due to the possibility of the ground state being singlet and zero-field splitting being large.
Room temperature EPR spectra of Zn2P2O7:Mn.
The ground state of Mn2+ with d5 configuration is unique among dn configurations in that there is only one state with maximum spin multiplicity (6S5/2). In the case of d5 transition metal ions, the axial distortion of octahedral symmetry gives rise to three Kramer's doublets ±5/2, ±3/2, and ±1/2.Reference Singh, Chakradhar, Rao and Kim24 Application of a Zeeman field lifts the spin degeneracy of the Kramer's doublets. As the crystal field splitting is normally much greater than the Zeeman field, the resonance observed is due to transition within the Zeeman field split of Kramer's doublets. The ESR spectrum of Mn2+ in undiluted samples exhibits a broad resonance of g ∼ 2.0. In diluted samples, it shows six allowed transitions (ΔMs = ±1 and ±0) due to the nuclear spin of 55Mn (I = 5/2) or 30 lines due to finite zero-field splitting of Kramer's doublets and nuclear spin interaction.
B. Structural phase transition: HTXRD, DSC, and EPR
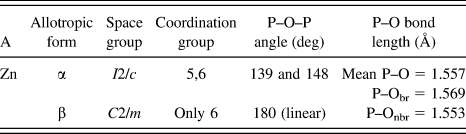
HTXRD pattern is shown in Fig. 3(a). There is pure α-phase at 120 °C; phase transformation takes place at 405 K, which is having mixed features of α and β, but at 473 K, pure β-phase is seen. Individual XRD patterns of α and β phase and their standard pattern are shown in Fig. 3(b). Crystallographic data of zinc pyrophosphate is mentioned in Table III. Lattice parameter obtained for β phase is a = 6.61 ± 0.01 Å, b = 8.29 ± 0.01 Å, and c = 4.51 ± 0.01 Å and β = 105.4 ± 0.2°.
(a): XRD pattern of 2 mol% Mn2+ in Zn2P2O7 at various temperatures (b) XRD pattern α and β phase and their standard pattern of 2 mol% Mn2+ in Zn2P2O7. Arrows indicate missing reflections in β-phase.
Allotropic forms and crystallographic data of Zn2P2O7.
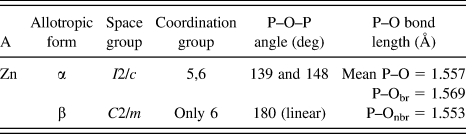
Although structurally both are same, i.e., monoclinic, they crystallize in different space groups. α-phase has lower symmetry I2/c space group, whereas β is having more symmetric C2/m space group. From the XRD pattern, it can be seen that reflections at 2θ values of 16.414, 21.344, 30.0487, and 31.972 completely disappears in more symmetric β-phase. In the β-phase, the four cations in the unit cell lie on the twofold axes and are symmetry related by the centering operation (1/2, 1/2, 0) and by the mirror plane. The variation in the unit cell volume from 298 to 1023 K is shown in Fig. 4. On going from α to β, the phase length of a- and c-axis is reduced by a factor of 1/3 and 1/2 as is observed using HTXRD. This is the reason for volume reduction in the unit cell, while going from alpha to beta phase. There is sudden discontinuity in volume at 405 K which shows that transition is of first order. This result has also been corroborated with differential scanning calorimetry (DSC). Around 405 K, zinc pyrophosphate undergoes a reversible, first order isostructural transition, the phenomenon being supported by the DSC data (Fig. 5).
The temperature variation of the unit cell volume of 2 mol% Mn2+ in Zn2P2O7. Error bars are smaller than symbols.
DSC studies of Mn-doped Zn2P2O7.
Crystal structures of zinc pyrophosphate (both α and β) are shown in Fig. 6. These structures were drawn using the VESTA visualization program.Reference Momma and Izumi25 In both these phases [P2O7]4− anions assume staggered confirmation as shown in Fig. 7.
Crystal structure of (a) α-Zn2P2O7 and (b) β-Zn2P2O7.
The connection between two [PO4] tetrahedra in the [P2O7] group showing a staggered configuration.
The structure of the α-phase is characterized by a sequence of layers. A layer like that found in α-Cu2P2O7 is followed by two layers like those found in α-Mg2P2O7.Reference Robertson and Calvo11 The former layers have anions lying on 2-fold axes, and the cations are coordinated to five oxygen atoms; in the next two layers, half of the cations are five coordinates and another half is six coordinated, and the anions in these layers show only approximate twofold axes. All the anions show nonlinear P–O–P bonds.
The crystal structure of β-phase is identical with that of Mn2P2O7.Reference Calvo26 In β-phase, the structure is described by alternate anion and cation layers stacked along the c direction and observed at z = 0 and z = 1/2, respectively. The asymmetric unit contains a unique Zn2+ cation. The short distance between cations along the c direction is about 4.51 Å. In the cationic layers, Zn2+ is found on 2-fold axes in irregular 6-fold coordination,Reference Calvo, Nest and Datars27 i.e., they are not at the center of the oxygen atom environment and displaced by about 0.3 Å from a line joining O3 to its mate generated by the 2-fold axis.
The major component of these distortions arises from a rotation of the O3–O3 edge from its ideal position by 30° about the 2-fold axis. Such a distortion arises from the constraints placed upon the positions of the oxygen atoms by the requirements of its bonding to the phosphorus atom. Detailed crystallographic data of both these two phases are mentioned in Table III.
Temperature-dependent EPR investigation of Mn in Zn2P2O7 is shown in Fig. 8. Robertson and CalvoReference Robertson and Calvo11 have reported EPR evidence for phase transition in single crystals of Zn2P2O7 using Mn2+ as an EPR probe. Their studies have showed that α-Zn2P2O7, the stable phase at room temperature, undergoes a first-order phase transition at 405 K and an inhomogeneous second-order transformation between 405 and 428 K. We could identify the phase transitions at 132 °C in our powder sample, but second-order phase transition is difficult to identify in the powder sample, although some kink at 428 K is obtained in DSC studies (Fig. 5), discussed earlier.
EPR spectra of 2 mol% Mn2+ in Zn2P2O7 at various temperatures.
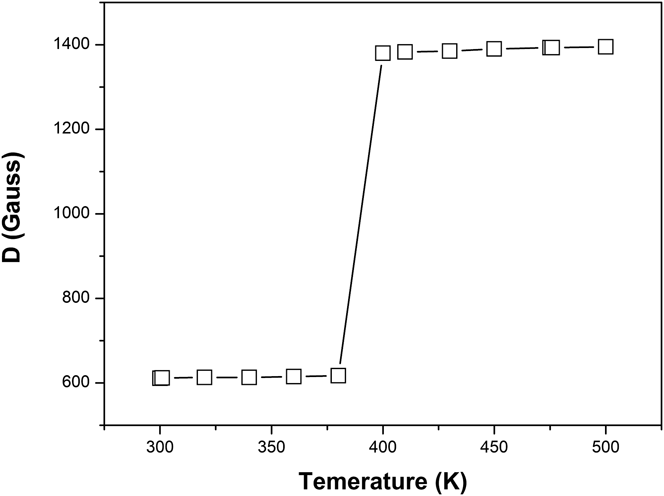
It can be seen from the EPR pattern (Fig. 8) that spectra changes drastically going from 390 to 400 K. Highly resolved hyperfine sextet of Mn2+ can be seen till 390 K, whereas at 400 K, the hyperfine splitting completely disappears and the spectrum merges to a broad signal. Zero-field splitting parameter (D) was evaluated for Mn2+ from room temperature to 500 K (Fig. 9). It was observed that there is a sudden jump (discontinuity) in the value at 400 K (phase transition temperature) confirming the transition to be of first order.
The temperature variation of the zero-field splitting parameter for Zn2P2O7:Mn2+.
The D value for Mn2+ in the β phase (1380 G) is unusually large. It is tempting to suggest that this large D value is related to the highly irregular cation environment. The D values in the intermediate temperature region, however, show very large changes from their high-temperature value despite an apparently small change in the electron density distribution of the crystal. These observations could be consistent only if D depends on a higher power of a component of the crystalline field. The enhanced line broadening in β-phase could result from a residual short range ordering near the transition temperature, which yields a small spread in the crystalline field. The fact that orthorhombic distortion term (E) is small in β-phase and a large change in D across the transition temperature suggests that the structural change involves primarily distortions along Zn–O3 bond. Since the bond between the central oxygen atom and adjacent phosphorous atom of the [P2O7]4− lies along the z-direction in the β-phase, it might be suggested that the mechanism for the change in structure involves primarily either a small change in length of these P–O bonds or a contraction of the P–O–P bond angle.
As evident by HTXRD and structural studies [Fig. 6(a)], in α-phase, there are two types of zinc ions: asymmetric 5-coordinated Zn2+ and relatively symmetric 6-coordinated Zn2+ (Zn1 and Zn2). In the case of β-phase, only asymmetric 5-coordinated zinc exists (Zn1) as can be seen from Fig. 6(b).
Main changes in the EPR pattern from α to β phase are enhanced line broadening and unusual large zero-field splitting parameter. This can be correlated with the presence of distorted octahedra of oxygen around Zn2+ ion in β-phase. The phase transformation then requires that the five-fold coordinated sites of α phase form a sixth bond with oxygen atoms. This requires that oxygen atoms move from an average cation-oxygen distance of 3.2 Å to the “normal” bond distance of 2.15 Å found in β-Zn2P2O7.
IV. CONCLUSIONS
Metal polyphosphates show a great variety of compositions, crystal structures, and properties. Nowadays, they have become an important constituent class of compounds for exploring new functional materials. Understanding their thermal and phase stability is very important for application in sensors, solid-state laser materials, piezoelectric, luminescence, ceramics, catalysis, adsorption, ionic conductors, and magnetic materials. We could identify the phase transitions between 390 and 400 K in our powder sample by EPR and HTXRD. DSC confirmed that the transition is reversible and is of 1st order. HTXRD has shown that the length of a-axis is tripled and c-axis is doubled in α-phase as compared to β-phase. This is the reason for volume reduction in the unit cell, while going from α to β phase. There is sudden discontinuity in volume at 405 K, which shows that the transition is of first order. The effect of temperature on zero-field splitting parameter was also studied, and there is a sudden jump (discontinuity) in the value at 400 K (phase transition temperature) confirming the transition to be of first order. The D value for Mn2+ in the β phase (1380 G) is unusually large, which is related to its highly irregular cation environment.