During the process of reading, readers rapidly integrate different information types; for example, they decode lexical items, build syntactic structure, and incrementally assign an interpretation to the incoming string of words. While typical literate native readers complete these processes with ease, sentence comprehension in a second language (L2) proceeds less efficiently. In particular, research on L2 sentence processing finds that building syntactic structure is associated with greater difficulty than in native sentence comprehension (for an overview, see Roberts, Reference Roberts and van Gompel2013).
Current models of L2 processing tie these difficulties to age-related changes in syntactic representations (Clahsen & Felser, Reference Clahsen and Felser2006), proceduralized grammatical knowledge (Ullman, Reference Ullman and Sanz2005), or attenuation in the integration of morphosyntactic knowledge in real-time comprehension (Jiang, Reference Jiang2007). However, these models that identify structure building as the main locus of differences between native and nonnative processing typically do not consider that syntactic structure building is but one step in the comprehension process. Among other things, parsing crucially relies on the completion of other nonsyntactic processes that occur earlier and feed into structure building, in particular lexical retrieval.
In consequence, other approaches have argued that part of the difficulty in processing L2 syntax may reflect lower levels of efficiency in lexical processing that subserves parsing (e.g., Dekydtspotter & Renaud, Reference Dekydtspotter and Renaud2014; Dekydtspotter, Schwartz, & Sprouse, Reference Dekydtspotter, Schwartz, Sprouse, O’Brien, Shea and Archibald2006; Hopp, Reference Hopp2014; Miller, Reference Miller2014). Differences in native and nonnative syntactic processing would then not index qualitative differences in how sentence structure is assembled but reflect quantitative slowdowns in lexical access that are inherent to L2 processing. These slowdowns may then have knock-on effects in that syntactic structure building is delayed or attenuated compared to native processing. However, the relation between delays or difficulties in lexical processing and syntactic structure building has not been tested directly in L2 sentence comprehension.
Therefore, this study investigates (a) whether slower lexical processing affects syntactic structure building in the L2 and (b) whether differences in lexical processing between first language (L1) and L2 readers can give rise to differences between nonnative and native parsing. Following on previous research on native processing (Tily, Fedorenko, & Gibson, Reference Tily, Fedorenko and Gibson2010), we test how the online L2 comprehension of subject and object clefts, which differ in syntactic complexity, is moderated by differences in lexical access, as manipulated by frequency differences of the main clause verb.
The findings show that lexical processing systematically affects L2 syntactic processing, with linear delays of syntactic structure building as verb frequency decreases in L2 processing. Native processing is not affected by differences in lexical processing in the same frequency range; however, comparable effects of verb frequency on structure building surface for much lower frequency verbs in native comprehension. The main finding that L2 readers show larger frequency effects than natives supports current models of the bilingual lexicon such as the weaker links hypothesis (Gollan, Montoya, Cera, & Sandoval, Reference Gollan, Montoya, Cera and Sandoval2008). It is critical that these effects implicate differences in syntactic structure building between natives and nonnatives. Such lexical and syntactic interactions are compatible with capacity models of L2 processing (e.g., Hopp, Reference Hopp2010; McDonald, Reference McDonald2006) and the lexical bottleneck hypothesis (Hopp, Reference Hopp2014), which suggest that native and nonnative syntactic processing are fundamentally isomorphic, yet differ in resource allocation.
This article discuss previous studies on lexical influences in L1 and L2 sentence processing. Then the study is presented and its findings are discussed.
LEXICAL AND STRUCTURAL EFFECTS IN L2 PROCESSING
Several studies on L2 sentence processing have observed that L2 learners differ from native speakers in creating hierarchical sentence structure (e.g., Felser, Roberts, Marinis, & Gross, Reference Felser, Roberts, Marinis and Gross2003; Papadopoulou & Clahsen, Reference Papadopoulou and Clahsen2003) or in positing syntactic filler-gap dependencies (e.g., Felser, & Roberts, Reference Felser and Roberts2007; Marinis, Roberts, Felser, & Clahsen, Reference Marinis, Roberts, Felser and Clahsen2005; but see Omaki & Schulz, Reference Omaki and Schulz2011) in real-time comprehension. Unlike native speakers, L2 readers failed to evince online sensitivity to syntactic structure in those studies. Although a growing body of research shows that late L2 learners may in principle compute syntax in online comprehension, provided they have attained high proficiency (e.g., Hopp, Reference Hopp2006; Rossi, Gugler, Friederici, & Hahne, Reference Rossi, Gugler, Friederici and Hahne2006), sustained naturalistic exposure (Plitsiakis & Marinis, Reference Pliatsikas and Marinis2013), or reached high aptitude levels (Hopp, in press), the question remains why most L2 readers do not come to show nativelike use of syntax in processing the L2.
One type of approach holds that difficulties among L2 learners in accessing or projecting structure in parsing results from the restricted availability of syntactic information in L2 processing (e.g., Clahsen & Felser, Reference Clahsen and Felser2006; Ullman, Reference Ullman and Sanz2005), which may only be overcome, if at all, at the highest proficiency levels. A second type of approach posits that advanced L2 learners are capable of using syntactic information in principle; however, the extent to which they recruit syntax is constrained by lower resources among L2 learners compared to native speakers in working memory (e.g., Dussias & Pinar, Reference Dussias and Pinar2010; Havik, Roberts, van Hout, Schreuder, & Haverkort, Reference Havik, Roberts, van Hout, Schreuder and Haverkort2009), by lower degrees of automaticity in integrating linguistic information (Hopp, Reference Hopp2009; Sorace, Reference Sorace2011), by slower L2 reading speed (Hoover & Dwivedi, Reference Hoover and Dwivedi1998; Kaan, Ballantyne, & Wijnen, Reference Kaan, Ballantyne and Wijnen2014; Roberts & Felser, 2011), or by slowdowns in linguistic processing that subserves parsing, in particular lexical access (McDonald & Roussel, Reference McDonald and Roussel2010; Miller, Reference Miller2014). This paper examines the effects of lexical processing on structure building in L2 processing.
For lexical processing, a large body of work on bilingual word recognition and production has documented two major aspects that give rise to temporal differences between L1 and L2 lexical processing (for an overview, see Tokowicz, Reference Tokowicz2015): (a) lexical access is non-language-selective such that bilingual readers activate lexical representations across languages, and (b) lexical retrieval of language-particular word forms is slower and is associated with larger frequency effects in nonnative than in native processing.
Evidence of cross-linguistic lexical activation comes from research on word forms that are ambiguous between languages, for example, cognates like English–German “film.” In the context of single-language tasks, L2 speakers, unlike monolinguals, process cognate words faster compared to lexically matched language-particular word forms (e.g., “movie”), which indicates that lexical representations across languages are activated even when only one language is in use (Dijkstra, Reference Dijkstra, Kroll and De Groot2005). Such facilitation remains in monolingual L1 or L2 sentence contexts, which clearly demarcate the language in use (e.g., Duyck, Van Assche, Drieghe, & Hartsuiker, Reference Duyck, Van Assche, Drieghe and Hartsuiker2007; Van Assche, Drieghe, Duyck, Welvaert, & Hartsuiker, Reference Van Assche, Drieghe, Duyck, Welvaert and Hartsuiker2011; though see Libben & Titone, Reference Libben and Titone2009; Schwartz & Kroll, Reference Schwartz and Kroll2006; Titone, Libben, Mercier, Whitford, & Pivneva, Reference Titone, Libben, Mercier, Whitford and Pivneva2011). Conversely, interlingual homographs, that is, language-ambiguous word forms that have different meanings in L1 and L2, lead to slowdowns compared to control words in sentence comprehension by bilingual readers (e.g., Libben & Titone, Reference Libben and Titone2009).
For language-particular L2 words, L2 speakers are consistently slower than natives in lexical retrieval of lexical decision tasks, and they are more prone to retrieval errors, for example, false starts and slips of the tongue in picture naming (for an overview, see Kroll & Hermans, Reference Kroll, Hermans, Schmid and Lowie2011). Slower lexical retrieval among L2 learners extends to sentence production (e.g., Runnqvist, Gollan, Costa, & Ferreira, Reference Runnqvist, Gollan, Costa and Ferreira2013) and L2 reading comprehension (e.g., Gollan et al., 2011). In these tasks, L2 learners have longer naming or recognition latencies than native speakers, and L2 readers show larger frequency effects than natives; that is, nonnative readers evince more pronounced slowdowns in the recognition of low-frequency items compared to monolinguals. Segalowitz and Segalowitz (Reference Segalowitz and Segalowitz1993) relate slower lexical access and enhanced frequency effects to less automatic processing, because L2 learners (especially at lower proficiency levels) have less practice in retrieving lexical items than natives. In a similar vein, the weaker links hypothesis (Gollan et al., Reference Gollan, Montoya, Cera and Sandoval2008) conceives of attenuated lexical retrieval efficiency as a direct reflection of a frequency lag in accessing word forms that is inherent to bilingualism. Because bilinguals divide their time speaking and comprehending between two (or more) languages, they activate word forms less often than monolinguals do, which results in slower lexical retrieval, especially for low-frequency items. These effects are also attested in sentence comprehension, where even biasing semantic and syntactic contexts do not attenuate bilingual disadvantages in lexical retrieval (Gollan et al., Reference Gollan, Slattery, Goldenberg, van Assche, Duyck and Rayner2011). Diependaele, Lemhöfer, and Brysbaert (Reference Diependaele, Lemhöfer and Brysbaert2013) show that frequency effects in L2 word recognition are strongly correlated with language proficiency measures in L2 learners, which in turn reflect use of and exposure to the L2. Whitford and Titone (Reference Whitford and Titone2012) extend this finding to reading in sentence contexts and report (a) that lexical frequency effects are more pronounced for bilinguals reading in their L2 than in their L1 and (b) that the size of the frequency effect in both L1 reading and L2 reading is related to current use of the respective language.
In sum, there is robust evidence from studies on bilingual word recognition that cross-linguistic coactivation and lower levels of L2 use affect lexical processing in the L2 and, in particular, that lower degrees of language use place greater demands on lexical retrieval in L2 users than in natives in sentence comprehension. However, few studies have investigated whether and how these characteristics of bilingual lexical processing may interact with syntactic processing in L2 comprehension.
Using cognates, Miller (Reference Miller2014) examines effects of lexical access on the L2 processing of wh-dependencies. Previous cross-modal priming studies on gap filling in L2 speakers found that adult L2 readers do not posit syntactic traces or gaps but seem to prefer to integrate the wh-filler with the verb directly (Felser & Roberts, Reference Felser and Roberts2007; Marinis et al., Reference Marinis, Roberts, Felser and Clahsen2005; yet see Plitsiakis & Marinis, Reference Pliatsikas and Marinis2013). For instance, Felser and Roberts (Reference Felser and Roberts2007) presented picture probes that were to be categorized by participants as “alive” or “not alive” at two points when they heard sentences like “John saw the peacock to which the small penguin gave the nice [#1] birthday present [#2] in the garden last weekend.” Native speakers of English show faster reaction times to identical than to nonidentical probes (e.g., “peacock” vs. “carrot”) in the gap position [#2], yet not in the control position [#1], which suggests they activate the filler at the gap position only. In contrast, Greek–English advanced learners did not show a difference in reaction times between the two positions. In order to test for potential effects of slower lexical retrieval, Miller (Reference Miller2014) varied the cognate status of the probes, with cognate probes allowing for faster lexical processing than noncognate probes due to cognate facilitation. English–French intermediate and advanced learners showed targetlike priming of the probes at the gap position, yet not at the control position for cognate nouns, while they demonstrated no difference for noncognate nouns in object cleft sentences and relative clauses. Miller relates these findings to faster lexical processing of cognates, which is argued to free resources for target syntactic computations. However, the study did not actually test whether the cognate words used were processed faster, and the native speaker controls showed no evidence of trace reactivation in the same condition.
In other studies, slower lexical retrieval speed among L2 readers was found to moderate syntactic attachment preferences in L2 processing. In an eye-tracking study (Hopp, Reference Hopp2014), German–English intermediate to advanced L2 readers were tested on different types of temporally ambiguous relative clauses as well as a battery of working-memory and lexical decoding tasks. Clauses differed in the locality of disambiguation, being disambiguated either by number agreement immediately after the relative pronoun (“The secretary of the professors who was sick resigned”) or later by stereotypical gender on a reflexive pronoun (“The secretary of the professor who had injured herself resigned”). Whereas all L2 learners preferred structure-based attachment of the relative pronoun to the second noun of the complex noun phrase for the former type of sentence, only the fast lexical decoders evinced nativelike reading time differences for the nonlocally disambiguated sentences. Hence, slower lexical processing appeared to preclude L2 readers from computing the targetlike structure in the more resource-demanding nonlocal disambiguation condition. Similarly, L2 judgment accuracy for morphosyntactic past-tense violations correlates with speed of lexical decoding (McDonald & Roussell, Reference McDonald and Roussel2010). Finally, several studies that consider reading speed as a variable report that only faster L2 readers evince reading patterns akin to those of natives, while slower L2 readers (Roberts & Felser, 2011) or readers that differ from natives in reading speed (Kaan et al., Reference Kaan, Ballantyne and Wijnen2014) displayed less targetlike online use of syntactic information in the comprehension of ambiguous sentences. Because reading speed subsumes lexical decoding ability, these results may be taken to further indicate that differences in lexical processing underlie some of the differences between native and nonnative sentence comprehension.
To summarize, the few available studies on lexical effects on L2 sentence processing suggest that part of the difficulty with L2 syntactic processing may be caused by delays in lexical processing that subserves parsing. However, most of the evidence is circumstantial to date, and it remains to be tested whether there are systematic interactions between lexical and syntactic processes in L2 sentence comprehension.
LEXICAL AND STRUCTURAL EFFECTS IN NATIVE SENTENCE COMPREHENSION
In research on monolingual sentence processing, the question of what information types interact in parsing and, in particular, the manner in which lexical(-thematic) information affects structure building has long been a central issue. In syntax-first models (e.g., Frazier, Reference Frazier and Coltheart1987), parsing exclusively encompasses syntactic structure building in a first stage, which proceeds on the basis of a preliminary lexical analysis of items in terms of syntactic category. In a subsequent stage, further lexical information (e.g., thematic and interpretive properties) is integrated in the parse and can lead to reanalysis if the initial parse proves incompatible with the nonsyntactic information integrated later. In contrast, lexicalist constraint-based models (e.g., MacDonald, Pearlmutter, & Seidenberg, Reference MacDonald, Pearlmutter and Seidenberg1994) assume only one stage in parsing in which all types of information, including syntactic, lexical, semantic, and world-knowledge information, compete for selection of a parse from the outset (e.g., Trueswell, Tanenhaus, & Garnsey, Reference Trueswell, Tanenhaus and Garnsey1994). Finally, in expectation-based models of sentence processing, such as the surprisal model (Hale, Reference Hale2001; Levy, Reference Levy2008), the parser continuously computes the probability of the next item in the input based on the previous context, including syntactic and lexical information. In sum, then, major current models of sentence processing postulate effects of both lexical and structural information in comprehension, yet they differ in terms of whether they are temporally ordered in syntax-first models, whether they are computed in parallel in constraint-based models, or whether they are weighted relative to each other in expectation-based models.
Many studies find that the native parser is sensitive to lexical and thematic information at the earliest stages in parsing in that the parser immediately integrates lexical–thematic information of the verb in its parse (e.g., Staub, Reference Staub2007; Trueswell et al., Reference Trueswell, Tanenhaus and Garnsey1994). Moreover, lexical selectional biases inform parsing commitments. For instance, Garnsey, Pearlmutter, Myers, and Lotocky (Reference Garnsey, Pearlmutter, Myers and Lotocky1997) found that the frequency with which verbs take direct or clausal complements affects reading times of the complements (the “verb bias” effect). Hence, initial parsing choices are guided by subcategorization, thematic preferences, and frequency information.
In addition, readers retrieve lexical information that is irrelevant to the current parse. When presented with polysemous words like “bug” in priming studies, listeners access both meanings of the word form initially, independently of the semantic context provided (Seidenberg, Tanenhaus, Leiman, & Bienkowski, Reference Seidenberg, Tanenhaus, Leiman and Bienkowski1982; Swinney, Reference Swinney1979). Only when the context biases toward the higher frequency interpretation does activation of the other (i.e., lower frequent) interpretation subside (Tabossi, Colombo, & Job, Reference Tabossi, Colombo and Job1987). Comparable results were found for sentence reading (e.g., Binder & Rayner, Reference Binder and Rayner1998). Nevertheless, when the context supports the less frequent (subordinate) interpretation of an ambiguous word, ambiguous words were still read more slowly compared to matched unambiguous control words (Rayner, Pacht, & Duffy, Reference Rayner, Pacht and Duffy1994). Boland and Blodgett (Reference Boland and Blodgett2001) further demonstrate that frequency differences in the occurrence of an ambiguous word (e.g., “duck”) as either a noun or a verb tally with its processing difficulty in syntactic contexts that bias toward the lower frequency category of the word form (see also Fedorenko, Piantadosi, & Gibson, Reference Fedorenko, Piantadosi and Gibson2012; Folk & Morris, Reference Folk and Morris2003). Taken together, these findings illustrate that multiple interpretations and frequency characteristics of individual words are accessed in sentence comprehension and that lexical ambiguity or retrieval difficulty due to low frequency can delay sentence comprehension.
Focussing on effects of lexical frequency in sentence comprehension, Tily et al. (Reference Tily, Fedorenko and Gibson2010) studied whether lexical frequency impacts the timing of syntactic structure building in online comprehension. In this study, which will serve as the model of the present experiment, readers read subject cleft sentences (1a) and object cleft sentences (1b).
-
(1)
-
a. It was Vivian who lectured Terrence for always being late. (subject cleft)
-
b. It was Vivian who Terrence lectured for always being late. (object cleft)
-
A host of studies document that readers evince processing slowdowns for object clefts (1b) on the main verb (“lectured”) compared to subject clefts (e.g., Gennari & MacDonald, Reference Gennari and MacDonald2008; Gibson, Reference Gibson1998; Gordon, Hendrick, & Johnson, Reference Gordon, Hendrick and Johnson2001; King & Just, Reference King and Just1991; Traxler, Morris, & Seely, Reference Traxler, Morris and Seely2002). The greater relative difficulty of object clefts has been related to different and partially overlapping causes. Subject clefts are structurally less complex than object clefts (e.g., Clifton & Frazier, Reference Clifton, Frazier, Carlson and Tanenhaus1989), and they impose fewer memory demands on the reader than object clefts due to the shorter distance between the filler and the gap position (Gibson, Reference Gibson1998). In object clefts, the subject noun phrase can lead to interference in the integration of the object noun phrase (Gordon et al., Reference Gordon, Hendrick and Johnson2001). Other approaches hold that subject clefts present less processing difficulty because they correspond to the near-canonical subject–verb–object main clause order in English (MacDonald & Christiansen, Reference MacDonald and Christiansen2002) or because they are more frequent in English (e.g., Gennari & MacDonald, Reference Gennari and MacDonald2008; Hale, Reference Hale2001).
Regardless of differences between these approaches, they share the assumption that processing preferences for subject versus object clefts are reflected by or associated with differences in syntactic structure between subject versus object clefts in that the more complex, less preferred or less frequent object cleft structure necessitates greater structure-building effort or syntactic reanalysis in comprehension.
In addition to cleft type, Tily et al. (Reference Tily, Fedorenko and Gibson2010) manipulated the lexical frequency of the verb, creating pairs of sentences with high-frequency verbs (e.g., “lectured”) and low-frequency verbs (e.g., “chided”). In a self-paced reading task, they found a significant interaction of syntactic structure and verb frequency, indicating that reading slowdowns for object clefts surface on the cleft region itself for high-frequency verbs but emerge for low-frequency verbs only in the postcleft region. A subsequent analysis that coded verb frequency as a continuous variable showed a linear correspondence between verb frequency and the timing of the reading slowdowns for object versus subject clefts. Tily et al. interpret these findings as indicating a staged and interactive architecture of lexical and syntactic processing, such that greater demands of lexical access delay the computation of syntactic processes in native comprehension.
In a series of eye-tracking experiments, Staub (Reference Staub2011) replicates staged effects of lexical frequency and structure-building difficulties for sentences involving temporary object–subject ambiguities (“While the professor lectured the students {walked/ambled} across the quad.”). However, lexical and structural effects did not interact. Low-frequency verbs elicited longer first-pass reading measures on the verb, while syntactic ambiguity was associated with elevated later measures on the verb or in later segments in the sentence. Staub concludes that the pattern of findings underlines the seriality of lexical and syntactic processes in parsing, with a stage of extensive lexical processing preceding syntactic integration.
In sum, monolingual research on sentence processing reports that lexical retrieval precedes effects of structure building. In some studies, lexical access was found to interact with syntactic processing in that higher demands on lexical retrieval can occasion delays in structure building.
THE STUDY
Building on these findings in monolingual sentence processing, the aim of the present study is to investigate (a) whether and how demands of lexical processing affect the computation of syntactic structure in L2 sentence comprehension and (b) whether high(er) demands in lexical processing in L2 readers can lead to differences between native and nonnative syntactic processing. In the present study, we focus on effects of lexical frequency on syntactic processing.
We adapted the study by Tily et al. (Reference Tily, Fedorenko and Gibson2010) on cleft structures for German–English readers. We chose cleft structures because they constitute nonlocal dependencies that can be successfully processed by intermediate to advanced L2 learners (Miller, Reference Miller2014; Reichle & Birdsong, Reference Reichle and Birdsong2014). Moreover, German has equivalent cleft structures, such that any differences between natives and nonnatives, in particular the potential lack of effects of syntactic structure in the nonnative group, cannot be due to L1 transfer in the current experiment. In addition to structure, we varied the corpus frequency of the verbs in the main clause to test for potential relations between lexical and syntactic processing.
The simultaneous experimental manipulation of structural and lexical (frequency) properties allows us to assess whether lexical processing systematically affects syntactic structure building in L2 sentence comprehension. Depending on the relation between lexical and syntactic processing, we would expect to see either main effects or interaction effects of frequency and clause structure.
If lexical processing and structure building are independent in L2 processing, frequency and structure could exert influences on the position of the verb, with additive effects of frequency and structure, that is, longer reading times for low-frequency verbs and longer reading times for object clefts in the same region. Alternatively, if delays in lexical processing impinge on structure building, we may observe an interaction of frequency and structure in that lexical frequency effects surface in one region, which, in turn, delay effects of structure to a following region.
Against the backdrop of the interaction of frequency and structure observed for native speakers in Tily et al. (Reference Tily, Fedorenko and Gibson2010), we expect to find a similar interaction for L2 readers. However, because lexical retrieval is less automatic in L2 readers compared to native speakers, the effects may appear in a higher frequency range and be more pronounced in L2 learners than in natives.
Materials
We designed quadruplets of sentences that crossed the factors cleft structure (subject vs. object cleft) and verb frequency (high vs. low) as in (2).
-
(2)
-
a. It was Amanda who scared Sulena with a frightening look. (subject cleft, high-frequency verb)
-
b. It was Amanda who horrified Sulena with a frightening look. (subject cleft, low-frequency verb)
-
c. It was Amanda who Sulena scared with a frightening look. (object cleft, high-frequency verb)
-
d. It was Amanda who Sulena horrified with a frightening look. (object cleft, low-frequency verb)
-
The materials were initially adopted from Tily et al. (Reference Tily, Fedorenko and Gibson2010). However, when piloting the stimuli, we found that most of the low-frequency verbs employed in that study proved to be unknown to L2 learners in the population to be studied in the present study. In consequence, the items were adapted as follows. In order to identify low-frequency verbs that would be known to the participants, we devised a web-based task in which 36 verb pairs (high and low frequency) with similar meanings each were tested for familiarity. The verbs were each embedded in simple (nonclefted) subject–verb–object sentences using the same subjects and objects as in the experimental items. In each sentence, the verb was underlined and participants had to (a) indicate whether they were familiar with the word (yes/no), and (b) if yes, provide a translation. The items were distributed across two lists of 36 items (containing 18 high-frequency and 18 low-frequency verbs) each; for each list, 16 participants drawn from a comparable population as the one tested in the main experiment took part. From the 36 verb pairs, the 24 pairs that received the highest familiarity ratings and the most correct translations were selected for the study. The 24 high-frequency verbs received a mean familiarity rating of 100%, and the low-frequency verbs obtained a mean familiarity of 92.5%. Each item was translated correctly by at least 50% of the participants.Footnote 1 The final set of verbs chosen for the main experiment had a mean lemmatic log frequency of 1.82 (SD = 0.68) for the low-frequency verbs and 2.96 (SD = 0.48) for the high-frequency verbs according to the subtitle corpus SUBTLEX-UK (Van Heuven, Mandera, Keuleers, & Brysbaert, Reference Van Heuven, Mandera, Keuleers and Brysbaert2014). A one-way analysis of variance yielded a highly significant difference between high-frequency and low-frequency verbs, F (1, 46) = 45.431, p < .001. Note that even the verbs in the low-frequency category were still fairly common verbs, especially when compared to the low-frequency verbs used in Tily et al. (Reference Tily, Fedorenko and Gibson2010; see Appendix A).Footnote 2 The verbs in the present study did not comprise any English–German cognates or homographs that would skew the frequency distribution. In the analysis, we will use frequency both as an aggregate (high vs. low frequency) and as a continuous variable (as per the log frequency).
Participants
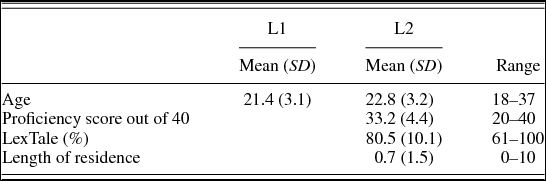
Sixty-two adult L2 learners of English with German as an L1 (mean age = 22.8 years; 47 females) were recruited and tested at a German university. In addition, 36 native speakers of English (mean age = 21.4 years; 23 females) were tested in Germany and the United States. All L2 learners were dominant in German, as assessed by their current frequency of use of German and English. They completed a 40-item cloze test of English proficiency adopted from Slabakova (Reference Slabakova2000), which focuses on a range of structural and lexical features. In order to obtain more detailed information on lexical knowledge among the participants, they also took the Lexical Test for Advanced Learners of English (LexTALE) task (Lemhöfer & Broersma, Reference Lemhöfer and Broersma2012), which is an untimed lexical decision task containing 40 real words and 20 pseudowords. The scores of the general proficiency test and the LexTALE correlated significantly (r = .631, p < .001). Detailed participant information is given in Table 1.
Participant information
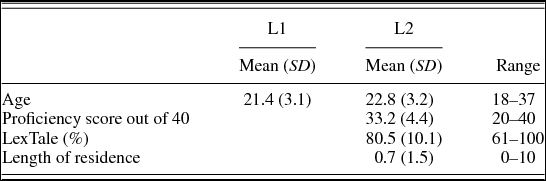
Note: L1, First language (n = 36); L2, second language (n = 62).
Procedure
According to a Latin-square design, we created four lists of the 24 quadruplets in (2). Forty-eight fillers comprising a variety of structures were added. Participants were tested individually on a desktop PC with a 19-in. screen. A noncumulative moving-windows self-paced reading task and LexTALE were administered via the software E-Prime (Schneider, Eschman, & Zuccollotto, Reference Schneider, Eschman and Zuccolotto2002). At the beginning of each trial, participants focused on a fixation cross in the position of the first word of the sentence. Subsequently, they used the space bar to call up each word of the sentence. All words were in 14-point Courier font, and all sentences fit on one line. After the final word in the sentence, followed by an end period, a comprehension question targeting the interpretation of the cleft appeared for all experimental sentences (e.g., “Did Sulena scare Amanda?” for [2]). In addition, half of the fillers were followed by questions about various parts of the sentence. Participants answered by pressing designated buttons on the keyboard for “yes” and “no.”
The L2 participants first completed the self-paced reading task, then filled in the biographical questionnaire, and subsequently completed the LexTALE task and the cloze test. In addition, they were administered other tasks not relevant to the study at hand. In total, the experimental session lasted 60 min, and the reading experiment took between 15 and 20 min. The L1 speakers only took the self-paced reading task and completed a biographical questionnaire. The L2 speakers received 5 € as reimbursement for their participation.
RESULTS
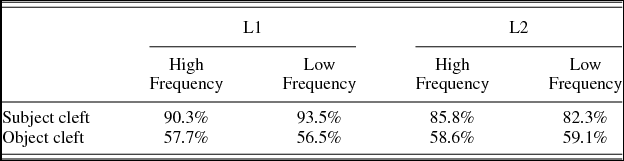
Table 2 presents the comprehension accuracy to the comprehension questions following the sentences. A repeated measures analysis of variance with the factors structure (subject vs. object cleft) and frequency (low vs. high) as within-participant factors and language as a between-participant factor yielded a significant main effect of structure, F 1 (1, 97) = 84.165, p < .001; F 2 (1, 46) = 88.312, p < .001, yet no main effect of frequency, F 1 (1,97) = 0.026, p = .872; F 2 (1, 46) = 0.011, p = .916, nor an interaction of the two, F 1 (1, 97) = 0.243, p = .623; F 2 (1, 46) = 0.016, p = .900. There were no interactions with the factor language, except for a marginal interaction of structure and language in the analysis by participants, F 1 (1, 97) = 3.030, p = .085; F 2 (1, 46) = 2.187, p = .146, which reflects the lower accuracy of the L2 readers for the subject clefts.
Comprehension accuracy according to sentence type and lexical frequency
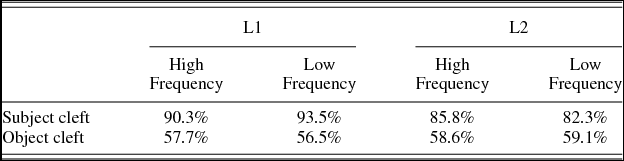
Note: L1, First language (n = 36); L2, second language (n = 62).
Summarizing, object clefts were significantly more difficult to comprehend than were subject clefts for both groups. However, frequency differences in the verbs did not lead to differential comprehension accuracy. These findings indicate that the lower frequency verbs did not in and of themselves prove unknown or difficult to understand to the L2 participants.
Turning to the reading data, we first removed outliers with reading times below 100 ms. This led to the exclusion of less than 1.3% of the data. Reading times <3 or >3 SD from the group mean were trimmed to the mean ±3 SD of the group mean. We analyzed the reading times for all items regardless of comprehension accuracy.Footnote 3 All calculations were performed on residual reading times to reduce effects of individual variation in reading times and to control for differences in length of the segments.
For the purposes of the analysis, we divided the sentences into different regions, namely, the beginning (“it was”), the proper name and the relative pronoun (“Amanda who”), the first critical region comprising the cleft and the verb (“scared Sulena” or “Sulena scared”), the second critical region (postcleft region) containing the two words following the cleft (“with a”), and the rest of the sentence (“frightening look.”). We report the results for the cleft region and the postcleft region.
We computed a linear mixed-effects models that included subject and item intercepts as random effects and the factors structure (subject cleft or object cleft) and frequency (high vs. low) as well as language (L1 vs. L2) as fixed effects.
For the cleft region, the analysis of the reading times returned a significant effect of structure (β = 561.28, SE = 237.56, t = 2.363; p = .018), an effect of frequency (β = 555.96, SE = 237.53, t = 2.341; p = .019), and an interaction of structure and frequency (β = 346.34, SE = 150.28, t = 2.305; p = .021). It is critical that these effects were qualified by a three-way interaction of structure, frequency, and language (β = 271.08, SE = 87.77, t = 3.089; p = .002).
For the postcleft region, there was a significant effect of structure (β = 164.93, SE = 74.81, t = 2.151; p = .032), an interaction of structure and frequency (β = 64.71, SE = 32.10, t = 2.016; p = .044), yet no interaction of structure, frequency, and language (β = 2.78, SE = 66.84, t = 0.042; p = .967).
In light of the significant interactions with the factor language, we broke down the data according to language group for all subsequent analyses.
For the L1 group, Figure 1 graphs the mean residual reading times of subject clefts and object clefts for the cleft region by frequency, and Figure 2 displays the mean residual reading times in the postcleft region. The graphs for the L1 group show that the difference between subject and object clefts is more pronounced for low-frequency verbs than for high-frequency verbs in both regions. For each region, we computed a linear mixed-effects models that included subject and item intercepts as random effects and the factors structure (subject cleft or object cleft) and frequency (high vs. low) as fixed effects.
Cleft region. Mean residual reading times (ms) for (light bars) subject clefts and (dark bars) object clefts by frequency group. All first language participants (n = 36). Error bars denote the standard error of the mean.

Postcleft region. Mean residual reading times (ms) for (light bars) subject clefts and (dark bars) object clefts by frequency group. All first language participants (n = 36). Error bars denote the standard error of the mean.

For the cleft region, the analysis of the reading times returned a significant effect of structure (β = 197.65, SE = 94.02, t = 2.102; p = .036), yet no effect of frequency (β = 128.92 SE = 94.00, t = 1.372; p = .171) and no interaction of structure and frequency (β = 67.71, SE = 59.48, t = 1.139; p = .255). Post hoc pairwise comparisons by frequency show that there is only a marginally significant effect of structure for the high-frequency items (β = 69.30, SE = 41.33, t = 1.677; p = .094), but a highly significant effect for the low-frequency items (β = 130.89, SE = 41.74, t = 3.136; p = .002).
For the postcleft region, there is a significant effect of structure (β = 169.77, SE = 82.43, t = 2.060; p = .040), yet no effect of frequency (β = 88.53 SE = 82.40, t = 1.074; p = .283) nor an interaction of structure and frequency (β = 59.83, SE = 52.14, t = 1.148; p = .251). Paired tests indicate that high-frequency items elicit no effect of structure (β = 52.07, SE = 36.96, t = 1.409; p = .160), while low-frequency items yield a highly significant effects of structure (β = 112.73, SE = 36.33, t = 3.103; p = .002).
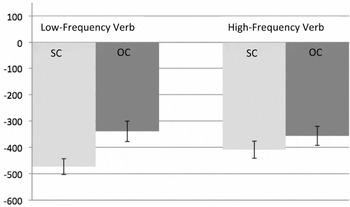
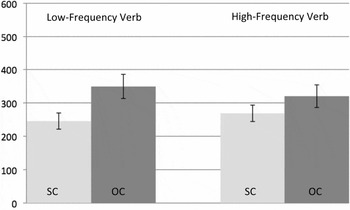
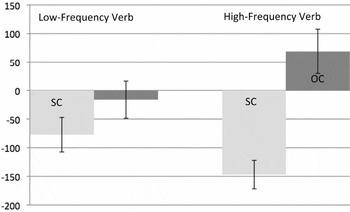
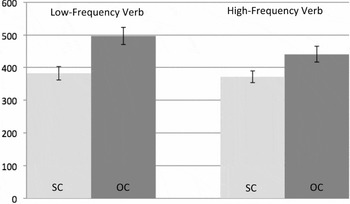
For the L2 group, Figure 3 charts the mean residual reading times of subject clefts and object clefts for the cleft region by frequency. Figure 4 shows the mean residual reading times for the postcleft region by Frequency. Descriptively, the graphs show that the difference in reading times between subject clefts and object clefts is more pronounced for high-frequency verbs in the cleft region, while it is magnified for low-frequency verbs in the postcleft region. This pattern differs from that of the native group.
Cleft region. Mean residual reading times (ms) for (light bars) subject clefts and (dark bars) object clefts by frequency group. All second language participants (n = 62). Error bars denote the standard error of the mean.

Postcleft region. Mean residual reading times (ms) for for (light bars) subject clefts and (dark bars) object clefts by frequency group. All second language participants (n = 62). Error bars denote the standard error of the mean.

For the L2 group, we computed a linear mixed-effects models that included subject and item intercepts as random effects and the factors structure (subject cleft or object cleft) and frequency (high vs. low) as fixed effects. In order to control for effects of proficiency and lexical knowledge, we added the cloze test scores and the LexTALE scores as fixed covariates, because a series of log-likelihood tests indicated that their inclusion led to a significantly improved fit of the model.
For the cleft region, the analysis of the reading times returned no effect of structure (β = 105.36, SE = 86.16, t = 1.223; p = .222), a significant effect of frequency (β = 227.34 SE = 86.17, t = 2.638; p = .008), and a significant interaction of structure and frequency (β = 155.37, SE = 54.50, t = 2.851; p = .004). Post hoc pairwise comparisons by frequency show that there is a significant effect of structure for the high-frequency items (β = 204.78, SE = 38.99, t = 5.251; p < .001), yet no significant effect for the low-frequency items (β = 50.74, SE = 36.32, t = 1.397; p = .163).
For the postcleft region, there is a significant effect of structure (β = 192.92, SE = 65.02, t = 2.967; p = .003), yet no effect of frequency (β = 69.02, SE = 65.03, t = 1.061; p = .289) and a marginally significant interaction of structure and frequency (β = 69.49, SE = 41.13, t = 1.690; p = .091). Paired tests indicate that high-frequency items only elicit a marginally significant effect of structure (β = 54.41, SE = 28.37, t = 1.918; p = .056), while low-frequency items yield a highly significant effects of structure (β = 124.42, SE = 29.63, t = 4.999; p < .001).
In the next step of the analysis, we used frequency as a continuous variable based on the log frequencies of SUBTLEX-US. Otherwise, the models were identical to the ones above.
For the L1 group, there were no main effects or interactions on the cleft region (all zs < 1). For the postcleft region, there was a marginal main effect of structure (β = 146.37, SE = 82.25, t = 1.779; p = .076), yet no interaction of structure and frequency (β = 27.98, SE = 32.78, t = 0.854; p = .394).
For the L2 group, the analysis of the reading times on the cleft region (verb and noun) returned no effect of structure (β = 48.85, SE = 86.82, t = 0.563; p = .574), a significant effect of frequency (β = 109.0, SE = 55.29, t = 1.971; p = .049) and a significant interaction of structure and frequency (β = 74.02, SE = 34.56, t = 2.142; p = .032).
For the postcleft region, there was a significant effect of structure (β = 164.32, SE = 65.21, t = 2.520; p = .012), yet no effect of frequency (β = 15.34, SE = 41.66, t = 0.368; p = .713) or an interaction of structure and frequency (β = 31.84, SE = 25.95, t = 1.227; p = .220).
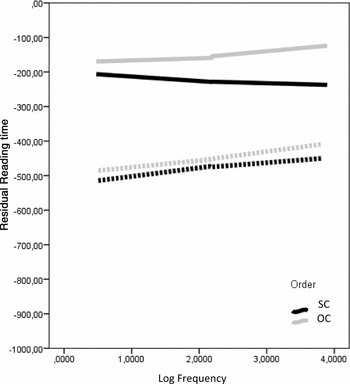
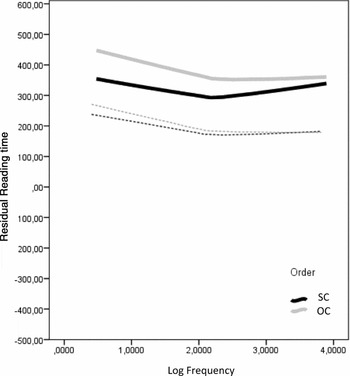
To illustrate the linear effects of frequency on reading times in the respective segments, we fitted a LOESS curve to the residual reading times in the respective segments for the L1 group (dotted lines) and the L2 group (solid lines) in Figures 5 and 6.
LOESS curve for residual reading times (ms) for (black lines) subject clefts and (gray lines) object clefts in the cleft region. (· · ·) First language group (n = 36) and (—) second language group (n = 62).

LOESS curve for residual reading times (ms) for (black lines) subject clefts and (gray lines) object clefts in the postcleft region. (· · ·) First language group (n = 36) and (—) second language group (n = 62).

Figure 5 displays the empirical trends in the reading times in the cleft region. For the L1 group, the differences in reading times between subject and object clefts are not affected by verb frequency. For the L2 group, it can be seen that reading time differences between subject clefts and object clefts increase as verb frequency rises. For low-frequency verbs, there are no differences in reading times between subject and object clefts.
Figure 6 plots the empirical data for the postcleft section. For the L2 group, reading time differences are most pronounced for low-frequency verbs, and the effects of order linearly decrease as verb frequency rises. For the native group, a similar pattern holds, yet the reading time differences are much lower between the two orders.
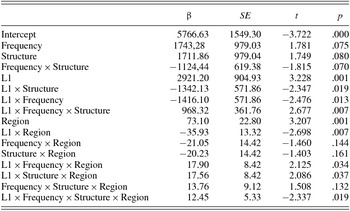
Finally, we probed whether the structural effect of object versus subject clefts is a continuous function of frequency as a reflection of lexical retrieval time across the two segments. We analyzed the data from the two regions in a single model, which included region as a main effect as well as an interaction with the other factors. A three-way interaction of structure, frequency, and region could then be interpreted as reflecting a difference in the location of the structural effect according to the frequency of the verb. The first model, which includes language as a between-group fixed factor, is given in Table 3.
Linear mixed model for reading times in the two critical regions, with region (cleft vs. postcleft) as fixed factor
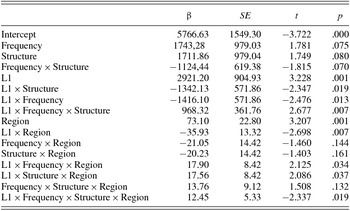
The analysis returns a significant four-way interaction among frequency, structure, region and language, which bears out that the two groups differ in the locus of structural effects relative to verb frequency. In subsequent analyses by group that include region, the L1 group did not show main effects or interactions (all ts < 1), except for a main effect of region (β = 37.17, SE = 9.54, t = 3.896; p < .001). There was no interaction of structure, frequency, and region (β = 1.31, SE = 3.82, t = 0.342; p = .732).
For the L2 group, the combined analysis yielded main effects of structure (β = 686.03, SE = 340.35, t = 2.016; p = .044), frequency (β = 540.41, SE = 214.14, t = 2.524; p = .012) as well as an interaction of structure and frequency (β = 386.87, SE = 135.19, t = 2.862; p = .004), and an interaction of region, structure, and frequency (β = 5.46, SE = 1.99, t = 2.742; p = .006). The latter three-way interaction statistically underpins the interpretation of the descriptive findings in Figures 5 and 6. It can be seen that there is a larger difference between the reading times for the subject and the object clefts for higher frequency verbs in the cleft region; conversely, reading time differences are higher for low frequency verbs in the postcleft region. In summary, then, the hierarchical linear regression model that includes region and frequency captures the reading times in the cleft and postcleft region as a function of structural order and verb frequency. As the LOESS curves and the combined model show, the effect of frequency is gradient in that decreasing verb frequency leads to a delay of the structural effect into the postcleft region.
In sum, the analyses bear out that lexical frequency linearly modulates the location of the structural effect indexing differences between subject and object clefts in the L2 group. In contrast, the native group did not show interactions of lexical frequency and the timing of structural effects in any analysis.
DISCUSSION
The aim of the present study was to investigate whether lexical processing affects the processing of syntactic structure in L2 sentence comprehension and whether higher demands in L2 lexical processing can lead to differences between native and nonnative syntactic processing.
The reading time data from L2 readers showed, first, effects of syntactic structure in that subject clefts are read faster than object clefts (Figures 3 and 4), and second, effects of verb frequency in that high-frequency verbs received shorter reading times than did low-frequency verbs in the L2 group (Figures 5 and 6). The first finding complements previous studies cataloging effects of syntactic complexity in the L2 processing of nonlocal dependencies (e.g., Dussias & Pinar, Reference Dussias and Pinar2010; Juffs, Reference Juffs2005), and the second result is in line with prior research on L2 word recognition (e.g., Diependaele et al., Reference Diependaele, Lemhöfer and Brysbaert2013; Lemhöfer et al. Reference Lemhöfer, Dijkstra, Schriefers, Baayen, Grainger and Zwisterlood2008).
The effects of syntactic complexity and lexical frequency were not additive or complementary, but they interacted in the L2 group: high-frequency verbs showed a difference in reading times between subject and object clefts in the verb region, whereas there was no difference for low-frequency verbs. In the postcleft region, low-frequency verbs evinced a highly significant difference in reading times between cleft types, whereas there was but a marginally significant difference for high-frequency verbs. When using verb frequency as a continuous predictor, we found a linear relation between frequency and the locus of reading time differences between subject and object clefts. As verb frequency gets lower, the processing difficulty associated with creating an object cleft structure gradually shifts from the cleft to the postcleft region in the L2 group.
These findings are compatible with models of sentence processing positing that lexical access of the verb precedes the structural process, which leads to slowdowns for object-extracted clefts (e.g., lexicalist constraint-based models; Trueswell et al., 1994). Lexical access is faster when the verb is more frequent so that the structural process of integrating nonlocal dependents, creating a more complex structure, or reanalyzing a subject to an object cleft structure can be executed during the verb region. When lexical access is more difficult with low-frequency verbs, L2 readers delay the structural process to the following region. Such a finding points toward a systematic functional staging of lexical and syntactic processing in L2 comprehension: structural processes are initiated only after lexical information has been retrieved from the verb to some extent.
However, it remains an open question whether the delay of the structural effects witnessed in the L2 group reflects shifts in the actual construction of a subject versus an object cleft dependency or whether it denotes a delay in the interpretation of these structures (see Tily et al., Reference Tily, Fedorenko and Gibson2010). It is, for instance, conceivable that readers initiate the creation of syntactic structure before or concurrently with lexical decoding and, in a later stage, interpret the structure, with effects of lexical frequency affecting solely this later stage of integration. According to this account, the verb frequency effects would not directly impinge on the timing of structure-building operations in L2 processing. To test between these options, it may be useful to investigate whether other information types known to affect late stages of interpretation (e.g., discourse context) engender similar incremental readings slowdowns as verb frequency. However, previous work that concurrently considers the relative impacts of lexical frequency and discourse constraints in monolingual processing demonstrates that lexical information immediately informs parsing, while discourse information is accessed later for disambiguation (e.g., Boland & Blodgett, Reference Boland and Blodgett2001). In this respect, using continuous reading measures, such as eye tracking, may further allow for dissecting early from late processes in comprehension (for discussion, see Clifton, Staub, & Rayner, Reference Clifton, Staub, Rayner, van Gompel, Fischer, Murray and Hill2007). Regardless of these issues, the present study finds that reading slowdowns that are commonly interpreted as reflecting differences in syntactic structure between subject and object clefts are systematically moderated by lexical processing in the L2 group.
At one level, these findings resonate with previous L2 work demonstrating that lexical information can guide L2 syntactic processing. For instance, L2 readers evince targetlike gap-filling effects following verbs, which demonstrate that lexical–thematic information informs L2 parsing (e.g., Williams, Möbius, & Kim, Reference Williams, Möbius and Kim2001). Moreover, L2 readers readily integrate subcategorization information in that they show reduced processing difficulty in sentences like “When the band played the song started” if the verb is intransitive (e.g., “arrived”) compared to optionally transitive verbs (e.g., Hopp, Reference Hopp2014; Jegerski, Reference Jegerski2012; Juffs, Reference Juffs2004). At a more fine-grained level of verb information, Dussias and Cramer-Scaltz (Reference Dussias and Cramer-Scaltz2008) find that Spanish–English readers are sensitive to verb bias in English, that is, whether verbs favored a direct object or a sentential complement.
At the same time, the present results extend previous studies in that we could show not only that lexical information guides L2 parsing but also that lexical processing constrains L2 syntactic processing in that some structure-building processes are restricted to occur after lexical retrieval of the items they incorporate. Even relatively minor variations in lexical frequency can lead to non-native-like L2 syntactic processing in that effects of syntactic structure, which occur in the target region with high-frequency verbs, are attenuated and delayed to a later segment with less frequent verbs.
Unlike the L2 speakers, the native speakers did not manifest analogous interactions of verb frequency and structure for the sentences in this study. Instead, the native group showed structural effects between subject and object clefts in the cleft region for low-frequency verbs, yet not for high-frequency verbs. It appears, then, that when the demands on lexical processing are low, the structural effect between subject and object clefts disappears when measured across the two segments comprising the cleft region in self-paced reading. For lower frequency verbs, however, the structural effect remained robust in the native group and spilled over into the postcleft region.
In these respects, the L2 performance on the high-frequency verbs resembled native reading of the sentences with low-frequency verbs. We take this correspondence to underline that objective (corpus) frequency does not have the same effect in native and nonnative processing; rather, differences in usage between the L1 and the L2 entail that a high-frequency item for a native speaker may be functionally equivalent to a low-frequency item for a nonnative speaker.
Additional evidence that is consistent with this interpretation is afforded by comparing the present data from the native speakers with the data in the precursor study by Tily et al. (Reference Tily, Fedorenko and Gibson2010). In the latter, the verbs were significantly less frequent in corpus frequency than the ones used in the present study adapted to L2 readers (see Appendix A and Note 2). With these less frequent verbs, the native readers of English in the Tily et al. (Reference Tily, Fedorenko and Gibson2010) study showed similar relations between verb frequency and the locus of structural effects as the L2 group in the present study; that is, the structural effects for the very low-frequency verbs are shifted to the postcleft region.
These correspondences suggest that the interactions between lexical and structural processing are fundamentally similar in native and nonnative comprehension, yet that they differ in degree: L2 readers demonstrate word frequency effects on structure building at higher frequency levels than do native speakers. Such an observation of gradual differences between natives and nonnatives according to frequency is compatible with models of bilingual word recognition such as the weaker links account (Gollan et al., Reference Gollan, Montoya, Cera and Sandoval2008, Reference Gollan, Slattery, Goldenberg, van Assche, Duyck and Rayner2011). According to the weaker links account, bilinguals demonstrate larger word frequency effects in comprehension and production than do monolinguals due to the lesser use of the L2 by bilinguals. In consequence, frequency effects are magnified in bilinguals because the subjective frequencies of the same lexical items are lower in bilinguals than in monolinguals. The present study highlights the implications of slower lexical retrieval and larger frequency effects in L2 readers (e.g., Diependaele et al., Reference Diependaele, Lemhöfer and Brysbaert2013) for sentence processing.
To our knowledge, this is the first study that demonstrates that structure-building operations in syntactic processing are linearly modulated by lexical frequency characteristics in L2 processing. The present study complements the growing body of research on individual differences in L2 processing showing that learner differences in working memory, in the automaticity in lexical decoding, or in reading speed affect the degree of similarity between native and nonnative sentence processing (e.g., Coughlin & Tremblay, Reference Coughlin and Tremblay2013; Dussias & Pinar, Reference Dussias and Pinar2010; Havik et al., Reference Havik, Roberts, van Hout, Schreuder and Haverkort2009; Hopp, Reference Hopp2014; Kaan et al., Reference Kaan, Ballantyne and Wijnen2014). The current findings furnish evidence that differences at the stimulus level can engender similar effects. Item properties of the sentence stimuli such as word frequency may determine whether a structural effect occurs in a nativelike way and time window in L2 processing, or whether it is delayed or potentially even absent.
These results have implications for theoretical approaches to L2 sentence processing. The specific relations between lexical frequency and structure building reported in this study are compatible with the lexical bottleneck hypothesis in L2 sentence processing (Hopp, Reference Hopp2014), which claims that difficulties in lexical processing that subserve parsing can lead to nonnative-like sentence processing. In broader terms, the finding in this study that syntactic effects are moderated by difficulties in lexical processing can be accommodated within capacity approaches to L2 processing, which argue that late L2 learners build the same syntactic structure as native speakers, yet may experience more difficulty in doing so due to limitations in resources (e.g., Dekydtspotter et al., Reference Dekydtspotter, Schwartz, Sprouse, O’Brien, Shea and Archibald2006; Hopp, Reference Hopp2010; MacDonald, Reference McDonald2006).
Other approaches hold that differences between nonnatives and natives do not merely reflect quantitative differences in resources or resource allocation; rather, L2 learners are argued to build less detailed syntactic representations than native speakers (e.g., Clahsen & Felser, Reference Clahsen and Felser2006; Ullman, Reference Ullman and Sanz2005). The data in the present study do not suggest that the ability to build syntactic structure in L2 online comprehension is compromised in principle; rather, it demonstrates that differences in syntactic processing between nonnatives and natives can be due to differences in lexical processing. However, the present experiments did not focus on a construction that involved complex nonlocal dependencies that would require readers to recruit abstract syntax in order to ensure comprehension. At the same time, there is little reason to believe that similar relations between lexical and structural effects of processing as shown for cleft sentences do not hold for sentences involving different types of nonlocal dependencies (Miller, Reference Miller2014). Future studies should gauge the degree to which the present interactions between lexical and structural processing generalize to different constructions and different L1–L2 combinations in L2 sentence comprehension.
Further, the present study has methodological implications. Studies that collect reading time measures during continuous sentence presentation, such as self-paced reading and eye tracking, can register delayed effects of structure building in L2 readers vis-à-vis native speakers. However, in paradigms that elicit responses at fixed time points (e.g., cross-modal priming) or that require singular reactions under time pressure (e.g., speeded or timed judgments), lexical bottlenecks may prevent effects of a syntactic analysis to surface in L2 learners because they cannot compute it in the same time as native speakers. Given that response registration is restricted to a particular point in time in these paradigms, they may not be ideally suited for definitively assessing the involvement of syntax in nonnative processing (see also Dekydtspotter & Miller, Reference Dekydtspotter and Miller2013).
In any case, the study underlines the importance of methodological choices in the stimulus materials in studies of L2 sentence processing. Future research should study how effects of verb frequency interact with participant characteristics, such as reading speed, working memory, and lexical decoding ability. Research focusing on how stimulus characteristics and participant characteristics interact in L2 sentence processing holds the promise of leading to a more comprehensive understanding of differences and similarities in L1 and L2 processing.
In sum, the present study shows that nonnative-like syntactic processing in L2 sentence comprehension can follow from gradual differences between L1 and L2 readers in the strength of lexical representations that govern lexical retrieval speed. Further investigating the interactions of lexical and syntactic processing will yield additional insights into the time course of L2 parsing and can accordingly inform future models of L2 sentence comprehension.
APPENDIX A
The following are the sentences used in the present study:
-
1.
-
a. It was Amanda who scared Sulena with a frightening look.
-
b. It was Amanda who Sulena scared with a frightening look.
-
c. It was Amanda who frightened Sulena with a frightening look.
-
d. It was Amanda who Sulena frightened with a frightening look.
-
-
2. It was Amber who admired/adored Mike since the beginning of spring.
-
3. It was Amy who threatened/intimidated Susan with a long knife.
-
4. It was Andrew who forced/compelled Piper to steal the camera.
-
5. It was Brandon who recognized/spotted Dustin when the ceremony ended.
-
6. It was Bryan who paid/refunded Jacob after a long argument.
-
7. It was Cedric who teased/ridiculed Julius because of the shoes.
-
8. It was Daniel who charmed/enchanted Kendra from the first date.
-
9. It was Hector who disliked/disdained Dillon since the first meeting.
-
10. It was Jared who impressed/astonished Elvin with a wonderful performance.
-
11. It was Jeremy who punished/penalized Shawna following a bad mistake.
-
12. It was Joshua who pleased/soothed Kathryn with a radiant gift.
-
13. It was Kate who allowed/permitted Franklin to use the bicycle.
-
14. It was Kelli who provided/supplied Tyler with the exercises for school.
-
15. It was Kenneth who surprised/amazed Meredith with a bouquet of flowers.
-
16. It was Lee who convinced/induced Emma to sell the car.
-
17. It was Lindsey who supported/aided Stuart to quit the job.
-
18. It was Marcela who advised/acquainted Garrett of the importance of exams.
-
19. It was Mollie who humiliated/disgraced Lauren in front of everyone.
-
20. It was Samantha who showed/beckoned Timothy the way to town.
-
21. It was Tara who offended/appalled Janet with a strong insult.
-
22. It was Taryn who prevented/deterred Roxanne from the terrible accident.
-
23. It was Zachary who bothered/disrupted Carlton in the reading room.
-
24. It was Zoe who refused/condemned Keira because of a dispute.
The following are the verb pairs used in the study by Tily et al. (Reference Tily, Fedorenko and Gibson2010):
-
1. congratulate/felicitate
-
2. criticize/belittle
-
3. impress/awe
-
4. insult/affront
-
5. bother/badger
-
6. praise/laud
-
7. calm/placate
-
8. aggravate/peeve
-
9. hate/disdain
-
10. humiliate/abase
-
11. mesmerize/allure
-
12. pay/remunerate
-
13. charm/beguile
-
14. discipline/chastise
-
15. please/assuage
-
16. punish/castigate
-
17. signal/beckon
-
18. murder/annihilate
-
19. strangle/asphyxiate
-
20. tease/pester
-
21. confuse/vex
-
22. lecture/chide
-
23. inform/apprise
-
24. reject/spurn
ACKNOWLEDGMENTS
I thank Friederike Ballaire for help with stimulus design and data collection. Thanks also to Carrie N. Jackson and Barbara Pietrucha for help with data collection. All remaining errors and shortcomings are my own.