Introduction
Alkali-based geopolymer is a kind of inorganic polymeric material comprising cross-linked tetrahedral [AlO4] and [SiO4] units, having a three-dimensional network structure, where hydrated alkali metal cations (e.g. Na+, K+, etc.) are distributed throughout the network to balance the negative charges of [AlO4]– (Amran et al., Reference Amran, Alyousef, Alabduljabbar and El-Zeadani2020; Najafi et al., Reference Najafi, Chenari and Arabani2020). As a new type of cementitious material, geopolymer has been regarded as a potential alternative to ordinary Portland cement (OPC) because it not only consumes less energy and emits less CO2 during manufacturing but also exhibits better properties, including greater mechanical strength, better fire resistance, and greater durability (Farhan et al., Reference Farhan, Sheikh and Hadi2019; Tognonvi et al., Reference Tognonvi, Petlitckaia, Gharzouni, Fricheteau, Texier-Mandoki, Bourbon and Rossignol2020; Chen et al., Reference Chen, Wu, Xia, Cai and Zhang2021). Normally, alkali-based geopolymer is synthesized by the dissolution of aluminosilicates into an alkaline activator, followed by a curing process (Zhang et al., Reference Zhang, Yuan, Guo, Deng, Li, Li, Wang and Liu2021). In general, raw materials, such as clays (Liew et al., Reference Liew, Heah, Al Bakri and Hussin2016; Werling et al., Reference Werling, Kaltenbach, Weidler, Schuhmann, Dehn and Emmerich2022), industrial waste (Shekhovtsova et al., Reference Shekhovtsova, Zhernovsky, Kovtun, Kozhukhova, Zhernovskaya and Kearsley2018; Zhang et al., Reference Zhang, Yu, Deng, Li, Guo, Zhou, Li and Yuan2022), and other aluminosilicate-rich material with sufficient reactive alumina and silica (Nana et al., Reference Nana, Ngouné, Kaze, Boubakar, Tchounang, Tchakouté, Kamseu and Leonelli2019; Wang et al., Reference Wang, Guo, Yu, Yuan, Deng and Zhang2022), can be used for geopolymer preparation.
Clay minerals are naturally occurring minerals found around the world which are important raw materials in various domains (Mbey et al., Reference Mbey, Thomas, Razafitianamaharavo, Caillet and Villiéras2019). Kaolinite (Al2(OH)4Si2O5, Kln) is a typical 1:1 dioctahedral clay mineral, which usually has a hexagonal flake or plate-like shape. Each layer of Kln contains a silica tetrahedral sheet and an alumina octahedral sheet and these sheets are bound by sharing oxygen atoms, while adjacent sheets are bound by hydrogen bonds (Deng et al., Reference Deng, Yuan, Liu, Annabi-Bergaya, Zhou, Chen and Liu2017; Li et al., Reference Li, Chen, Song, Yuan, Liu, Zhang and Bu2020). Kln has been applied in the stabilization of contaminated soil (Liu et al., Reference Liu, Zha, Xu, Kang, Yang, Zhang, Zhang and Liu2020), supplementary cementitious materials (Haw et al., Reference Haw, Hart, Rashidi and Pasbakhsh2020), and ceramic preparations (Prasad et al., Reference Prasad, Reid and Murray1991). Kln is also widely used for geopolymer preparation and geopolymerization mechanism analysis due to its high pozzolanic activity and simple chemical composition (Lolli et al., Reference Lolli, Manzano, Provis, Bignozzi and Masoero2018; Wang et al., Reference Wang, Wang, Dong and Ouyang2020). Compared to other precursors, such as red mud (He et al., Reference He, Zhang, Yu and Zhang2012), fly ash (Cai et al., Reference Cai, Tan and Li2020), or illite (Hu et al., Reference Hu, Bernsmeier, Grathof and Warr2016), geopolymer derived from alkali activation of Kln shows greater compressive strength, shorter setting time, and better thermoelectrical properties. Many factors (e.g. SiO2/Al2O3 molar ratio, liquid/solid ratio, and curing conditions etc.) have been reported previously to impact on the microstructure and mechanical properties of Kln-based geopolymers (Duxson et al., Reference Duxson, Mallicoat, Lukey, Kriven and Deventer2007; Heah et al., Reference Heah, Kamarudin, Al Bakri, Bnhussain, Luqman, Nizar, Ruzaidi and Liew2012; Qian et al., Reference Qian, Feng, Song, García, Estrella, Patiño and Zhang2017; Yuan et al., Reference Yuan, He, Jia, Yang, Zhang, Yan, Yang, Duan, Wang and Zhou2016). Among these, the SiO2/Al2O3 molar ratio is one of the most important factors in geopolymer preparation, which controls the microstructure, chemical composition, and properties of as-obtained products (Liew et al., Reference Liew, Heah, Al Bakri and Hussin2016; Tian et al., Reference Tian, Chen, Wang, Guo, Zhang and Sasaki2021; Liu et al., Reference Liu, Doh, Dinh, Ong, Zi and You2022). Qian et al. (Reference Qian, Feng, Song, García, Estrella, Patiño and Zhang2017) found that the compressive strength of calcined Kln-based geopolymer increased from 2.1 to 31.2 MPa when the Si/Al ratio increased from 1.0 to 2.0, while it decreased to 5.5 MPa when the Si/Al ratio increased to 5.0. Khalifa et al. (Reference Khalifa, Cizer, Pontikes, Heath, Patureau, Bernal and Marsh2020) also concluded that during alkali-activation, geopolymer was formed when Si/Al > 1.5, and zeolite was formed when Si/Al < 1.5.
Halloysite (Al2(OH)4Si2O5·2H2O, Hly) is also a 1:1 dioctahedral clay mineral, showing some similarities in chemical composition to Kln. However, due to an additional monolayer of water molecules between the unit layers of Hly, the mismatch between the tetrahedral SiO4 and octahedral AlO6 sheets of adjacent layers causes the wrapping of the 1:1 aluminosilicate layers, thus forming a nanosized tubular structure (Singh, Reference Singh1996; Yuan et al., Reference Yuan, Southon, Liu, Green, Hook, Antill and Kepert2008; Yuan, Reference Yuan, Yuan, Thill and Bergaya2016). Owing to its nanotubular structure, Hly normally possesses a larger specific surface area, less chemical stability, and lower ordering degree than Kln (White et al., Reference White, Bavykin and Walsh2012; Yuan et al., Reference Yuan, Tan and Annabi-Bergaya2015). These different features between Hly and Kln might lead to a different geopolymerization process.
In fact, many previous studies have proposed that the geopolymerization behavior is also affected significantly by the morphologies and structure of Kln. For example, through different calcination technologies, Medri et al. (Reference Medri, Fabbri, Dedecek, Sobalik, Tvaruzkova and Vaccari2010) and Nicolas et al. (Reference Nicolas, Cyr and Escadeillas2013) prepared various morphologies of metakaolinite. They found that metakaolinite powder with rounded agglomerates was more sensitive to the geopolymerization condition and required less water during geopolymerization than lamellar ones. Hollanders et al. (Reference Hollanders, Adriaens, Skibsted, Cizer and Elsen2016) compared the pozzolanic activity of Klns from different regions. They found that the raw Kln with a lower degree of ordering required a lower activation temperature, which had greater pozzolanic activity and a faster pozzolanic reaction rate. Zhang et al. (Reference Zhang, Zhu, Zhou and Wang2016) noted different reactivity and geopolymerization behavior between Kln and Hly. They reported that the leaching rate of Si and Al from uncalcined Longyan kaolin (containing 31 wt.% Hly and 52 wt.% Kln) in strong alkaline solution was very close to that of the Suzhou kaolin (containing 91 wt.% Kln) calcined at 700°C for 1 h. Moreover, they also found that geopolymer prepared from Longyan kaolin exhibited greater geopolymerization reactivity (e.g. faster setting, faster development of compressive strength) than that from Suzhou kaolin (Zhang et al., Reference Zhang, Wang, Yao and Zhu2012a).
Therefore, the use of Hly as a geopolymer precursor has attracted increasing attention. Kaze et al. (Reference Kaze, Tchakoute, Mbakop, Mache, Kamseu, Melo, Leonelli and Rahier2018) used Cameroon-metahalloysite for geopolymer preparation and received products with a maximum compressive strength of ~27.5 MPa. They also found that by increasing the calcination temperature from 600 to 750℃, the reactive phase content of Hly increased, which shortened the setting time and improved the rheological behavior of geopolymer pastes (Kaze et al., Reference Kaze, Alomayri, Hasan, Tome, Lecomte-Nana, Nemaleu, Tchakoute, Kamseu, Melo and Rahier2020a). Zhang et al (Reference Zhang, Guo, Yuan, Li, Wang, Deng and Liu2020b) studied the effects of calcination temperatures on the microstructure and compressive strength of Hly-based geopolymer and found that when calcination temperature reached 750℃, the Hly-based geopolymer exhibited a compact microstructure and the greatest compressive strength. All these results indicated that Hly is a promising precursor for geopolymer preparation.
The results above also demonstrated that the geopolymerization process of Hly differs from that of Kln (Izadifar et al., Reference Izadifar, Thissen, Steudel, Kleeberg, Kaufhold, Kaltenbach, Schuhmann, Dehn and Emmerich2020; Zhang et al., Reference Zhang, Guo, Yuan, Deng and Liu2020c). Although a recent study from Tchakouté et al. (Reference Tchakouté, Melele, Djamen, Kaze, Kamseu, Nanseu, Leonelli and Rüscher2020) compared the microstructural and mechanical properties of Kln-based geopolymers with Hly-based ones, the Hly used in that study was spherical, while the dominant morphology of naturally occurring Hly is tubular (Yuan et al., Reference Yuan, Tan and Annabi-Bergaya2015). In addition, both Kln and Hly samples contain many impurities. This may limit the widespread applicability of conclusions from any specific study. Moreover, the studies of Hly-based geopolymer are far less reported than those for other precursors (e.g. Kln, illite, and fly ash, etc.). The effects of the SiO2/Al2O3 ratio on the microstructure and mechanical properties of Hly-based geopolymer remain unknown even though it can control the phase formation.
The objective of the current study was to compare the effect of the SiO2/Al2O3 ratio on the microstructure and mechanical properties of platy Kln-based and nanotubular Hly-based geopolymers to enable a further understanding of the effect of morphology of 1:1 dioctahedral clay minerals on their geopolymerization process and on the geopolymers obtained. This work will provide a better insight into the various geopolymerization behaviors between Kln and Hly as well as the properties of as-obtained geopolymers.
Experimental
Materials
Two kinds of precursors, i.e. platy kaolinite (Kln) and nanotubular halloysite (Hly), were used for the preparation of geopolymers by alkali activation. Kln was collected from Maoming, Guangdong, and Hly was provided by I-Minerals, Inc., Vancouver, Canada. The chemical compositions of Kln and Hly measured by X-ray fluorescence (XRF) are presented in Table 1. The Kln and Hly powders were calcined in a muffle furnace at 750°C in air for 2 h (heating/cooling rate of 5°C/min) and were denoted as Kln750℃ and Hly750℃, respectively.
Chemical composition of Kln and Hly (wt.%)

L.O.I.: loss on ignition
The alkaline activator was prepared by mixing analytical-grade NaOH pellets (purity ≥ 96%) with commercial sodium silicate (original SiO2 26.5 wt.%, Na2O 8.5 wt.%, and water 65.0 wt.%) and Milli-Q water. The solution used in leaching was 10 mol/L NaOH solution. Solutions were stored for 24 h prior to use.
Preparation of Clay-based Geopolymers
Kln750℃ or Hly750℃ powders were mixed with the alkaline activator to prepare the geopolymers. The molar ratio of SiO2/Al2O3 was set as 2.5, 3.0, or 3.5 while the molar ratio of Na2O/Al2O3 was set to 1.0. However, due to the various minimum water requirements for workability of Kln750℃ and Hly750℃, the molar ratio of H2O/Na2O was set to 10.0 and 11.5 for Kln750℃ and Hly750℃, respectively. The resulting geopolymeric paste was poured into 20 mm × 20 mm × 12 mm plastic molds and covered with a thin film of polyethylene. The molded specimens were cured at 50℃ for 48 h and then were further cured at 80℃ for another 48 h. The hardened samples were demolded and sealed in plastic bags at ambient temperature. The products obtained were labeled Kln750℃-X or Hly750℃-X, where X represents the molar ratio of SiO2/Al2O3 of the raw materials. For example, Kln750℃-2.5 is the alkali-activation product with a SiO2/Al2O3 molar ratio of 2.5.
Characterization of Clay-based Geopolymers
1 g of Kln750℃ or Hly750℃ was mixed with 30 g of 10 mol/L NaOH solutions at 25 ± 2°C in a shaker for various times. Then, after centrifugation and filtration, the leachate was separated. The concentrations of Si and Al dissolved from raw materials were determined by an iCAP 7000 Series inductively coupled plasma optical emission spectrometry instrument (Thermo Fisher Scientific Inc., Waltham, Massachusetts, USA).
The setting times of pastes prepared by mixing the Kln750℃ or Hly750℃ with alkaline activator were tested by a Vicat apparatus. 7- and 28-day compressive strengths of geopolymers were performed on a YAW-300D Compression Resistance Tester (Schlikör, LiXian, Zhejiang, China) with a loading rate of 500 N/s.
Thermogravimetric (TG) analyses were performed on a Netzsch STA 409PC instrument (Selb, Bayern, Germany) for Kln and Hly. Powdered samples (~ 10 mg) were analyzed by heating in a corundum crucible from 30 to 1000°C at a rate of 10°C/min.
The XRD patterns of clays, calcined clays, and 28-day geopolymers were collected on a Bruker D8 Advance diffractometer (Mannheim, Karlsruhe, Germany), operating at 40 kV and 40 mA using CuKα radiation. The specimens were powdered finely to investigate their diffraction from 3 to 70°2θ with a scanning speed of 3°2θ/min.
The FTIR spectra of clays, calcined clays, and 28-day geopolymers were recorded on a Bruker Vertex 70 spectrometer (Mannheim, Karlsruhe, Germany). The products were mixed with 0.9 mg of sample and 90 mg of KBr and powdered finely before the mixture was pressed into a disk for analysis. FTIR spectra of the disks were collected at 4000 to 400 cm–1 with 64 scans, at a resolution of 4 cm–1.
The SEM micrographs and energy-dispersive X-ray (EDX) spectroscopy results of clays, calcined clays, and 28-day geopolymers were obtained using an SU8010 field-emission scanning electron microscope (Hitachi, Tokyo, Japan) at an accelerating voltage of 15 kV. Specimens were prepared for analysis by being anchored tightly on the surface of conducting tape, coated with a layer of platinum, and then transferred to the microscope.
Measurements of pore-size distribution and the total pore volume of 28-day geopolymers’ powder were carried out by N2 physisorption analysis in a Micromeritics ASAP 2020 instrument (Micromeritics Co., Norcross, Georgia, USA) at liquid-nitrogen temperature (–196°C). Before measurements, the products were outgassed at defined temperatures for 24 h at 393 K at the degassing port. The total pore volume was obtained from N2 uptake at a relative pressure of 0.97.
Solid-state 29Si cross-polarization magic-angle-spinning (CP/MAS) NMR spectra and 27Al MAS NMR spectra of 28-day geopolymers’ powder were recorded on a Bruker Avance III600 spectrometer (Mannheim, Germany). For 29Si CP/MAS NMR spectra, the magnetic field strength was 14.1 T with a resonance frequency of 119.2 MHz and was recorded using a contact time of 6 ms, a π/2 pulse length of 2.3 μs, a recycle delay of 2 s and a spinning rate of 10 kHz. For 27Al MAS NMR spectra, the magnetic field strength was 14.1 T with a resonance frequency of 156.4 MHz and was recorded using a small-flip angle technique with a pulse length of 0.5 μs (< π/12), a recycle delay of 1 s and a spinning rate of 14 kHz. The chemical shifts of 27Al and 29Si were given in ppm referenced to 1 mol/L Al(NO3)3 and tetramethylsilane (TMS), respectively.
Results and Discussion
Characterization of Kln, Hly, and their Heating Products
TG-DSC curve
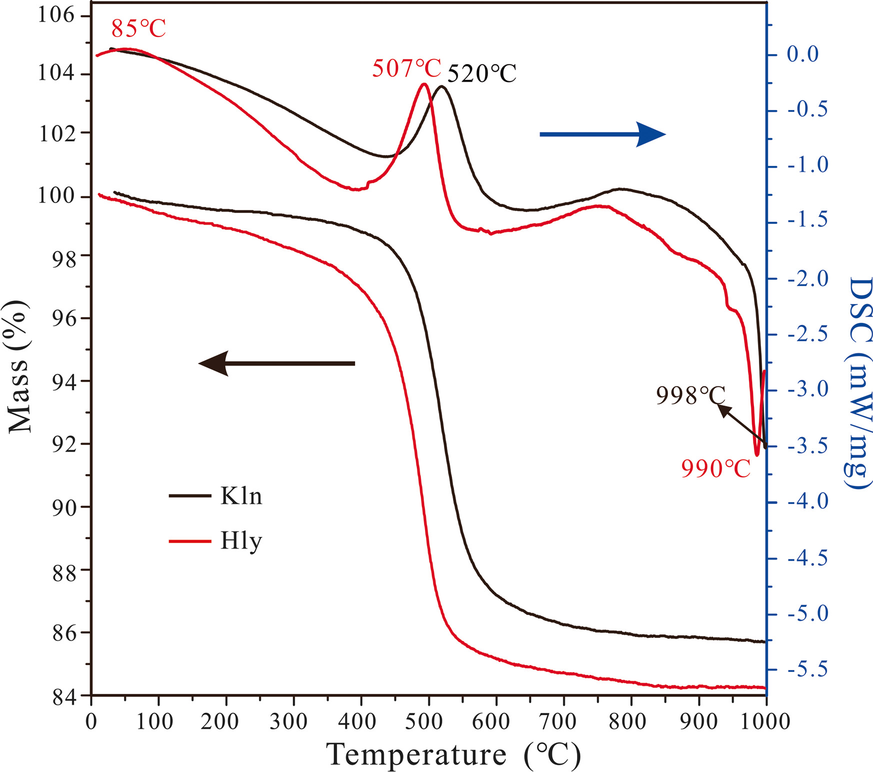
TG curves (Fig. 1) showed mass losses of 1.42% for Kln and 2.78% for Hly below 450℃, which were ascribed to the dehydration of Kln and Hly (loss of physical adsorbed water and/or interlayer water). Another major mass loss occurred in the temperature range from 450 to 650℃ and was associated with the dehydroxylation of Kln and Hly. Above 650℃, the mass loss continued but to a small extent up to 1000°C. The total mass losses for Kln and Hly were ~14.21% and 15.38%, respectively.
TG-DSC curves of Kln and Hly

In the DSC curve, broad endothermic peaks at ~520 and 507℃ for Kln and Hly, respectively, corresponded to dehydroxylation of Al–OH and Si–OH. This result indicated that, compared to Kln, the dehydroxylation of Hly starts at a lower temperature. In addition, a narrow exotherm appeared at 998°C for Kln, which should be due to the formation of spinel-like γ-Al2O3 or an alumina-rich mullite (Okada et al., Reference Okada, Ōtsuka and Ossaka1986; Sonuparlak et al., Reference Sonuparlak, Sarikaya and Aksay2005). However, this exothermic event (990°C) of Hly during the calcination should be attributed to the formation of nanosized γ-Al2O3 based on the 29Si and 27Al MAS NMR results (Smith et al., Reference Smith, Neal, Trigg and Drennan1993). By using high-resolution TEM, Yuan (Reference Yuan, Yuan, Thill and Bergaya2016) also identified the formation of nanosized γ-Al2O3 when Hly was calcined at 1000°C.
XRD results
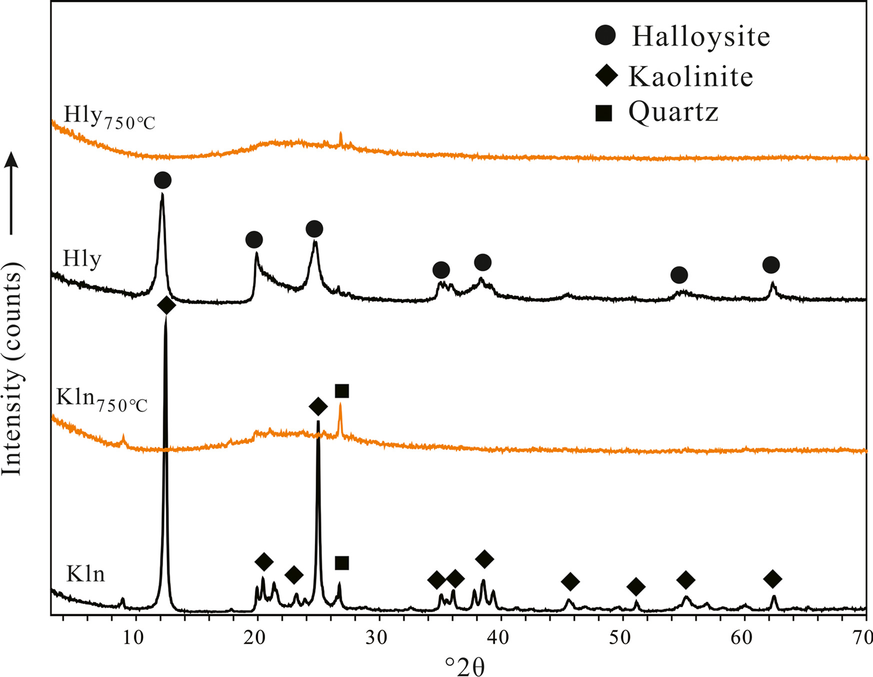
For Kln, most of the XRD reflections (Fig. 2) belonged to kaolinite with the strongest reflection at 12.2°2θ (with a d 001 of 7.25 Å). A small peak at 26.7°2θ indicated the presence of a small amount of quartz. When calcined at 750℃, a new broad reflection emerged at ~21.1°2θ due to the dehydroxylation of Kln. This result indicated that the crystal structure of Kln had been destroyed and the Kln transformed into metakaolinite after heat treatment at 750℃.
XRD patterns of Kln, Hly, and their calcination products

The interlayer distance, d 001, of Hly (Fig. 2) was similar to that of Kln. This also demonstrated that the Hly used in this study is 7 Å-halloysite, from which the water monolayer was lost. The reflections belonging to halloysite disappeared and the existence of a broad reflection emerged at ~21.1°2θ when Hly was calcined at 750℃. This also indicated that the structure of Hly was destroyed and an amorphous phase formed.
SEM images
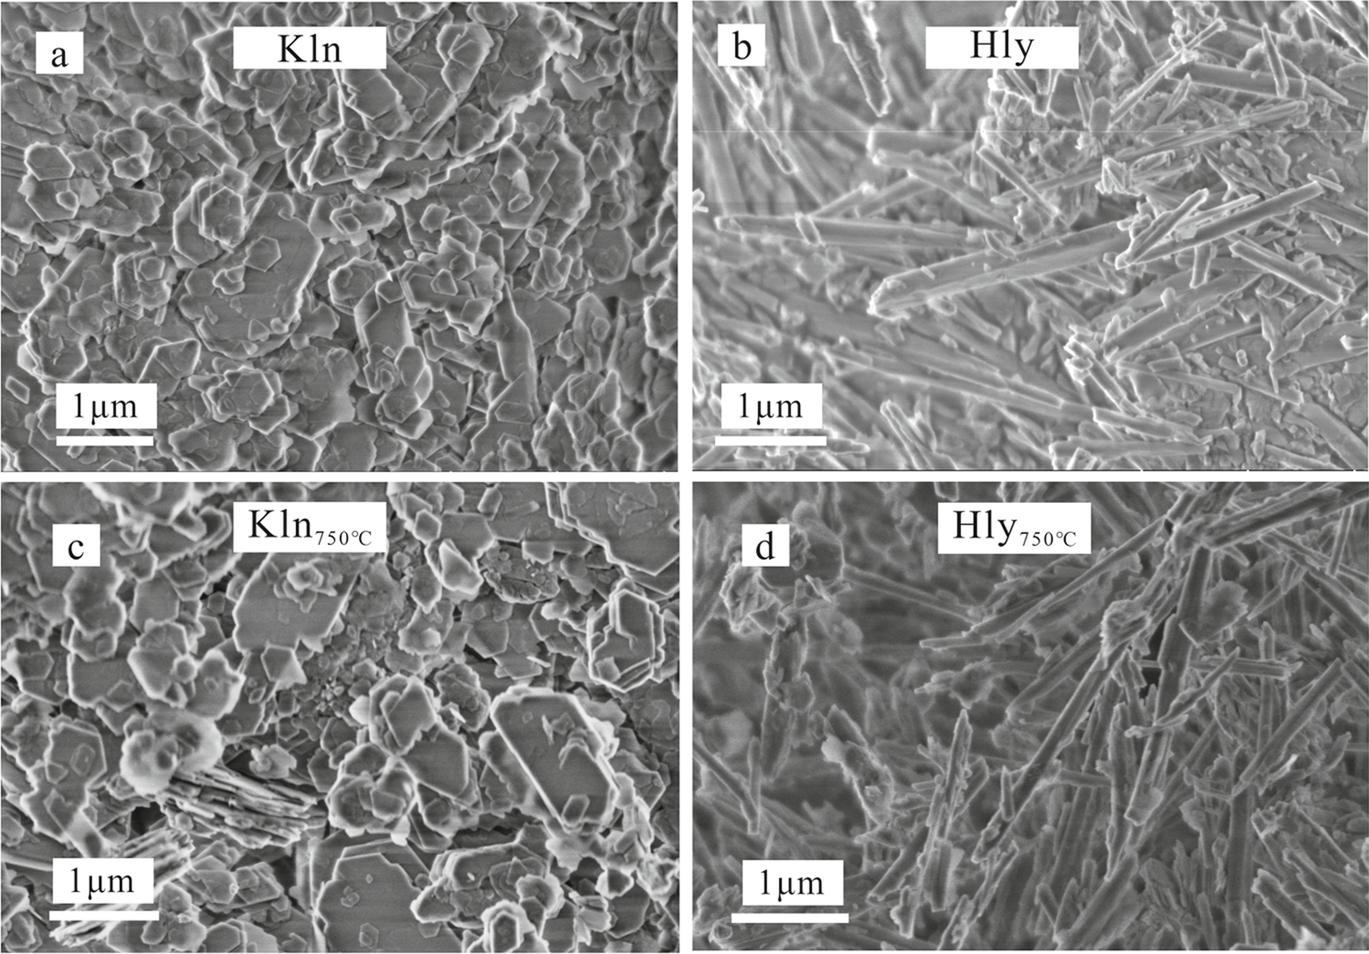
The SEM images (Fig. 3a,b) showed significantly different morphologies between Kln and Hly. The morphology of Kln was lamellar while that of Hly was nanotubular. When calcined at 750℃, they kept their original shapes. This result demonstrated that heating at 750℃ did not change the morphology of Kln and Hly. Accordingly, their specific surface areas did not change significantly either. Determined by BET, the specific surface areas of the Kln and Kln750℃ were 14.73 and 15.53 m2/g, respectively, while Hly and Hly750℃ were 28.29 and 27.62 m2/g, respectively. Specifically, the specific surface area of Hly was nearly twice as large as that of Kln.
SEM images of a Kln, b Hly, c Kln750℃, and d Hly750℃

FTIR results
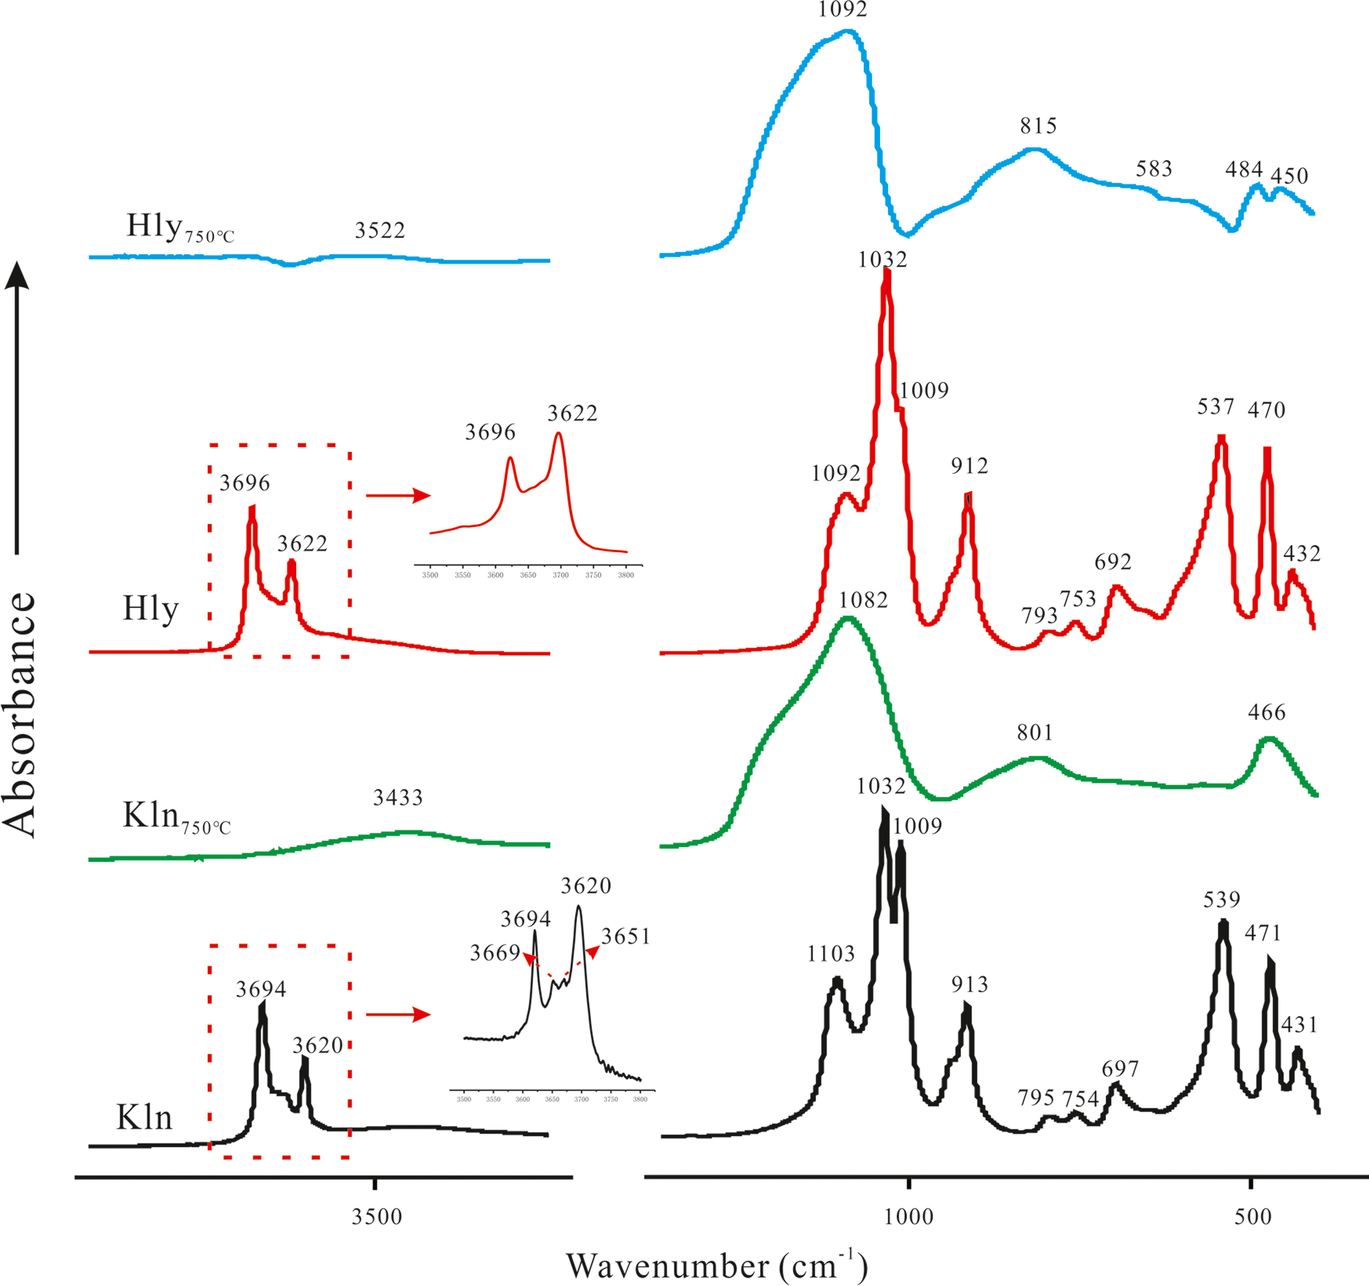
The spectrum of Kln (Fig. 4) exhibited four absorption bands ranging from 3700 to 3600 cm–1, where the peaks at 3694, 3669, and 3651 cm–1 were attributed to the O–H stretching of inner-surface hydroxyl groups and 3620 cm–1 was attributed to O–H stretching of inner hydroxyl groups (Madejová & Komadel, Reference Madejová and Komadel2001). In addition, the absorption at 913 cm–1 was also attributed to O–H vibration of inner hydroxyl groups. However, the absorption bands at 3669 and 3651 cm–1 did not appear in the FTIR spectrum of Hly, demonstrating the lower ordered structure of Hly compared to Kln (Parker, Reference Parker1969). The peak at 1103 cm–1 was assigned to perpendicular Si–O stretching while bands at 1032 and 1009 cm–1 were related to the in-plane Si–O stretching vibration. Moreover, the absorptions of 795, 754, 697, and 432 cm–1 were all attributed to Si–O vibrations. The band at 539 cm–1 was assigned to Al–O–Si deformation and 471 cm–1 was attributed to Si–O–Si deformation (Madejová & Komadel, Reference Madejová and Komadel2001). The peaks ranging from 1110 to 430 cm–1 in the spectrum of Kln were similar to those of Hly, indicating the similar structures of Kln and Hly at the molecular scale.
FTIR spectra of Kln, Hly, and their calcination products

After calcination at 750℃, the vibration corresponding to the hydroxyl group of Kln disappeared, along with the broad band at 3433 cm–1 which was attributed to the O–H of adsorbed water. A broad and asymmetric band centered at 1082 cm–1 was assigned to the symmetrical stretching vibration of Si–O–Si and Si–O–Al bonds. In addition, the broad bands at 800 and 466 cm–1 were both ascribed to the Si–O–Si stretching vibration from the amorphous silica. These results demonstrated that the structure of Kln was destroyed and amorphous SiO2 was formed (Yuan et al., Reference Yuan, Tan, Aannabi-Bergaya, Yan, Fan, Liu and He2012). Similar results can also be found in the FTIR spectrum of Hly750℃.
Dissolution behavior of Kln750℃ and Hly750℃
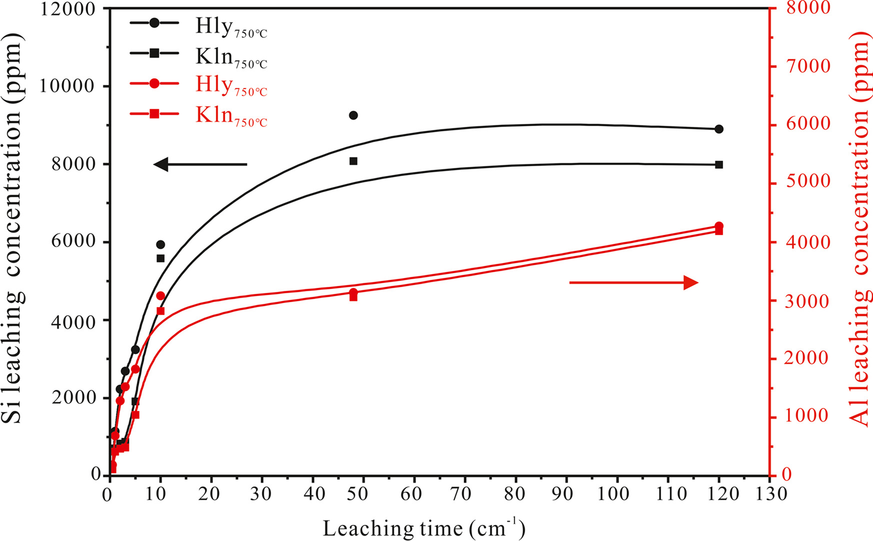
The concentrations of Si and Al leached from the clays in NaOH solutions increased with leaching time up to 48 h and then remained nearly unchanged as leaching time increased (Table 2 and Fig. 5). The concentration of Si and Al leached from Kln750℃ increased from 205.2 to 8080.5 ppm and 114.7 to 4188.7 ppm, respectively. The concentration of Si and Al leached from Hly750℃ increased from 281.4 to 9253.3 ppm and 189.9 to 4274.0 ppm, respectively.
Concentration of Al and Si leached from Kln750℃ and Hly750℃ in NaOH solutions

Concentrations of Si and Al dissolved from clays in NaOH solution

The concentrations of Si and Al leached from Hly750℃ were greater than those from Kln750℃ under the same leaching conditions; the leaching times from Hly750℃ were shorter than from Kln750℃. This result confirmed that the pozzolanic activity of Hly is greater than that of Kln, which may favor geopolymerization. The dissolution of the aluminosilicate precursor is the first step of geopolymerization, which occurs mainly in the early stages, followed by polycondensation of oligomers. This was also evidenced by isothermal calorimetry measurement in previous studies (Sun & Vollpracht, Reference Sun and Vollpracht2017; Zhang et al., Reference Zhang, Wang, Provis, Bullen, Reid and Zhu2012b, Reference Zhang, Provis, Wang, Bullen and Reid2013), which found two obvious exothermic peaks 5 h after geopolymerization. Therefore, the early stage of dissolution plays an important role in the formation of geopolymeric gels. In the first 3 h, the Si and Al concentrations leached from Hly750℃ were 2690.5 and 1526.7 ppm (Table 2), which was nearly three times greater than those from Kln750℃. This may lead to the improvement in the degree of geopolymerization.
Properties of Clay-based Geopolymers
Setting Time
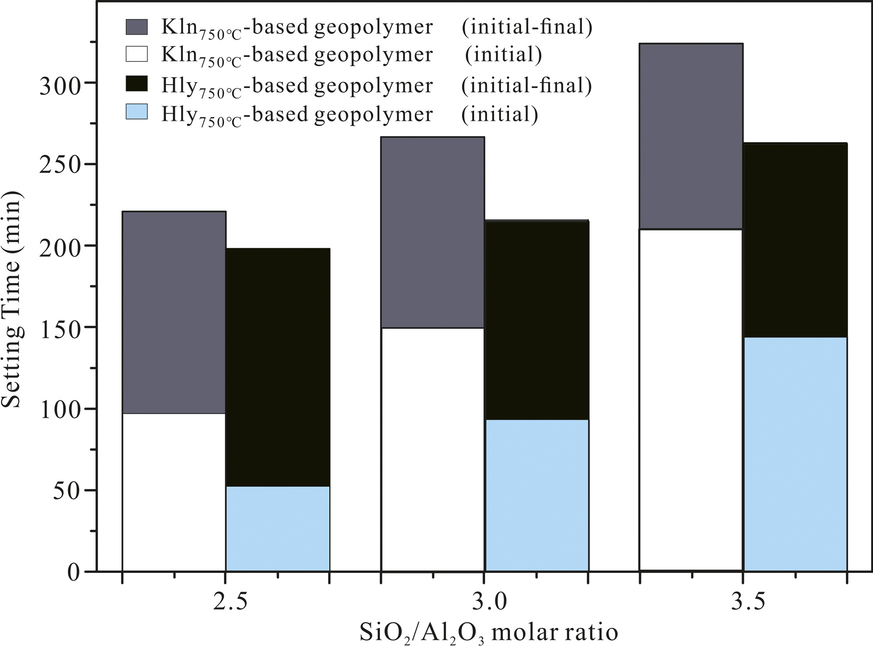
The setting times shown in Fig. 6 illustrated that as the SiO2/Al2O3 ratio increased, the initial setting time increased from 93 to 212 min and final setting time was increased from 221 to 324 min for Kln750℃-based geopolymeric pastes; and the initial setting time was increased from 52 to 146 min and final setting time was increased from 198 to 263 min for Hly50℃-based geopolymers. The alkalinity of the solution decreased gradually with the increase in the SiO2/Al2O3 ratio, which reduced the dissolution degree of Si and Al from precursors and thus prolonged the setting time. This was also evidenced by Zhang et al. (Reference Zhang, Provis, Wang, Bullen and Reid2013), who reported that the greater the alkali concentration, the more rapid the geopolymerization.
Initial and final setting time of clay-based geopolymeric pastes

As was observed, the initial and final setting times were longer for Kln-based geopolymer than Hly-based geopolymer at a given SiO2/Al2O3 ratio. This may be due to the fact that the greater and faster dissolution of Si and Al from Hly750℃ than from Kln750℃ resulted in the faster polycondensation of oligomers when mixing the clay and activator. Thus, the geopolymeric paste was hardened more quickly for alkali-activated Hly750℃ than Kln750℃ (Zhang et al., Reference Zhang, Wang, Yao and Zhu2012a).
Compressive Strength of Clay-based Geopolymers
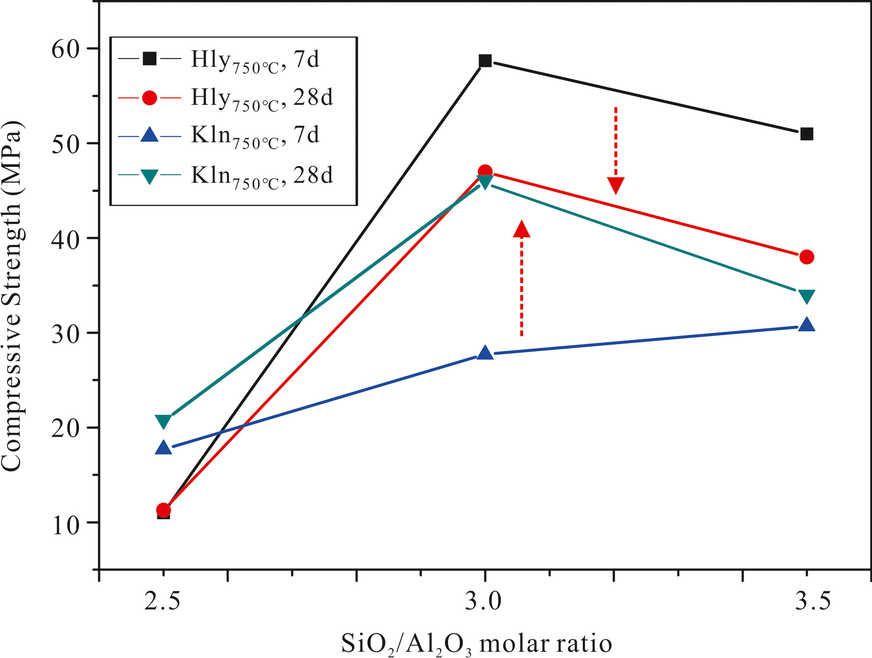
Clay-based geopolymers with a SiO2/Al2O3 molar ratio of 2.5 showed rather low 7- and 28-day compressive strengths (Fig. 7). When the molar ratio of SiO2/Al2O3 increased to 3.0, the compressive strengths were improved significantly. The 7-day compressive strength increased to 27.7 MPa for Kln750℃-based geopolymers, and increased to 58.7 MPa for Hly750℃-based geopolymers. This result demonstrated that increasing the SiO2/Al2O3 ratio could improve significantly the mechanical properties of geopolymers. When the SiO2/Al2O3 ratio increased to 3.5, the compressive strength of Kln750℃-based geopolymers increased slightly, whereas that of Hly750℃-based geopolymers decreased to 51.0 MPa, which may be attributed to the decreased alkalinity of the activator. Hly750℃-based geopolymers showed greater compressive strength than Kln750℃-based geopolymers, resulting from the greater geopolymerization reactivity for Hly than Kln.
Compressive strength of Kln- and Hly-based geopolymers

Note that, after 28 days of ageing, the compressive strength of Kln750℃-based geopolymer increased slightly; however, the compressive strength of Hly750℃-based geopolymers decreased, possibly because of the curing conditions. When cured at high temperature (80℃), Hly750℃-based geopolymeric paste hardened too fast to dissolve sufficiently, accompanied with fast evaporation of water, leading to the destruction of the geopolymer matrix. This process, therefore, may play a detrimental role in the development of compressive strength (Zhang et al., Reference Zhang, Xiao, Huajun and Yue2009, Reference Zhang, Yuan, Guo, Deng, Li, Li, Wang and Liu2021). In comparison, Kln750℃-based geopolymers reacted continuously in the later stage of geopolymerization with improvement of compressive strength.
Structure of Clay-based Geopolymers
XRD Results
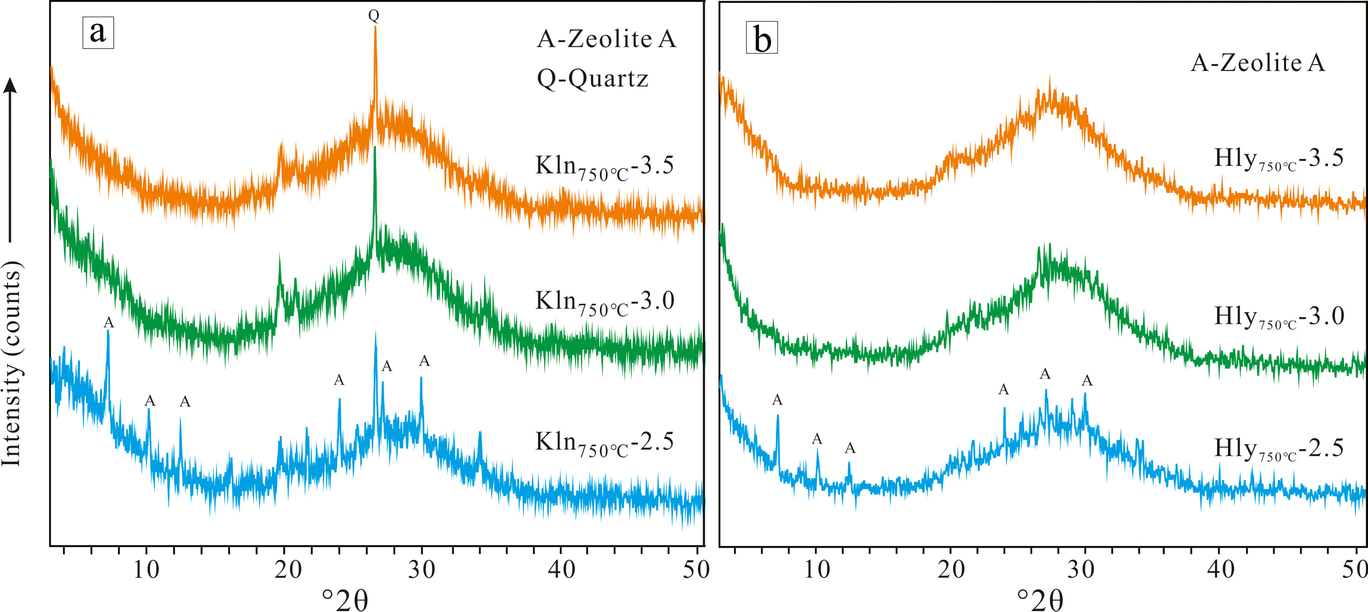
The XRD patterns of Kln750℃-2.5 and Hly750℃-2.5 showed some reflections indexed to zeolite A with a d 001 of 12.3 Å, which indicated that zeolite was formed (Fig. 8). In fact, previous reports found that geopolymers contained nanocrystalline zeolites, which can be crystallized under certain conditions, including high curing temperature, high humidity, etc. (Provis et al., Reference Provis, Lukey and Deventer2005; Wang et al., Reference Wang, Chen, Wu and Lei2017). Alkali-activation of Kln with a small Si/Al ratio induced the formation of zeolite easily. Qian et al. (Reference Qian, Feng, Song, García, Estrella, Patiño and Zhang2017) also found that zeolite A was formed after alkali-activation of metakaolinite at a Si/Al ratio of 1.0. Hounsi and Lecomte (Reference Hounsi and Lecomte2013) studied alkali-activated Kln using 8 M NaOH solution and found that reyerite was formed. Similarly, Hly750℃-2.5 also contained zeolite A, but a smaller amount, according to the lower intensity of corresponding characteristic peaks (Fig. 8b). In addition, a broad reflection centered at 27.7°2θ was observed in the XRD patterns of Kln750℃-2.5 and Hly750℃-2.5. Compared to XRD patterns of Kln750℃ and Hly750℃ (Fig. 2), the center of the broad reflection shifted to higher regions after alkali-activation, which indicated that the network was reorganized and geopolymer had formed (Kaze et al., Reference Kaze, Alomayri, Hasan, Tome, Lecomte-Nana, Nemaleu, Tchakoute, Kamseu, Melo and Rahier2020a; Nkwaju et al., Reference Nkwaju, Djobo, Nouping, Huisken, Deutou and Courard2019).
XRD patterns of a Kln- and b Hly-based geopolymers

When the SiO2/Al2O3 ratio increased to >3.0, the zeolite crystal disappeared, accompanied by an increase in intensity of the broad peak centered at ~27.7°2θ, indicating that the amount of amorphous geopolymer was increased. The quartz, however, remained intact after geopolymerization for Kln-based geopolymer due to its chemical stability.
These results demonstrated that the SiO2/Al2O3 ratio affected the phase composition, which controlled the formation of zeolite or geopolymer for alkali-activated Kln750℃ or Hly750℃. Their products showed no significant differences in the mineralogical phase under the same SiO2/Al2O3 ratio, however.
FTIR Results
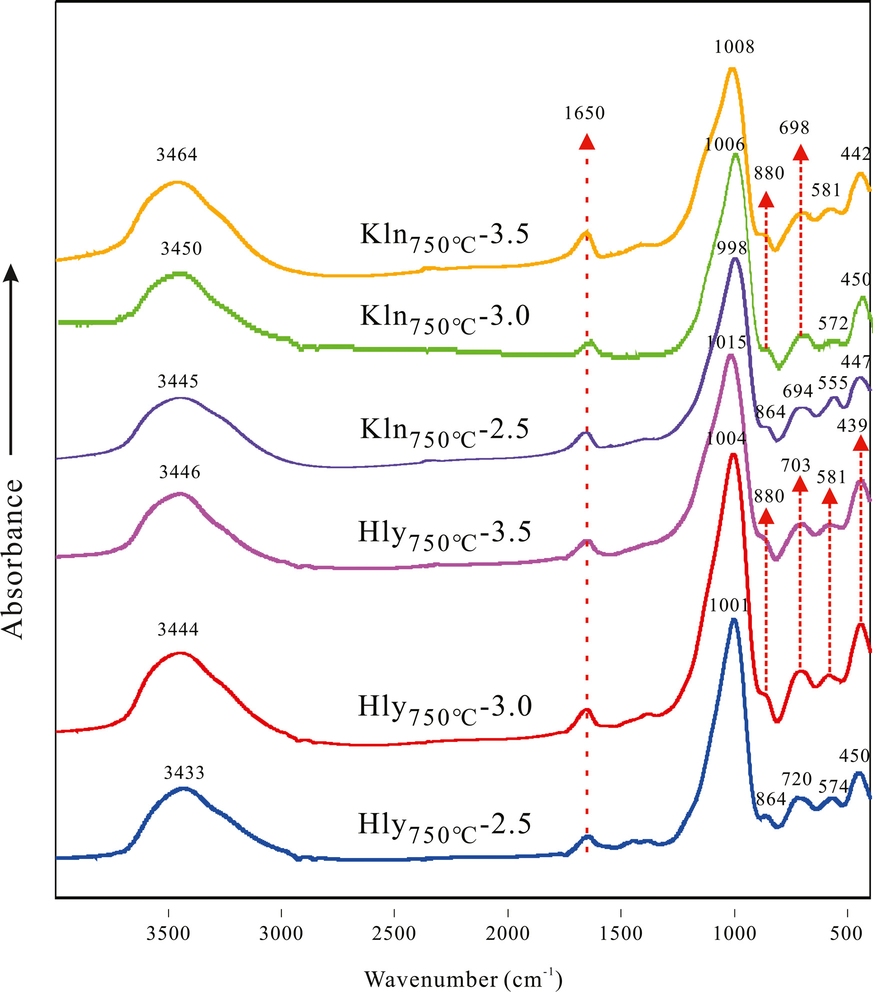
The absence of significant differences in local environments of the OH and other FTIR-active modes indicated that no significant differences transpired at the molecular scale between Kln750℃- and Hly750℃-based geopolymers (Fig. 9). Furthermore, the peaks of the geopolymers were broad, which demonstrated that the alkali-activation products were highly amorphous.
FTIR spectra of Kln- and Hly-based geopolymers

The broad peaks in the range 3444 to 3464 and at 1650 cm–1 were attributed to the stretching and bending vibrations of O–H from physically adsorbed water (Madejová & Komadel, Reference Madejová and Komadel2001). The absorption at ~703 cm–1 corresponded to the bending vibration of Si–O–AlIV, while those at ~581 and ~439 cm–1 should be associated with the stretching vibration of Al–O and the bending vibration of Si–O–Si, respectively. In addition, a shoulder observed at ~882 cm–1 was related to the presence of non-bridging-oxygens (e.g. Al–O–, Si–O–) resulting from the geopolymerization process.
Notably, for all geopolymers, a major band which appeared between 1200 and 900 cm–1 was normally denoted the “main band,” which was attributed to an asymmetric stretching vibration of Si–O–T (T: Si or Al). This band has been used widely to investigate the chemical properties of geopolymers (Rees et al., Reference Rees, Provis, Lukey and Deventer2007; Zhang et al., Reference Zhang, Guo, Deng, Fan, Yu and Wang2020a). Compared to FTIR spectra of Kln750℃ and Hly750℃ (Fig. 2), the main band shifted significantly to a lower wavenumber after alkali-activation, owing to the increased amount of Si–OH and the substitution of Al in the silicate networks, leading to the decreased molecular vibrational force-constant (Rees et al., Reference Rees, Provis, Lukey and Deventer2007; Zhang et al., Reference Zhang, Guo, Yuan, Deng and Liu2020c). This displacement also reflected that Kln or Hly had dissolved and the geopolymers were formed. With the increase in the SiO2/Al2O3 ratio, the wavenumber of main bands for geopolymers increased slightly. This may be attributed to the incorporation of more Si into the geopolymer matrix or the more unreacted raw materials, which warrants further study (Bewa et al., Reference Bewa, Tchakouté, Banenzoué, Cakanou, Mbakop, Kamseu and Rüscher2020).
NMR Results
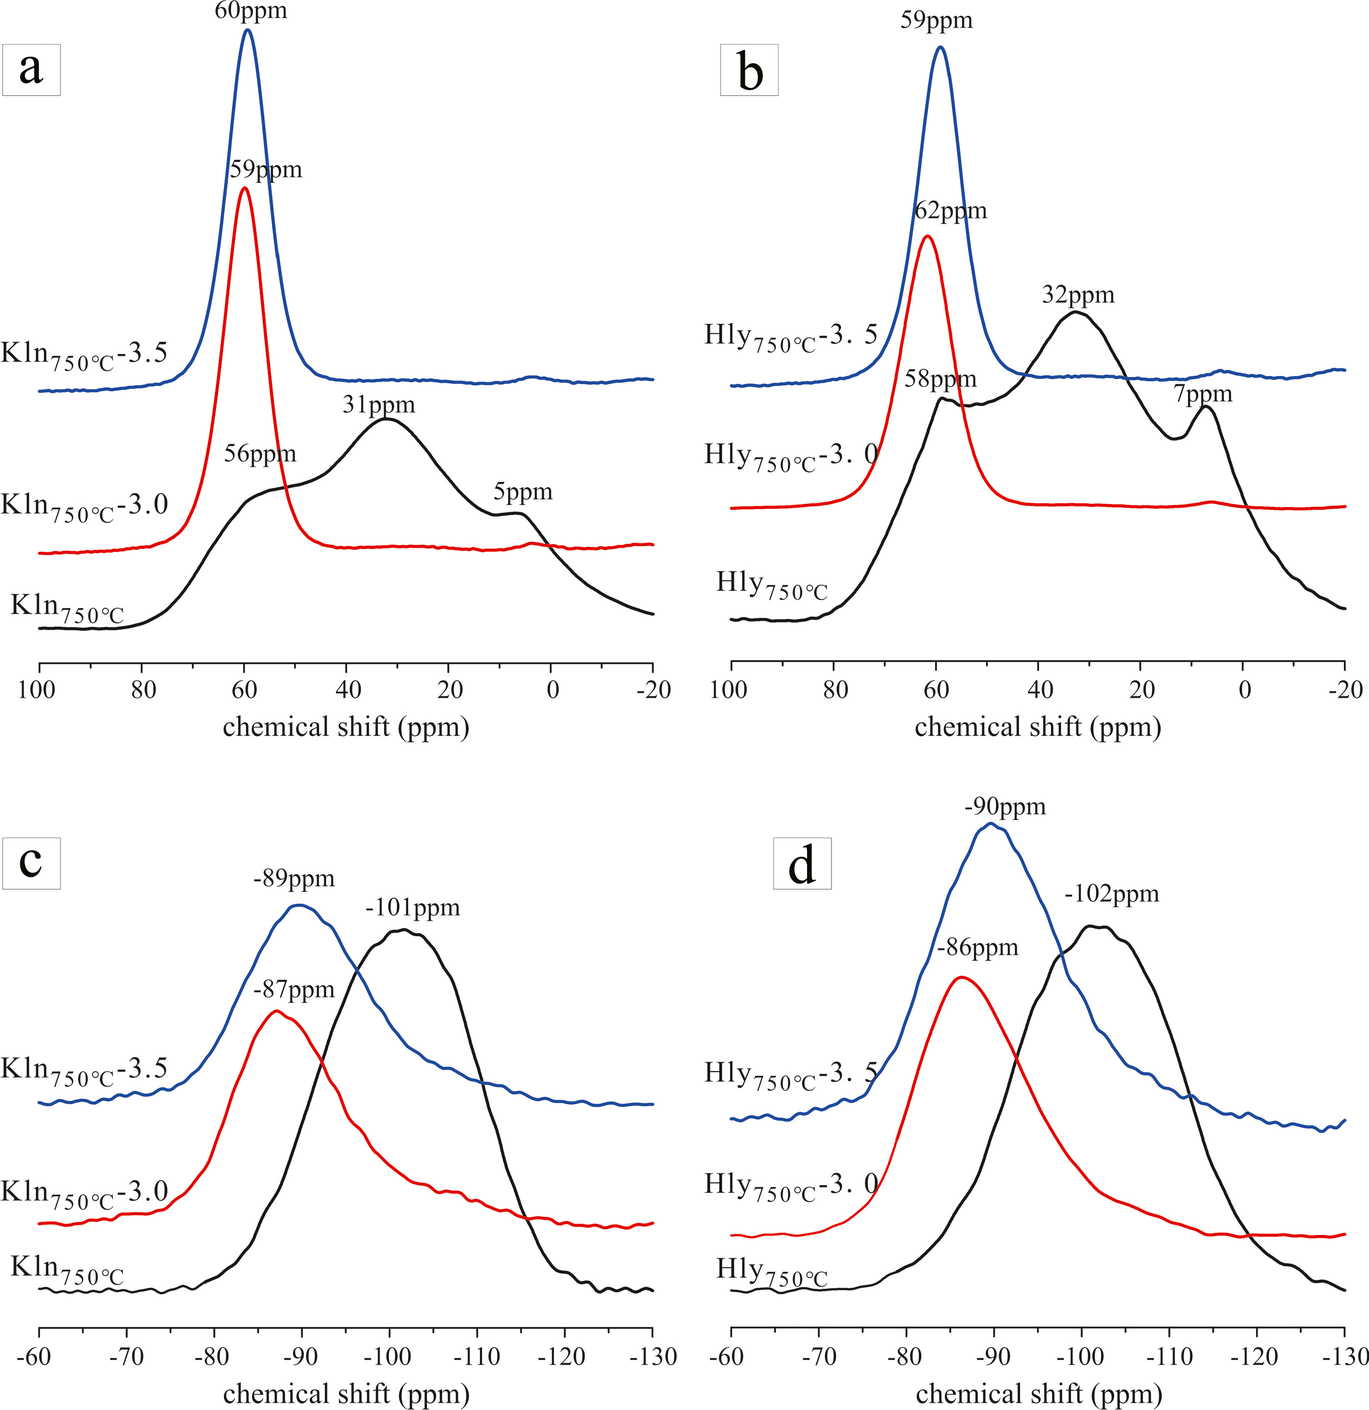
The 27Al MAS NMR spectra of Kln750℃ and Hly750℃ (Fig. 10a) both showed three resonances centered at approximately 6, 31, and 59 ppm, which were assigned to AlVI, AlV, and AlIV, respectively. After reacting with alkaline solution, the 27Al MAS NMR spectra of all samples had a strong resonance at ~61 ppm, accompanied by the disappearance of AlV and AlVI. Therefore, Al was mainly in four-coordination (AlIV) in the geopolymer despite the SiO2/Al2O3 ratios, indicating that increasing the SiO2/Al2O3 ratio did not significantly change the local structure of the Al environment in the geopolymer framework.
27Al MAS NMR spectra of a Kln750℃ and its alkali-activation products and b Hly750℃ and its alkali-activation products; 29Si CP/MAS NMR spectra of c Kln750℃ and its alkali-activation products; and d Hly750℃ and its alkali-activation products

The 29Si CP/MAS NMR spectra of Kln750℃ and Hly750℃ showed one broad resonance centered at approximately –101 ppm (Fig. 10b), which was attributed to a Q3 Si environment, namely, Si was linked to three other Si atoms through oxygens (Maia et al., Reference Maia, Angélica, de Freitas Neves, Pöllmann, Straub and Saalwächter2014). After geopolymerization, this peak shifted to a higher field position and decreased in intensity. This Si chemical shift was attributed to the Q4(mAl) environments, which was affected by Al substitution (Skibsted & Andersen, Reference Skibsted and Andersen2013). Previous studies have reported that for replacement of Si neighbors, as Q4(mAl), each additional [AlO4] would increase the chemical shift by approximately 5 ppm (Walkley & Provis, Reference Walkley and Provis2019). Therefore, with the increase of SiO2/Al2O3 ratios, this peak shifted to lower field position.
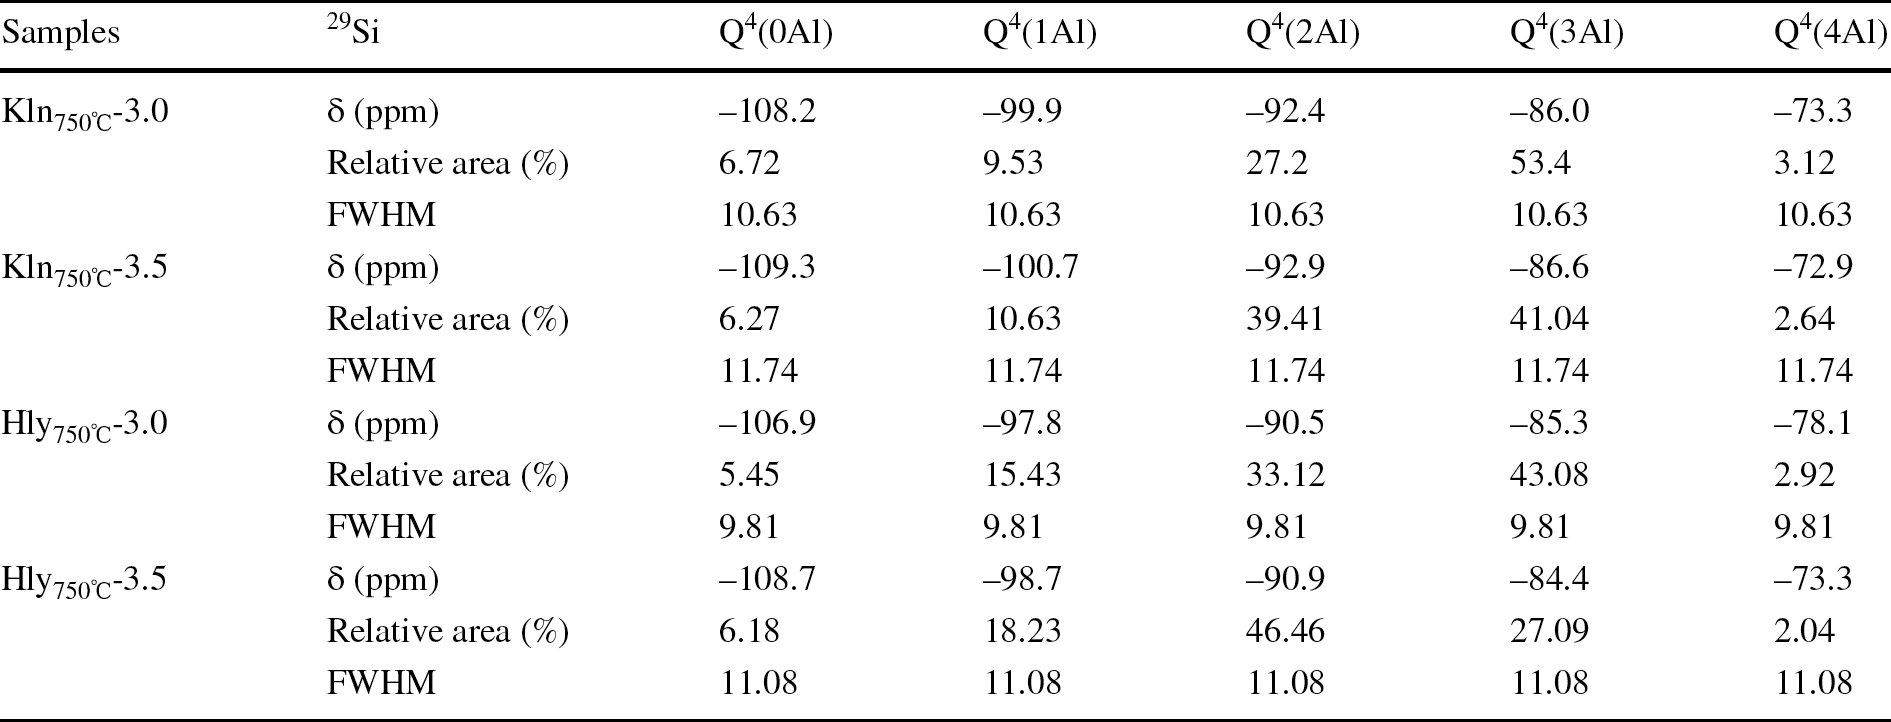
Due to the fact that each peak centered between –86 and 90 ppm was not unequivocally assignable to a single Si environment, Gaussian peak deconvolution of the 29Si NMR spectra for all geopolymers was conducted to analyze Q4(mAl) (0 ≤ m ≤ 4) Si environments and obtain more specific information about the Si coordination environments. Deconvolution of geopolymers produced five peaks located at approximately –108, –100, –93, –87, and –80 ppm (Fig. 11), which were attributed to Q4(0Al), Q4(1Al), Q4(2Al), Q4(3Al), and Q4(4Al), respectively.
Deconvolution results for 29Si CP/MAS NMR spectra of clay-based geopolymers: a Kln750℃-3.0; b Kln750℃-3.5; c Hly750℃-3.0; and d Hly750℃-3.5

All geopolymers consisted mainly of Q4(2Al) and Q4(3Al) (Table 3), which demonstrated that one [SiO4] tetrahedron connected mainly to two or three [AlO4] tetrahedra in this geopolymer network. In addition, the fraction of Q4(mAl) structural units rich in Si (i.e. Q4(0Al), Q4(1Al), and Q4(2Al)) increased as the SiO2/Al2O3 ratios increased. When the SiO2/Al2O3 ratios increased from 3.0 to 3.5, the value of (Q4(0Al) + Q4(1Al) + Q4(2Al))/(Q4(4Al) + Q4(3Al)) increased from 0.77 to 1.29 and from 1.17 to 2.43 for Kln-based and Hly-based geopolymers, respectively. At the same SiO2/Al2O3 ratio, the geopolymers derived from Hly contained more Si than those derived from Kln, which may be one reason why Hly-based geopolymers exhibited better properties than Kln-based geopolymers (He et al., Reference He, Wang, Shuai, Jia, Shu, Yuan, Xu, Wang and Yu2016; Qian et al., Reference Qian, Feng, Song, García, Estrella, Patiño and Zhang2017).
Fractional areas of the constituent NMR peaks

SEM Results
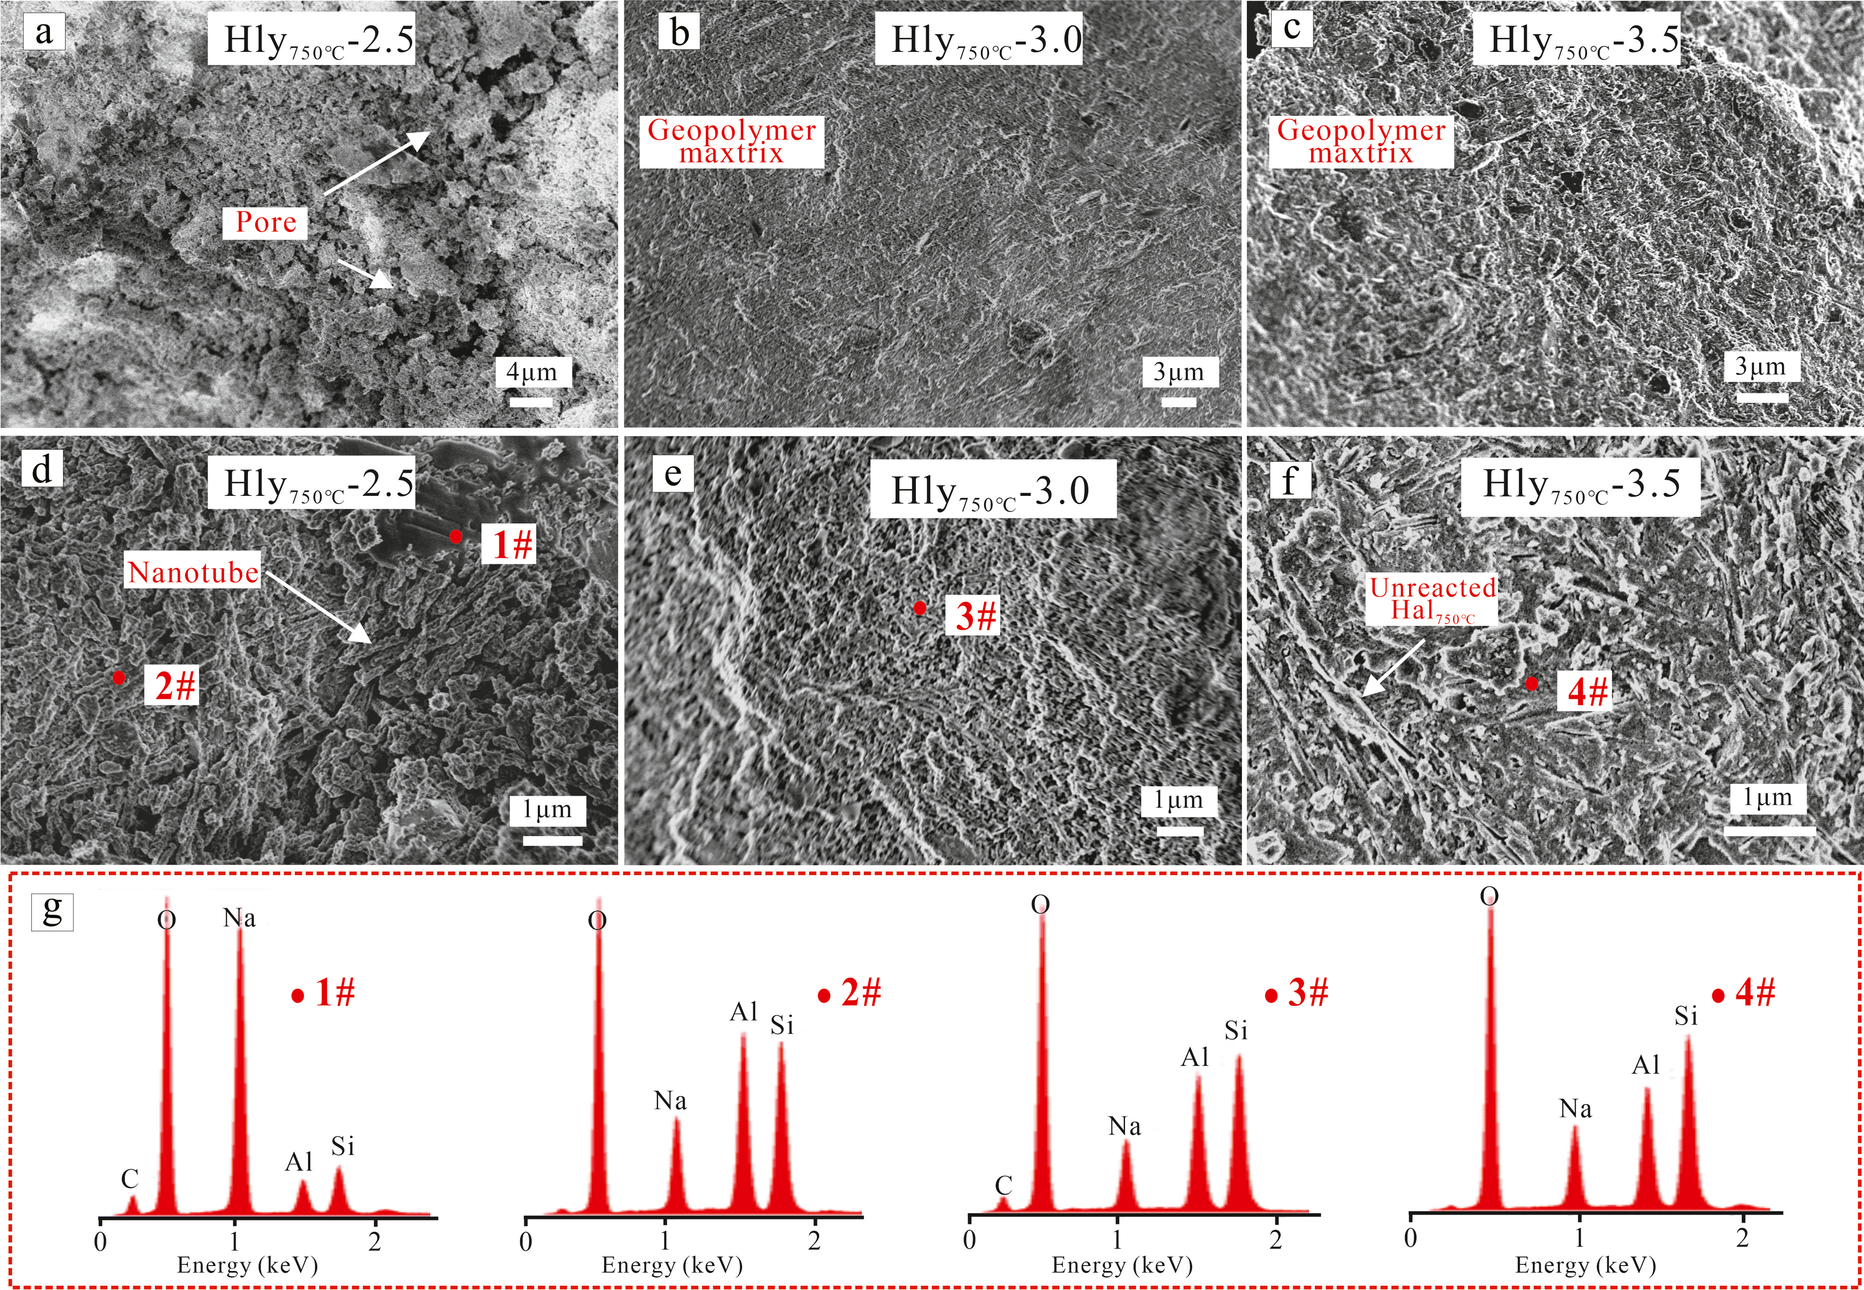
Scanning electron micrographs (Fig. 12a) revealed that Hly750℃-2.5 exhibited a rather loosely bonded microstructure with some macropores and cracks, which corresponded to the low compressive strength. At high magnification, some nanotubular species were loosely stacked together without the formation of continuous integrity (Fig. 12d). These nanotubular species should be the unreacted Hly750℃ resulting from incomplete dissolution. In addition, some prismatic particles formed, which were comprised mainly of Na and O with traces of C, Si, and Al elements according to EDX analysis (Fig. 12g, #1). This particle should be attributed mainly to the NaOH, while a small amount of Na2CO3 formed through the reaction between NaOH and atmospheric CO2. Similarly, Kln750℃-2.5 also had a rather uncompacted and inhomogeneous microstructure (Fig. 12h,k), which thus exhibited low compressive strength.
SEM images of Hly- and Kln-based geopolymers: a, d Hly750℃-2.5; b, e Hly750℃-2.0; c, f Hly750℃-3.5; g EDX result of Hly-based geopolymer; h, l Kln750℃-2.5; i, m Kln750℃-3.0; k, n Kln750℃-3.5


Hly750℃-3.0 had significant continuity texture with an homogeneous and compact microstructure (Fig. 12b,e). The densification of alkali-activated products was consistent with the improvements in compressive strength of the geopolymers. The EDX analysis showed that the geopolymer matrix was composed mainly of Na, Si, Al, and O elements, indicating the formation of sodium aluminate silicate hydrate (N–A–S–H). In Fig. 12c, Hly750℃-3.5 still showed a compact microstructure with micropores. However, unreacted Hly750℃ was still embedded in the geopolymer matrix (Fig. 12f), causing the less homogeneous structure of Hly750℃-3.5 and decreased the compressive strength.
Notably, the microstructure of geopolymers derived from Kln750℃ was obviously less homogeneous and less compact than from Hly750℃ under the same conditions. Many unreacted Kln750℃ crystallites were easily found to be embedded in the geopolymeric matrix, which caused the formation of many cracks and destroyed significantly the homogenous structure of the geopolymer (Fig. 12l,m). This may account for the lower 7-day compressive strength of Kln750℃- compared to Hly750℃-based geopolymers. However, further studies and more technologies are required to research the similar 28-day strengths between Kln750℃- and Hly750℃-based geopolymers.
These results also confirmed that the soluble SiO2 was very important for the geopolymer formation. The lack of soluble SiO2 would inhibit the dissolution of minerals and impede the polycondensation of [SiO4] and [AlO4] oligomers even using a very highly alkaline solution for alkali-activation (Liew et al., Reference Liew, Heah, Al Bakri and Hussin2016; Singh et al., Reference Singh, Trigg, Burgar and Bastow2005). On the other hand, the morphological differences between Kln and Hly also affect the microstructure of the geopolymers. Nanotubular Hly appeared to possess greater geopolymerization reactivity than platy Kln according to the more compact and homogeneous microstructure for Hly750℃- than for Kln750℃-based geopolymers.
Pore Distribution
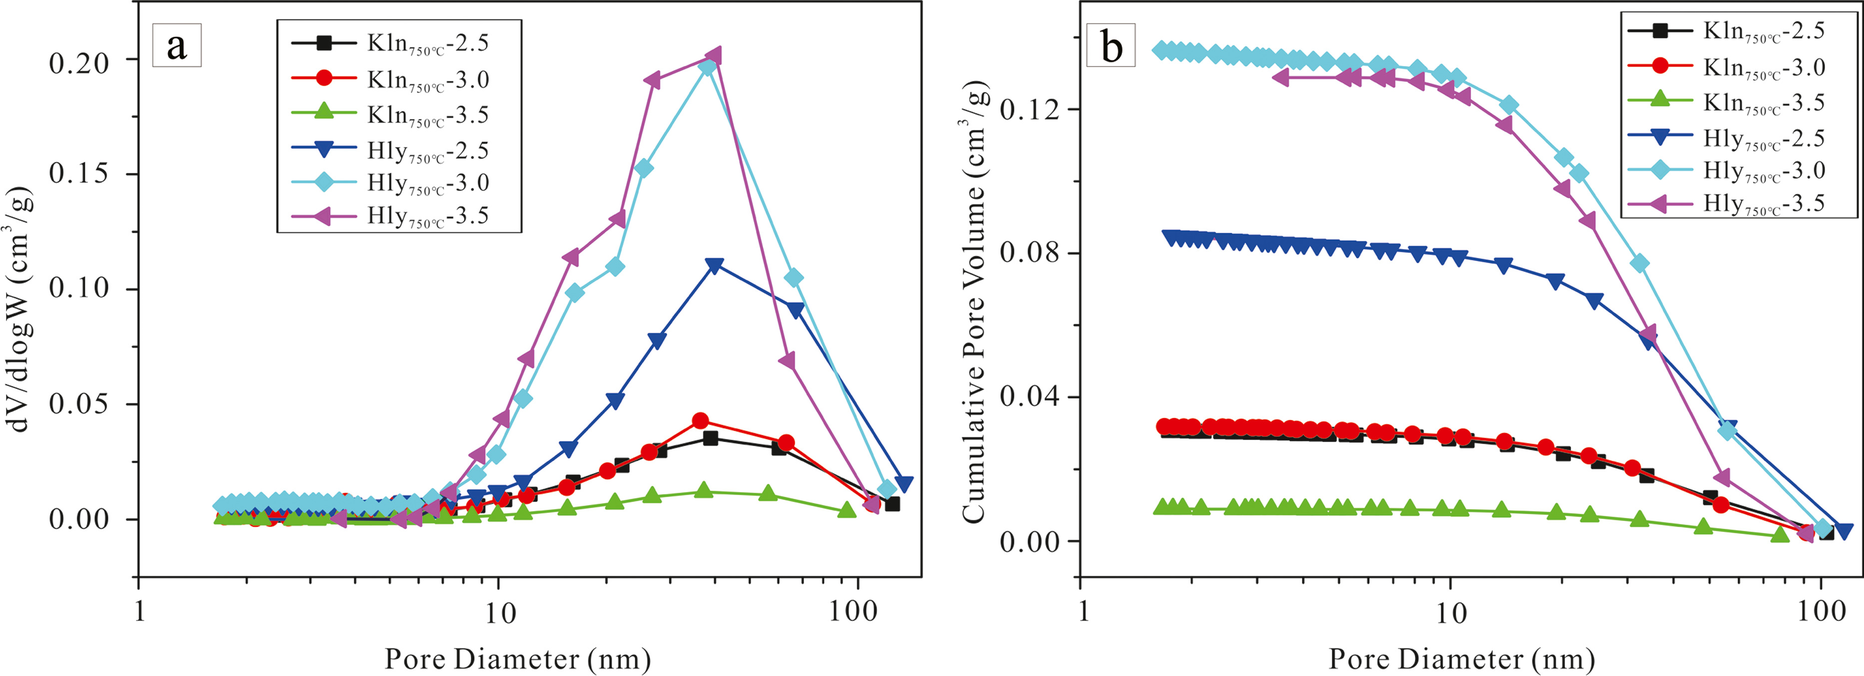
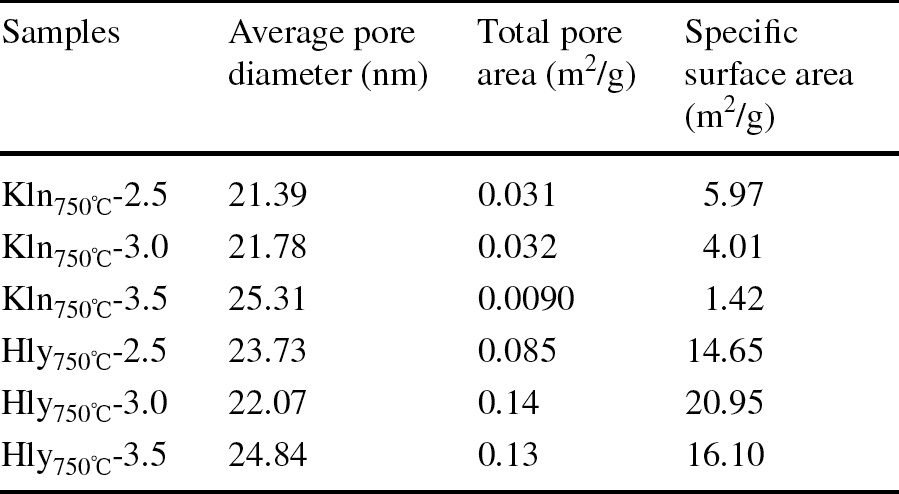
The pore-size distribution curves of all geopolymers in Fig. 13a exhibited a unimodal distribution. A broad peak occurred in the range from 10–100 nm with a center at 35 nm, which was attributed to capillary pores in the geopolymer matrix (Ma et al., Reference Ma, Hu and Ye2013). The broader-shaped peak of Kln750℃-based geopolymer rather than the narrower Hly750℃-based peak indicated that the pore distribution of Kln750℃-based geopolymer has a lower degree of homogeneity than that of Hly750℃-based geopolymer. Furthermore, the SiO2/Al2O3 ratio was poorly related to the pore-size distribution and cumulative pore volume, at least in the mesopore range. This was shown by the similar average pore diameters of all the geopolymers (~23 nm) (Table 4).
a Pore-size distribution and b cumulative pore volume of clay-based geopolymers

Pore parameters and specific surface area of geopolymers

It is of note that although the pore volume of the Kln750℃-based geopolymer was less than that of the Hly750℃-based geopolymer (Table 4), Kln750℃-based geopolymer exhibited lower compressive strength than Hly750℃-based geopolymer. Table 4 also shows that Kln750℃-based geopolymers had much lower specific surface area than Hly750℃-based geopolymers, which demonstrated that Hly750℃-based geopolymers may possess more pores (micropore and mespore) than Kln750℃-based ones. This result revealed that, at least in the mesopore range, porosity has no direct relation with compressive strength. As observed from SEM images, many macropores and cracks were present in the Kln750℃-based geopolymer matrix (Fig. 12e,f), but these macropores or cracks could not be characterized by N2 physisorption analysis, which was also an important factor influencing the compressive strength. On the other hand, the presence of the unreacted particles (e.g. NaOH, Na2SiO4) would cover the surface of a geopolymer, thus reducing the pore volume (Zhang et al., Reference Zhang, Guo, Yuan, Deng and Liu2020c).
General Discussion
Recently, owing to its special microstructure and high reactivity, the use of Hly for preparation of geopolymers has attracted increasing attention (Kaze et al., Reference Kaze, Tchakoute, Mbakop, Mache, Kamseu, Melo, Leonelli and Rahier2018; Blaise et al., Reference Blaise, Ndigui, Emmanuel, Rodrigue and Robert2019; Zhang et al., Reference Zhang, Yuan, Guo, Deng, Li, Li, Wang and Liu2021; Martina et al., Reference Martina, Lorenzo, Giuseppe, Giuseppe and Stefana2022; Navid et al., Reference Navid, Carsten, Carsten, Paul and Mehdi2023). Kaze et al. (Reference Kaze, Tchakoute, Mbakop, Mache, Kamseu, Melo, Leonelli and Rahier2018) investigated the effects of NaOH concentration on the properties of Hly600℃-based geopolymers. As the NaOH concentration increased, the compressive strengths increased at first and then decreased. When NaOH concentration increased to 10 mol/L, the compressive strength reached 28 MPa. However, the detailed SiO2/Al2O3 ratio of raw materials was unclear. The same authors also compared mechanical and thermal properties of Hly and Kln (Kaze et al., Reference Kaze, Nana, Lecomte-Nana, Deutou, Kamseu, Melo, Andreola and Leonelli2022; Tchakouté et al., Reference Tchakouté, Melele, Djamen, Kaze, Kamseu, Nanseu, Leonelli and Rüscher2020) and concluded that Hly-based geopolymer showed better properties than Kln-based geopolymer because Hly possessed a smaller particle size and greater specific surface area than Kln. However, the calcined Hly they used was spherical; this may result in different geopolymerization behavior in contrast to Hly with a nanotubular shape. For example, they stated that the spherical shapes of Hly could provide nucleation sites necessary to bolster the geopolymerization process, which sites were not found in the current study. Besides, the clays (three kinds) used in Kaze’s study contained many impurities, such as illite, anatase, and quartz and the calcination of clays was incomplete, which may influence the geopolymerization of Hly. In addition, Zhang et al. (Reference Zhang, Yuan, Guo, Deng, Li, Li, Wang and Liu2021) compared various curing conditions on the mechanical properties and microstructure of Hly-based geopolymers and found that as the curing temperature increased to ≥50℃, the compressive strengths decreased with ageing time. This is consistent with the present study, in which the compressive strength of Hly-based geopolymers decreased with ageing. In contrast, the compressive strength of Kln-based geopolymers increased with ageing, which confirmed that the optimal curing condition is related to the reactivity of precursors and high curing temperature is not suitable for highly reactive precursors.
Many other studies have been carried out concerning the improved properties of Hly-based geopolymers (Blaise et al., Reference Blaise, Ndigui, Emmanuel, Rodrigue and Robert2019; Zhang et al., Reference Zhang, Guo, Yuan, Li, Wang, Deng and Liu2020b; Kaze et al., Reference Kaze, Adesina, Alomayri, Assaedi, Kamseu, Melo, Andreola and Leonelli2021), utilization of Hly as an additive in geopolymers (Kaze et al., Reference Kaze, Venyite, Nana, Deutou, Tchakoute, Rahier, Kamseu, Melo and Leonelli2020b; Nemaleu et al., Reference Nemaleu, Kaze, Tome, Alomayri, Assaedi, Kamseu, Melo and Sglavo2021; Navid et al., Reference Navid, Carsten, Carsten, Paul and Mehdi2023), and application of Hly-based geopolymers (Barrie et al., Reference Barrie, Cappuyns, Vassilieva, Adriaens, Hollanders, Garcés, Paredes, Pontikes, Elsen and Machiels2015; Martina et al., Reference Martina, Lorenzo, Giuseppe, Giuseppe and Stefana2022). However, these studies focused more on the properties of Hly-based or Hly-related geopolymers than on the nanotubular morphology of Hly in geopolymerization, which is interesting clay-related research. Although nanotubular Hly shows similar chemical composition to plate-like Kln, their microstructures and morphologies are quite different. These differences between Kln and Hly also cause the different physicochemical properties. Therefore, Hly shows not only similar but also different behavior to Kln during alkali-activation.
The results obtained demonstrated that, as with Kln, the alkali-activation products from Hly were zeolite A and the geopolymer when the SiO2/Al2O3 ratio was 2.5. Owing to the formation of different phases with large amounts of pores, the alkali-activation products derived from Kln and Hly both showed low compressive strength. Likewise, when SiO2/Al2O3 ratio was increased to >3.0, the alkali-activation of Hly produced mainly geopolymers analogous to the alkali-activated Kln-based geopolymers. Sufficient amounts of soluble SiO2 induced the polycondensation of oligomers to form geopolymers with compact and homogeneous structures (Ferone et al., Reference Ferone, Liguori, Capasso, Colangelo, Cioffi, Cappelletto and Di Maggio2015; Valentini, Reference Valentini2018), which improved the compressive strength.
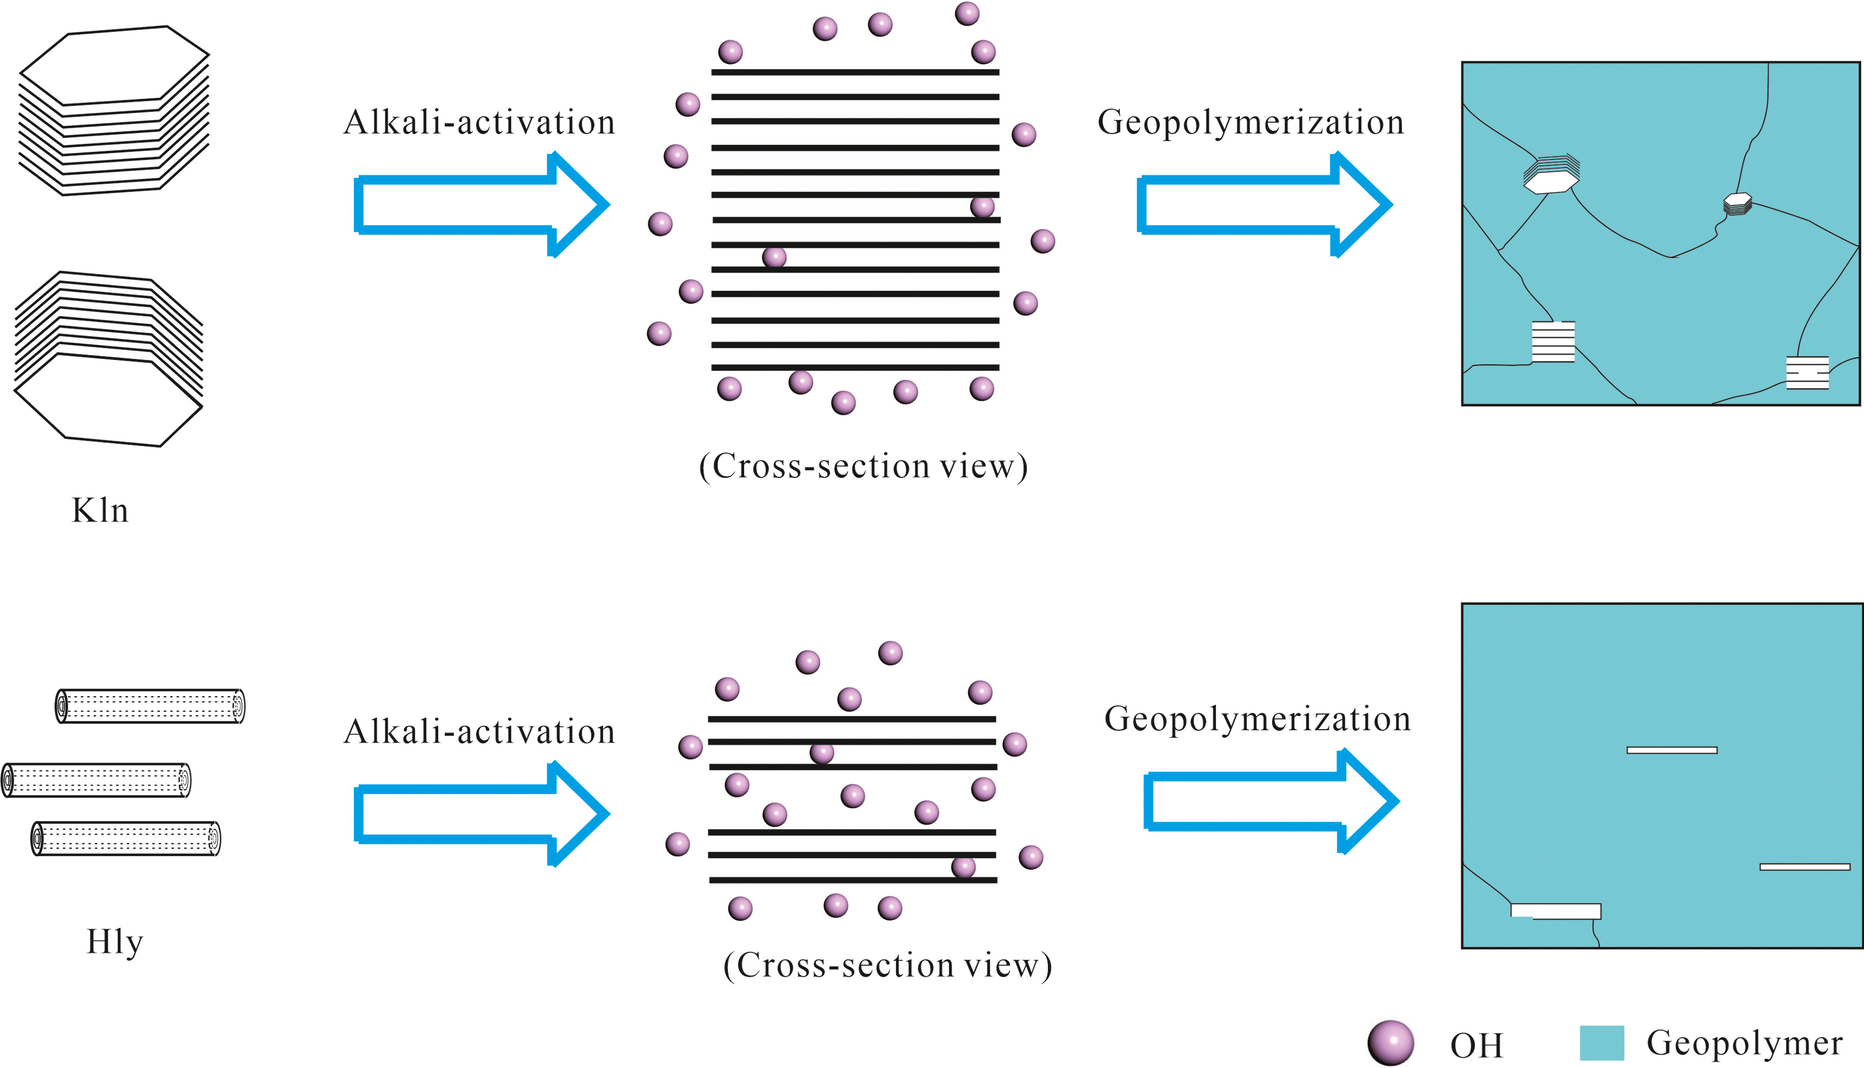
However, the above findings also indicated that the microstructure of the Hly-based geopolymer differed significantly from the Kln-based geopolymer. This phenomenon can be attributed to the different morphologies of Kln and Hly. As mentioned above, Kln consisted of stacked repeating layers to form a platy morphology. Normally, the particle size of Kln is a few microns, and the lamellar thickness is hundreds or thousands of nanometers. In contrast, Hly usually adopts a rolling of the unit layer to form a tubular morphology. The diameter of the tubular particles is nanometers, while the thickness of the tubular wall is a few nanometers, which is much smaller than that of Kln (Yuan et al., Reference Yuan, Tan and Annabi-Bergaya2015). According to Davidovits (Reference Davidovits2011), the Kln is attacked by alkaline solution at the edge and basal surfaces and inside the structure, layer by layer, during geopolymerization. Many unreacted Kln particles were present in Kln-based geopolymers due to insufficient dissolution. However, for Hly, both outside and inside surfaces of the Hly nanotube can be attacked by alkaline solution (Fig. 14), the dissolution of Si and Al from Hly was, thus, easier and quicker than from Kln, which was confirmed by the dissolution results (Table 2). This may accelerate the alkali-activation to improve the geopolymerization degree at an early stage (Fig. 6).
Schematic diagram of alkali-activated Kln- and Hly-based geopolymers

Significantly, the different structures between Kln and Hly might also cause the different geopolymerization reactivity. Compared to Kln, the formation of naturally occurring Hly is prone to form defects under geological effects (Joussein et al., Reference Joussein, Petit, Churchman, Theng, Righi and Delvaux2005). Therefore, the degree of structural ordering of nanotubular Hly is obviously lower than that of plate-like Kln, resulting in the greater reactivity for Hly than Kln. On the other hand, Hly has a larger specific surface area than Kln, which can provide more contact sites for activators, leading to more release of Si and Al and, thus, a greater degree of geopolymerization than Kln (Zhang et al., Reference Zhang, Wang, Yao and Zhu2012a).
Furthermore, the unique properties of Hly might also cause different geopolymerization behavior from Kln. For example, previous reports indicated that the unit mass of the number of surface active points in Hly is greater than that of Kln (Tan et al., Reference Tan, Yuan, Annabi-Bergaya, Dong, Liu and He2015; Yuan et al., Reference Yuan, Southon, Liu, Green, Hook, Antill and Kepert2008). In addition, the outer surfaces of the nanotubes of Hly will form hydroxyl groups after calcination at 600–900℃; however, no similar reports have been made about the calcination of Kln (Yuan et al., Reference Yuan, Tan, Aannabi-Bergaya, Yan, Fan, Liu and He2012). These effects on the microstructure and composition of as-synthesized geopolymers should also be considered in future studies.
Conclusions
The dependence of the microstructure and compressive strength of geopolymers derived from platy kaolinite and nanotubular halloysite on the SiO2/Al2O3 ratio was investigated here by means of a combination of spectroscopic and microscopic techniques. When the SiO2/Al2O3 ratio was 2.5, both alkali-activated kaolinite and alkali-activated halloysite exhibited a loosely bound and inhomogeneous microstructure due to the formation of zeolite A. When the SiO2/Al2O3 ratio was 3 or 3.5, the alkali-activation product was a geopolymer which showed compact and dense microstructure with high compressive strength.
In addition, compared to kaolinite-based geopolymers, the microstructure of halloysite-based geopolymers was more compact and homogeneous, and with fewer unreacted particles, which thus exhibited greater early compressive strength. This can be attributed to the different morphologies between halloysite and kaolinite. Halloysite possesses a nanosized tubular morphology, which showed a smaller particle size and larger specific surface area than kaolinite. Therefore, the OH– can attack readily the halloysite tube from both the inside and outside surfaces, leaching more Si and Al, and forming larger amounts of geopolymer. Moreover, the nanosized particles did not destroy significantly the geopolymer matrix, which results in a better mechanical performance for halloysite-based geopolymers than kaolinite-based geopolymers.
These findings indicated that the mechanical properties and microstructure of clay-based geopolymers are not only influenced by the SiO2/Al2O3 ratio but also by the microstructure and morphology of the raw materials. Nanotubular halloysite is a promising geopolymer precursor, which showed greater geopolymerization reactivity than plate-like kaolinite.
Acknowledgements
Financial support by the National Special Support for High-Level Personnel, Basic and Applied Basic Research Foundation of Guangdong Province (Grant No 2023A1515012180), and the National Natural Science Foundation of China (Grant Nos. 52161145405 and 41972045) are gratefully acknowledged.
Data Availability
Data will be available on request.
Declarations
Competing Interest
The authors declare that there is no conflict of interest.