I. Introduction
Improvements in the technology of winemaking over the past 50 years have significantly reduced the incidence of various faults in wine.Footnote 1 At the same time, however, the wine-consuming public and wine experts are better educated about these faults and better at spotting them. Since even advanced winemaking still uses traditional methods and materials, the risk of these flaws remains a threat. Economically important faults are associated with the presence of excessive amounts of particular odor-active chemical compounds, including those associated with cork taint (2, 4, 6, Trichloroanisole or TCA), oxidation (mainly ethanol), volatile acidity (mainly acetic acid), and ethyl phenols, primarily generated by Brettanomyces bruxellensis (4-ethylphenol and 4-ethylguiacol). At low concentrations, these chemicals might not be discernible or not a bother, and in some instances, a small amount may even be desired by some consumers (Perotti-Brown, Reference Perotti-Brown2016). A fault, then, reflects an excessive amount of these compounds relative to that desired by the winemaker, the quantity that will maximize the value of the wine in question. In turn, this depends on consumer preferences and perceptions. However, consumers’ perceptions of a particular fault differ by wine variety, winemaking style, bottle price, personal experience, and so on, making the winemaker's optimization problem more complicated.
Winemakers use various methods to manage these potential faults (Boulton et al., Reference Boulton, Singleton, Bisson and Kunkee1999). In this paper, we estimate elements of the costs of the wine spoilage yeast, Brettanomyces, in wine produced in California under alternative management regimes. As well as being of specific interest, this work serves as a case study exemplifying the more general issue of the costs of wine faults and the benefits from precision winemaking technology that reduces the incidence of those faults and their costs. The analysis of this paper uses detailed (confidential) data from three wineries in California to document the consequences of Brettanomyces for the economics of wine production using typical current technology, depending on the prevalence of the problem; the costs of preventive measures, detection, and treatment; and the costs of mitigation in terms of the loss in value of wine that has to be downgraded. This loss from downgrading is one measure of the loss of value, the direct loss. Additional indirect losses of value result from the effect on consumer willingness-to-pay for other wines, both from the same vintage and future vintages, for the particular winery and across the industry. These indirect losses are potentially important but are not quantified in this study.
Our analysis at the level of individual wineries explores elements of the direct costs and their determinants including: the frequency of testing of individual lots of wine and the sampling strategy employed; the scale of the winery in terms of total value and volume of wine being produced; the type(s) of wine being produced (different varieties and styles being more or less susceptible); the prevalence of the problem in the winery currently and in the past; and the potential value per unit of the wine, which affects the scale of the loss from being downgraded.
In addition to the micro-level differences revealed by our analysis of winery-specific data, we review evidence on the broader problem. Results from an online survey distributed to industry participants reinforce the findings from the analysis of the detailed winery data and suggest that the findings from that analysis may be indicative relative to the issue more generally across the industry. This formal quantitative assessment is buttressed by lessons gleaned from less-formal discussions with wine producers.
II. Background on Brettanomyces in Wine
Brettanomyces bruxellensis, or Brett, is a yeast that exists naturally in wineries and vineyards throughout the world.Footnote 2 The winemaking process selects for Brett in the winery. Once the yeast is well established in the winery environment, it is hard to eradicate, is readily spread, and is maintained by improperly sanitized equipment. Wooden barrels are a key factor in the persistence of Brett in a winery (Oswald and Edwards, Reference Oswald and Edwards2017). Early detection of ethyl phenols or DNA signatures of Brett can improve winemakers’ control of it (Zoeklein et al., Reference Zoeklein, Fugelsang, Gump and Nury1999). If Brett is detected, barrels are typically washed, sanitized with hot water (or ozonated water), and in some cases steam, and then returned to production until they depreciate enough to be removed from the winery—typically after three to five years in premium red wine production. Moving, working, and blending of infected wines during the barrel-aging stage of production is the primary cause of the spread in the winery. At this stage, filtration is the most effective method to decrease risk. In this context, the important management question concern how best to detect the problem and treat the infected wine prior to a loss of quality.
A. The Mechanism
When Brettanomyces grows in wine it produces several compounds that can alter the palate and bouquet. The four most important known aroma active compounds are 4-ethylphenol or 4-EP (described as having the aromas of Band-aids®, antiseptic, barnyard, and horse stable); 4-ethylguaiacol or 4-EG (described as having aromas of smoked bacon, spice, or cloves); 4-ethylcatechol or 4-EC (described as having a horsey aroma); and isovaleric acid (described as having an unpleasant smell of sweaty animals, cheese, and rancidity). Other aromatic characteristics associated with Brett include wet dog, creosote, burnt beans, rotting vegetation, plastic; Brett is also one of the potential causes of the mouse cage and vinegar aromatics. Different strains of Brett can produce varying amounts of any of these compounds. Further, the variety of grape used for a wine can greatly influence the production of fault-specific compounds.
At low levels, for some consumers, the presence of these compounds has a positive effect on wine, contributing to complexity, and giving an aged character to some young red wines. Some wines even rely on Brettanomyces to impart a distinctive character (see, e.g., White, Reference White2018). However, when the levels of the sensory compounds greatly exceed their sensory thresholds (which vary among wines according to their style and structure), their perception is almost always negative.Footnote 3 Sensory thresholds differ among individual consumers, and some find the compounds more unattractive than others, which may relate to a cultural experience.
Brett is primarily a problem of red wine, in particular, premium red wine.Footnote 4 Cross-contamination of winery equipment and barrels has led to white wine infections; however, this is extremely rare, and most Brett-related quality loss is experienced in red wine across the global wine industry. Different varieties of wine are affected differently by Brett, and while some consumers can appreciate Brett metabolites in small amounts in Bordeaux, they may decline to take a second sip of a badly spoiled California Pinot noir. The fact that Brett is a source of uncontrolled variation in wine quality is seen as a disadvantage by marketers, even if such variation might be perceived by some consumers as a positive attribute in some wine. While Brett character can be desirable at lower levels, there is no guarantee that high levels will not be produced unless the yeast is killed or physically removed. Even if a detected level of Brett spoilage is not perceived to be a problem during winemaking, the infection can continue to develop in unpredictable ways after bottling and potentially become a problem months or years later.Footnote 5 As Brettanomyces can potentially spoil a wine, it is generally seen as a wine-spoilage yeast, a risk to be actively managed, and the presence of its metabolites as a wine fault.
B. Producer Perceptions
In her “The Everything Guide to Brettanomyces,” Kelli White (Reference White2018) canvasses attitudes to Brett within the industry. While some sommeliers see Brett as beneficial, the perceptions among producers are predominantly negative, and increasingly so as awareness and understanding grow. For example, as White (Reference White2018) recounts, Randy and Mike Dunn, proprietors of Dunn Estate in Napa Valley, acknowledge that the threat of Brettanomyces is a constant in wineries and that the California wine industry has had a steep learning curve over the years.
“We had Brett, but honestly, everybody did back in the day. A lot of what we in the Napa Valley used to call ‘bottle bouquet’ or even ‘terroir’—in hindsight, I think a lot of that was Brett.” The Dunns first realized they had a problem in the early 2000s, right after the 1998 vintage was released. As Mike recalls, “We bought some bulk wine for the 1998 Napa Valley blend and didn't test it for microbial activity. It smelled okay but bloomed in the bottle. After that, we had all the old vintages tested, and we were right at threshold for all except 1998 and 2000.” (White, Reference White2018)
The threshold Mike Dunn is referring to is of the characteristic ethyl phenols produced by the yeast. Pascal Chatonnet, a French winemaking consultant and owner of the regional wine testing laboratory, did the early work to identify ethyl phenols as the key odorants of Brett-infected wines. He is critical of cellar practices that allow Brett to thrive and is critical of badly affected wines as flawed.
“I think that tiny amounts of ethyl phenols are not negative when you can't smell them, but when you reach the perception threshold, you are obviously losing immediately all the fresh, typical fruit and the originality of the wine. If we let Brettanomyces grow in every red wine, whatever the variety and the geographic origin, all the wines will smell the same.” (White, Reference White2018)
Hence, as our survey results confirm, the majority of industry participants have come to see Brett as a threat that they wish to manage.
[Nowadays,] Mike and Randy are committed to keeping their Brett levels as low as possible, but they have also come to terms with the fact that it is simply a part of their lives. “I haven't gotten rid of it entirely, but it's the lowest it's ever been,” Mike says. (White, Reference White2018)
C. Detection of Brett
Detection measures include monitoring and testing of lots. Regular testing of red wines—starting immediately after primary fermentation or post-malolactic fermentation, then at each topping or barrel cleaning—can identify processes or lots that are especially disposed to contamination; the first line of defense is the employment of staff who are able to detect off-odors by sniffing the wine. Composite sampling, in the same way a blood bank laboratory would screen for pathogens, allows the production team to identify problems cost effectively and reflex to more intensive testing as positive-testing lots are found. Standard microbiological plating using selective media is an inexpensive method that can be performed with minimal equipment at a winery. The primary issue with this method is that it relies on Brett to actively grow under alien conditions (aerobic atmosphere and warm temperatures with lots of nutrients). This change in conditions can cause the yeast not to grow if the shock of switching environments is too great. Though viable in vivo, the yeast might not grow in vitro (viable but non-culturable; VBNC), thus yielding a false negative culture result in the laboratory or a significant under-reporting of the true problem (Millet and Lonvaud-Funel, Reference Millet and Lonvaud-Funel2000). To get around this issue, DNA-based methodologies and measurement of typical Brett metabolites, 4EP/4EG, are used.
D. Management Options
When Brettanomyces or its spoilage by-products are detected in wine, the winemaker has some treatment options available, including doing nothing. The “do-nothing” option could eventually result in the loss or downgrading of an entire tank, a barrel group, or a lot of wine. Subsequent losses of bottled wine may also occur over a period of months or years as Brettanomyces can subsist and grow in wines for decades. The impact might be seen ultimately as damage to a brand or wine company, potentially manifest as a reduction in future willingness to pay for wine by consumers who, having perceived a fault (or perhaps simply a flavor they do not like) in the wine, are less confident of the quality and perceive a higher risk of disappointment with future purchases. This reduction in demand may be confined to the particular wine brand or the winery that produced it but might extend more broadly as an externality in the industry—a type of reputation effect potentially calling for a broader approach to quality management.Footnote 6
The “do-nothing” option is the default option if the winemaker fails to detect the problem because the technology for detection is ineffective (e.g., culture). Improved technology allows for earlier detection and a broader range of treatment options that can mitigate the damage—both to the current vintage and, through reputation effects, to future vintages. Once it is detected, the growth of Brettanomyces can be controlled by the addition of sulfur dioxide (to which, some strains are becoming more resistant) or other sterilizing compounds such as dimethyl dicarbonate (Velcorin®), typically at bottling. Alternatively, the wine can be bottled after sterile filtration, which physically removes the yeast.
Any of these treatment strategies might have consequences for other aspects of wine quality that must be taken into consideration. Filtration has the potential to remove Brett but also may remove or change important textural components, potentially making the wine less interesting.Footnote 7 Filtration physically removes the risk and is the best option from a risk and quality assurance position. But it is costly.Footnote 8 Velcorin® treatment preserves the wine's texture and kills Brett, but there is a sense with some winemakers that sterilization destroys the natural fate of the wine. Velcorin® degrades rapidly, has varied antimicrobial activity, and legal limits on application (OIV, 2014). There is also a risk of incomplete killing action if total microbial (yeast and bacterial) populations are above the recommended limit of 500 colony-forming units per milliliter (CFU/mL). Thus, it is generally only used immediately prior to bottling, at the highest effective dose. High doses of sulfites—another option for treating Brett-infected wine—will deaden the varietal aromas and delay the aging process. Recent reports have shown an increase in sulfite resistance among established strains of Brett if a sulfite regime is too routine (Varela et al., Reference Varela, Bartel, Roach, Borneman and Curtin2019).
Controlling the infection does not eliminate the already-present spoilage by-products. It may be economical in some cases to blend the wine with other (typically lower-valued) wine to dilute the fault compounds—effectively downgrading the infected wine and reducing value. Wines that are extremely affected will be downgraded to a lower price-point program or sold as bulk wine to the marketplace, usually at cost or a loss, depending on farming costs for the grapes. This downgrading or loss of inventory can have dramatic impacts on the winery, depending on its size. A larger winery may have the ability to blend affected wines to dilute the effects or even to create interesting depth in other programs. However, smaller wineries have little choice and may face damage to their brand if they do not produce their main wines every year, or if they produce an off-putting vintage. Either way, Brett typically has more negative impacts on a brand or winery than positive, although some modern wineries do use Brett character to their wine's advantage and a few specifically promote the practice.
Cleaning a cellar that has a high incidence of Brettanomyces can be very expensive and time-consuming. Each wine contact surface requires manual cleaning to remove biofilms and changes in sanitation regimes to accommodate longer treatments with higher concentrations of sanitizing agents and hot water. Barrels, which can be the second-most expensive production cost for red wines behind grapes, are typically destroyed or sold to makers of decorative planters for sale to garden centers.Footnote 9 Hoses and pumps are typically upgraded or replaced, and new cleaning regimes are put in place to heat-sanitize them between uses.
III. Elements of Costs of Brettanomyces: Three Case-Study Wineries
The main analysis of this paper uses detailed (confidential) data from three wineries in California. The three case-study wineries are all located in California's northern coastal valleys (i.e., Napa and Sonoma), known for their production of premium red wines. This is a context in which Brettanomyces is likely to be comparatively important to producers because of the extensive use of oak barrels, which can become a recurring source of infection in the cellar, and the high value of the wine being produced, which determines the cost of wine spoilage.
A. Case-Study Wineries
In choosing wineries for study, we were interested in being able to display differences associated with price points for the wine being produced, scales of production, and approaches to managing Brettanomyces. A sample of only three wineries allows limited scope for independent variation in these crucial aspects, but each winery produces a great many wines, and we had access to highly detailed data from each winery over multiple vintages and many lots of wine per vintage. The three case-study wineries vary significantly in terms of their Brett prevalence and management practices. A particular limitation of the sample is that they are all reasonably large producers and all in the premium region. The issues may be different for smaller-scale producers in the premium region, and for equally large- or much larger-scale producers in the Central Valley where the great majority of lower-priced wines are produced.
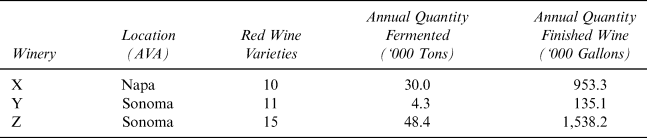
The identity of the case-study wineries must remain confidential, so we refer to them as wineries X, Y, and Z, respectively. Here we provide a broad overview of the pertinent characteristics of the three wineries, presented in a way aiming to assure that confidentiality is preserved. Table 1 summarizes some key features of the wineries.
Three Case-Study Wineries: Location and Red Wine Production

Notes: Volumes are based on inventory for 2013 vintage red wine for each winery in February 2014. Wine changes location frequently, and the authors were informed that inventory in February best approximates total red wine production.
Source: Authors’ construction based on confidential data provided by cooperating wineries.
Winery X
This winery is in the Napa Valley and produces a range of premium and ultra-premium red wines—around 400,000 red wine cases per year with an average value of $180 per case FOB in 2013 (or $72 million in total). In 2004, the management of this winery decided to take an aggressive approach to manage Brett after acknowledging a high incidence of infection-caused wine losses. Specific innovations included training of cellar staff to recognize Brett-specific off-aromas (4EP/4EG) and testing individuals’ sensitivity to them. Staff who could detect these compounds at low concentrations became the sentinels of the winemaking team. Further, sanitation was rationalized, and personnel were trained to prevent cross-contamination of equipment in the cellar. Finally, standard microbiological plating methods were dropped in favor of DNA-based detection methodologies and regular laboratory screening for 4EP/4EG. In 2013, the typical cost for the more rapid and more accurate DNA test done by a service lab was $50 per sample.Footnote 10 Eventually, the winery brought these more advanced methods in-house to reduce overall testing costs. Finally, as a potential Brett-prevention strategy, this winery decreased the barrel room temperature from 58°F to 52°F (see Cibrario et al., Reference Cibrario, Sertier, Riquier, de Revel, Masneuf-Pomarède, Ballestra and Dols-Lafargue2019 for a more recent discussion of the relevant issues and results). Informal advice indicates that this does not add too much to costs in a well-insulated facility.
Winery Y
This winery is located in Sonoma's Alexander Valley and produces a range of super-premium red and white wines—around 57,000 red wine cases per year with an average value of $310 per case FOB in 2013 (or around $17.5 million in total). Compared with Winery X, the management of this winery takes a less aggressive approach to manage Brett, given existing protocols to mitigate it. Standard practices include 4EP/4EG screening and, in 2014, adoption of DNA-based detection testing in the winery's own laboratory. The winemakers have found that the original cellar design creates a temperature gradient from floor to ceiling that they have determined is a key factor in Brettanomyces emergence. Efforts to monitor for Brett focus on barrels that are in the higher racks, which may be as much as ten degrees warmer than the lower racks during summer months, and require more handling because of increased evaporation. Wines in this condition are at greater risk, and management is evaluating infrastructure projects to improve temperature control.
Winery Z
This winery is located in Sonoma and produces a broader range of wine styles, including some sold at lower price points. Total production has been around 650,000 red wine cases per year in recent years, with an average value of $160 per case FOB in 2013 (or around $104 million in total). Compared with wineries X and Y, this facility is the largest and vinifies 15 different red wine varieties with a broader range of lot sizes—from one barrel to multiple 20,000-gallon tanks. The majority of red wine is made in a tank, although barrels and oak alternatives are also used. Barrels are maintained in a temperature-controlled cellar, and stainless steel tanks are outside at this facility, whereas the other two wineries are entirely enclosed.
B. Prevalence of Brettanomyces
We use information from blend reports for the three wineries to summarize the incidence of Brett for 2013 vintage wines. The blend reports provide monthly inventories of wine in barrels and tanks. They include 23,195 monthly container- and blend-specific observations for different lots of 2013 vintage wine. Each observation includes details of the date, MIP (Master Inventory Plan) ID and name, winery location, container type and ID, blend ID, product name, program name, lot size in gallons and cases, and an identifier for the presence of Brett. The 23,195 observations are not unique; a given lot of wine may be present for many months (on average, 16 months), and it may also change containers, blend, or size over time. However, there is no constant and unique identifier to track a specific lot of wine over time. Thus, we run a risk of counting a particular instance of Brett more than once.
Three categories of methods are employed to detect Brett in wines. The first uses defined growth media in various formats (solid or liquid) to encourage growth and natural amplification of Brett in culture. Once the gold standard among methods, culture-based methods run a higher risk of generating false-negative results, since these methods rely on a microorganism's cultivability, and other organisms may outgrow Brett under similar test conditions. The second category uses molecular biology methods to identify DNA sequences of Brett from wine samples. Molecular methods, typically utilizing polymerase chain reaction (PCR), have much greater accuracy and specificity than culture methods because of their well-defined gene targeting and amplification criteria; many different Brett detection kits are now commercially available. Finally, analytical chemistry methods such as gas chromatography–mass spectroscopy (GC-MS) are used to detect the metabolic by-products of Brett (4-EG/4EP and so on) at very low levels (parts-per-billion, ppb). Using either of the molecular biology or analytical chemistry methods saves days or weeks compared to culture-based methods. A proactive Brett-control program may make complementary use of all of these methods.Footnote 11
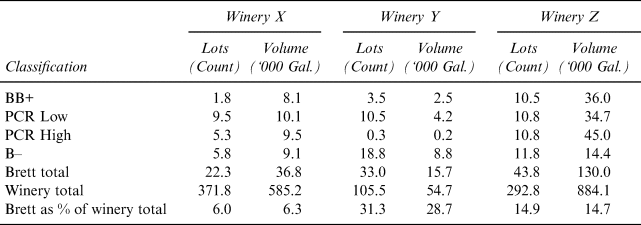
In Table 2, we report the incidence of Brett, in terms of rate of occurrence across barrel lots and volume of affected wine, for the three wineries. The wineries use several methods, as described earlier. In our examples, both culture and molecular methods were used. Several classifications are used for the degree of Brett detected in a blend. For instance, if Brett is detected in a lot using either method, then the lot is given the “B+” classification. The culture method is denoted as “BB” (for Brett broth), and the lab from one of the wineries offered this as a service to the other two. An in-house PCR-based method was also used, which gave qualitative indications of “low” (< 500 CFU/mL) or “high” (> 500 CFU/mL) Brett cell counts. Lots with a “high” amount of Brett sometimes go through a filtration process. If a wine that tested for more than 500 CFU/mL was filtered and subsequently re-tested negative for Brett, then the lot is denoted “B–.” To reduce the problem of double-counting, in Table 2 we report the average monthly incidence of Brett using data for four months: December 2014 through March 2015, which we compare with the monthly average inventory of 2013 vintage wine over the same period. This timing was chosen to allow time for Brett to develop early in the life of the most-recent vintage but also with an eye to including the total inventory of 2013 vintage wine, so as to be reasonably representative.
Incidence of Brett and Volume of Brett-Tainted Wine, 2013 Vintage Wines, Monthly Average, December 2014 to March 2015, Compared to Monthly Average Red Wine Inventory

Notes: If Brett is detected in a lot using the culture method, then the lot is given the “BB+” classification. If a lot has tested positive for Brett by PCR, it is designated as having either a “low” amount of Brett (less than 500 CFU/mL), or a “high” amount (more than 500 CFU/mL). If a lot that tested for more than 500 CFU/mL was filtered, and subsequently tested negative for Brett, then the lot is denoted “B–.” Categories are mutually exclusive.
Source: Authors’ construction based on confidential data provided by cooperating wineries.
Table 2 includes two columns for each winery; the first lists the number of lots by type of Brett classification, and the second lists the volume of wine (in U.S. gallons) by type of Brett classification. The total counts and volumes for Brett-tainted wine are compared to the winery's total count of lots and volume of wine. Winery X, which takes the most aggressive approach to eliminate Brett, has the lowest incidence of Brett; it affected only 6.0% of the lots and 6.3% of the total volume. Winery Y, which takes a moderate approach to manage Brett, had a significantly larger incidence of Brett; it affected 31.3% of the lots and 28.7% of the volume. Winery Z, which minimally controls for Brett, had the highest incidence of Brett by total volume of wine affected, although not in percentage terms: Brett affected 14.9% of the lots and 14.7% of the volume of wine.
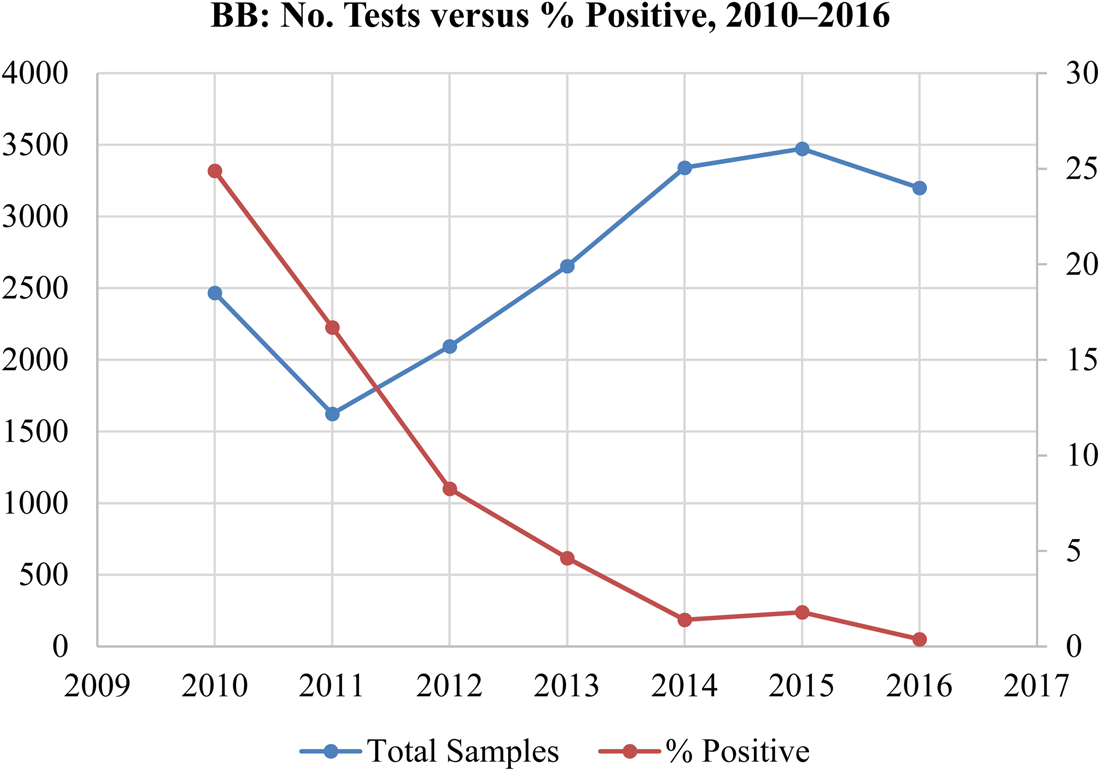
Comparing the three wineries, we can see a considerable difference in the prevalence of Brett. Winery X has a much lower prevalence, reflecting a proactive effort to reduce the incidence of Brett by improving practices and hygiene generally, application of a more vigilant testing regimen, and the use of more rigorous clean-up procedures when Brett is detected. The consequences were apparent in the measures of prevalence over time (see Figure 1).
Winery X: Use of Liquid Culture Method to Gain Control of Brettanomyces in the Cellar

C. Costs of Mitigation: Lost Value from Infected and Spoiled Wine
Wine tainted by Brett is often downgraded to or mixed with a lower quality blend. In some instances, the wine is sold on the market as bulk wine or even discarded. A second data source from the wineries, the “Brett Report,” provides information on every instance of a change in the blend designation for a lot of wine infected by Brett. Each observation in the Brett report begins with the date, blend ID, volume, container ID, initial product designation, and Brett classification, followed by the volume for which product designation is being changed, the new container ID, and the new product designation; information is also available on some of the same variables as in the blend reports. However, there are some discrepancies between the two datasets, creating difficulties in merging them; lots may be tested for Brett and change classification several times within a month, but the blend reports have only monthly observations. If the product designation of a lot changes that lot no longer has a blend ID and, in some instances, we cannot identify the ultimate product designation.
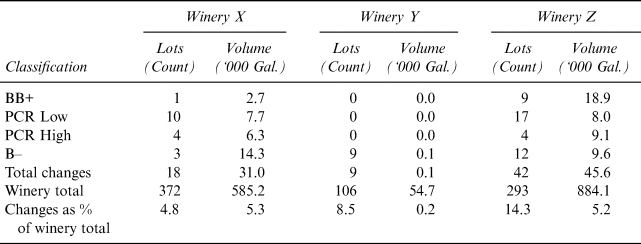
Table 3 is structured like Table 2, but now it reports the count and volume of wines for barrel lots of 2013 vintage wine that were changed during the four months, December 2014 through March 2015, compared with the average monthly inventory for that time frame. Winery X has a lower percentage of lots of wine reblended but a higher percentage of volume (4.8% of lots and 5.3% of volume) compared with both Winery Y (8.5% of lots and 0.2% of volume) and Winery Z (14.3% of lots and 5.2% of volume).Footnote 12
Reblending of Lots by Brett Classification, 2013 Vintage, Total Number and Volume December 2014 to March 2015, Compared to Monthly Average Red Wine Inventory

Note: See notes to Table 2 for details on Brett classification.
Source: Authors’ construction based on confidential data provided by cooperating wineries.
The next step in the analysis is to calculate the value lost when blending wine into a lower price category to mitigate Brettanomyces. We would like to be able to identify the originally intended product and ultimate product for every wine lot and to estimate the share of this change in allocation attributable to Brett. Then, combining this information with estimates of product-specific prices (available for 2013 vintage wines), we could estimate the losses in wine value from downgrading Brett-infected wine. We require additional information to identify instances in which lots infected with Brettanomyces were entirely discarded. Several empirical challenges arise in this setting, which means we must use guesstimates for some aspects.
First, in principle, the loss from reallocation could be measured, lot-by-lot, as the difference between the average wholesale value of the wine in the final blend and that in the initial blend (with due allowance for any difference in wine-making costs). However, these values are not directly observable. Each entry in the Brett report, which is associated with a particular (although not unique) blend ID, shows the initial (before reblending) “intended” product for the corresponding lot of wine. We have an estimate of the FOB value for each product so we can compute the initial value for each lot. In practice, different lots may share the same specific blend ID, and they might be used to produce different wines, so for some purposes, the value of a particular blend will be estimated as a weighted average across all lots (and associated products) using the same blend ID.
After reblending, a lot might be allocated across several new blends, with new blend IDs, which may be intended for use in the same or different products. Even if the new blend ID is recorded in the database, the intended wine product is not. However, if the same blend ID is associated with a specific product elsewhere in the Brett Report, which it is in many instances, we can use this information to try to infer a value for the reblended wine. Further complications arise when the same blend ID is associated with multiple products for which the prices diverge widely. In such instances, we must make assumptions. In our initial analysis, we assumed that wine downgraded because of Brett would be valued the same as the lowest-valued product of wine to be made using the same blend; this might overstate the total loss.
Approximations of this nature may be the best we can do for wine that is reblended and for which the new blend ID is known to us. In some cases, the new blend ID for a reblended lot might not be recorded in the database, making estimation even harder. On the order of half of the blend changes were designated as going to “multiple blends,” which remain unidentified, such that for our purposes, the final blend allocation is “unknown.” Thus, for these cases, we have to use alternative approaches for estimating the change in average value associated with the change in the blend. Where possible, we used the average change in value from reblending for other lots in the same Brett classification that was initially assigned to the same product, and for which the final blend ID was known and could be matched to other products. If this could not be done using the information within the same Brett classification, we used information on value changes in the same winery for other Brett classifications to infer the value change.
Attribution issues arise: the reasons for changes in blend allocations are not recorded, and a lot of wine may be allocated to a different (higher- or lower-valued blend) for various reasons, not just because of Brett. Such reallocation might be built into the program for particular brands. Sometimes a winemaker produces a significantly larger volume of wine, initially allocated to a particular product than is intended ultimately to be used for that purpose. This excess capacity allows for selection of better wine for the product but means that some share (in some cases a large share) of the total amount of wine showing as “downgraded” was never really intended for the premium use. The relevant opportunity cost for the total quantity is therefore lower.
Specifically, suppose a particular high-value blend typically has an over-allocation of premium fruit in the sense that, of the initial allocation to that blend, the winemaker expects ultimately to allocate a share 100(1 – w)% to the premium product category, to sell for the high price PH, and to allocate the remainder (100w%) to a lower product category, which sells for a lower price, PL. Then, the anticipated average value of this lot is the share-weighted average price: PA = (1 – w)PH + wPL. If a fraction of this lot is downgraded, the average price, PA, is a more-relevant measure of opportunity cost than PH. In calculating the loss of value from downgrading, owing to Brett, we adjust for “excess capacity” using this method selectively, as appropriate.Footnote 13
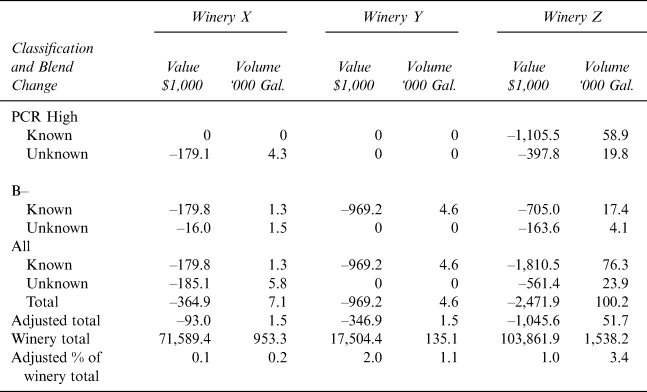
In Table 4, we report estimates of losses in value associated with the downgrading of wine, attributable to Brett, at each of the three wineries, associated with the 2013 vintage. We have defined four categories of Brett detection and treatment: BB+, high PCR, low PCR, and B– (see notes to Table 2 for details). Within this classification, in each category, the data are divided into two sub-categories, depending on whether the final blend allocation is “known” or “unknown”—the latter referring to instances where a blend changed to multiple, unidentified blends. Although BB+ and low PCR are indicators of the presence of Brett, the wineries inform us that a lot may change blends because of Brett only when it has been assigned the high PCR or B– designation. Therefore, Table 4 excludes the BB+ and low PCR categories of Brett detection.
Downgrading of Blends by Brett Classification, 2013 Vintage Wines—Value Lost

Notes: See notes to Table 2 for details on Brett classification. “Unknown” denotes instances where a blend changed to multiple, unidentified blends; changes in “Unknown” value are estimated by applying the same per unit change in value as observed for “Known” changes of the product associated with the blend, within the same Brett classification if possible. The adjusted total corrects for changes in blend allocations that probably would have occurred regardless of Brett.
Source: Authors’ construction based on confidential data provided by cooperating wineries.
Several features of the entries in Table 4 warrant discussion. First, we do not actually observe the ultimate product designation of the particular lots nor whether a change in utilization of a particular lot was truly attributable to Brett. Consequently, we may under- or overstate the economic consequences of Brett associated with the downgrading of wine. Our results are, therefore, sensitive to the adjustment procedure described earlier in this section. However, we verified with wineries the appropriateness of our method, and we determined it is the best way to approximate value changes based on the available data. Second, clearly, the story is different between Winery X (with its much lower incidence of Brett reflecting its more militant approach to preventing, detecting, and mitigating Brett problems) compared with Winery Y and Winery Z. Together, Winery Y and Winery Z experienced estimated losses of almost $1.4 million associated with Brett-induced downgrading of 53 thousand gallons of wine, or $26 per gallon, averaging higher losses per gallon ($231) on almost 1,500 gallons downgraded at Winery Y, and lower losses per gallon ($20) on more than 51,000 gallons downgraded at Winery Z.Footnote 14
More generally, we observe substantially smaller losses (by a factor of at least 10) owing to Brett when an aggressive prevention, detection, and mitigation approach is adopted relative to a moderate or minimal approach. The extension of these results to wineries more broadly depends on many factors such as winery size, price point, and location.
IV. Industry Perceptions: Survey Results
In the previous section, we explored micro-level differences that determine the consequences of Brett for individual lots of wine, based on data from three individual wineries. In this section, we draw on the results from an online survey of industry participants to provide a broader context for our analysis of winery-specific data.
The goal of the survey was to broaden our focus beyond the three case-study wineries and identify the nature and extent of Brett-related concerns across the wine industry. The case-study wineries are all in Napa and Sonoma, relatively large-scale producers of premium red and white wines. Our prior expectation was that Brett would be regarded differently by producers in other parts of California, and beyond California, depending on the prevalence of Brett, the scale of their production, and the types of wine produced (i.e., red versus white wine, and lower- versus higher-priced wine). In particular, we would conjecture that Brett is of greater concern for producers of premium red wine. In California, these producers are mainly in the coastal valleys; the vast majority of these wineries produce at a comparatively small scale.Footnote 15 Differences among these producers in their perceptions of Brett are of particular interest.
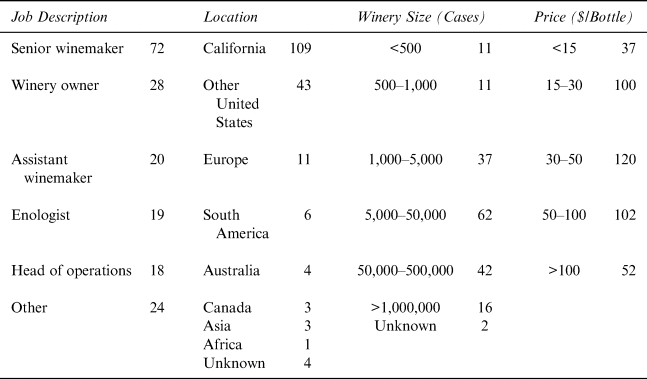
The survey was designed such that a range of industry professionals—winery owners, winemakers, enologists, cellar staff, and others—could participate. The online survey was shared with numerous wineries and promoted at the American Society for Enology and Viticulture (ASEV) annual conference in Monterey, CA, in June 2018, and the link to the survey was distributed to all ASEV members. We collected responses from 181 individuals, representing a wide range of wineries from around the globe. Table 5 summarizes the distribution (counts) of participants by their job title, winery location and size, and product price range.
Attributes of Survey Participants

Notes: A total of 181 people responded to the survey. Some respondents work at wineries in multiple locations, and most produce wine in several price ranges. Entries in this table are counts of the respondents in each category.
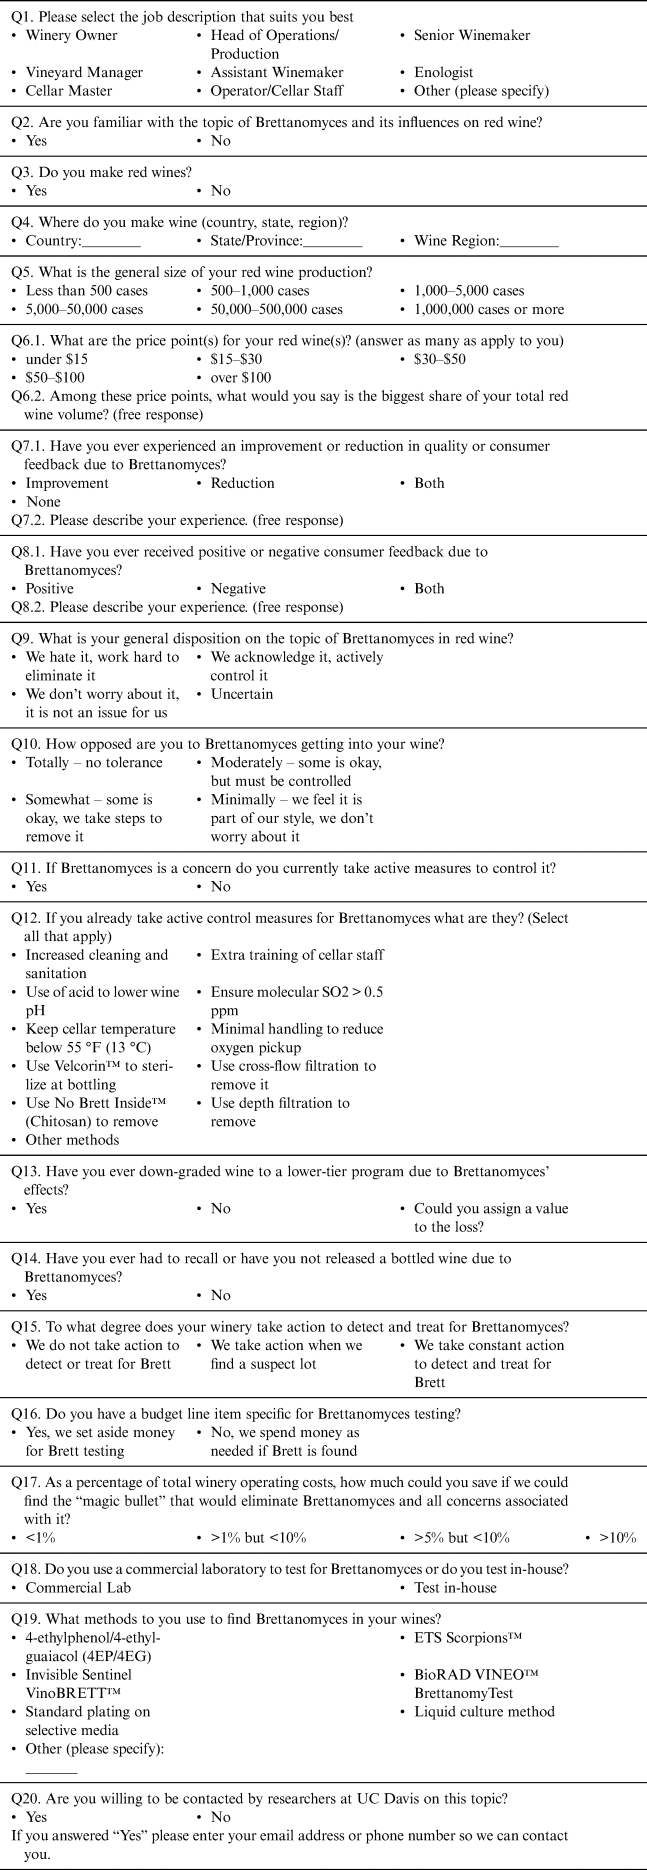
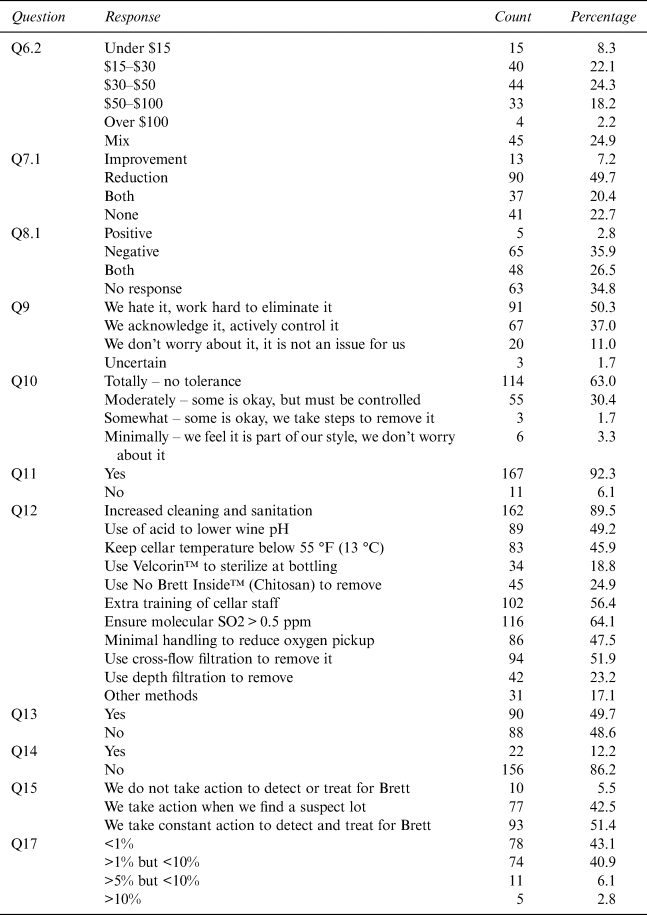
The survey yielded information about the respondents’ overall attitude to Brett, the costs incurred by wineries attributable to Brett, and the degree to which wineries control for Brett and the methods they use to do so, by winery size, location, and product price range. The complete list of survey questions and possible responses, is provided in Table 6, and Table 7 provides a summary of responses to many of the survey questions, but our detailed discussion focuses on three questions. Specifically, to gauge industry opinion and the degree to which wineries control for Brett, we examine responses to Q7, Q9, and Q10 by winery price range, size, and location: Q7 asks if survey participants have seen an improvement or reduction in wine quality, or received positive or negative consumer feedback owing to Brett; Q9 asks individuals about their sentiment towards Brett—whether they hate it and try to eliminate it, acknowledge and control it, or do not worry about it; and Q10 asks participants about their degree of opposition towards Brett in wine—if they are totally, moderately, somewhat, or minimally opposed.
Survey Questions

Selected Survey Question Responses

Notes: A total of 181 people responded to the survey. In many instances, respondents did not answer every question, and several questions allowed respondents to select several options. See Table 6 for survey questions.
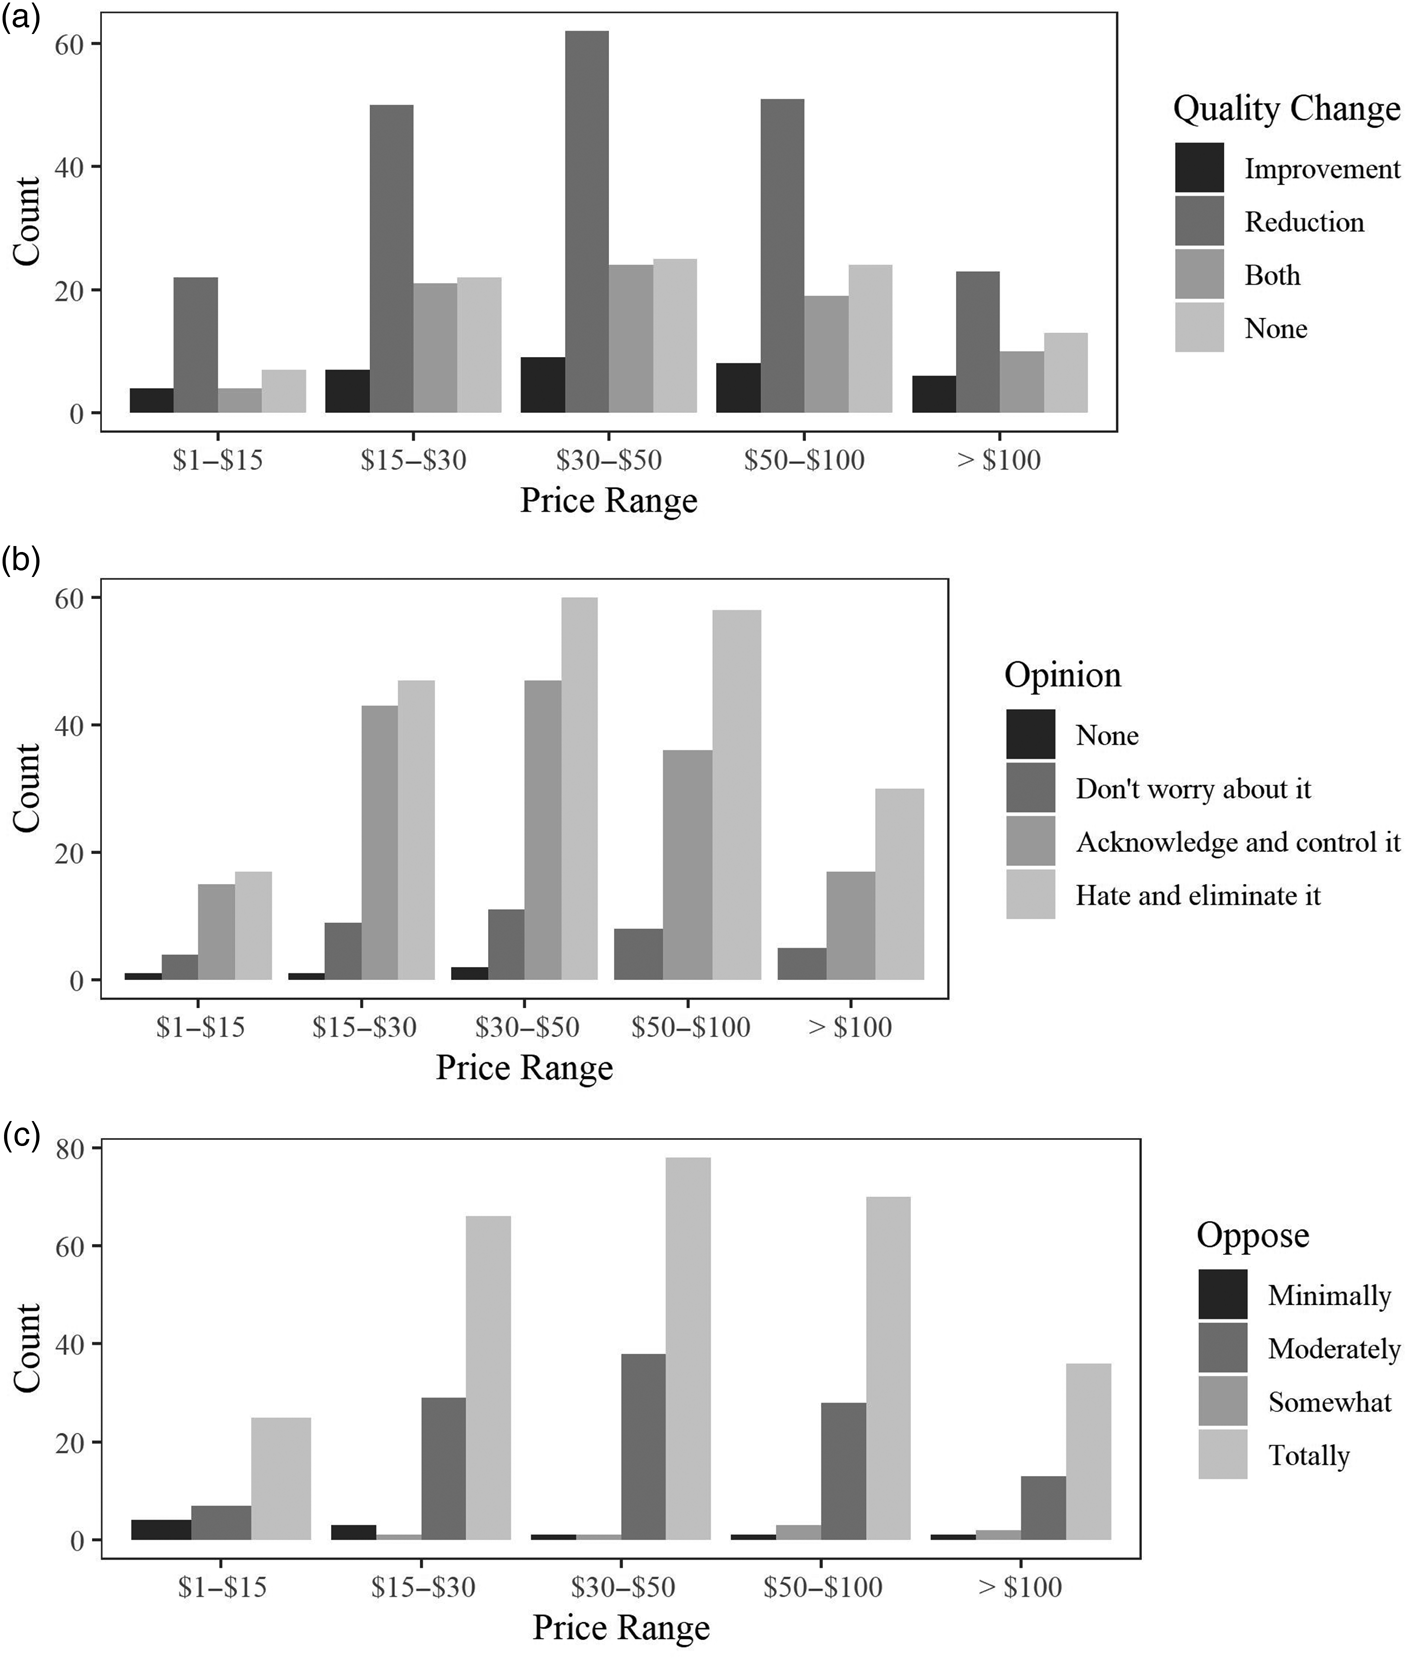
Figures 2a, 2b, and 2c display the distributions of responses for Q7, Q9, and Q10, respectively, by the price range of wine produced. Most survey participants work for wineries that produce an array of differently priced products, thus the count of observations, in Figure 2a, is significantly greater than the number of respondents. The distributions of responses to Q7 are similar across price ranges. Most frequently, individuals report having experienced a reduction in quality owing to Brett, followed (with progressively less frequency) by no change, both an improvement and a reduction, then improvement. Brett most commonly causes a reduction in quality, regardless of price.
Perceptions of Brettanomyces by Price Category

When participants are asked to indicate their disposition towards Brett, the distribution of responses seems similar across price points, as seen in Figure 2b. The ranking is the same across price points: the most frequent response was “hate and try to eliminate it,” followed progressively by “acknowledge and control it,” “do not worry about it,” and “no opinion.” While the distribution is similar across price categories, responses of “no opinion” are found only in relation to wines in the lowest three price ranges. Additionally, at higher price ranges, respondents are increasingly likely to hate and eliminate Brett compared to just acknowledging and controlling it. The distribution of responses regarding the respondents’ degree of opposition to Brett, as seen in Figure 2c, is similar across price ranges. The notable exception is that those in the lowest two price ranges are more likely to minimally oppose Brett. Across all price ranges, the most frequent response is to totally oppose Brett, followed by moderately oppose Brett. The count of respondents who minimally or somewhat oppose Brett is low.
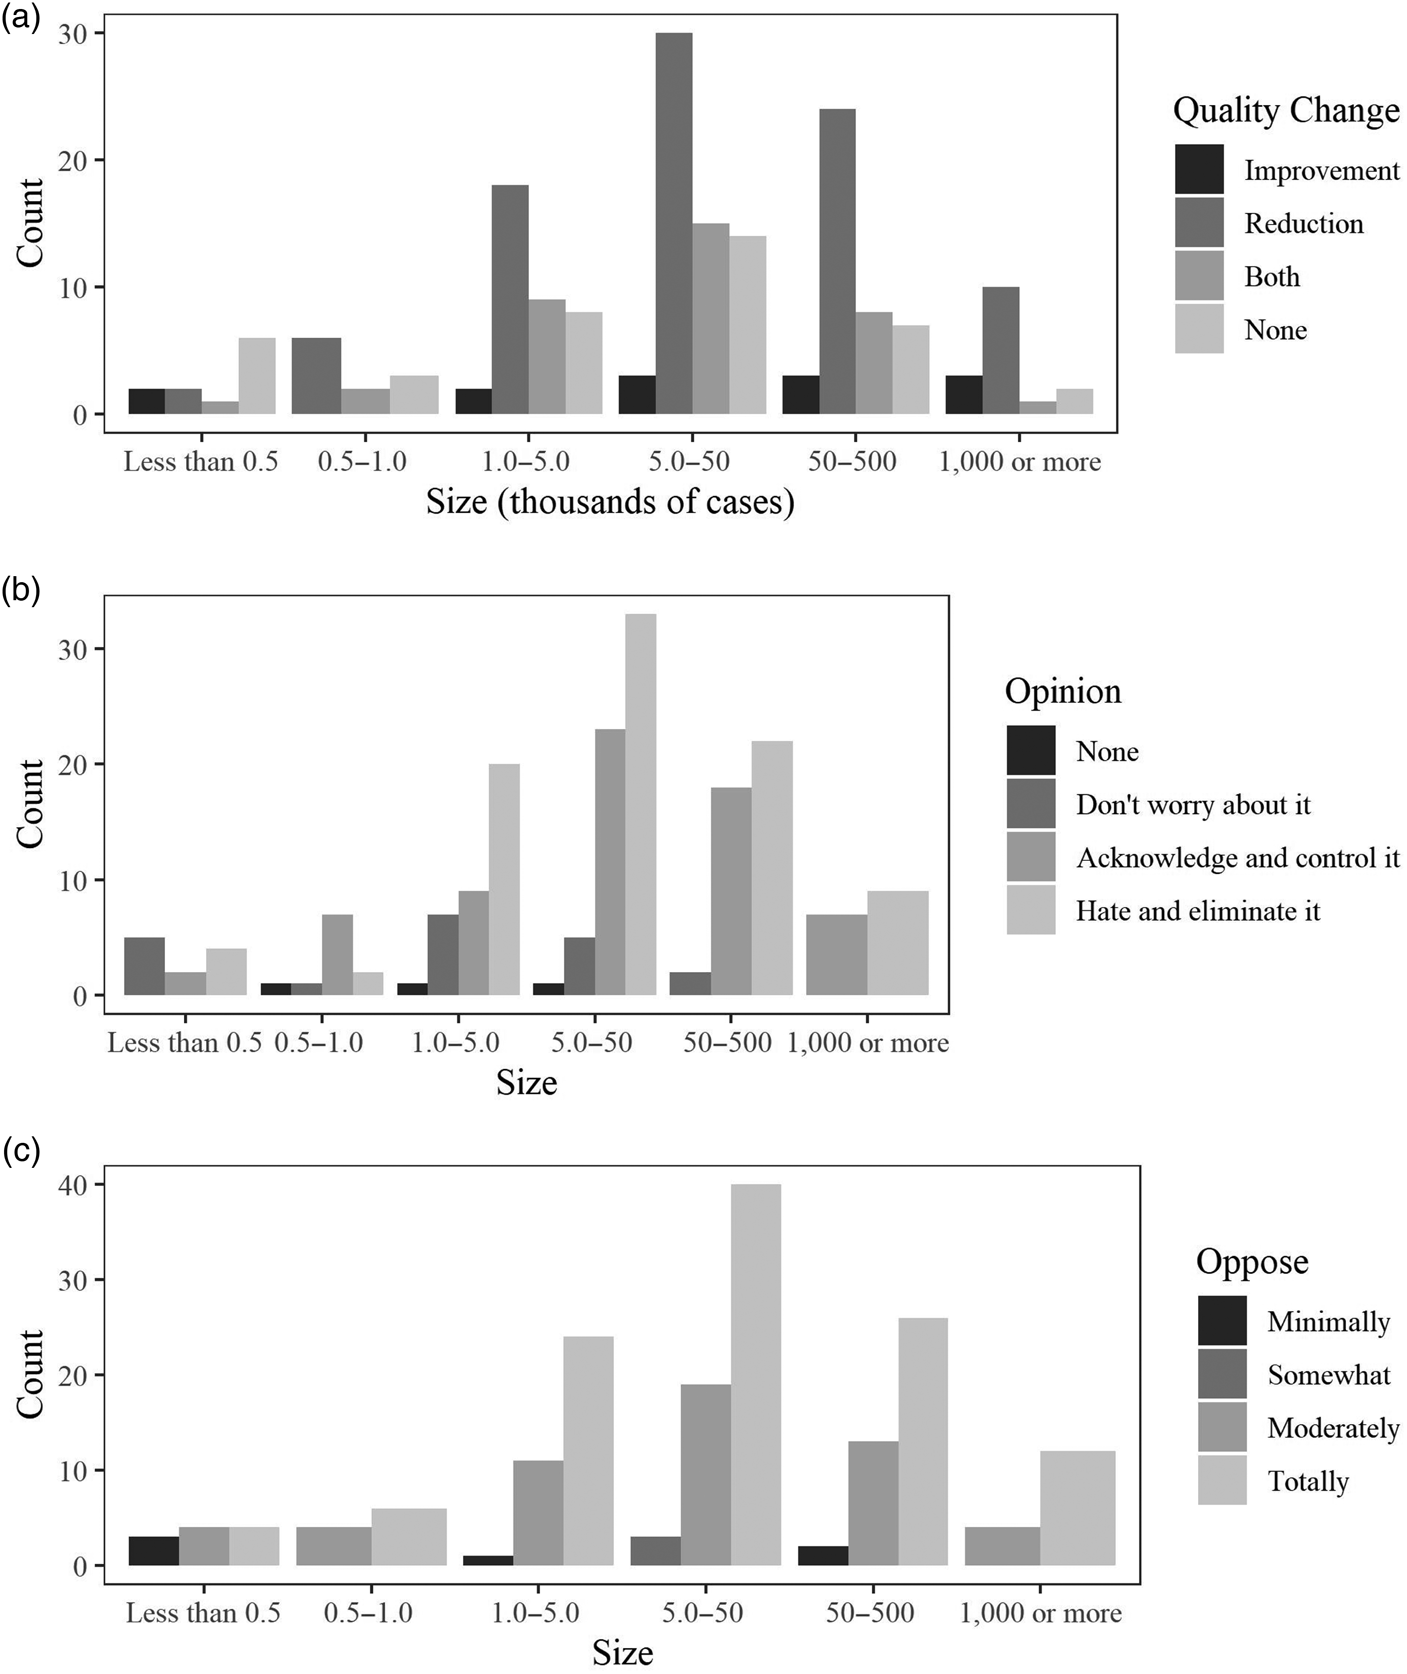
Figures 3a, 3b, and 3c chart the distribution of responses to Q7, Q9, and Q10, respectively, by the size of winery production. Figure 3a shows wineries most frequently see Brett as causing a reduction in quality, and the distribution of responses is the same for those that produce anywhere between 1,000 and 500,000 cases. Wineries are more likely to have seen Brett as causing improvements or no changes in quality if they produce more than 1,000,000 cases or less than 1,000 cases. Similarly, producers of 1,000 or fewer cases are more likely to not worry about Brett or have no opinion of it, as seen in Figure 3b. Likewise, the exceptional difference to note in Figure 3c is also with regard to the smallest producers; those that produce less than 500 cases are most likely to minimally oppose Brett.
Perceptions of Brettanomyces by Size of Production

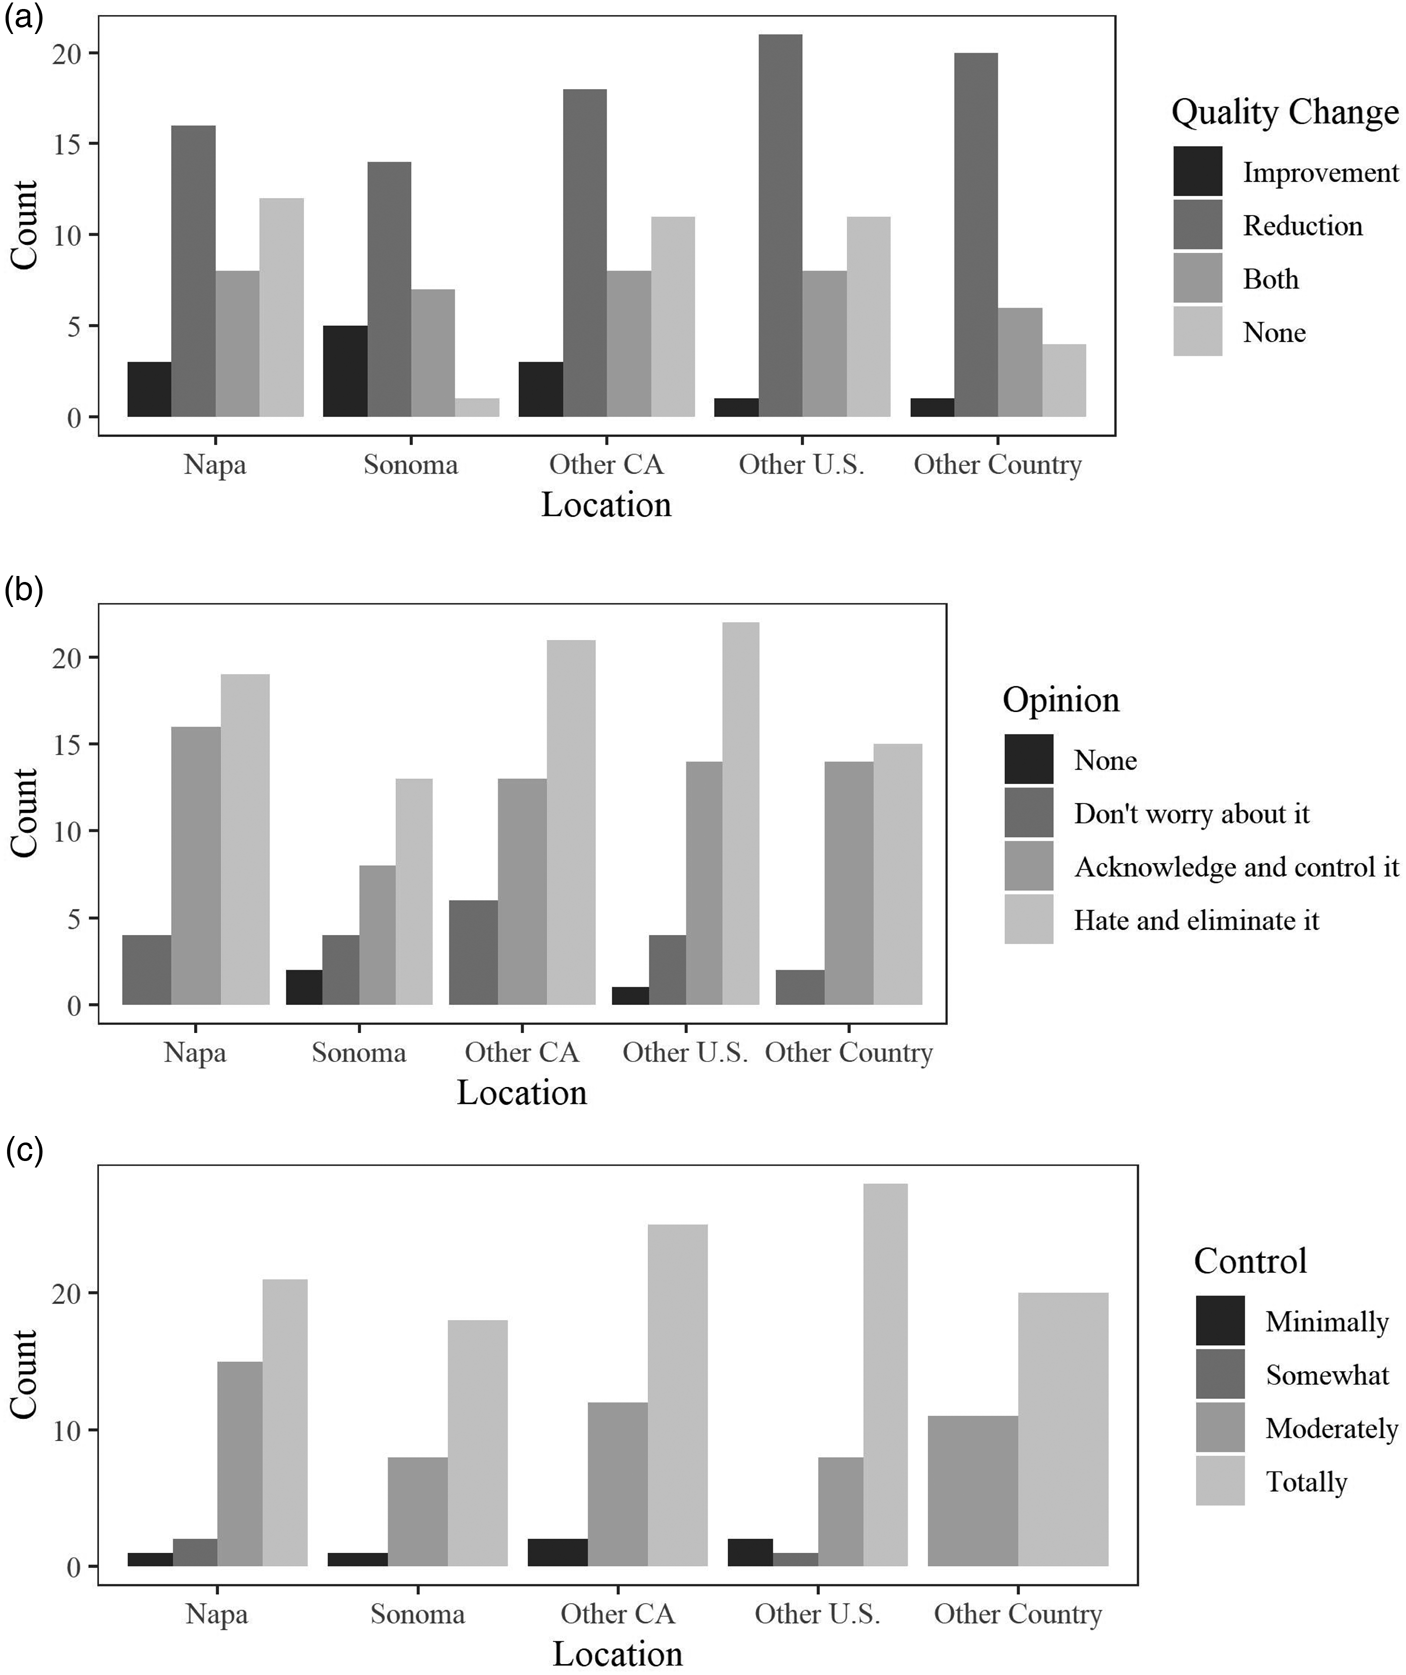
Responses for Q7, Q9, and Q10 are sorted into regions for Figures 4a, 4b, and 4c. California regions are classified as Napa, Sonoma, and “Other CA.” Outside California, responses are classified as either “Other U.S.” or “Other Country.” As seen in Figure 4a, respondents from California—particularly Sonoma—are more likely than respondents from other regions to find an improvement in quality owing to Brett. Respondents from Sonoma and Other Countries are less likely to find no changes in quality owing to Brett. Otherwise, the responses are similar across regions; respondents from all regions most commonly report negative quality changes from Brett. Figure 4a suggests that opinions on Brettanomyces are fairly consistent across regions. Other countries are slightly more likely to “acknowledge and control” Brett as opposed to “hate and control it,” but in general, respondents from all regions have an overwhelmingly negative opinion of Brett. Figure 4c shows that respondents from different parts of the United States control Brett to similar degrees, although those outside California are more likely to totally control for Brett. The most notable regional difference apparent from the figure is that no respondents from other countries minimally or only somewhat control for Brett.
Perceptions of Brettanomyces by Region

All of the figures in this section suggest that opinions on Brett do not vary greatly across winery size, price range, or location. Respondents most frequently report negative changes in quality owing to Brett, acknowledge and control Brett or hate and eliminate it, and moderately or totally control for Brett. Smaller wineries, wineries with lower-priced products, and wineries from Sonoma are slightly less concerned by Brett, but the majority of respondents that belong to these categories view Brett negatively.
V. Conclusion
Brettanomyces is a major cause of spoilage for red wine, and it is especially a concern to producers of premium red wine. Infected wine may be downgraded to a lower-value blend or entirely dumped; if spoiled wine reaches consumers, a winery may face long-term reputation costs, potentially with spillover effects to other brands from the same winery or to other wineries. Consequently, wineries incur significant costs—on the order of 0.5–5% of operating costs among our survey respondents—seeking to prevent, detect, and mitigate Brett damage.
In this study, we used detailed data from three wineries in Napa and Sonoma to estimate the value lost from downgrading wine infected with Brett for the 2013 vintage. Winery X, which takes an aggressive approach to managing Brett, incurred a loss of approximately 0.1% of its total red wine production value because of Brett. Wineries Y and Z, which take more moderate approaches to control for Brett, suffered losses of 2.0% and 1.0%, respectively, of their total production value. These losses are substantial; compared with the total value lost by Winery X, Winery Y lost $0.25 million more, and Winery Z lost $0.95 million more.
We administered a survey to industry participants to determine if our case studies are indicative of the industry in general. We find that most wineries, regardless of their target price range, production size, or location, view Brett negatively and take measures to prevent or eliminate it. Although our case studies are largely limited to premium varieties in Napa and Sonoma, the issue of Brett is certainly not.
The costs we estimated are substantial, but they only reflect losses from downgrading wine infected with Brett to a lower-value blend. Wine infected with Brett may also be dumped, or it may be recalled after bottling and distribution. We do not have access to data necessary to estimate the prevalence (and opportunity cost) of dumping wine or recalling and treating Brett-infected wine after bottling. However, examples reported by industry participants suggest that these calamities happen, and the costs can be substantial. Furthermore, as noted, spoiled wine that reaches consumers may cause negative reputation effects, leading to decreased demand for current and future vintages. These additional costs are areas for future research, but for now, our reported estimates can be interpreted as a lower bound of the cost of Brett for a winery.
As we mentioned at the outset, our study of the economics of protecting wine from Brettanomyces can be seen as a specific example of the broader issue of the economics of protecting wine quality from a range of potential sources of faults, such as cork taint or bacterial infections. In all such cases—as is also true with humans and COVID-19—an economic response is likely to entail a mixture of protective and preventive measures, as well as testing, treatment, tracing, and other damage mitigation strategies. The optimal mixture will turn on the trade-offs between costs of damage and costs of damage mitigation and prevention, which may vary considerably from case to case and situation to situation.
An optimal strategy requires understanding the biophysical processes at work and the cost-effectiveness of the different tools available, but decisions often have to be made in contexts when our knowledge of these relationships is only sketchy. The economics can be tricky when we have micro-organisms that are hard to manage, and the spatial dynamics are complex, even when we have a good understanding of the biophysical processes. In the present context we have barely uncovered the tip of the iceberg in terms of getting some measure of the importance of the problem of Brettanomyces as perceived by producers, and specifically in terms of the costs of losses in the value of wine being downgraded because of Brettanomyces in our case-study wineries. The differences in costs of damage mitigation among those three wineries—which differ significantly in this measure as well as in their approach to prevention—are indicative of the terms of the trade-off between those costs of prevention and costs of mitigation. More work remains to be done to explore more deeply the opportunity costs of risks to individual and collective reputations, and the value of emerging options for more precise and faster testing and tracing protocols.