


INTRODUCTION
Radiocarbon (14C) measurement of various marine carbonates (mostly biogenic CaCO3) greatly contributes to understanding of a variety of phenomena in oceanic and coastal environments for the period from the latest Pleistocene through Holocene to the present (e.g. global and local seawater circulations, climate and sea-level changes, coastal tectonics). For 14C measurement of CaCO3 samples using accelerator mass spectrometry (AMS), the samples are converted to CO2 gas and then to graphite, as is the case with many other types of samples. In general, there are two different methods for the conversion of CaCO3 samples to CO2: one is by hydrolysis in phosphoric acid (HPA method) and the other is by thermal decomposition frequently using an elemental analyzer (EA method; e.g. Gagnon et al. Reference Gagnon, McNichol, Donoghue, Stuart and von Reden2000; Yoneda et al. Reference Yoneda, Shibata, Tanaka, Uehiro, Morita, Uchida, Kobayashi, Kobayashi, Suzuki, Miyamoto, Hancock, Dibden and Edmonds2004; Mitsuguchi et al. Reference Mitsuguchi, Dang, Kitagawa, Yoneda and Shibata2007); the former is conventional and commonly used. The conversion from CO2 to graphite is carried out either manually by using the conventional vacuum line or automatically by using some kind of equipment (representatively, the Ionplus automated graphitization equipment: AGE; Wacker et al. Reference Wacker, Němec and Bourquin2010). Recently, a method using an elemental analyzer combined with the AGE (EA-AGE method) has been applied to some types of samples (e.g. cellulose, bone collagen) (Cersoy et al. Reference Cersoy, Zazzo, Rofes, Tresset, Zirah, Gauthier, Kaltnecker, Thil and Tisnerat-Laborde2017; Sookdeo et al. Reference Sookdeo, Wacker, Fahrni, McIntyre, Friedrich, Reinig, Nievergelt, Tegel, Kromer and Büntgen2017; Fewlass et al. Reference Fewlass, Talamo, Tuna, Fagault, Kromer, Hoffmann, Pangrazzi, Hublin and Bard2018).
In this study, we compare the EA-AGE method with the conventional HPA method for AMS 14C measurements of CaCO3 samples (IAEA C2 and corals). On the basis of our 14C measurement of pre-bomb coral skeleton collected from Chichi-jima Island of the Ogasawara Islands in the northwestern subtropical Pacific, we estimate the marine reservoir 14C-age correction (ΔR) of this region; the ΔR estimation is compared with previously reported ΔR values of this region that were obtained using shell samples (gastropods and bivalves) (Southon et al. Reference Southon, Kashgarian, Fontugne, Metivier and Yim2002; Yoneda et al. Reference Yoneda, Uno, Shibata, Suzuki, Kumamoto, Yoshida, Sasaki, Suzuki and Kawahata2007). The Ogasawara region is close to the western sub-gyre (recently called the Western Garbage Patch) within the North Pacific Subtropical Gyre (NPSG: an anticyclonic surface-water circulation over the north subtropical Pacific) (Figure 1) and is relatively important for ocean circulation studies.
Map of the low- to mid-latitude region of the North Pacific showing annual-mean surface current vectors (small arrows; velocity scale shown at upper left) and locations of Chichi-jima Island (in the Ogasawara Islands), Ishigaki Island, Okinawa Island and Kikai Island (in the Ryukyu Islands), Guam Island, Kure Atoll, French Frigate Shoals (FFS) and Hawaii Island; also shown are the North Pacific Subtropical Gyre (NPSG: large transparent clockwise arrows) and the North Pacific Subtropical Convergence Zone. There are two sub-gyres of the NPSG near the western and eastern sides of the convergence zone, which have recently been called the Western and Eastern Garbage Patches, respectively (indicated as WGP and EGP). The surface current vector data are derived from the Ocean Surface Current Analysis Real-time (NOAA’s OSCAR database; Bonjean and Lagerloef Reference Bonjean and Lagerloef2002).

MATERIALS, METHODS, AND SAMPLE LOCATIONS
For the EA-AGE method, CaCO3 samples were individually encapsulated into tin cups and thermally decomposed at ~920ºC in an elemental analyzer of Elementar vario MICRO cube, where produced CO2 was purified from other gases such as H2O, N2, NOx and SO2 by using separation columns and He carrier gas; the purified CO2 was transferred to a zeolite trap, then graphitized in the Ionplus AGE3 (hereafter, EA-AGE3 method) (Wacker et al. Reference Wacker, Němec and Bourquin2010). The graphitization was made (after removing the He carrier gas) via catalytic reduction of CO2 by hydrogen over iron powder (Vogel et al. Reference Vogel, Southon, Nelson and Brown1984); H2O formed in the graphitization was removed in a Peltier-cooled trap of the AGE3. On the other hand, for the HPA method, CaCO3 samples were individually hydrolyzed in 85% H3PO4 under vacuum in a 25ºC water bath over 12 hr; the produced CO2 was cryogenically purified from other gases and then graphitized using the conventional vacuum line. Detailed conditions for the EA-AGE3 and HPA methods are shown in Table 1. The EA-AGE3 method and the HPA method were applied to the following CaCO3 samples: (1) IAEA C2 travertine powder, (2) two fossil corals, and (3) annual bands in a modern coral core, in order to examine whether AMS 14C measurements of these samples differ significantly between the two methods.
Conditions of two methods for graphite preparation from CaCO3 samples (IAEA C2 and corals) for AMS 14C measurement at JAEA-AMS-TONO.
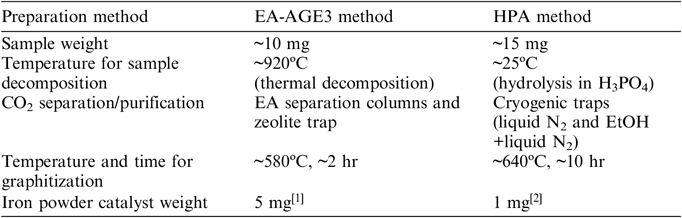
[1] Alfa Aesar Fe powder of >99% purity;
[2] Ardrich Fe powder of >99.99% purity.
From the IAEA C2 powder, replicate samples (n = 34) were taken for graphitization by the EA-AGE3 method (n = 15) and HPA method (n = 19). The two fossil coral samples (Porites sp.) were collected in January and February 1993 from mid-Holocene emerged coral reefs in Okinawa Island (26º07′N, 127º45′E) in the Ryukyu Islands, Japan (Figure 1). From each of the fossil coral samples, a rectangular-shaped sample was cut off, transferred into a glass vial, cleaned with Milli-Q water, leached with weak acid (0.05M HNO3) for dissolving ~10 wt% of each sample, cleaned again with Milli-Q water, and then dried in a vacuum desiccator at 60 °C; the cleaning and leaching steps were carried out in an ultrasonic water bath at room temperature. After these treatments, each sample was crushed and ground into powder using an agate mortar and a pestle. From each of the resultant 2 fossil coral powder samples, replicate samples (n = 6) were taken for graphitization by the EA-AGE3 method (n = 3) and HPA method (n = 3).
The modern coral core (153 cm in length and 5 cm in diameter) was collected in October 1998 by drilling a massive coral colony (Porites lutea) living in a fringing coral reef of Chichi-jima Island (27º04′N, 142º13′E) in the Ogasawara Islands (also called the Bonin Islands), Japan (Figure 1). The coral core was sliced longitudinally into 6 mm-thick slabs. The slabs were cleaned with distilled water, then air-dried and x-radiographed. The x-radiography revealed alternating bands of high and low skeletal density in the coral; the banding pattern is clear over almost all portions of the core but a little obscure in one narrow area in the upper part of the core. The high- and low-density band couplets are mostly ~10–14 mm in width, which is a typical annual growth rate of Porites coral skeletons; the total of the band couplets is 93. Thus, it was estimated that the density bands in the modern coral core represent annual growth bands of AD 1906–1998. This estimation has been supported by high-resolution measurements of δ18O (as a proxy for sea-surface temperature) along the coral’s growth axis in the upper part of the core. From the coral slabs, the 93 annual bands were cut off one by one as rectangular-shaped samples, transferred into glass vials, and subjected to the same pretreatment steps (cleaning, leaching, and crushing) as mentioned above, resulting in 93 powder samples. From the 93 powder samples (i.e. annual-band samples of 1906–1998 AD), 16 powder samples between 1931 and 1964 AD were selected and graphitized by the EA-AGE3 and/or HPA methods. Six of the 16 samples (1934–1949 AD) were graphitized by both methods (n = 1 for each method).
For AMS 14C measurements of the graphitized samples, NIST oxalic acid (HOxII) and IAEA C1 marble were used as standard materials for data calculation and background correction, respectively. Both standard materials were decomposed at ~920ºC and graphitized using the EA-AGE3 method (see Table 1) and used for the measurements of the samples prepared by the EA-AGE3 method. On the other hand, for the measurements of the samples prepared by the HPA method, the IAEA C1 was graphitized by the HPA method, and the HOxII was converted to CO2 by thermal decomposition in the presence of CuO at 500ºC (30 min) then 850ºC (2 hr) in precombusted vacuum-sealed quartz tubes, then graphitized using the conditions of the HPA method. The graphitized samples and standards were individually pressed into aluminum cathodes and measured for 14C/12C and 13C/12C ratios using a tandem Pelletron AMS system at Tono Geoscience Center, Japan Atomic Energy Agency (JAEA-AMS-TONO) (Saito-Kokubu et al. Reference Saito-Kokubu, Matsubara, Miyake, Nishizawa, Ohwaki, Nishio, Sanada and Hanaki2015).
Both of the Ogasawara Islands and the Ryukyu Islands are located in the northwestern subtropical Pacific; the north subtropical Pacific is generally dominated by the NPSG. The western boundary current of the NPSG is called the Kuroshio Current, one of the strongest/fastest currents in the world, flowing adjacent to the Ryukyu Islands but some distance from the Ogasawara Islands. The Ogasawara Islands are more than 1500 km distant from the NPSG convergence zone but relatively close to the western sub-gyre of the NPSG (recently called the Western Garbage Patch; see Figure 1).
RESULTS AND DISCUSSION
Results of AMS 14C measurements for the IAEA C2 travertine and two fossil (mid-Holocene) corals graphitized by the EA-AGE3 and HPA methods are shown in Figure 2. The mean value with standard deviation of the IAEA C2 by the HPA method (n = 19) is 41.39 ± 0.25 pMC, which may be slightly higher than the reference value of the IAEA C2 (41.14 ± 0.03 pMC). The mean value with standard deviation of the IAEA C2 by the EA-AGE3 method (n = 15) is 41.77 ± 0.50 pMC, obviously higher than the reference value. The difference in the mean value between the EA-AGE3 and HPA methods is estimated to be ~0.4 pMC. In addition, the EA-AGE3 method data are more widely scattered than the HPA method data. Statistical tests of the IAEA C2 datasets indicate significance of the difference between the EA-AGE3 and HPA methods for both the mean value (p ≈ 0.015 by a two-tailed Welch’s t-test) and standard deviation (p ≈ 0.008 by a two-tailed F-test). Similar tendencies can be observed in the results of the two fossil corals (GUSFOS1 and GUSFOS5), although the number of replicate samples is only 3 (see Figure 2; the offsets between the EA-AGE3 and HPA methods are estimated to be 0.54 pMC and 0.45 pMC for GUSFOS1 and GUSFOS5, respectively, by using the mean values). It is unlikely that similar organic-14C contaminations exist in the IAEA C2 and two fossil coral samples and cause the similar pMC increases in the EA-AGE3 method, suggesting that the pMC increases are due to some instrumental artifact. Therefore, it is concluded that, relative to the HPA method, the EA-AGE3 method tends to cause an increase of ~0.4–0.5 pMC with more widely scattered data with regard to CaCO3 samples. The exact cause of the pMC increase and more widely scattered data by the EA-AGE3 method is yet to be determined but is presumably due to 14C contamination in the EA. Our ongoing investigation suggests that the most likely cause is a memory effect of 14C in the EA; this effect seems to be more significant on CaCO3 samples. We suggest that the memory effect on CaCO3 samples could be reduced by careful optimization of conditions and procedures in the EA process as follows: (1) frequent cleaning or renewal of oxidation and reduction columns, (2) increasing the sample decomposition temperature, (3) blank operations before processing samples and standards, (4) processing samples and standards in order from lower to higher 14C concentrations (if known), and (5) increasing the number of blanks between samples/standards.
Comparison of AMS 14C measurements (pMC) between two different methods of graphite preparation (the EA-AGE3 method and the HPA method) for three CaCO3 samples: (a) IAEA C2 travertine (reference value: 41.14 ± 0.03% shown as horizontal red thick line) and two mid-Holocene corals (b) GUSFOS1 and (c) GUSFOS5 both from Okinawa Island (see Figure 1). Error bars represent 1σ uncertainties; horizontal red dashed lines indicate the mean of each dataset. (Please see electronic version for color figures.)

All results of the Ogasawara coral 14C measurements obtained by the EA-AGE3 and HPA methods are shown in Tables 2 and 3, respectively, where 14C data are expressed as pMC, age-corrected Δ14C and conventional 14C age (Stuiver and Polach Reference Stuiver and Polach1977; Reimer et al. Reference Reimer, Brown and Reimer2004; Stenström et al. Reference Stenström, Skog, Georgiadou, Genberg and Johansson2011). The age-corrected Δ14C value corresponds to the Δ value defined by Stuiver and Polach (Reference Stuiver and Polach1977). The Ogasawara coral Δ14C data obtained by the EA-AGE3 method shows a remarkable increase from 1959 onwards, which is undoubtedly due to the large-scale nuclear tests mainly conducted in the atmosphere during the late 1950s to early 1960s. The remarkable Δ14C increase of the Ogasawara coral is in good agreement with other coral Δ14C records of the tropical/subtropical northwestern Pacific (Figure 3) and the north-central Pacific (Figure 4) (i.e. along and within the NPSG; see Figure 1). The vast Δ14C increase (up to 640 ‰) recorded in Guam coral during 1954–1955 (Andrews et al. Reference Andrews, Asami, Iryu, Kobayashi and Camacho2016b) does not appear in the Ogasawara coral Δ14C record of 1955. In the current study, 14C measurements were not performed for the Ogasawara coral annual bands of 1956 and 1957 when short-term significant Δ14C increases are recorded in Okinawa, Guam and Ishigaki corals (Konishi et al. Reference Konishi, Tanaka and Sakanoue1982; Andrews et al. Reference Andrews, Asami, Iryu, Kobayashi and Camacho2016b; Hirabayashi et al. Reference Hirabayashi, Yokoyama, Suzuki, Miyairi and Aze2017b).
EA-AGE3 method: 14C measurements of AD 1934–1964 annual bands in a coral core from Chichi-jima Island of the Ogasawara Islands and calculation of marine reservoir 14C-age correction (ΔR) of this region.

Each of the errors means 1 σ.
[1] The marine-modeled 14C ages are based on the Marine13 calibration curve of Reimer et al. (Reference Reimer, Bard, Bayliss, Beck, Blackwell, Bronk Ramsey, Buck, Cheng, Edwards, Friedrich, Grootes, Guilderson, Haflidason, Hajdas, Hatté, Heaton, Hoffmann, Hogg, Hughen, Kaiser, Kromer, Manning, Niu, Reimer, Richards, Scott, Southon, Staff, Turney and van der Plicht2013).
HPA method: 14C measurements of AD 1931–1949 annual bands in a coral core from Chichi-jima Island of the Ogasawara Islands and calculation of marine reservoir 14C-age correction (ΔR) of this region.

Each of the errors means 1 σ.
[1] The marine-modeled 14C ages are based on the Marine13 calibration curve of Reimer et al. (Reference Reimer, Bard, Bayliss, Beck, Blackwell, Bronk Ramsey, Buck, Cheng, Edwards, Friedrich, Grootes, Guilderson, Haflidason, Hajdas, Hatté, Heaton, Hoffmann, Hogg, Hughen, Kaiser, Kromer, Manning, Niu, Reimer, Richards, Scott, Southon, Staff, Turney and van der Plicht2013).
Comparison of Δ14C records of a modern annually banded coral sample from Ogasawara Islands (Chichi-jima Island) obtained by the EA-AGE3 and HPA methods in this study with other coral Δ14C records from the western tropical/subtropical Pacific: Okinawa Island (Konishi et al. Reference Konishi, Tanaka and Sakanoue1982), Ishigaki Island (Hirabayashi et al. Reference Hirabayashi, Yokoyama, Suzuki, Miyairi and Aze2017a, Reference Hirabayashi, Yokoyama, Suzuki, Miyairi and Aze2017b), Kikai Island (Hirabayashi et al. Reference Hirabayashi, Yokoyama, Suzuki, Miyairi and Aze2017a), and Guam Island (Andrews et al. Reference Andrews, Asami, Iryu, Kobayashi and Camacho2016b). Locations of these coral records are shown in Figure 1. Error bars represent 1σ uncertainties. For visual clarity, error bars are not shown for the high-resolution Δ14C records of Andrews et al. (Reference Andrews, Asami, Iryu, Kobayashi and Camacho2016b) and Hirabayashi et al. (Reference Hirabayashi, Yokoyama, Suzuki, Miyairi and Aze2017b).

Comparison of Δ14C records of a modern annually banded coral sample from Ogasawara Islands (Chichi-jima Island) obtained by the EA-AGE3 and HPA methods in this study with other coral Δ14C records from the north-central Pacific: Kure Atoll (Andrews et al. Reference Andrews, Siciliano, Potts, DeMartini and Covarrubias2016a), French Frigate Shoals (Druffel Reference Druffel1987), Hawaii Island (Druffel et al. Reference Druffel, Griffin, Guilderson, Kashgarian, Southon and Schrag2001). Locations of these coral records are shown in Figure 1. Error bars represent 1σ uncertainties. For visual clarity, error bars are not shown for the high-resolution Δ14C record of Andrews et al. (Reference Andrews, Siciliano, Potts, DeMartini and Covarrubias2016a).

The Ogasawara coral Δ14C data of 1934, 1937, 1940, 1943, 1946, and 1949 were obtained by both the EA-AGE3 and HPA methods, where the errors of the HPA-method data were significantly smaller than those of the EA-AGE3-method data (see Tables 2 and 3). The 0.4–0.5 pMC offset (4–5‰ offset in Δ14C) between the EA-AGE3 and HPA methods detected in the replicate tests for the IAEA C2 and fossil corals (see Figure 2) does not appear clearly in the Ogasawara coral Δ14C data. The EA-AGE3-method Δ14C data during 1937–1946 exhibit a significant fluctuation with peak-to-peak amplitudes of ~20–30‰; whereas the HPA-method Δ14C data do not show such a fluctuation but have a range of only 11.5‰ over the period of 1931–1949. The larger fluctuation of the EA-AGE3-method Δ14C data can be ascribed to the present instrumental conditions of this method generating relatively scattered data. The HPA-method Δ14C data seem to be in better agreement with the coral Δ14C records of the NPSG region (see Figures 3 and 4). Considering these and the IAEA C2 results, the Δ14C data obtained by the HPA method are more reliable than those obtained by the EA-AGE3 method.
The Ogasawara coral 14C data of 1931–1949 were used to estimate marine reservoir correction (ΔR) of this region, by using the equation ΔR = [Coral 14C age] – [Marine modeled 14C age] (see Tables 2 and 3). The marine modeled 14C ages are based on the Marine13 calibration curve of Reimer et al. (Reference Reimer, Bard, Bayliss, Beck, Blackwell, Bronk Ramsey, Buck, Cheng, Edwards, Friedrich, Grootes, Guilderson, Haflidason, Hajdas, Hatté, Heaton, Hoffmann, Hogg, Hughen, Kaiser, Kromer, Manning, Niu, Reimer, Richards, Scott, Southon, Staff, Turney and van der Plicht2013). The ΔR value of the Ogasawara Islands estimated from the more reliable HPA-method data (Table 3) ranges from –109 yr to –28 yr with the mean value with standard deviation of –81 ± 29 yr. This estimation is an intermediate between previously published ΔR estimations by Southon et al. (Reference Southon, Kashgarian, Fontugne, Metivier and Yim2002) [–169 ± 64 yr from 1 gastropod shell collected alive in 1884] and Yoneda et al. (Reference Yoneda, Uno, Shibata, Suzuki, Kumamoto, Yoshida, Sasaki, Suzuki and Kawahata2007) [–63 ± 39 yr to 66 ± 38 yr from 10 bivalve and 1 gastropod shells collected alive in 1887–1894]. In these previous studies, the gastropod and bivalve shells were provided from museum collections, and a portion including the outer growing edge of each shell was cut and used for 14C measurement, which is clearly different from our method using coral annual bands. Gastropods and bivalves are most likely to be directly influenced by bottom waters and sediments, whereas large massive corals such as used in the current study are less affected by bottom environments (in some cases, rather influenced by sea-surface environments). It is likely that food intake and carbon metabolism differ significantly between gastropods, bivalves, and corals. We suggest that these environmental and metabolic differences may cause the above-mentioned ΔR variability (–169 yr to 66 yr) in the Ogasawara Islands.
ACKNOWLEDGMENTS
We thank Akiomi Shimada, Nobuhisa Ogata, and the staff of the JAEA-AMS-TONO for their support of this study. Thanks are also expressed to two anonymous reviewers for their useful comments and suggestions on the manuscript.



