Introduction
Interstratification in phyllosilicates has been a recognized aspect of clay mineralogy since it was first documented by Gruner (Reference Gruner1934). Distinct from a physical mixture, different interstratified component layers stack along the Z direction to create domains that diffract more or less coherently. Modeling of X-ray diffraction profiles from interstratified phyllosilicates began with Hendricks & Teller (Reference Hendricks and Teller1942), and important contributions were made by Méring (Reference Méring1949), MacEwan (Reference MacEwan1958), Reynolds (Reference Reynolds1967), Drits & Sakharov (Reference Drits and Sakharov1976), Plançon (Reference Plançon1981), Bethke & Reynolds (Reference Bethke and Reynolds1986), Treacy et al. (Reference Treacy, Newsam and Deem1991), and Drits et al. (Reference Drits, Sakharov, Lindgreen and Salyn1997). Several software packages such as NEWMOD© (Reynolds Reference Reynolds1985), DIFFaX (Treacy et al. Reference Treacy, Newsam and Deem1991), DIFFaX+ (Leoni et al. Reference Leoni, Gualtieri and Roveri2004), and Sybilla (Aplin et al. Reference Aplin, Matenaar, McCarty and van der Pluijm2006) have been developed to simulate diffraction from these systems. NEWMOD+, an entirely new version of NEWMOD©, was developed by Yuan & Bish (Reference Yuan and Bish2010a) by incorporating recent advances in the knowledge of crystal structures into a user-friendly graphical interface. With these computer programs, investigators have been able to obtain structure information through fitting an experimental pattern with a simulated pattern by manually modifying input parameters to the simulation. Structure information includes component proportions and ordering state (Reichweite value), as well as crystallite size and size distribution. These parameters are difficult or impossible to obtain using other analytical methods.
Automated XRD profile fitting for two-component interstratified phyllosilicates was achieved with the application of the downhill simplex method (Nelder–Mead method) (Yuan & Bish Reference Yuan and Bish2010b), and it was further extended to multiple-component phyllosilicate systems containing one or more interstratified phases (Yuan & Bish Reference Yuan, Bish and Bish2011). However, automated profile fitting based on a NEWMOD©-like architecture experienced deterioration in fitting efficiency as the number of phases increased. In principle, profile fitting is done through minimization of the discrepancies between measured and calculated profiles by iteratively optimizing the parameter values in the model. During each iteration, the diffraction profile of each phase (either interstratified or non-interstratified) is recalculated using a new set of parameter values determined by a minimization technique such as the downhill simplex method. These profiles from individual phases are then summed in different proportions to create a single profile that is compared with the measured profile. Consequently, as more phases are included in profile fitting, calculation of the profile containing all diffraction contributions from each phase requires increasing time. Additionally, the number of fitting parameters increases as more phases are included in the profile-fitting calculation, and typically more iterations are required for the minimization routine to yield a minimum. Therefore, fitting efficiency depends heavily on the average time to calculate a profile from each phase.
XRD modeling of interstratified systems typically involves a combination of the Fourier series form of the Laue interference function that can accommodate different layer types and a statistical description of the arrangement of different layers. A recursive algorithm was developed, by Bethke & Reynolds (Reference Bethke and Reynolds1986), which can calculate the frequency factors that correspond to different layer pairs, namely AA, AB, and BB for a two-component, A and B, interstratified system. This approach was later employed in the NEWMOD© architecture in which the frequency factors are calculated separately before summation of the Fourier series of the interference function. In contrast to the NEWMOD© architecture, the matrix methodology developed by Kakinoki & Komura (Reference Kakinoki and Komura1965) integrates the calculation of frequency factors into the Fourier series summation, which is conducted through recursive matrix multiplication. As a result, the matrix methodology is considered more time efficient than the NEWMOD© architecture (Reynolds Reference Reynolds, Bish and Post1989; Drits & Tchoubar Reference Drits and Tchoubar1990). The matrix methodology is preferred over the NEWMOD© approach when speed is critical, as in automated profile-fitting applications. The intensity calculation in the matrix methodology typically involves matrix inversion, however, which requires special treatment (discussed in detail in the next section). A new approach is proposed here that does not require calculation of the inverse matrix, and this modified matrix method provides a gain in performance which is up to a factor of three times better than the previous approach. The program ClayStrat was developed based on this modified matrix methodology.
Materials and Methods
Matrix Methodology
The matrix methodology was first developed by Hendricks & Teller (Reference Hendricks and Teller1942) and was later extended by other researchers (Kakinoki & Komura Reference Kakinoki and Komura1965; Plançon & Tchoubar Reference Plançon and Tchoubar1976; Plançon Reference Plançon1981) to simulate 00l reflection profiles. Drits & Tchoubar (Reference Drits and Tchoubar1990) reviewed the matrix methodology extensively, and most of the terminology and definitions in the discussion below were taken from their book. Interested readers can refer to Drits & Tchoubar (Reference Drits and Tchoubar1990) for detailed derivations of equations.
Consider an interstratified crystallite composed of g layers (different in layer structure factor) with M stacking layers; the intensity along Z diffracted by this crystallite (i.e. the one-dimensional diffraction pattern) is given as (Drits & Tchoubar Reference Drits and Tchoubar1990):

where
 is the scattering vector with
 in which θ is the diffraction angle and λ is the X-ray wavelength, and Ω and σ are the area of the unit cell in the XY plane and the area of the diffracting layer, respectively. [W], [Φ], and [Q] are in the form of a square matrix, and [Φ] and [Q] are complex matrices. [W] is a diagonal g × g matrix containing the proportion of different layers, and the elements of [Φ] are the product of
 , in which Φ
i
is the layer structure factor of the i
th layer and
 is the conjugate of the layer factor of the j
th layer. The elements in matrix [Q] describe the translations between n
th nearest layers with different probabilities. Tr and Re refer to the trace of the matrix and the real part of the complex number, respectively. Eq. 1 calculates the diffracted intensities in a recursive way in which the translations between n
th nearest layers can be determined by multiplying [Q]
n-1
by [Q]. The summation
 was carried out by noting that
 is the summation of the geometrical series (Kakinoki & Komura Reference Kakinoki and Komura1952), resulting in the following expression:

where

This summation has been widely used by various researchers (Plançon & Tchoubar Reference Plançon and Tchoubar1977; Drits & Tchoubar Reference Drits and Tchoubar1990; Treacy et al. Reference Treacy, Newsam and Deem1991). Considering the fact that powder diffraction samples generally contain crystallites with different sizes in different proportions, the total diffracted intensity is

 , where α(M) is the proportion of M-layer crystallites in the sample, and minN and maxN refer to the minimum and maximum sizes of the crystallites, respectively.
The average intensity from a single layer can then be calculated as

where
 is the average size of crystallites along the Z direction in the sample (Reynolds Reference Reynolds, Reynolds and Walker1993). Equation 3 involves calculating the inverse complex-matrix ([I] − [Q])–1, and consequently special treatment is required to avoid division by zero when det([I] − [Q]) = 0 (Kakinoki & Komura Reference Kakinoki and Komura1965; Treacy et al. Reference Treacy, Newsam and Deem1991). Here, a new approach is proposed to sum all intensities from crystallites with a distribution in size without involving matrix inversion. This approach involves calculating the total intensity by introducing the size distribution directly into Eq. 1

The summation of the second term can be rewritten as:

where
 refers to the sum of the probability of n
th nearest neighbors in the entire powder (multi-crystallite) sample, and this quantity can be calculated and stored in a vector prior to the calculation of
 at every point of
 . Thus, the average intensity is

This approach does not involve the inverse matrix and hence: (1) it requires no special treatment when det([I] − [Q]) = 0; and (2) more importantly, it is significantly more efficient by eliminating matrix inversion and multiplication, both of which have a typical computation complexity of O(n 3) for a square matrix.
Mineral-structure Description
Simulating XRD profiles from interstratified phyllosilicates (or any layer-structure material) requires pre-defined structures including unit-cell parameters and the position and concentration (site occupancy) of each atom type for each layer type. Quantitative analysis by fitting a simulated profile to a measured profile implicitly assumes that the structure model used is representative of the phyllosilicate in the sample. However, this assumption may not always be valid or accurate when using structures that are built into the program (e.g. the NEWMOD© program). The chemical composition of a sample, in particular for smectite and chlorite, can vary greatly, and atomic positions and site occupancies can also vary among samples. Chemical variations in a sample can be accommodated by modifying the nature and concentration of element(s) in individual sites so that the overall scattering power from the model and the sample are similar (Reynolds Reference Reynolds1985). However, this method of modeling substitutions can introduce significant errors in simulated intensities at middle to high diffraction angles (Yuan & Bish Reference Yuan and Bish2010a). Moreover, as crystal structures are compiled into a program, users have only a limited capability to modify the structures, and changing the atomic positions and concentrations or introducing new structures such as layered double hydroxides (LDH), is often difficult. In light of these limits, the ClayStrat program has been configured to allow users to define the crystal structure in an ASCII text file with a simple format (Appendix A.1). The structure file contains the unit-cell parameters and the names, types (scattering factor), site occupancies, and positions of each atomic/molecular type. Atomic positions can be specified as a fixed distance along a direction in angstroms, as the fraction of a unit-cell repeat, or as a combination of these two. In addition, the structure file contains information that describes constraints among atoms in terms of site multiplicities and positions. For example, several different cations (e.g. Fe and Al) can be present in the octahedral sheet, but the total number of cations is generally equal to two in a dioctahedral smectite. The structure file also specifies which properties of each atom (e.g. site multiplicity, position) can be adjusted later in the ClayStrat graphical-user-interface (GUI) window. The atomic scattering factor for a given element is approximated in ClayStrat using the nine-parameter formulation of Cromer and Waber (Reference Cromer and Waber1965), using coefficients from the International Tables for X-ray Crystallography, Volume IV (1974). It is also possible to include neutron scattering cross sections to allow simulation of neutron powder diffraction patterns.
Results and Discussion
Performance
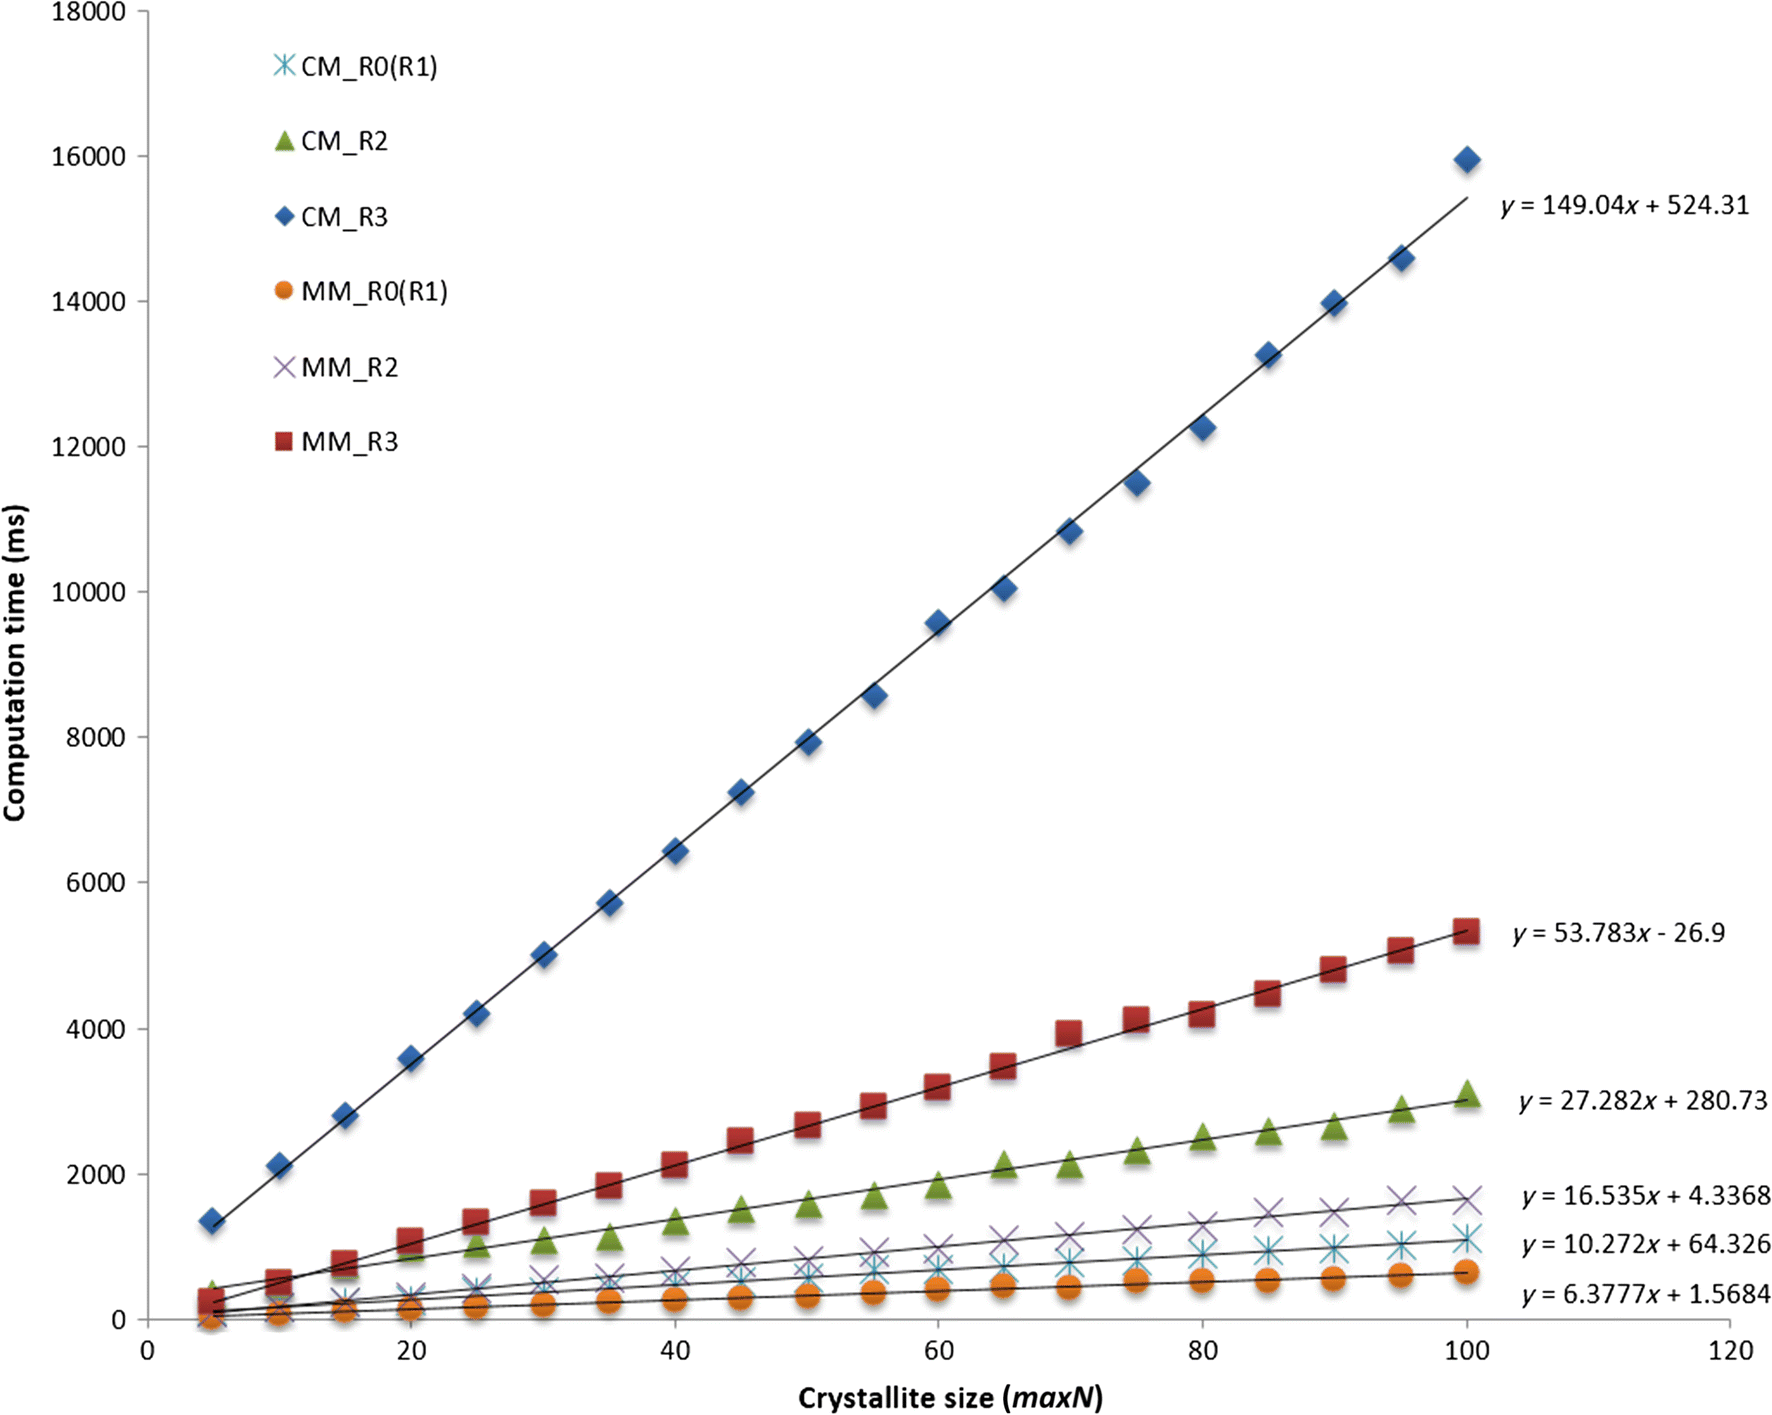
The recursive nature of the matrix methodology shown in Eq. 1 suggests that the average computational time will be controlled mainly by two factors, namely the dimension of matrices and the size of crystallites. The dimension of matrices varies with the range of ordering, typically described by the Reichweite value (R). The dimensions of matrices in a two-component interstratified system are (2 × 2), (4 × 4), and (8 × 8), corresponding to R0 (or R1), R2, and R3, respectively. To distinguish between Eq. 5 and Eq. 8, Eq. 5 is referred to as the conventional matrix method (CM) and Eq. 8 is referred to as the modified matrix method (MM) in the discussion below. Tests were performed to evaluate the computational efficiency of the matrix methodology as a function of crystallite size for different Reichweite values, i.e. different matrix dimensions based on Eq. 5 and Eq. 8. The computer code was written and compiled under Visual C++. The crystallite size used in the calculation is controlled by varying the variables minN and maxN, the minimum and maximum crystallite size, respectively, as defined previously. The variable minN was fixed at a value of 1 and maxN was varied from 5 to 100, with an increment of 5 in the calculations. Crystallites with different sizes were assumed to occur with the same probability; this assumption does not affect the performance evaluation. A 2θ range of 2 to 50° was used, with an increment of 0.002°2θ, giving 24,000 data points per calculation. Although this increment is unusually small, this value and the large quantity of data produced ensure consistent determination of calculation time for different crystallite sizes by effectively reducing the random oscillation of CPU computational power due to other operations running on the computer. In order to focus on the difference in summation efficiency between the CM and the MM, all elements in the matrix [Φ] were set to 1, i.e. no calculation of structure factors was involved. The computation time for different Reichweite values (Fig. 1) varied linearly with maximum crystallite size, maxN, and this relationship can be understood from Eq. 1, in which the increment of maxN by 1, i.e. M+1, results in one additional term in the summation Tr{[Φ][W][Q] M − 1}, ignoring the difference in the frequency term (M-n). As mentioned above, the matrix [Q] M − 1 can be calculated easily by multiplying [Q] by [Q] M − 2, which was calculated previously. Therefore, the required calculation time is due primarily to the matrix multiplication operation, whose computation complexity is O(n 3), where n is the dimension of the square matrix. The difference between the slopes shown in Fig. 1 reflects this computational complexity although it does not strictly obey the relation O(n 3) due to additional operations such as matrix addition and/or subtraction involved in the CM and the MM.
Required computation time for CM and MM calculations shown as a function of crystallite size (maxN); the difference between slopes is due to the different matrix sizes

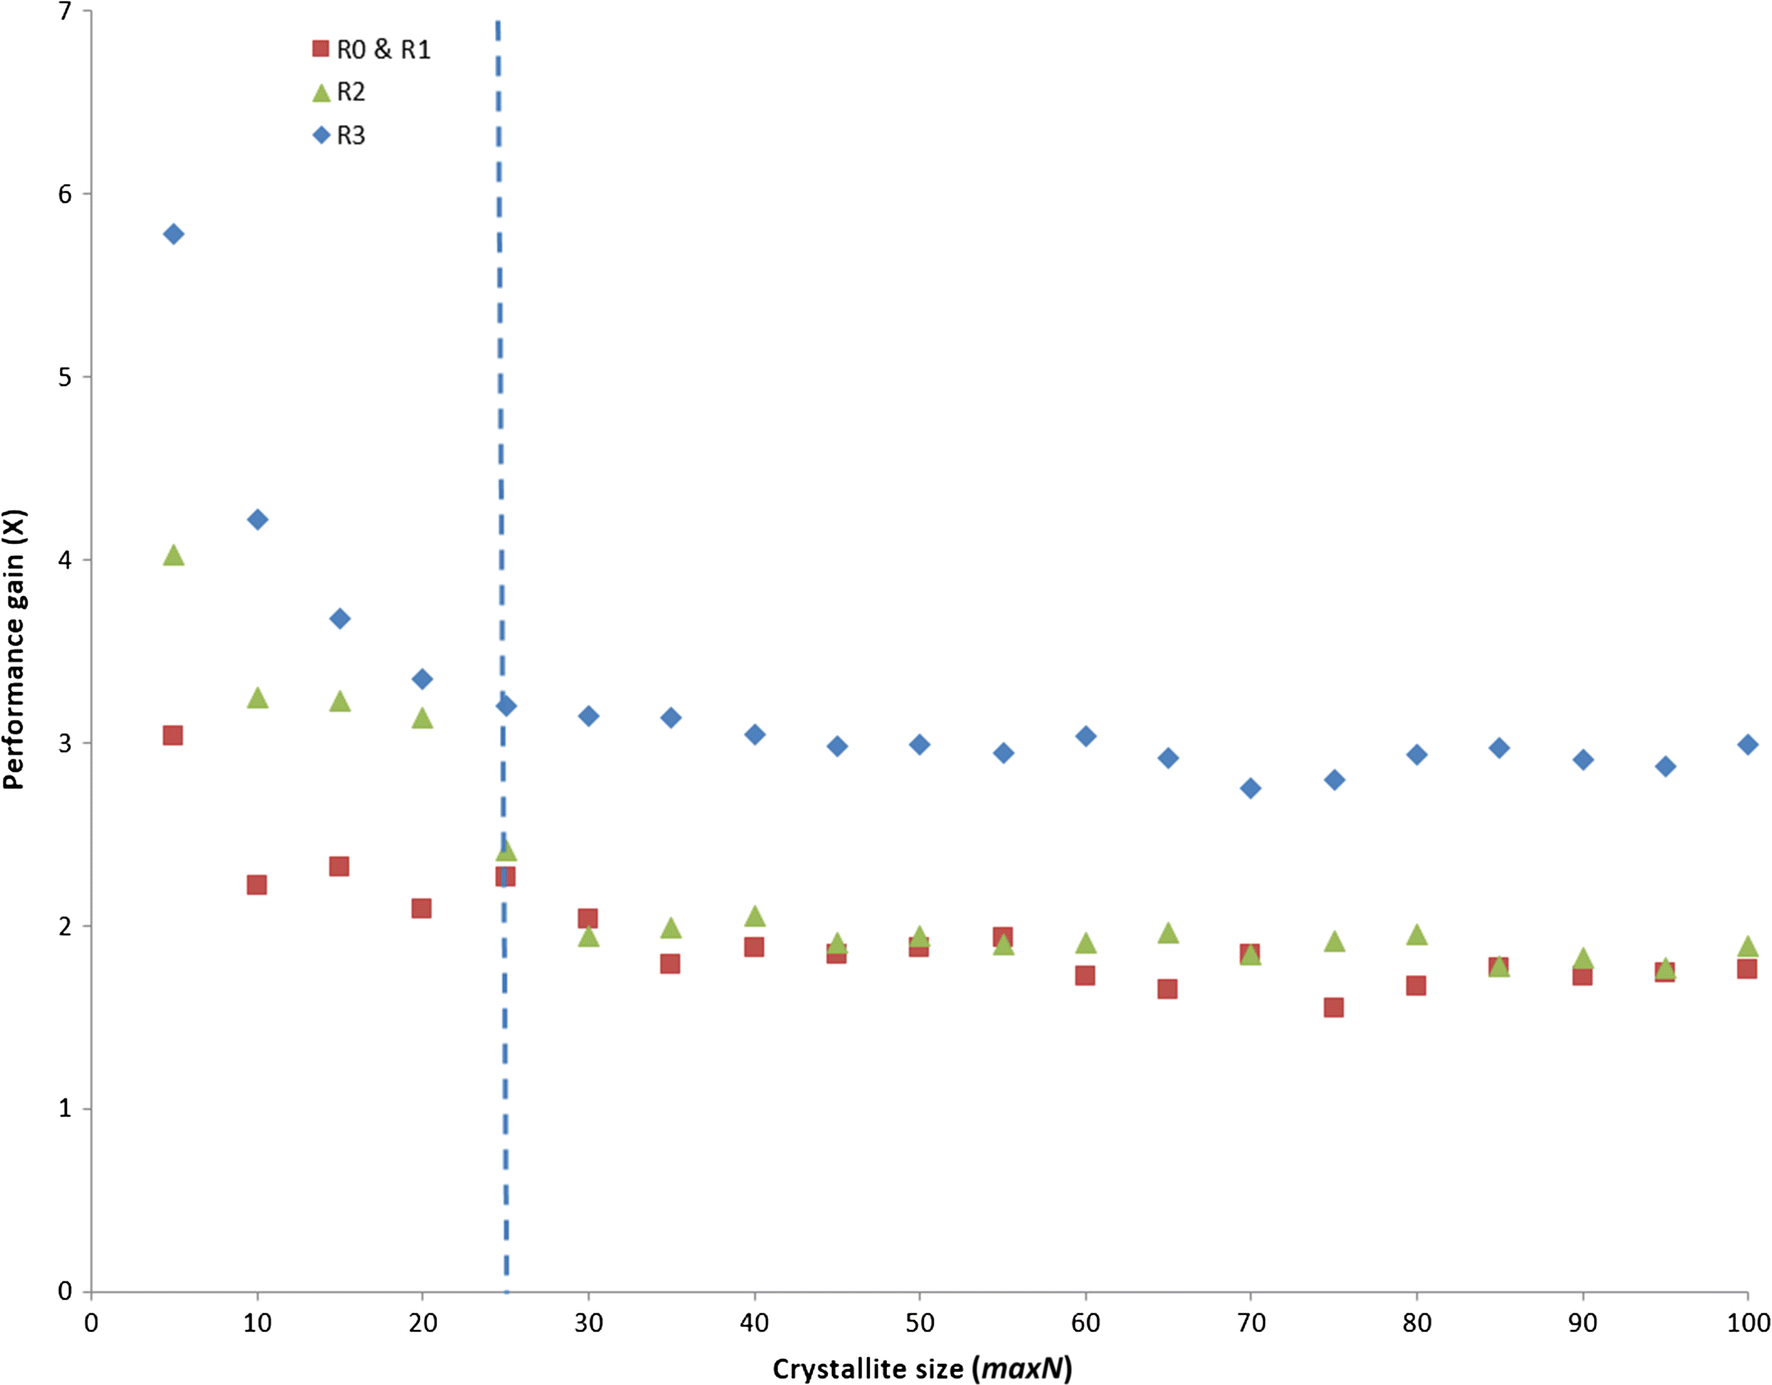
The performance gain provided by the MM over the CM was measured by dividing the calculation time using the CM by the calculation time using the MM on a point-by-point basis (Fig. 2). Overall, the MM was more than twice as fast as the CM, and the improvement in performance was even greater for relatively small crystallite sizes (<25, which is more typical for real samples). As the crystallite size increases, the performance gain approaches a constant factor of two for R1 and R2 interstratifications and three for R3 systems. Comparison between the CM and the MM suggests that more matrix operations are involved in the CM, more specifically, matrix operations involved in the CM are one matrix inversion with ([I] − [Q])-1; four matrix multiplications [Q]([I] − [Q])-1, ([I] − [Q])-2, [Q]
M+1 and ([Q]
M+1 - [Q])([I] − [Q])-2; two matrix subtractions [I] − [Q] and [Q]
M+1 – [Q]; and one matrix addition
 . For each 2θ value, the matrix inversion ([I] − [Q])-1, the first two matrix multiplications [Q]([I] − [Q])-1 and ([I] − [Q])-2, and the first matrix subtraction [I] − [Q] are performed only once. However, the last two matrix multiplications, [Q]
M+1 and ([Q]
M+1 – [Q])([I] − [Q])–2, and the matrix addition
 are repeated for each crystallite size M. In contrast to the CM method, the MM method has only one matrix multiplication[Q]
n
. When the crystallite size is small, the computation time required for the one-time calculation of matrix inversion and matrix multiplication is comparable to the computation time for matrix multiplication associated with crystallite size M. The performance gain for the MM over the CM method is, therefore, even greater for small crystallite sizes. As the crystallite size becomes increasingly larger, the computation time for matrix multiplications [Q]
M+1 and ([Q]
M+1 – [Q])([I] − [Q])–2 prevails and the performance gain stabilizes at a factor of two. The factor of two comes from the fact that two matrix multiplications are involved in the CM compared with only one matrix multiplication in the MM. Interestingly, the MM achieved a 3× performance gain for the R3 simulation, distinct from the R1 and R2 simulations. This difference may be related to the manner in which the Windows operating system accesses values in the matrix because the same performance gain was obtained using Matlab, which is computationally quite different from Visual C++.
Improvement in computational efficiency of the MM compared with the CM (plotted as ‘Performance gain’) as a function of crystallite size for interstratified kaolinite/kaolinite. Red squares represent R0 and R1 interstratifications; green triangles represent R2 interstratifications; and blue diamonds represent R3 interstratifications. The curve approaches a plateau as the crystallite size increases. The larger values for small crystallite sizes are due to extra matrix operations involved outside the summation loop. As the number of layers increases to 25, the computation time for matrix multiplications [Q] M+1 and ([Q] M+1 - [Q])([I] − [Q])-2 prevails, and the performance gain plateaus at ~ 2 for the R1 and R2 cases and at 3 for the R3 case

Given the advantages of the MM over the CM, the MM was used as the kernel of the ClayStrat program to calculate intensities from interstratified systems. Evaluating the performance of ClayStrat compared with NEWMOD+ (Yuan & Bish Reference Yuan and Bish2010a), a program based on the NEWMOD© architecture is also useful. ClayStrat is distinct from NEWMOD+, not only in terms of how intensities are summed but also in terms of how the layer structure factors of different clay components, in particular centrosymmetric clay minerals such as illite, are calculated. However, the calculation of the layer structure factor for non-centrosymmetric clay minerals such as kaolinite and serpentine is the same. It can only be done by adding the scattering factor of each atom at different positions according to the expression
 , where
 is the scattering vector defined previously,
 is the scattering power of the n
th atom at
 , and Z is the position of the n
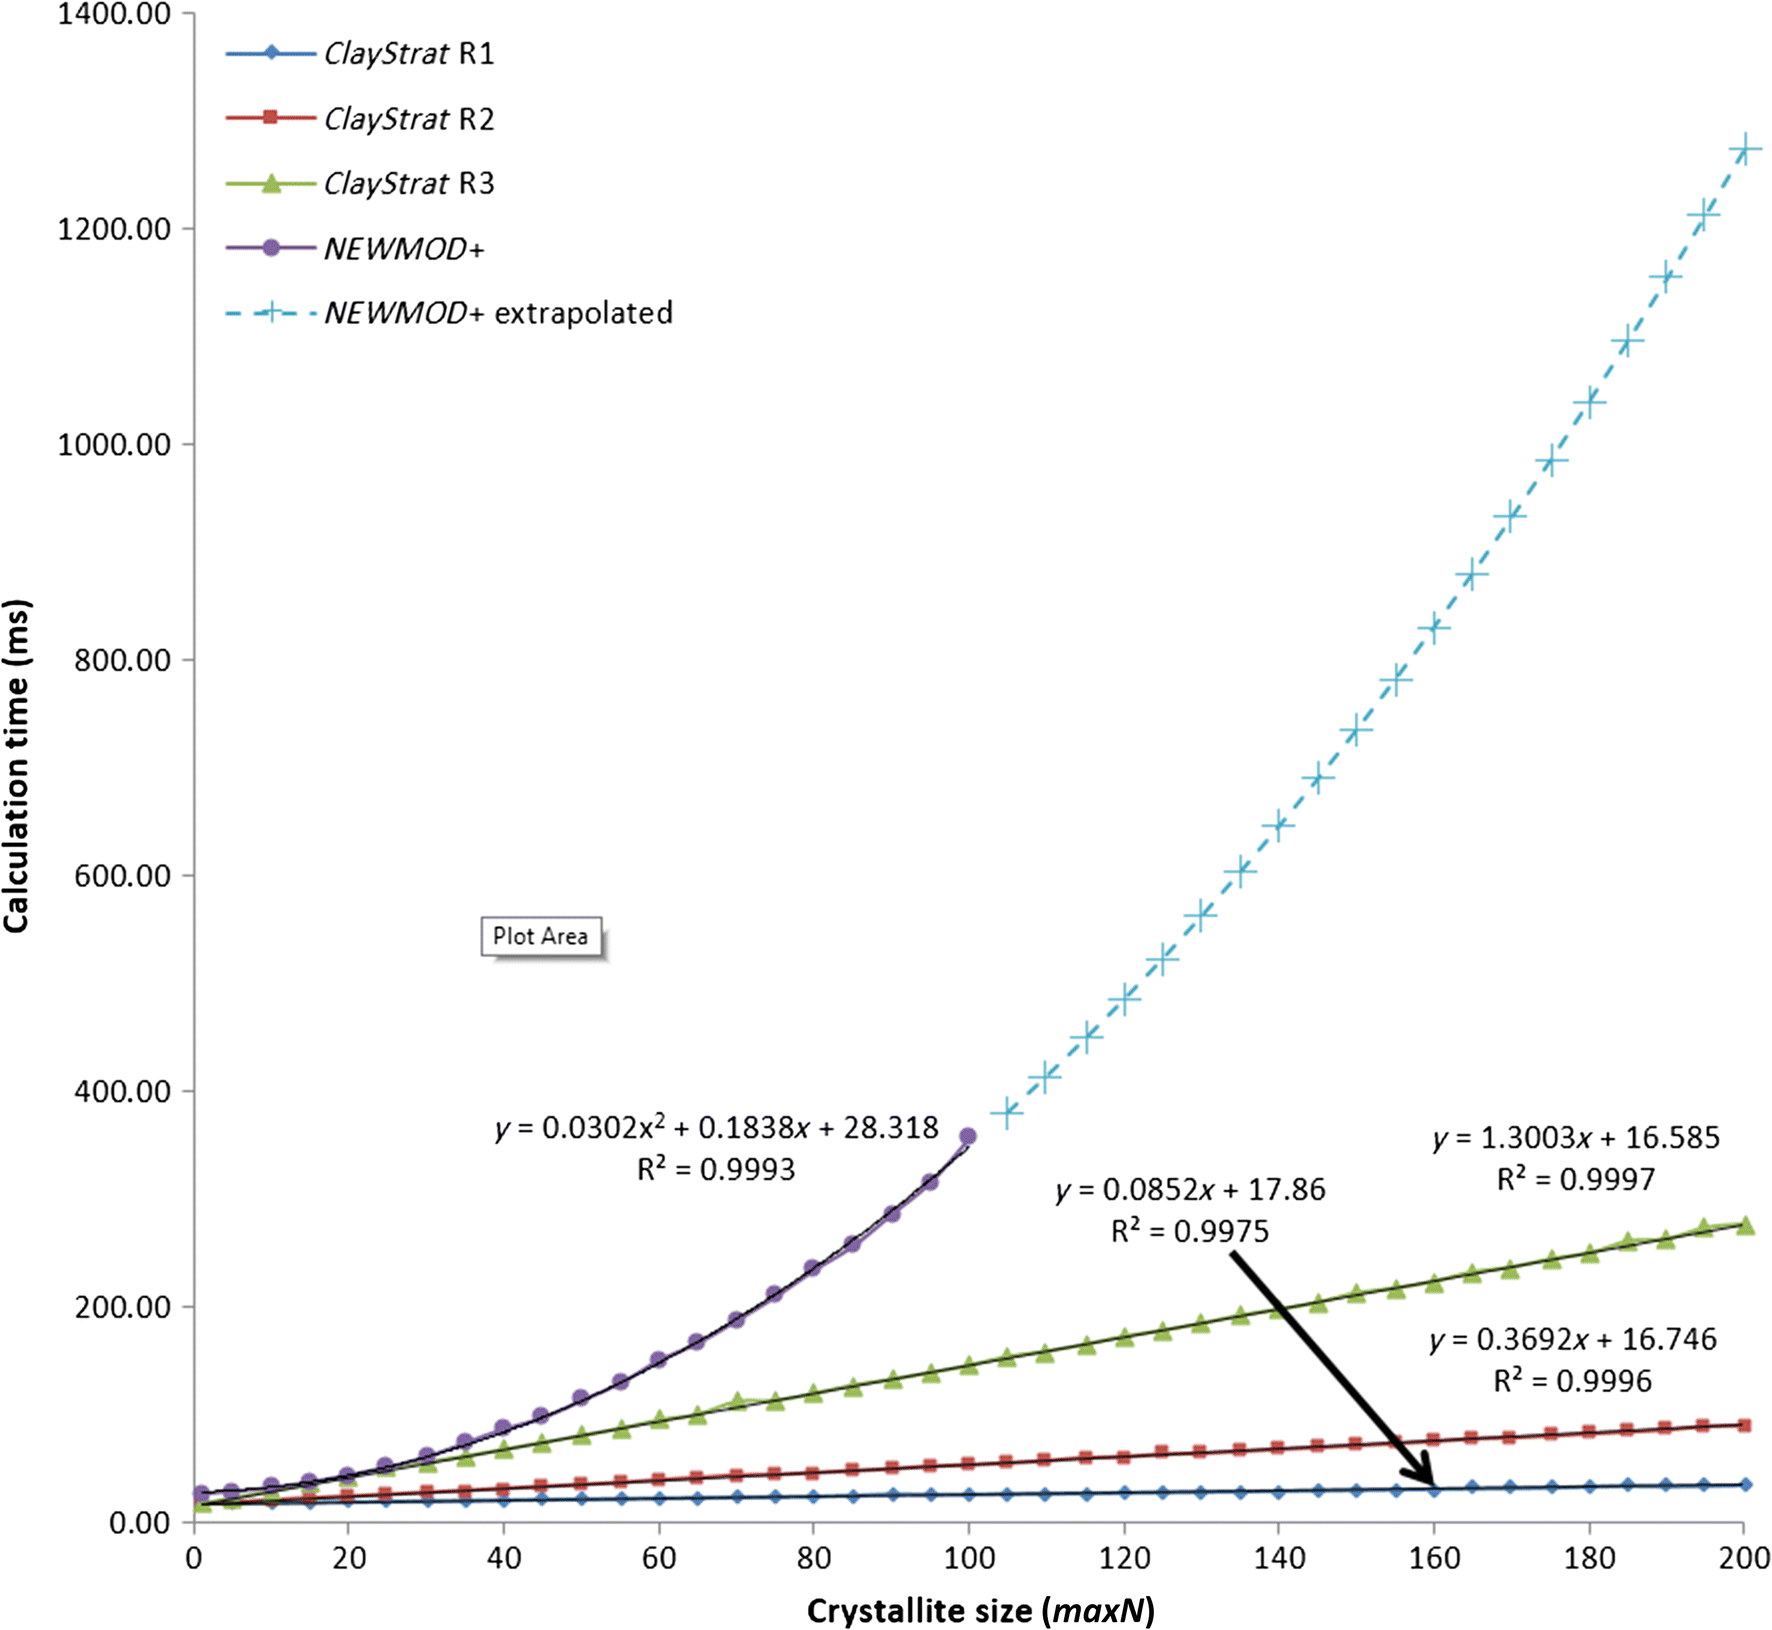
th atom along the Z direction in angstroms. The kaolinite structure (Bish & Von Dreele Reference Bish and Von Dreele1989) was selected for comparisons between ClayStrat and NEWMOD+ to eliminate the influence of differences in the calculation of layer structure factors of minerals that are centrosymmetric. To further simplify the calculation, kaolinite was specified as both the major and the minor components of interstratified phyllosilicate. The profiles of an interstratified kaolinite/kaolinite were calculated with the following parameters: 2θ range from 2 to 60° with an increment of 0.02°2θ, minN fixed to 1, and maxN varied from 5 to 200 with an increment of 5. The calculation time for each full diffraction profile was recorded in units of milliseconds, the calculation was repeated 20 times, and the average calculation time was obtained for each value of crystallite size and plotted in Fig. 3. Unlike the matrix methodology, which involves different matrix sizes for different Reichweite values, the NEWMOD© architecture calculates diffraction profiles using the same approach regardless of Reichweite value, leading to a single relation between calculation time and crystallite size. The computational time was recorded for a maximum crystallite size of up to 100 layers for NEWMOD+ as the NEWMOD© architecture can simulate profiles of up to 100 layers (Jaboyedoff et al. Reference Jaboyedoff, Bussy, Kubler and Thelin2001). A very good fit (R2 = 0.9993) to the data for maxN values between 1 and 100 was obtained using a 2nd-order polynomial function. The derived relation y = 0.0302x
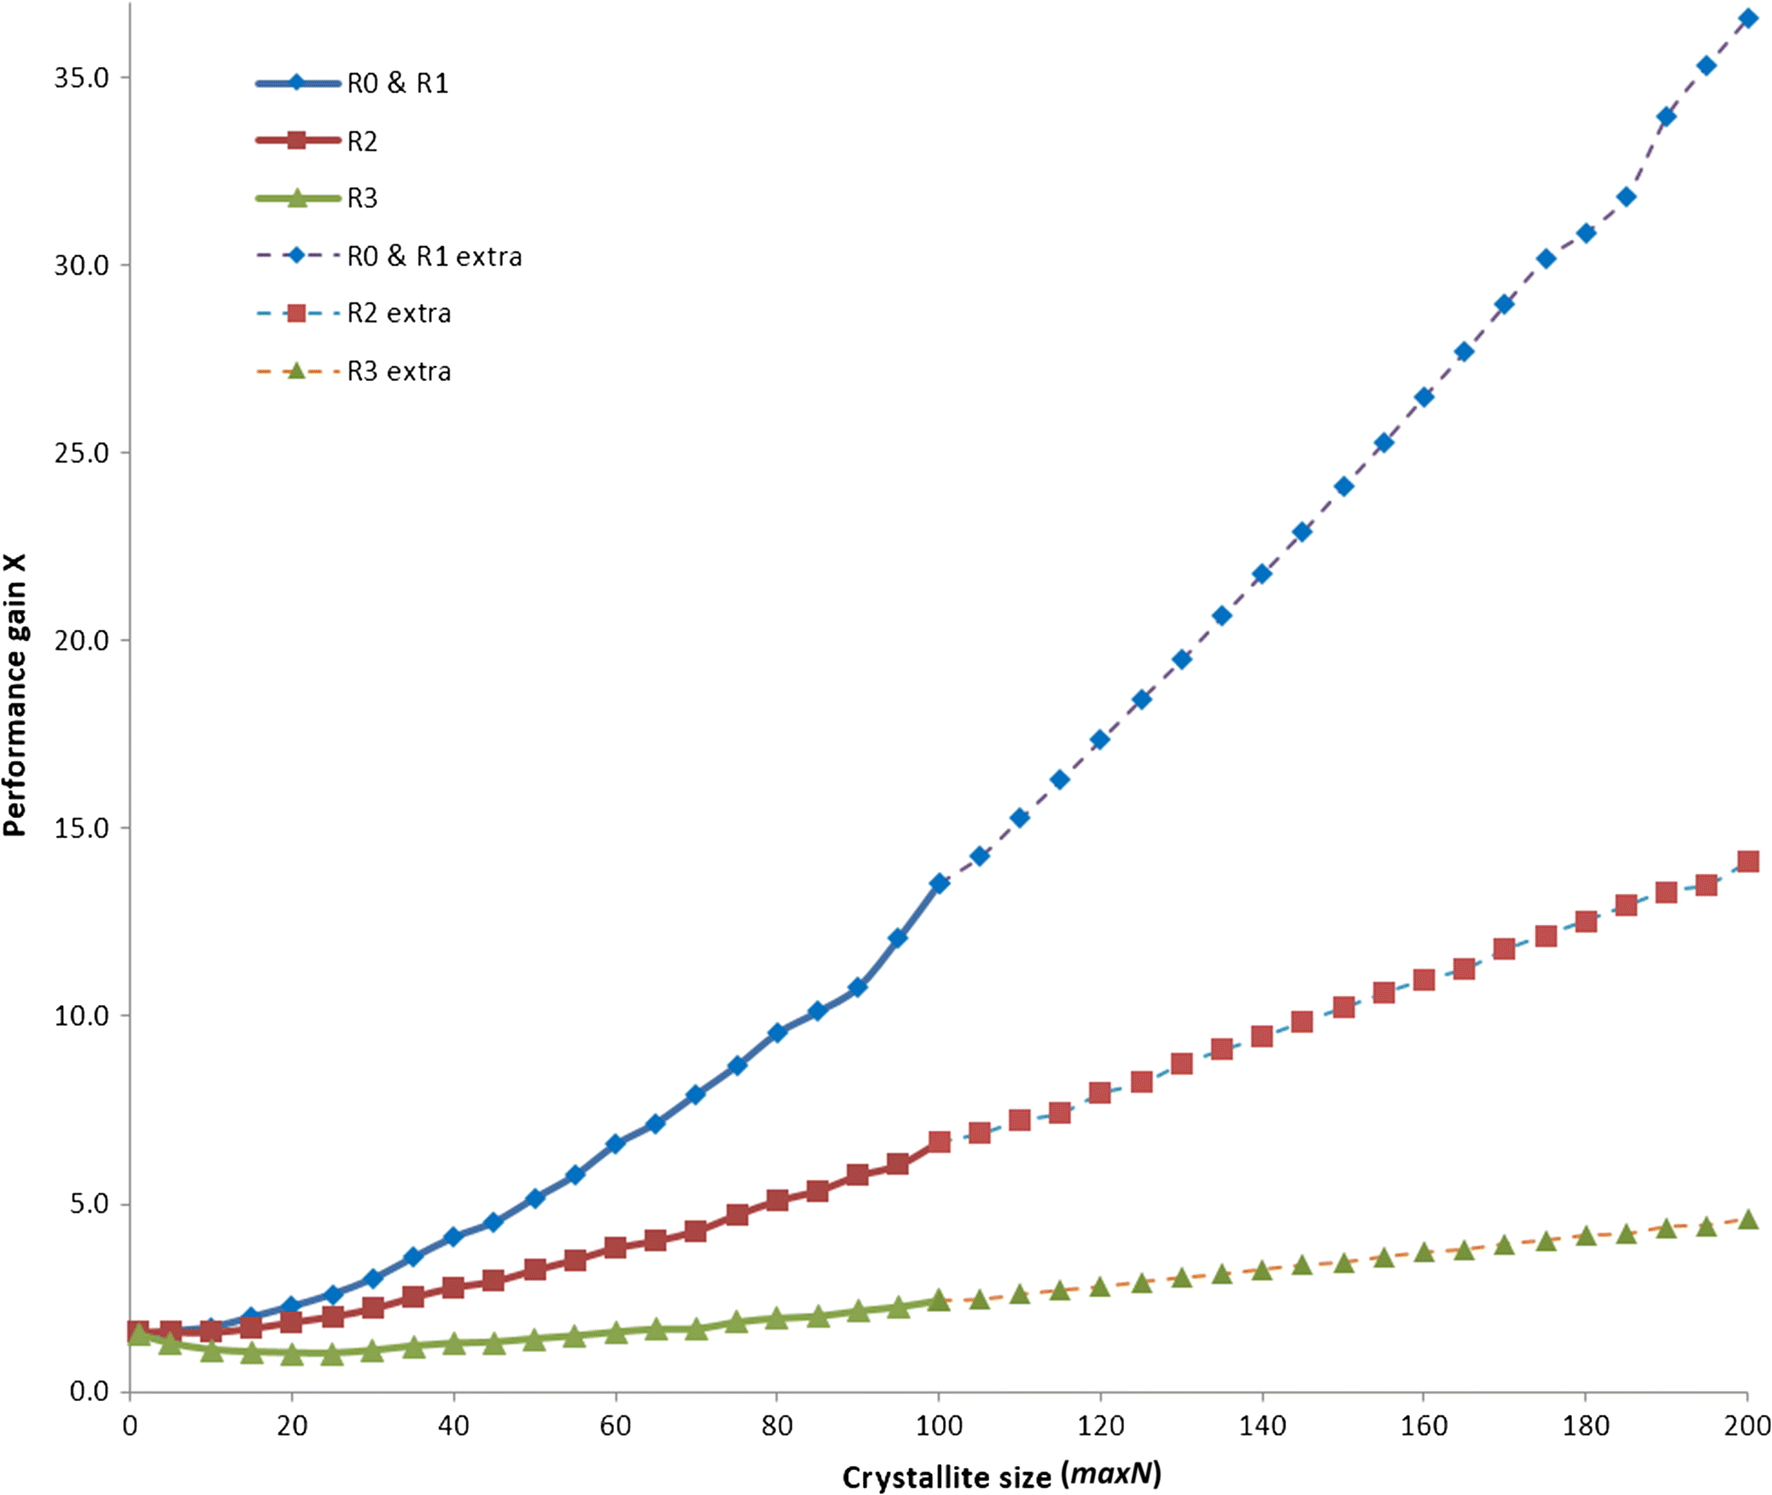
2 + 0.1838x + 28.318 was further used to extrapolate calculation times for crystallite sizes beyond 100 layers, which are indicated as “NEWMOD+ extrapolated” in Fig. 3. ClayStrat is significantly faster than NEWMOD+, as illustrated by the significantly shorter calculation times, and the improvement in computational efficiency increases with increasing crystallite size. The performance gain curves were obtained by dividing the calculation time for NEWMOD+ by those obtained for ClayStrat (Fig. 4). Minor improvement occurred in computational efficiency for the R3 case with ClayStrat, ranging from 1X to 2.5X for a maxN of 100 to 5X with a maxN of 200. The computational efficiency was significantly improved for the R2 case, ranging from 1.6X to 6.7X with a maxN of 100 and 14X with a maxN of 200. The matrix methodology shows the most improvement in computational efficiency for the R0 and R1 cases, ranging from 13.5X with a maxN of 100 to 37X with a maxN of 200.
Computational efficiency of NEWMOD+ and ClayStrat as a function of maximum crystallite size used in the simulation of interstratified kaolinite/kaolinite. Blue diamonds represent ClayStrat R1; red squares represent ClayStrat R2; green triangles represent ClayStrat R3; purple, filled circles represent NEWMOD+; and blue crosses represent the extrapolated data for NEWMOD+ with a maximum crystallite size beyond 100 according to the expression derived from the fit to the data points between 5 and 100

Performance improvement of ClayStrat compared with NEWMOD+ (expressed as ‘Performance gain’). Data linked with dashed lines were calculated using the extrapolated data shown in Fig. 3; extra: extrapolated. Blue diamonds represent R0 and R1; red squares represent R2; and green triangles represent R3

Comparison of XRD Patterns Generated by ClayStrat and NEWMOD+
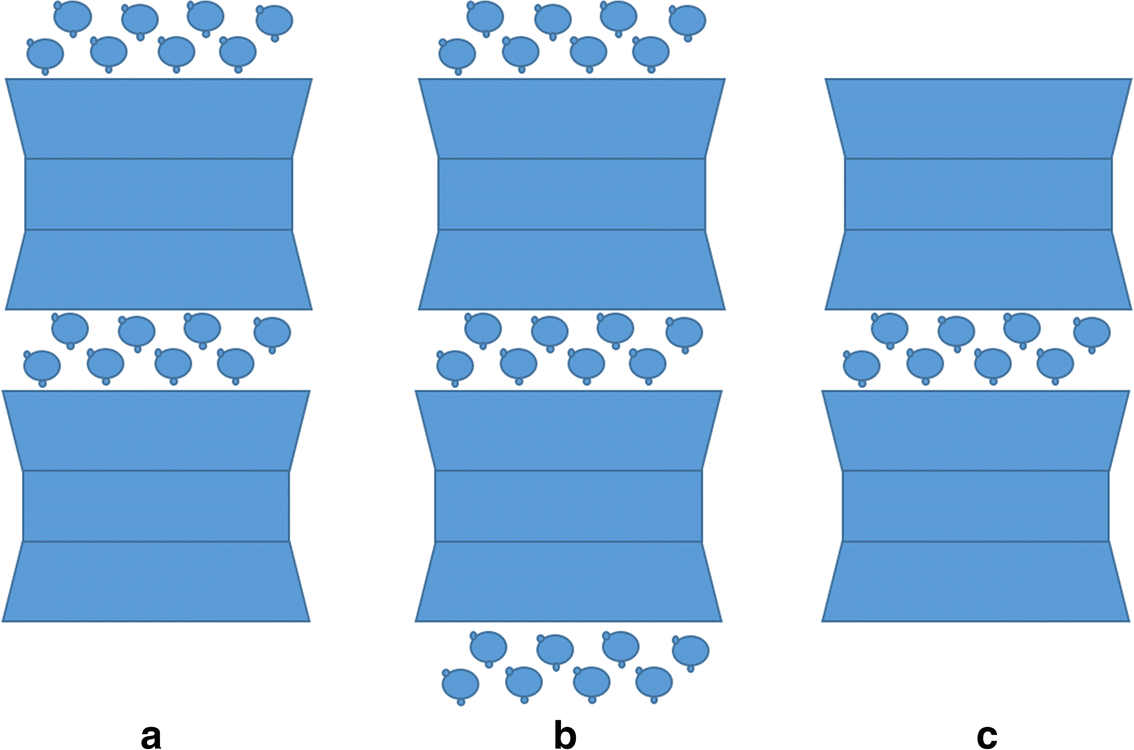
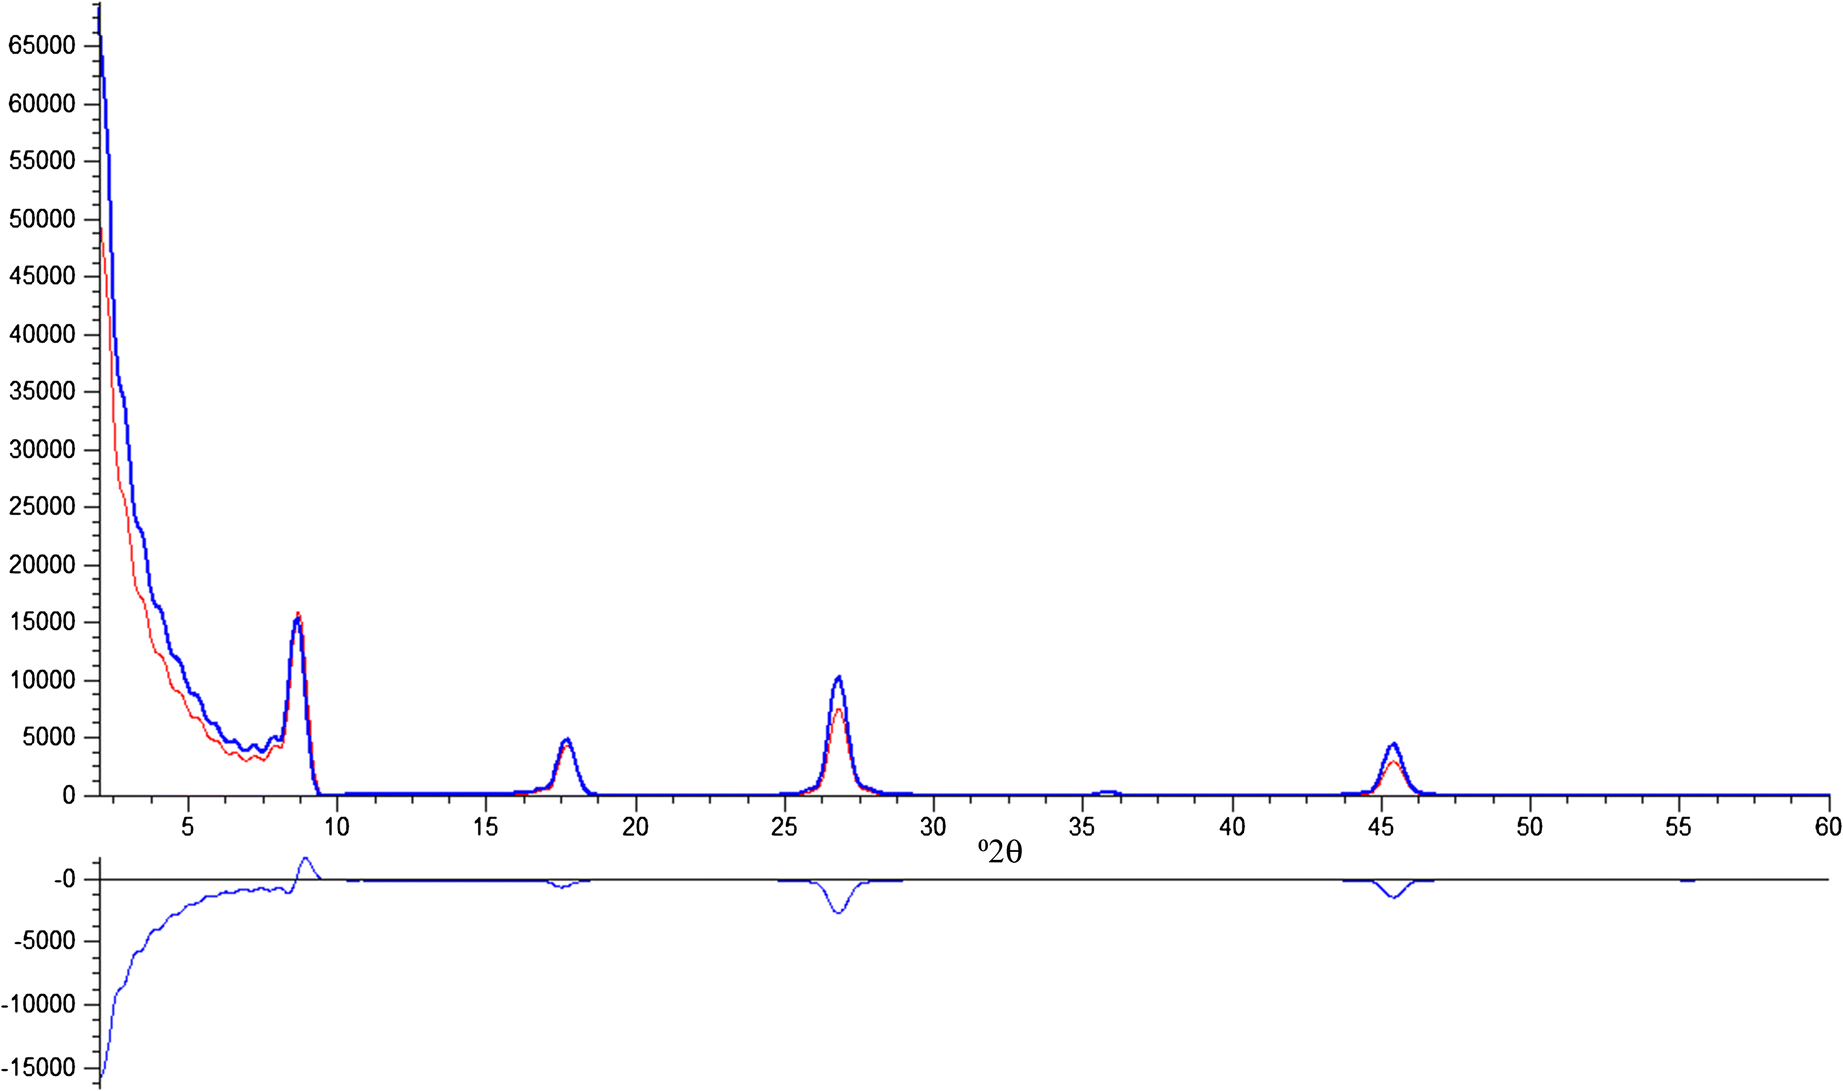
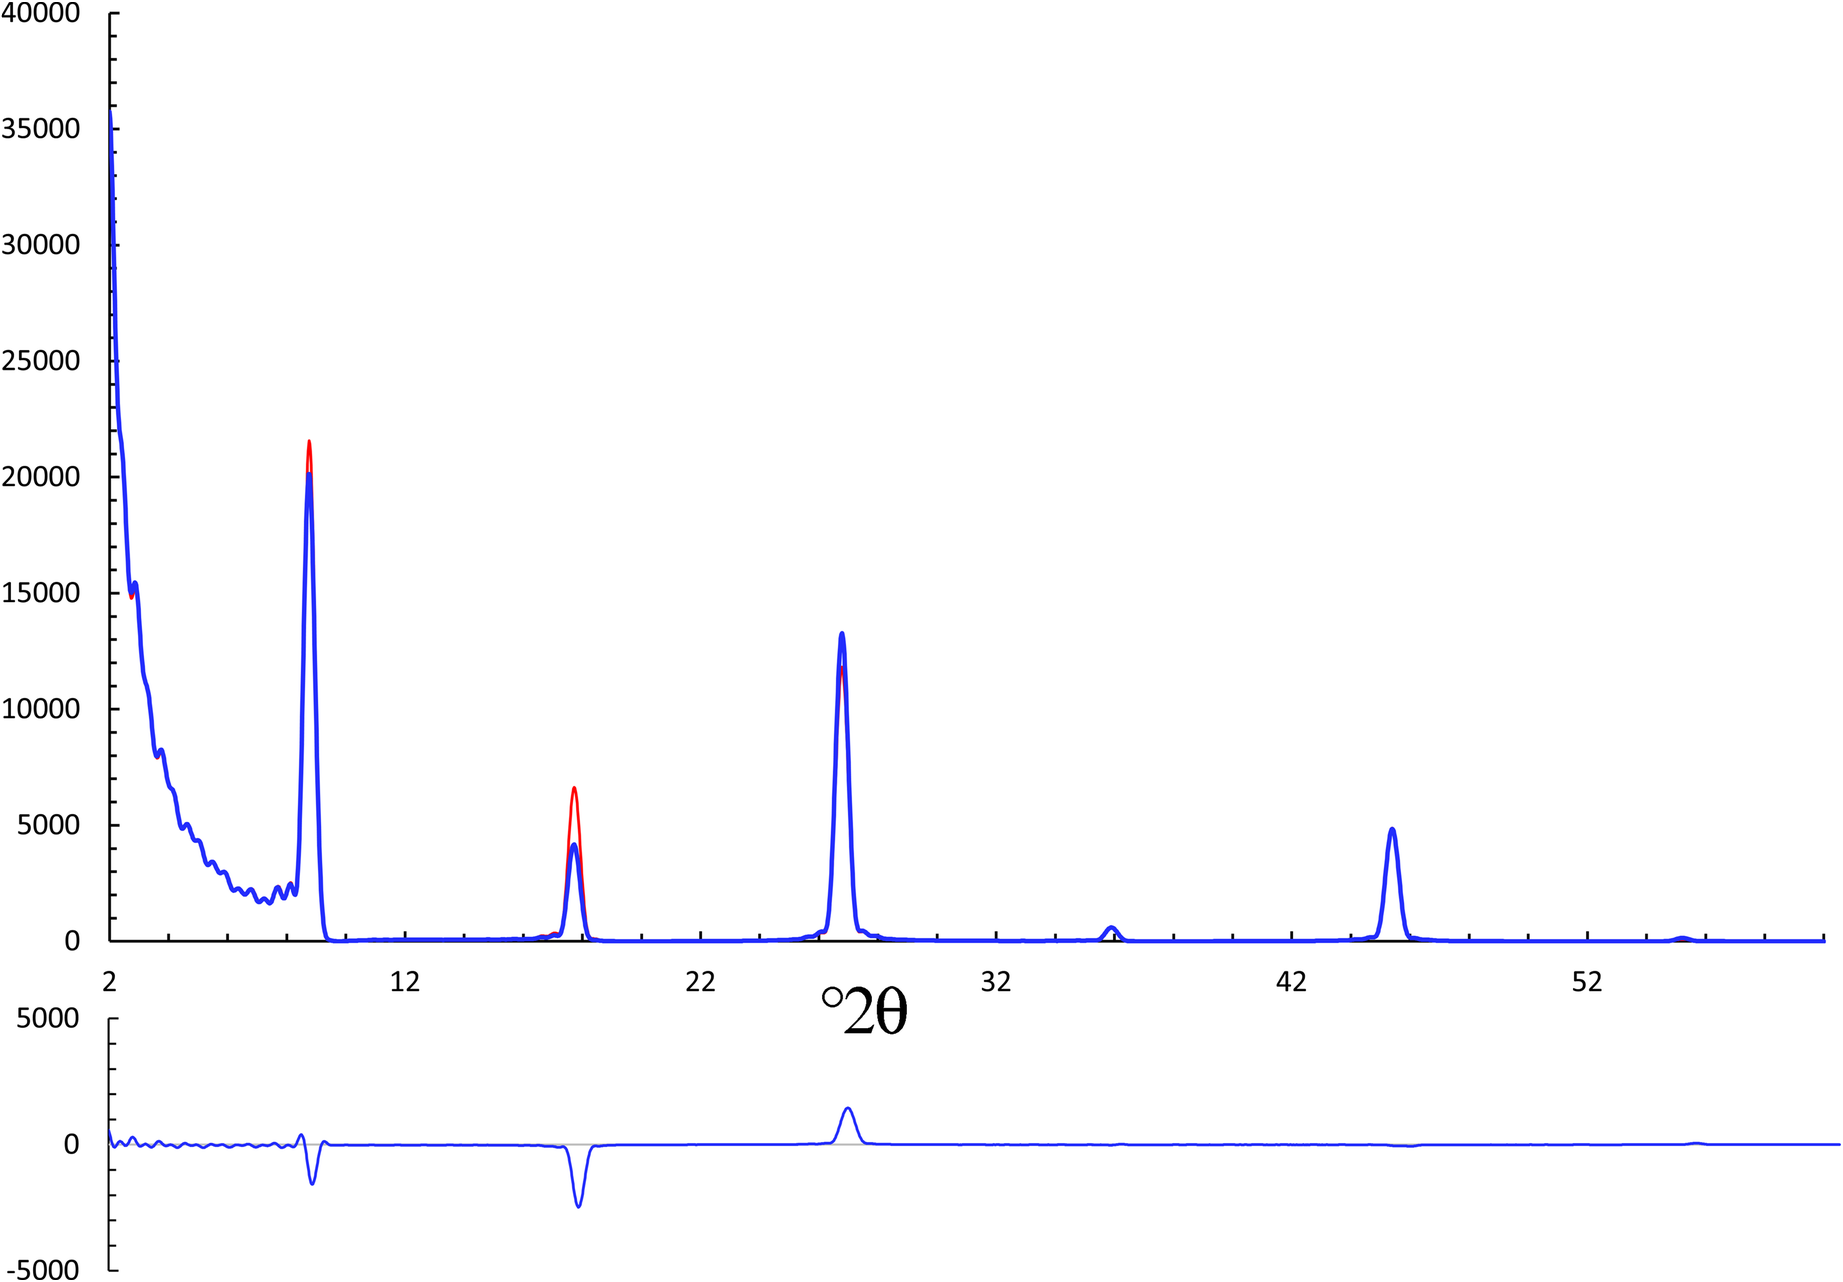
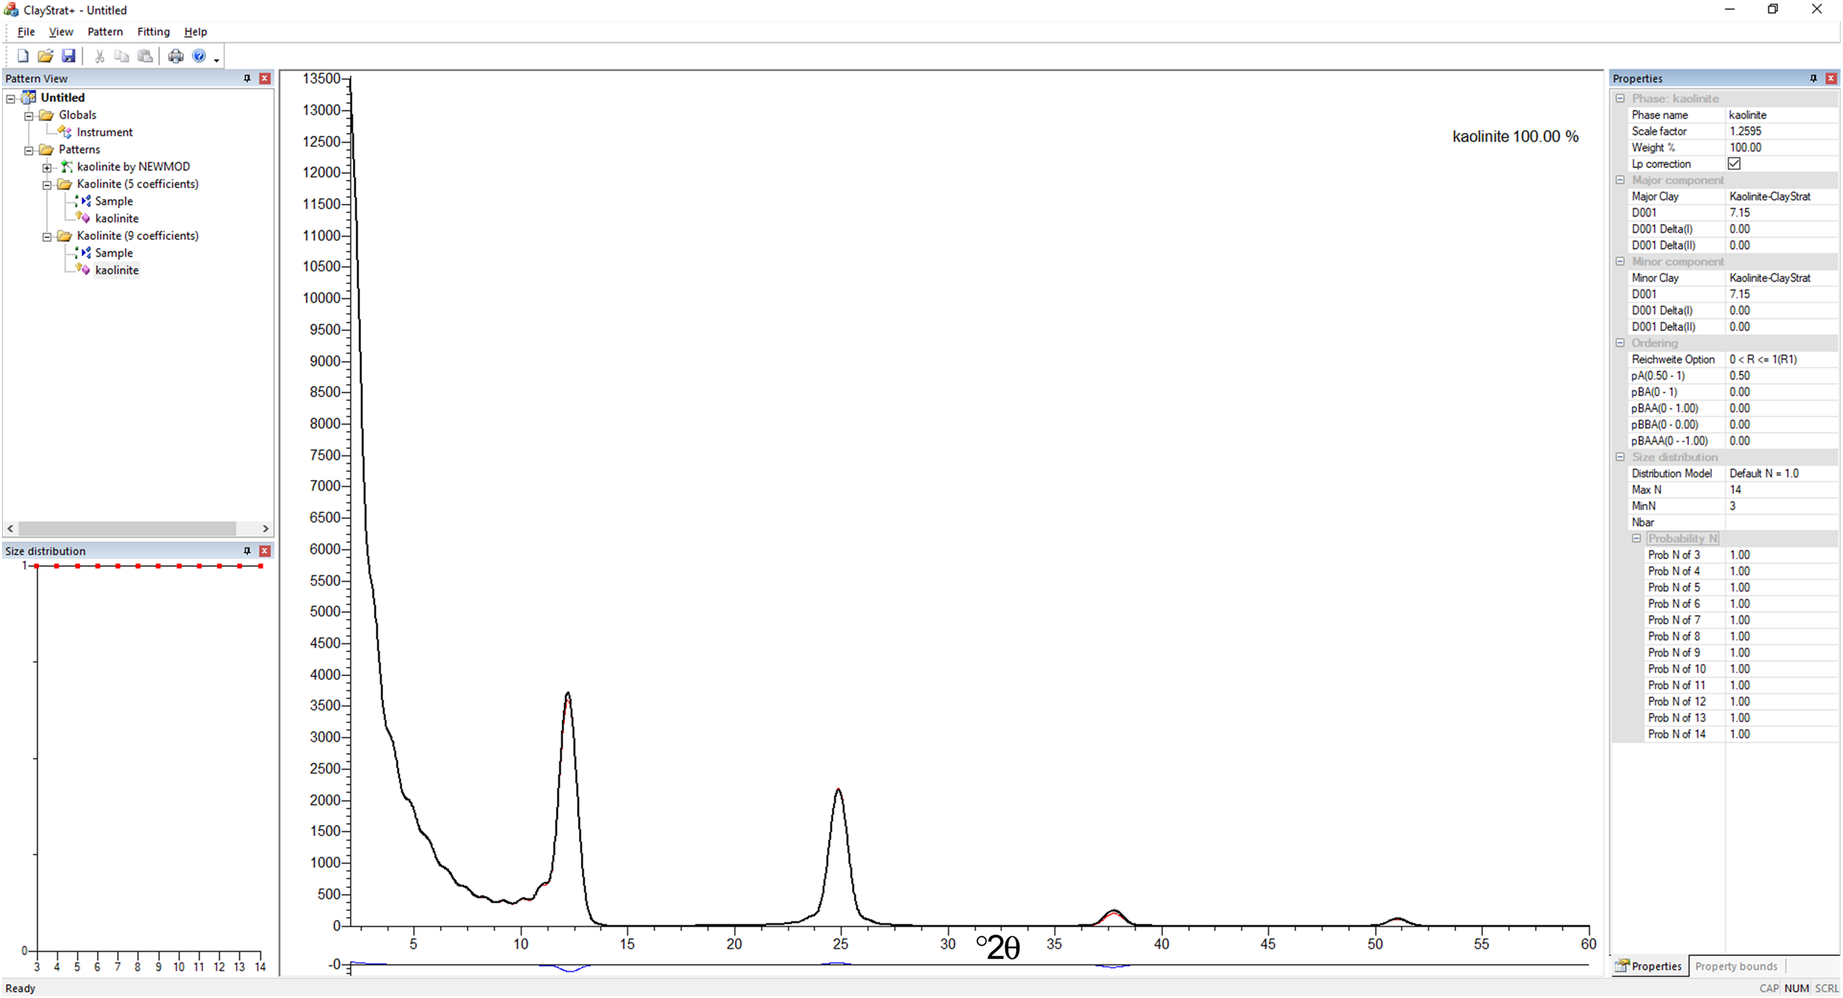
It is natural to consider whether ClayStrat and NEWMOD+ generate the same XRD patterns given the same input data. Although both the NEWMOD© architecture and the matrix methodology use the same approach by employing a combination of the Fourier series of the Laue interference function and a statistical description of the arrangement of different layers, the NEWMOD© architecture handles the diffracted intensity from the end layers containing interlayer material differently. If a very thin hydrated smectite crystallite with only two layers, SS, containing two H2O-layers in the interlayer region (Fig. 5) is considered, assigning two H2O-layers to the interlayer region between two TOT blocks is easy, but the configuration of H2O layers on both ends of the crystallite is not obvious. The crystallite could be terminated with two H2O layers on one end and none on the other end (Fig. 5a), or it could have both ends terminated with two H2O layers (Fig. 5b), or it could have no H2O layers bonded on either end (Fig. 5c). These three configurations were assumed possible in the NEWMOD© architecture, and special treatment was used to account for these three configurations. In contrast, the matrix methodology does not account for the variation of interlayer material on the crystallite surface. The effect of intensity from the interlayer material on the crystallite surface (both ends) can be significant when the crystallite is small, and the effect decreases as the size of the crystallite increases. To illustrate the effect of the special treatment implemented in the NEWMOD© architecture, the XRD profiles of an interstratified illite/illite with different sizes were generated by NEWMOD+ and ClayStrat using the following parameters: 2θ range from 2 to 60° with an increment of 0.02°2θ and interlayer K+ = 0.8. The size distribution option was set to default, assuming equal probability of occurrence of crystallites in all sizes. Two sets of minN and maxN values were used, minN of 3 and maxN of 14 (Fig. 6) and minN of 10 and maxN of 20 (Fig. 7), respectively. When the average crystallite size was small (average size of 8.5 in Fig. 6), the various configurations of interlayer material on the crystallite surface treated in NEWMOD+ altered the relative intensity ratio between different 00l reflections, resulting in a smaller 004/001 ratio and larger 003/001 and 005/001 ratios. The large differences observed in the low diffraction angle region were largely due to the Lorentz-polarization correction that amplifies subtle differences. As the crystallite sizes increase, the intensity contribution from the interlayer material on the crystallite surface is outweighed by the diffraction intensity from the entire crystallite, becoming negligible as shown in Fig. 7, in which the average size of crystallite is 15 layers. The special treatment was implemented in NEWMOD© architecture to account for the discrepancy observed between experimental and calculated XRD profiles, but the discrepancies may not be entirely due to various configurations of interlayer material bonding to the crystallite surface. The calculation of atomic scattering factor can also change the calculated XRD profiles to some extent, potentially contributing differences when compared with the experimental XRD profiles. The scattering factor for a given element is calculated in ClayStrat and NEWMOD+ using the nine-parameter formulation of Cromer & Waber (Reference Cromer and Waber1965), comparable to but more accurate than the five-parameter expression utilized in original NEWMOD© (Wright Reference Wright1973). The coefficients for calculating the atomic scattering factor for all elements used in ClayStrat are taken from International Tables for X-ray Crystallography (1974). The XRD profiles of an interstratified kaolinite/kaolinite calculated by NEWMOD+ and ClayStrat using the five-parameter expression in the original NEWMOD© overlap each other perfectly (Fig. 8), indicating that ClayStrat produces the same XRD profiles as NEWMOD© when identical input data and atomic scattering factors are used in the calculation. The special treatment for interlayer material on the crystallite surface used in the NEWMOD© architecture has no effect on the calculation of XRD profiles of kaolinite, as it has no interlayer species. However, the XRD profile calculated by ClayStrat using the nine-parameter formulation showed some discrepancies compared with the profile generated by NEWMOD+ using the original five-parameter expression.
Various possible configurations of interlayer H2O molecules in a two-layer smectite crystallite

XRD profiles of interstratified illite/illite (0.5/0.5 in abundance) generated by NEWMOD+ in red and ClayStrat in blue (interlayer K+ = 0.8, minN = 3, and maxN = 14). The profile at the bottom is the difference curve between the two XRD profiles

XRD profiles of interstratified illite/illite (0.5/0.5 in abundance) generated by NEWMOD+ in red and ClayStrat in blue (interlayer K+ = 0.8, minN = 10, and maxN = 20). The profile at the bottom is the difference curve between the two XRD profiles

XRD profiles of interstratified kaolinite/kaolinite generated by NEWMOD and ClayStrat using different methods of calculating atomic scattering factors. The profile “Kaolinite (5 coefficients)” generated in ClayStrat (red curve) overlays perfectly on the profile “Kaolinite by NEWMOD” (blue curve covered by the red curve). The profile “Kaolinite (9 coefficients)” generated in ClayStrat (black curve) exhibits some discrepancies compared with the profile generated using 5 coefficients (red curve), as shown in the blue curve at the bottom of the plot

Conclusions
A new program, ClayStrat, was developed to model the 1D XRD profiles obtained from interstratified and non-interstratified phyllosilicate systems along the Z (layer stacking) direction. The modified matrix methodology in ClayStrat provides considerably improved calculation efficiency, and the new program offers greater user flexibility than the NEWMOD© architecture and NEWMOD+. In general, the matrix methodology is more efficient for calculating XRD profiles from interstratified phyllosilicates than the NEWMOD© architecture. The modified matrix methodology further improves calculation speeds by a factor of two to three by reducing the number of matrix operations involved in the summation. The size of matrices in the matrix methodology varies with range of ordering, i.e. the Reichweite value, and the calculation time is, therefore, a function of Reichweite value and maximum crystallite size. Comparison between ClayStrat and NEWMOD+ showed that ClayStrat is significantly faster than NEWMOD+, with computational efficiency gains of up to 13.5X, 6.7X, and 2.5X corresponding to the R1(R0), R2, and R3 cases, respectively, for a maximum crystallite size of 100 layers.
ClayStrat has the capability to import crystal structures from a user’s external ASCII file in which other structures can be defined, such as LDH and smectite with CO2 residing in the interlayer region, greatly enhancing the general applicability of the program. The modified matrix methodology employed in ClayStrat is practical for implementation in a global search method for profile fitting, and computations can be further accelerated by taking advantage of the parallel computing power offered by modern graphics cards.
Acknowledgements
This manuscript was improved by the comments of two anonymous reviewers and the Associate Editor.
Appendix A.1. File format of crystal structures used in ClayStrat
All crystal structures used in ClayStrat are defined in an ASCII file (structure.txt). This file contains information such as unit-cell parameters and atomic configurations, and it also controls which parameters can be adjusted in the ClayStrat graphical-user-interface (GUI) and in profile fitting (ClayStrat+). An example of a mineral structure file is provided below for better illustration.
Line 1: The definition of crystal structure starts with ‘{’ and ends with ‘}’.
Line 2: A line starting with the symbol ‘!’ is a comment line that helps users understand the variables, such as lines 2, 4, 6, and 15 shown below.
Line 3 defines the mineral ID and unit-cell parameters. The mineral ID is unique across the file. The suffixes R, LB, UB shown in comment lines (2, 4, 6, and 15) indicate the refineability and lower and upper boundaries of the preceding variable, respectively. For example, d_R, d_LB, and d_UB in line 2, M_R, M_LB, and M_UB in line 6, etc. A value of 1 for d_R indicates that the preceding variable, d-spacing, is refinable, and users can adjust the value of d-spacing in the ClayStrat GUI. The variable “d-spacing” will not be shown in the ClayStrat GUI if d_R is set to 0.
Line 5: A line starting with ‘#’ indicates a subgroup of atoms/molecules shown in the ClayStrat GUI, such as lines 5 and 14.
Line 6: SF_ID refers to the atomic/molecular scattering entry defined in the ASCII file (ScatterF.txt) that contains the nine coefficients of the atom/ion and molecular group for calculating the scattering factor. Atom_pID refers to the atomic/molecular property entry defined in the ASCII file (atomp.txt) that contains physical properties of atoms such as atomic weight. B-factor refers to the Debye-Waller thermal factor. The value of the z-position can be a fixed number such as 1.065 (line 10) or it can be a fraction of a unit-cell repeat (e.g. 0.5D) defined in line 16.
Line 7: Mg@O refers to Mg in the octahedral sheet, and Si@T indicates Si in the tetrahedral sheet.
Line 17: A line starting with the symbol ‘$’ defines an occupancy constraint between two atoms, which is common among cations in the octahedral sheet. For example, the total cation occupancy in the octahedral sheet is often two per half-cell formula unit in a dioctahedral clay mineral such as illite. The number following ‘$’ is the atom_ID defined previously. The expression in line 18 indicates that the total occupancy of Fe@O and Al@O is equal to 1.7, given the fact that the occupancy of Mg@O, the other cation in the octahedral sheet, is fixed at 0.3.