





Introduction
Voting advice applications (VAAs) allow voters to compare their policy positions with those of parties or candidates and are now regularly made available before major elections across Europe and beyond (Garzia and Marschall Reference Garzia, Marschall and Thompson2019). As we document in Online Appendix  ${\rm{\S}}$1, VAA usage has grown substantially over time: more than every second voter turned to VAAs before recent elections in the Netherlands, Denmark, Norway, and Sweden, with significant shares also doing so in Belgium, Finland, Germany, Switzerland, and several other countries. Most VAAs are championed by governmental or non-governmental organizations with the aim of helping voters make informed voting decisions and promoting electoral participation (Marschall and Schultze Reference Marschall and Schultze2012; Reiljan, da Silva, Cicchi et al. Reference Reiljan, da Silva, Cicchi, Garzia and Trechsel2020; Walgrave, van Aelst, and Nuytemans Reference Walgrave, van Aelst and Nuytemans2008). Whether VAAs actually achieve these goals, however, remains unclear.
A large literature has studied the effects of VAA usage on voters, but observational and experimental studies often reach divergent conclusions. Most observational studies report substantially sized effects of VAA usage on political knowledge (e.g., Schultze Reference Schultze2014), electoral preferences (e.g., Alvarez, Levin, Mair et al. Reference Alvarez, Levin, Mair and Trechsel2014; Kleinnijenhuis, van de Pol, van Hoof et al. Reference Kleinnijenhuis, van de Pol, van Hoof and Krouwel2019; Tromborg and Albertsen Reference Tromborg and Albertsen2023), and electoral participation (e.g., Garzia, de Angelis, and Pianzola Reference Garzia, de Angelis, Pianzola, Garzia and Marschall2014; Germann and Gemenis Reference Germann and Gemenis2019; Gemenis and Rosema Reference Gemenis and Rosema2014; Kruikemeier, van Noort, Vliegenthart et al. Reference Kruikemeier, van Noort, Vliegenthart and de Vreese2014). However, while some experimental studies have found evidence for short-term effects immediately after VAA usage (Garry, Tilley, Matthews et al. Reference Garry, Tilley, Matthews, Mendez and Wheatley2019; Germann, Mendez, and Gemenis Reference Germann, Mendez and Gemenis2023), most have not been able to replicate durable VAA effects extending over the course of an election campaign (e.g., Enyedi Reference Enyedi2016; Mahéo Reference Mahéo2016, Reference Mahéo2017; Munzert, Barberá, Guess et al. Reference Munzert, Barberá, Guess and Yang2020; Pianzola, Trechsel, Vassil et al. Reference Pianzola, Trechsel, Vassil, Schwerdt and Michael Alvarez2019; Vassil Reference Vassil2011). A possible explanation is that observational studies are biased due to self-selection into VAA usage. Yet, experimental studies may also miss genuine longer-term VAA effects because of low statistical power, low compliance with treatment assignment, and because they lack access to the VAA advice (Germann, Mendez, and Gemenis Reference Germann, Mendez and Gemenis2023; Tromborg and Albertsen Reference Tromborg and Albertsen2023).
We introduce a new design that addresses the limitations of previous studies by combining key advantages of the two currently leading experimental designs in the VAA literature – the encouragement design (Enyedi Reference Enyedi2016; Frese, Hix, and Lachat Reference Frese, Hix and Lachat2025; Garzia, Trechsel, and de Angelis Reference Garzia, Trechsel and de Angelis2017; Munzert, Barberá, Guess et al. Reference Munzert, Barberá, Guess and Yang2020; Pianzola, Trechsel, Vassil et al. Reference Pianzola, Trechsel, Vassil, Schwerdt and Michael Alvarez2019; Vassil Reference Vassil2011) and the timing design (Garry, Tilley, Matthews et al. Reference Garry, Tilley, Matthews, Mendez and Wheatley2019; Germann, Mendez, and Gemenis Reference Germann, Mendez and Gemenis2023). Similar to encouragement studies, our experimental manipulation consists of a prompt inviting participants in an online survey to use a VAA. However, we do not merely encourage VAA usage but directly enforce it by routing participants to an external VAA website and then back to our survey. Analogously to timing studies, this allows us to achieve almost full compliance with treatment assignment in the treatment group. Furthermore, we track the behavior of treated participants during VAA usage and ask the control group the same set of policy questions that are also included in the VAA. This allows us to establish both the VAA advice that the treatment group received and the VAA advice that the control group would have received, had it been assigned to the treatment group. Contrary to existing implementations of the encouragement design, but similar to timing studies, we are therefore not limited to studying the effects of VAA usage on preference change (‘vote switching’), but can establish whether VAA users’ perceptions of parties shifted in line with the advice they received. However, contrary to the timing design, we do not expose the control group to VAA advice. Like encouragement studies, we are therefore able to establish to what extent the effects of VAA usage persist over the course of an electoral campaign.
We administered our new experimental design to more than 3,000 British voters before the 2024 UK General Election (study 1). The large size of our sample mitigates common concerns about statistical power in the VAA effects literature (Munzert and Ramirez-Ruiz Reference Munzert and Ramirez-Ruiz2021). We focus on the UK since VAAs have not achieved the same widespread popularity compared to countries such as Denmark, Germany, or the Netherlands, which reduces the likelihood of contamination in the control group (Germann and Gemenis Reference Germann and Gemenis2019). Consistent with most previous experimental studies, we find little evidence for an effect of VAA usage on electoral participation. Also consistent with most previous experimental studies, we find no evidence for an average effect of VAA usage on vote switching. However, this is not because VAA usage had no effects on voting preferences. When we take the advice provided by the VAA into account, we find clear evidence that VAA users adjusted both (1) their perceived proximity to parties on policy issues and (2) their party preferences in line with the VAA advice. Both of these effects are strongest immediately after VAA usage and decrease subsequently, but remain visible after the election. Importantly, we also find evidence that VAA usage affected which party voters intend to vote for, an effect that carried over to the ballot box among undecided voters.
Overall, our results cast further doubt on observational findings suggesting that VAAs represent an effective mechanism to help reverse declining turnout rates. However, they also suggest that previous experimental studies may have underestimated VAAs’ effects on voting preferences. Effects on vote switching are straightforward to establish because they do not require access to the VAA advice. Yet, VAA usage can lead to both preference change and reinforcement, and effects on vote switching may therefore cancel out in the aggregate. When assessing VAA effects on party preferences and related outcomes, it is therefore important that researchers model effects conditional on the VAA advice, and this requires access to both the VAA advice that the treatment group saw and that the control group would have seen. Our design facilitates this, and when we take the VAA advice into account, we find evidence for durable effects on voters’ perceptions of policy proximity with parties and their party preferences.
Finally, a limitation that our design shares with encouragement studies is that we artificially induce VAA usage. To address resulting concerns about the generalizability of experimental results to VAA usage in the real world, we conducted a concurrent field experiment using the timing design (study 2). Following Garry, Tilley, Matthews et al. (Reference Garry, Tilley, Matthews, Mendez and Wheatley2019) and Germann, Mendez, and Gemenis (Reference Germann, Mendez and Gemenis2023), we randomized the time when actual VAA users were asked about their voting preferences and turnout intention. This allows us to compare the immediate effects of exposure to VAA advice in a real-world setting with the effects of artificially induced VAA usage. Analogously to study 1, we find that VAA usage affects party preferences but has no effect on turnout intention. While effects in the real world are somewhat smaller, this suggests that VAA effects are not limited to artificial experimental settings.
Methodological challenges in VAA research
Normatively, it is often seen as desirable if voters base their electoral choices on policy considerations (Achen and Bartels Reference Achen and Bartels2017). Yet empirical studies indicate that many citizens lack a clear understanding of parties’ and candidates’ policy positions (Adams, Ezrow, and Somer-Topcu Reference Adams, Ezrow and Somer-Topcu2011; Grand and Tiemann Reference Grand and Tiemann2013; Merrill, Grofman, and Adams Reference Merrill, Grofman and Adams2001) – a gap that is likely attributable to the high cognitive and informational costs associated with acquiring information on policy stances through traditional channels, such as newspapers, broadcast media, or party manifestos (Lau, Patel, Fahmy et al. Reference Lau, Patel, Fahmy and Kaufman2014; Rogers Reference Rogers2017; Wheatley and Germann Reference Wheatley and Germann2026). VAAs aim to lower these costs by providing voters with easily accessible, personalized information on their policy congruence with parties or candidates (Walgrave, van Aelst, and Nuytemans Reference Walgrave, van Aelst and Nuytemans2008). However, due to a series of methodological challenges, it remains unclear to what extent voters internalize VAA advice and whether it affects their electoral preferences and participation.
Many early studies of VAA effects relied on post-election studies and found strong associations between VAA usage and political knowledge (Schultze Reference Schultze2014), voting preferences (Andreadis and Wall Reference Andreadis, Wall, Garzia and Marschall2014; Walgrave, van Aelst, and Nuytemans Reference Walgrave, van Aelst and Nuytemans2008), and electoral participation (Garzia, de Angelis, and Pianzola Reference Garzia, de Angelis, Pianzola, Garzia and Marschall2014; Gemenis and Rosema Reference Gemenis and Rosema2014; Germann and Gemenis Reference Germann and Gemenis2019; Kruikemeier, van Noort, Vliegenthart et al. Reference Kruikemeier, van Noort, Vliegenthart and de Vreese2014; Marschall and Schultze Reference Marschall and Schultze2012). However, voters self-select into VAA usage, which makes causality difficult to establish in cross-sectional surveys. More recent studies have therefore turned to more sophisticated observational designs leveraging panel data (Alvarez, Levin, Mair et al. Reference Alvarez, Levin, Mair and Trechsel2014; Benesch, Heim, Schelker et al. Reference Benesch, Heim, Schelker and Schmid2023; Kamoen, Holleman, Krouwel et al. Reference Kamoen, Holleman, Krouwel, van de Pol and de Vreese2015; Kleinnijenhuis, van de Pol, van Hoof et al. Reference Kleinnijenhuis, van de Pol, van Hoof and Krouwel2019; Heinsohn, Fatke, Israel et al. Reference Heinsohn, Fatke, Israel, Marschall and Schultze2019; Tromborg and Albertsen Reference Tromborg and Albertsen2023) or instrumental variables (Garzia, de Angelis, and Pianzola Reference Garzia, de Angelis, Pianzola, Garzia and Marschall2014; Pianzola Reference Pianzola2014). Most of those studies have continued to find evidence for VAA effects; yet, causal identification remains linked to strong assumptions, such as parallel trends or the exclusion restriction.
In light of endogeneity concerns, VAA research has increasingly turned to randomized experiments. Casting significant doubt on observational findings, most experimental studies have not found evidence for significant VAA effects (Munzert and Ramirez-Ruiz Reference Munzert and Ramirez-Ruiz2021). Importantly, though, there is variation depending on the design of experimental studies. The majority of existing studies have relied on the encouragement design, and most of those studies have found null effects (Enyedi Reference Enyedi2016; Garzia, Trechsel, and de Angelis Reference Garzia, Trechsel and de Angelis2017; Munzert, Barberá, Guess et al. Reference Munzert, Barberá, Guess and Yang2020; Pianzola, Trechsel, Vassil et al. Reference Pianzola, Trechsel, Vassil, Schwerdt and Michael Alvarez2019; Vassil Reference Vassil2011). However, two other recent studies have relied on a different design – the timing design – and both of those studies reported evidence for a significant VAA effect on party preferences (the only outcome they studied) (Garry, Tilley, Matthews et al. Reference Garry, Tilley, Matthews, Mendez and Wheatley2019; Germann, Mendez, and Gemenis Reference Germann, Mendez and Gemenis2023).
A possible explanation for the different experimental results is that VAAs do have causal effects, but that they are short-lived. The timing design randomizes whether real-world VAA users are asked about outcomes of interest before or after exposure to the VAA advice. This brings significant advantages, including high compliance with treatment assignment; access to the VAA advice for both the treatment and the control groups; high statistical power because real-world VAAs tend to have many users; and high ecological validity since VAA effects are evaluated among real-world VAA users (Germann, Mendez, and Gemenis Reference Germann, Mendez and Gemenis2023). However, the timing design also has a significant limitation: both the treatment and the control groups ultimately receive VAA advice, which means that timing studies can only identify the immediate effects of exposure to VAA advice. In contrast, encouragement studies involve the random assignment of a verbal appeal to use a VAA (sometimes combined with a financial incentive), which makes it possible to track longer-term effects. In practice, most encouragement studies evaluate VAA effects days or even weeks after VAA usage. The fact that encouragement and timing studies report different results could therefore be owed to the fact that VAA effects dissipate quickly after VAA usage and do not affect voters’ behavior at the ballot box.
However, that VAA effects are short-lived is not the only possible explanation for the divergent experimental results. Another is that encouragement studies missed genuine VAA effects due to one or more of three limitations. First, VAA effects on perceptions of candidates or parties are likely to depend on the advice the VAA gives. Timing studies take this into account by estimating VAA effects conditional on the advice that the treatment group but not the control group has seen. However, this requires access to both the VAA advice that the treatment group saw and the VAA advice that the control group would have seen had it been assigned to the treatment group. Most encouragement studies do not provide access to either. Instead of assessing whether candidate or party evaluations shift in line with the VAA advice, encouragement studies have therefore tended to assess whether VAA usage increases the rate of vote switching (Munzert, Barberá, Guess et al. Reference Munzert, Barberá, Guess and Yang2020; Pianzola, Trechsel, Vassil et al. Reference Pianzola, Trechsel, Vassil, Schwerdt and Michael Alvarez2019; Vassil Reference Vassil2011). This is straightforward since researchers merely need repeated measurements of voting preferences at different points of electoral campaigns. However, effects on vote switching do not provide a good indication of effects on voting preferences since VAAs may lead to both preference change and preference stabilization, depending on the advice they provide. A positive, negative, or null average effect on vote switching can therefore all be consistent with a VAA effect on voting preferences (Tromborg and Albertsen Reference Tromborg and Albertsen2023).
As we will show, the absence of data on the actual and potential VAA advice represents a particularly important limitation of existing implementations of the encouragement design. However, a second reason why timing and encouragement studies may have tended to produce different results is that the latter do not estimate the effects of real-world VAA usage. In theory, it is possible that organic and artificially induced VAA usage have different effects. To our knowledge, no existing study has directly compared the effects of organic and artificially induced VAA usage, so it remains unclear how they compare. Hence, the discrepancy between timing and encouragement studies could, at least in part, be owed to VAAs having bigger effects ‘in the wild’, for example, because real-world VAA users have higher intrinsic motivation.
Finally, a common practical problem of encouragement studies is low compliance with treatment assignment (Garzia, Trechsel, and de Angelis Reference Garzia, Trechsel and de Angelis2017). Participants encouraged to use a VAA may decline to do so, while in countries where VAAs are popular, many control participants may use them anyway. In a recent German study, only 65% of treated participants used the VAA, while 29% of control participants did so independently (Munzert and Ramirez-Ruiz Reference Munzert and Ramirez-Ruiz2021); in a recent Swiss study, the corresponding figures were 83% and 69% (Pianzola, Trechsel, Vassil et al. Reference Pianzola, Trechsel, Vassil, Schwerdt and Michael Alvarez2019). Noncompliance of this magnitude is likely to lead to severe downward biases in intention-to-treat analyses and may also bias estimates of complier effects (Keele and Morgan Reference Keele and Morgan2016; Murray Reference Murray2006). Often, these problems are compounded by small samples and consequently low statistical power (though see Frese, Hix, and Lachat Reference Frese, Hix and Lachat2025).
In sum, it remains unclear whether observational findings suggesting durable effects on political knowledge, voting preferences, and electoral turnout are owed to selection bias or whether methodological and practical limitations have prevented encouragement studies from uncovering genuine longer-term VAA effects. In light of this, we propose a new experimental design that addresses the limitations of existing experimental approaches. Our design combines several key advantages of the encouragement and timing designs, including high compliance with treatment assignment, access to the VAA advice among both the treated and the control, and the ability to trace causal effects over time. However, similar to encouragement studies, our design artificially induces VAA usage. Hence, we in addition conduct a concurrent field experiment using the timing design, which allows us to assess how the effects of artificially induced and organic VAA usage compare.
Our experimental design has several important antecedents that are worth noting. First, similar to us, two previous experimental studies effectively enforced VAA usage, including the survey experiment by Andı, Çarkoglu, and Banducci (Reference Andı, Çarkoglu and Banducci2023) and the lab-in-the-field experiment by Mahéo (Reference Mahéo2016). Second, both Mahéo (Reference Mahéo2016) and the recent encouragement study by Frese, Hix, and Lachat (Reference Frese, Hix and Lachat2025) tracked the behavior of treated subjects during VAA usage and could therefore establish the advice seen by the treatment group. However, neither study established what advice control subjects would have received had they been assigned to the treatment group, which is necessary for estimating causal effects conditional on the VAA advice. Finally, Enyedi (Reference Enyedi2016) asked participants in his encouragement study to recall the advice the VAA gave them. Again, a limitation of this approach is that recalled VAA advice is only available for treated subjects. Furthermore, recall measures may suffer from cognitive biases that could bias causal estimates (Walgrave, van Aelst, and Nuytemans Reference Walgrave, van Aelst and Nuytemans2008; Wall, Krouwel, and Vitiello Reference Wall, Krouwel and Vitiello2014).
Theoretical expectations
We assess the effects of VAAs on three main outcomes: perceived proximity on policy issues, party preferences, and electoral participation. First, VAAs present voters with a unique type of information: personalized information on how close they are to parties or candidates in policy terms. While voters can acquire information on policy congruence from other sources, such as traditional news, VAAs therefore significantly reduce the costs associated with information acquisition. Moreover, many VAAs are prepared by political scientists, major news organizations, or other reputable organizations, which should increase their trustworthiness. Exposure to VAA advice may therefore lead voters to update their perceptions of how close they are to parties (if the VAA shows information on parties) or candidates (if the VAA shows information on candidates). More specifically, we expect that if a VAA user is informed that they are close (not close) to a party or candidate, they accordingly increase (reduce) their perceptions of policy proximity with that party or candidate.
H1: VAA usage increases the probability that voters’ perceptions of proximity to parties or candidates on policy issues align with the VAA advice.
Notably, changes in voters’ proximity perceptions are likely to reflect more accurate views of where they stand relative to parties, under two main assumptions.Footnote 1 First, the VAA advice must be sound and reflect voters’ objective proximity to parties. Second, VAA users need to avoid overcorrections; that is, VAA users should avoid overestimating their proximity to parties that represent good (but not perfect) matches or underestimating their proximity to parties that are bad (but not terrible) matches.
Second, we expect that VAA usage leads voters to update their electoral preferences in line with the advice they receive (Germann, Mendez, and Gemenis Reference Germann, Mendez and Gemenis2023; Germann, Mendez, Wheatley et al. Reference Germann, Mendez, Wheatley, Djouvas, Nezi and Wall2025; Pianzola, Trechsel, Vassil et al. Reference Pianzola, Trechsel, Vassil, Schwerdt and Michael Alvarez2019; Walgrave, van Aelst, and Nuytemans Reference Walgrave, van Aelst and Nuytemans2008). Voters’ electoral preferences are influenced by a myriad of factors, including affective attachment to parties (Cohen Reference Cohen2003), the country’s economic performance (Lewis-Beck and Stegmaier Reference Lewis-Beck, Stegmaier, Roger, Bernard and Stefan2018), valence factors (Green Reference Green2007), and tactical considerations (Riera Reference Riera2015). However, another key consideration for many voters is proximity on policy issues (Enelow and Hinich Reference Enelow and Hinich1984). VAAs provide voters with carefully curated, personalized information on policy proximity. To the extent that voters see proximity on policy issues as an important consideration, they should therefore be likely to update their party or candidate preferences after VAA usage.
H2: VAA usage increases the probability that voters’ electoral preferences align with the VAA advice.
Third, we expect that VAA usage increases electoral participation. Existing literature points to two main causal mechanisms linking VAA usage to increased turnout. First, VAAs provide easily accessible information on issue congruence and therefore significantly reduce the information costs associated with electoral participation (Garzia, Trechsel, and de Angelis Reference Garzia, Trechsel and de Angelis2017; Gemenis and Rosema Reference Gemenis and Rosema2014; Mahéo Reference Mahéo2017). Second, VAAs highlight that there are important differences between the policy platforms of different parties or candidates and often show users that they are much more closely aligned with some parties or candidates compared to others. Hence, VAA usage may increase the instrumental benefits associated with voting (Germann and Gemenis Reference Germann and Gemenis2019; Marschall and Schultze Reference Marschall and Schultze2012).
H3: VAA usage increases the probability of electoral participation.
Finally, we consider how durable the effects of VAAs are. Previous research suggests that voters often forget information they acquire during election campaigns (Dalager Reference Dalager1996; Lodge, Steenbergen, and Brau Reference Lodge, Steenbergen and Brau1995). One common explanation is memory decay: memory traces fade over time and become increasingly less available for retrieval (Brown Reference Brown1958; Joslyn Reference Joslyn2003). Another common explanation is interfering information (Fawcett and Hulbert Reference Fawcett and Hulbert2020; Wixted Reference Wixted2004). As the interval between the acquisition of new information and election day lengthens, other information becomes increasingly likely to crowd out previously acquired information (Miller Reference Miller2013). In combination, memory decay and crowding-out effects make it likely that the effects of VAA usage decrease over time. Still, we expect that VAA effects remain visible over the course of an election campaign, for two reasons. First, VAAs tend to be released in relatively close temporal proximity to elections (i.e., days or weeks before election day). Second, the information VAAs show is unique; there is no other comparable source showing personalized information on policy proximity. We argue that this makes it likely that VAA users, or at least some VAA users, retain the VAA advice over the course of an election campaign.
H4: The effects of VAA usage decrease but remain visible over the course of an election campaign.
Study 1
We test our hypotheses using a randomized experiment incorporated in a four-wave panel survey conducted before and shortly after the 2024 UK General Election. Our experimental design achieves near-universal treatment uptake by embedding the VAA within the survey workflow, lets us estimate VAA effects conditional on the VAA advice, and allows us to trace how VAA effects change over time. We pre-registered our design, hypotheses, and analysis plan with As Predicted.Footnote 2 Minor departures from the pre-registration are reported in Online Appendix  ${\rm{\S}}$2.1.
Experimental design
We recruited participants from Prolific, a research-oriented online access panel. Participants needed to be eligible to vote in the 2024 UK General Election and be resident in England, Scotland, or Wales. We initiated the first panel wave ( $N = 3,964$) 20 days before the election to collect pre-treatment information on socio-demographics and our outcome variables. Participants were informed that they would be invited to three more surveys over the coming weeks, and they were promised a bonus payment if they participate in all surveys. We had survey quotas in place to render the sample approximately representative of the British adult population in terms of sex, age, and region residence. Notably, though, the sample somewhat over-represents voters with high educational attainment as well as voters who intended to vote for Labour (see Online Appendix
 ${\rm{\S}}$2.2 for sample descriptives).
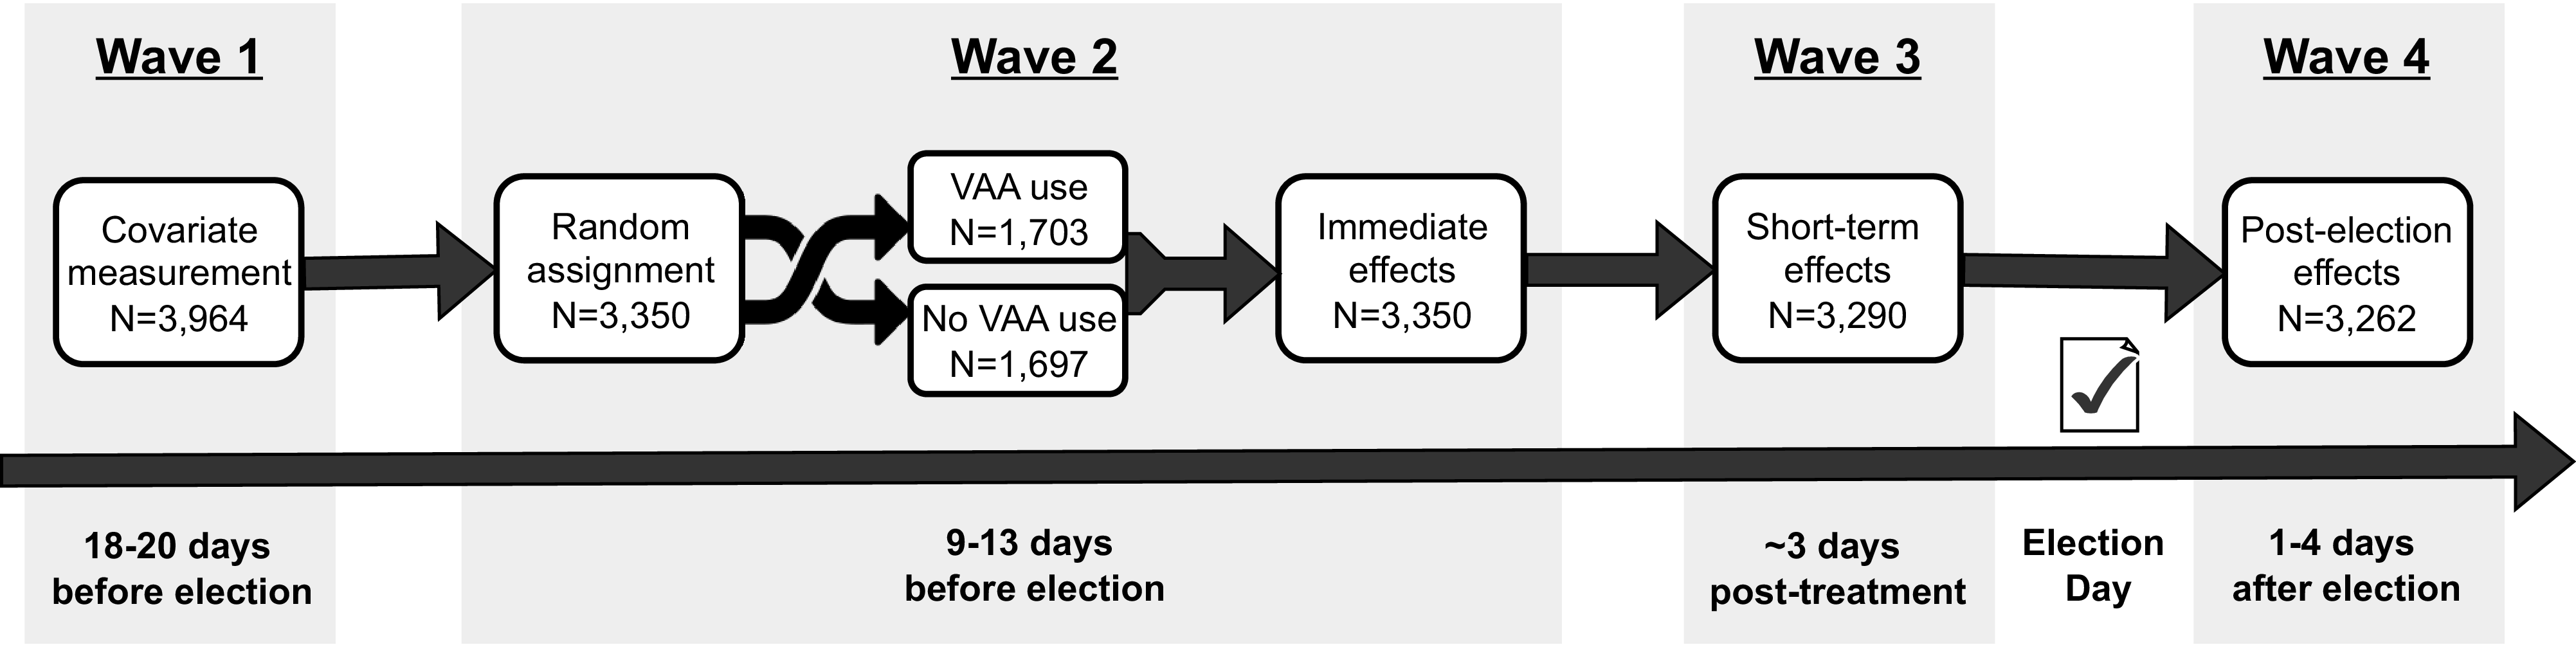
We initiated the second panel wave, which included our experimental manipulation, about a week after the first (see Figure 1). Half of wave 2 participants were randomly assigned a prompt asking them to complete a VAA called WhoGetsMyVote (see Online Appendix  ${\rm{\S}}$2.3 for the complete prompt). The prompt informed participants that WhoGetsMyVote is an online voter information tool designed by researchers from leading British universities that will show them how close political parties are to their preferred policy positions. Participants were told that they must visit an external website and will then return to the survey platform. Finally, they were informed that they would only be able to proceed with the survey if they entered a completion code, which would appear after 30 seconds on the VAA results screen in the form of a pop-up message.Footnote 3 This creates strong incentives for participants to comply and complete the VAA. Prolific requires that participants receive a financial reward for every survey they take, but receipt of that reward is tied to survey completion. Hence, almost all of the 1,703 participants assigned to the treatment condition (99.7%) completed the VAA.Footnote 4 Meanwhile, the control group was not asked to complete WhoGetsMyVote and never left the survey platform.
Overview of study 1.

The design of WhoGetsMyVote closely followed that of other VAAs. First, VAA users were asked to select their region of residence and then received information on the purpose of the application and the data protection policy. Next, VAA users were asked to provide their opinions on 25 salient policy issues using five-point Likert scales ranging from ‘completely disagree’ to ‘completely agree’. Finally, the application compared users’ policy preferences with expert-coded party positions and then showed the results in the form of a bar chart ranking the different parties from closest to most distant across all 25 policy issues. The number of parties included in the ranking was five in England, six in Wales, and seven in Scotland. Proximity between users and parties was calculated using the city block algorithm (Mendez Reference Mendez2012). Figure 2 shows an example policy question and VAA result. Consistent with the sample’s leftward skew, left-wing parties were more frequently recommended as the closest match compared to right-wing parties.Footnote 5 Online Appendix  ${\rm{\S}}$2.4 contains additional details on the design of WhoGetsMyVote, including how we coded party positions and the wordings of all policy questions.
Example policy question and VAA advice (WhoGetsMyVote).
Note: To optimize the user experience on small screens, WhoGetsMyVote users were asked to indicate their agreement to policy proposals using a smiley rating system. It was clearly explained that the different smileys represent different levels of agreement, ranging from complete disagreement (dark red, unhappy smiley) to complete agreement (dark green, happy smiley).

To ensure access to the VAA advice seen by the treatment group, we personalized the weblink participants used to visit WhoGetsMyVote with a unique identifier. This enables us to match VAA records with survey records and recreate the advice treated participants received. In addition, we asked control participants the same 25 policy questions that the treatment group completed as part of the VAA in the context of our survey. Analogously to timing studies (Garry, Tilley, Matthews et al. Reference Garry, Tilley, Matthews, Mendez and Wheatley2019; Germann, Mendez, and Gemenis Reference Germann, Mendez and Gemenis2023), this allows us to establish the advice control participants would have received had they been assigned to the treatment group. To prevent survey mode effects, we used the same smiley rating system used in the VAA (see Figure 2). The treatment and control groups are indistinguishable in terms of their socio-demographic profile and the VAA advice they received or would have received, as we would expect under random assignment (see Online Appendix  ${\rm{\S}}$2.5).
We asked both the treatment and the control groups the same set of outcome questions immediately after the experimental manipulation. In addition, we re-invited all wave 2 participants to participate in two follow-up surveys featuring the same outcome questions. On average, wave 3 was administered 3.2 days after wave 2. Wave 4 was administered the day after the election (12.8 days after wave 2 on average). As is common in panel studies, there was some attrition between panel waves, but attrition was relatively modest, particularly from wave 2 onward. Out of 3,964 wave 1 participants, 3,350 (85%) completed wave 2; 3,290 of the 3,350 wave 2 participants then returned to complete wave 3 (98%), while 3,262 returned to complete wave 4 (97%). Panel attrition was comparable in the two experimental groups (see Online Appendix  ${\rm{\S}}$2.6).
Outcomes
We assess the effects of VAA usage on participants’ (1) perceived proximity to parties on policy issues, (2) party preferences, and (3) electoral participation. We measured participants’ perceived policy proximity by asking them to rate, on a scale from 0 to 10, how close the parties included in the VAA advice are to them on policy issues. We measured party preferences by asking participants to rate, on a scale from 0 to 10, the likelihood that they would ever vote for the parties included in the VAA advice. In addition, we asked participants which party they intend to vote for (waves 2 and 3) or which party they actually voted for (wave 4) in the 2024 UK General Election. These two measures have complementary strengths. On the one hand, the propensity to vote questions allow us to establish the effects of VAA usage on participants’ complete set of party preferences. On the other hand, the binary vote intention and vote choice questions allow us to test whether VAA usage has consequences for voters’ intended and actual behavior at the ballot box. Finally, we measured electoral participation by asking participants to rate, on a scale from 0 to 10, how likely it is that they participate in elections. In addition, we asked participants whether they intend to participate (waves 2 and 3) or actually participated (wave 4) in the 2024 UK General Election. Online Appendix  ${\rm{\S}}$2.7 contains the exact wordings of all outcome questions and summary statistics.
Estimation
Our hypotheses make different types of predictions depending on the outcome variable. On the one hand, we expect a simple average increase in the probability of electoral participation after VAA usage. This allows us to test the effects of VAA usage on turnout using the following regression set-up:
 ${Y_{iw}} = \alpha + {\beta _1}{D_i} + {\beta _2}{X_i} + {\varepsilon _{iw}}$
where  ${Y_{iw}}$ represents participant
 $i$’s actual or intended electoral participation, as declared in panel wave
 $w$,
 ${D_i}$ whether or not participant
 $i$ was assigned to the treatment group,
 ${X_i}$ a vector of covariates, and
 ${\varepsilon _{iw}}$ an error term. The list of covariates includes a standard set of socio-demographics as well as pre-treatment information on a participant’s turnout intention (see Online Appendix
 ${\rm{\S}}$2.8 for variable definitions and summary statistics). Controlling for pre-treatment outcome measures allows us to substantially increase the precision of causal estimates (Clifford, Sheagley, and Piston Reference Clifford, Sheagley and Piston2021).
On the other hand, we expect that the effects of VAA usage on perceived policy proximity and party preferences depend on the VAA advice. To capture the conditional nature of these expectations, we follow Garry, Tilley, Matthews et al. (Reference Garry, Tilley, Matthews, Mendez and Wheatley2019) and Germann, Mendez, and Gemenis (Reference Germann, Mendez and Gemenis2023) and estimate linear multiplicative interaction models of the following form:
 ${Y_{ijw}} = \alpha + {\beta _1}{D_i} + {\beta _2}{Z_{ij}} + {\beta _3}{D_i}{Z_{ij}} + {\beta _4}{X_{ij}} + {\gamma _j} + {\varepsilon _{ijw}}$
where  ${Y_{ijw}}$ represents participant
 $i$’s perception of proximity to party
 $j$ in wave
 $w$, or, alternatively, participant
 $i$’s preference for party
 $j$ in wave
 $w$. As before,
 ${D_i}$ represents participant
 $i$’s treatment status, while
 ${Z_{ij}}$ represents the rank party
 $j$ had, or would have had, in participant
 $i$’s VAA advice. More specifically,
 ${Z_{ij}}$ represents a vector of binary variables indicating whether a given party was, or would have been, ranked first or not, second or not, third or not, etc. in the VAA advice. Since only treated participants were actually exposed to the VAA advice, the interaction between treatment status and the VAA party ranking (
 ${D_i}{Z_{ij}}$) reflects the effect of VAA usage. We dichotomize the VAA party ranking so as to flexibly estimate treatment effects for different party ranks. As before, we control for pre-treatment measures of our outcome variables and socio-demographics (
 ${X_{ij}}$). In addition, we now also include party fixed effects (
 ${\gamma _j}$). This allows us to account for systematic differences in how participants evaluate different parties and increase the precision of causal estimates.
We estimate all models using ordinary least squares (OLS) regression. Since participants rated multiple parties and are therefore observed more than once, we cluster standard errors at the participant level when analyzing proximity to parties and party preferences.
Results
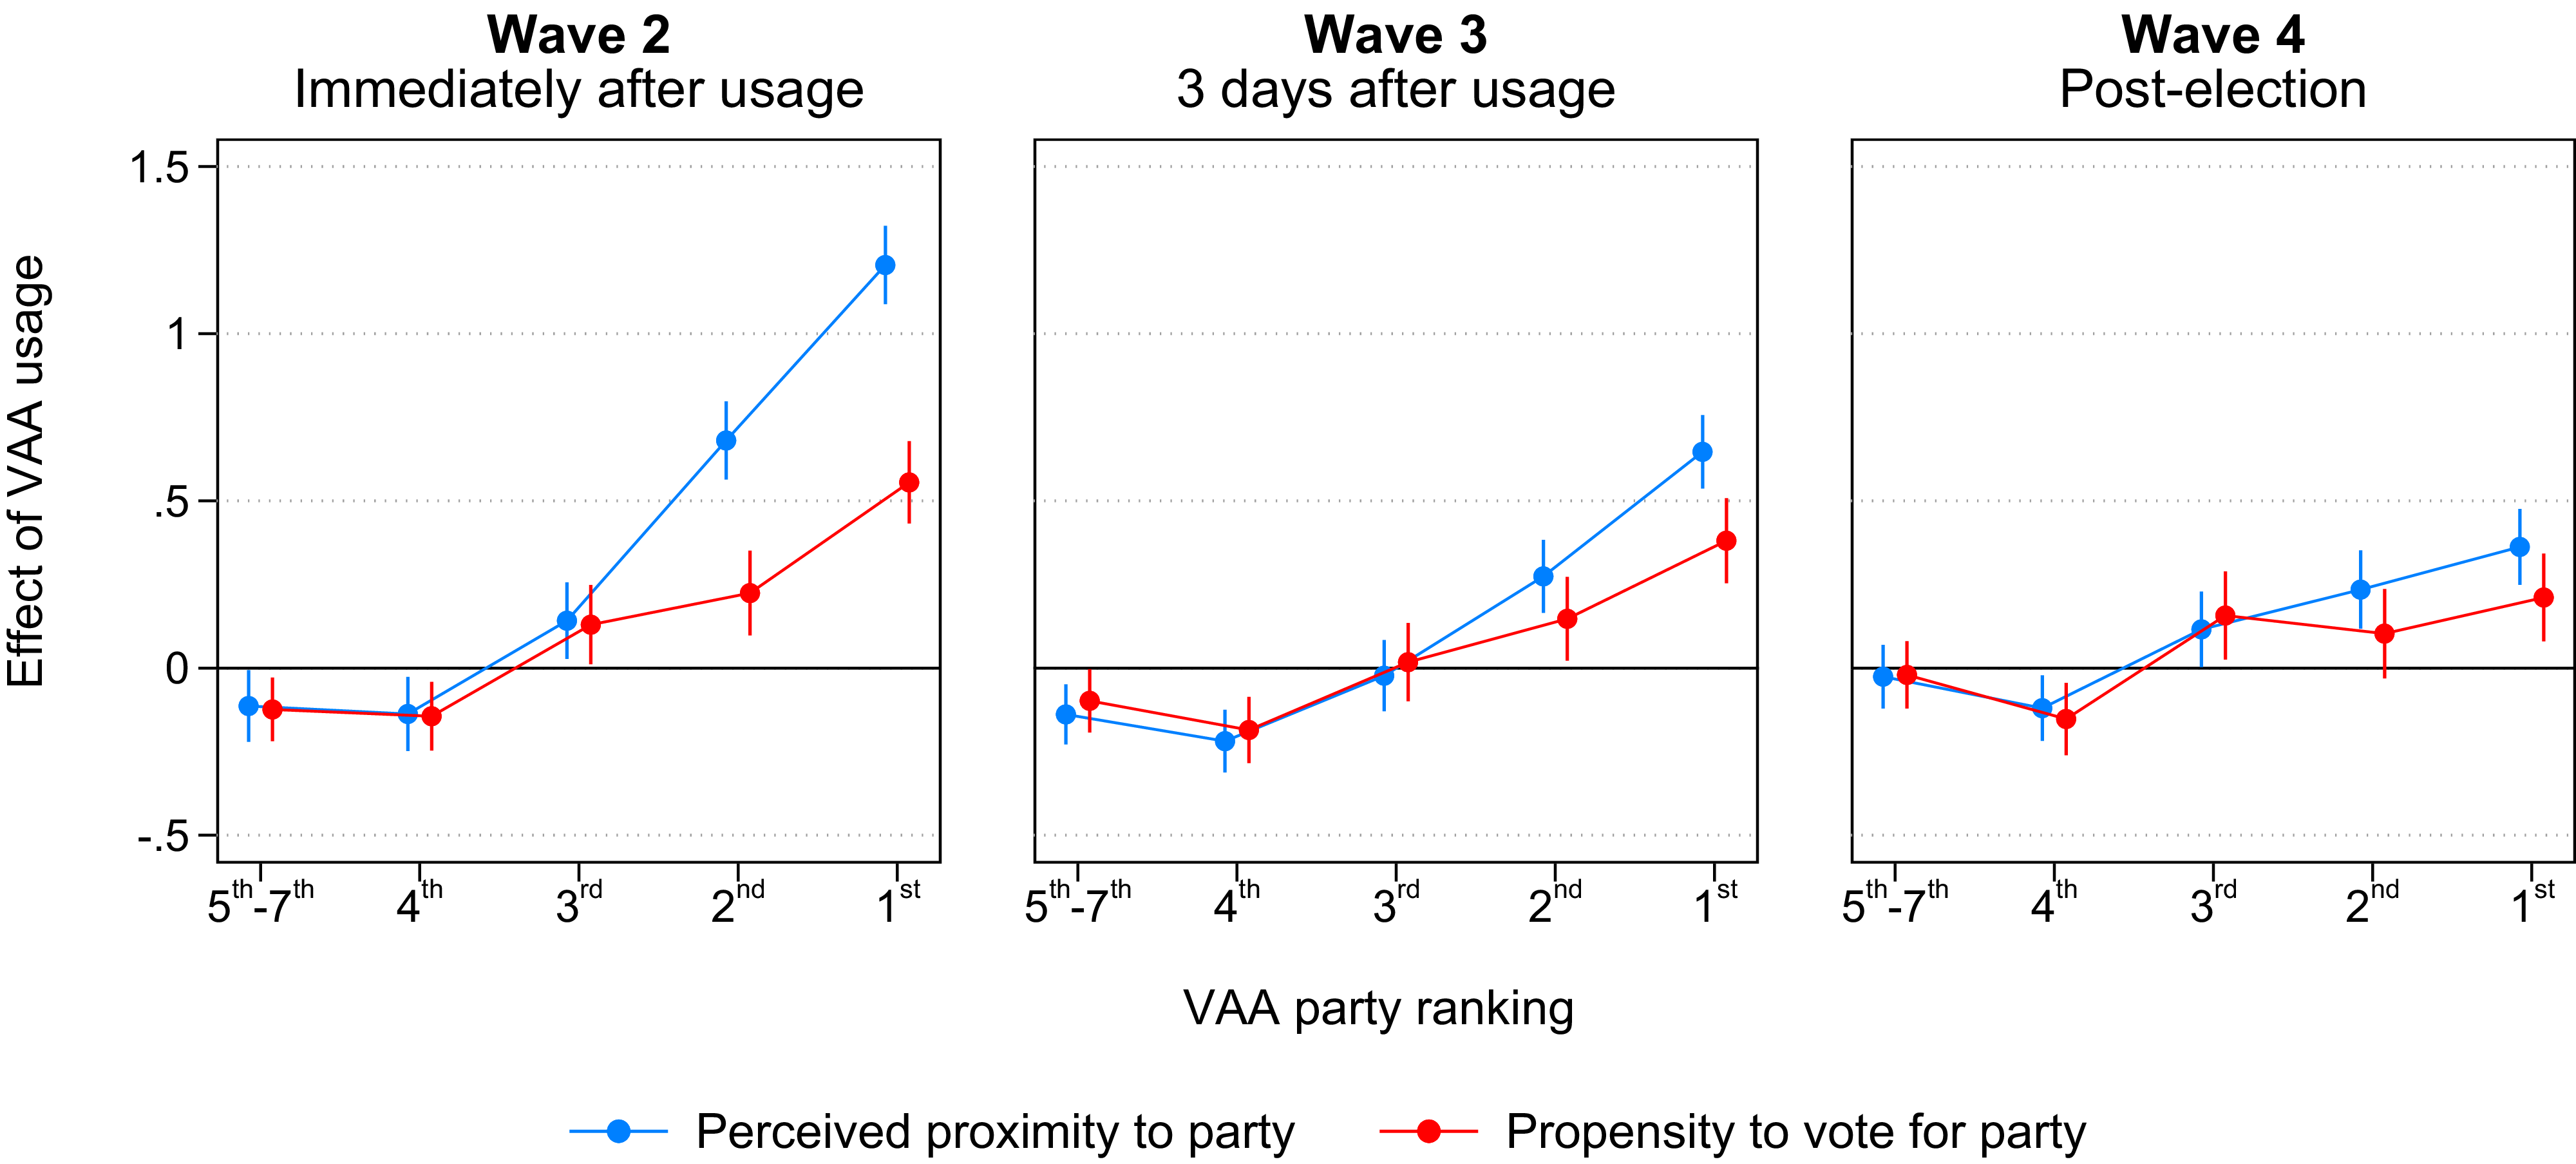
We begin by discussing the effects of VAA usage on the perceived proximity to parties on policy issues (see the blue estimates in Figure 3). Consistent with theoretical expectations, we find that VAA users updated their proximity perceptions after VAA usage and that this effect is largest immediately after VAA usage. Specifically, a VAA user rated the top-ranked party about 1.2 points closer on policy issues immediately after usage ( $p{\rm{ }} \lt 0.001$), the second-ranked party about 0.7 points closer (
 $p{\rm{ }} \lt 0.001$), and the third-ranked party about 0.1 points closer (
 $p{\rm{ }} \lt 0.05$). These represent sizable increases of approximately 5% to almost 40% of a standard deviation. Meanwhile, treated participants saw the parties that are ranked lowest by the VAA as slightly less close after VAA usage (about 0.1 points;
 $p{\rm{ }} \lt 0.05$). Hence, VAA usage can both increase and decrease perceived proximity on policy issues. However, it is notable that the negative effects are comparatively small. This may be because voters find it easier to identify parties they disagree with and harder to adjudicate between parties they have some agreement with. Another reason could be that VAA users are more focused on the top part of the VAA party ranking, which is the most relevant for electoral decisions.
Effects of VAA usage on perceptions of policy proximity and the propensity to vote for parties.
Note: All effects are conditional on the rank of a party in the VAA. Only the treatment group was actually exposed to this ranking. The spikes represent 95% confidence intervals. The underlying regression results are shown in Online Appendix  ${\rm{\S}}$2.9.1.

Over time, the effects of VAA usage on perceived policy proximity decrease in size, but, as predicted, they remain visible after the election. For example, the boost experienced by the top-ranked party decreases from +1.2 points immediately after usage (or +39% of a standard deviation) to +0.6 points (or +21% of a standard deviation) three days after VAA usage ( $p{\rm{ }} \lt 0.001$), and to +0.4 points (or +11% of a standard deviation) after the election (
 $p{\rm{ }} \lt 0.001$). This points to significant effect dissipation.Footnote 6 Still, these results imply that a VAA user rated the top-ranked party as substantially closer on policy issues almost two weeks after VAA usage compared to a non-user.
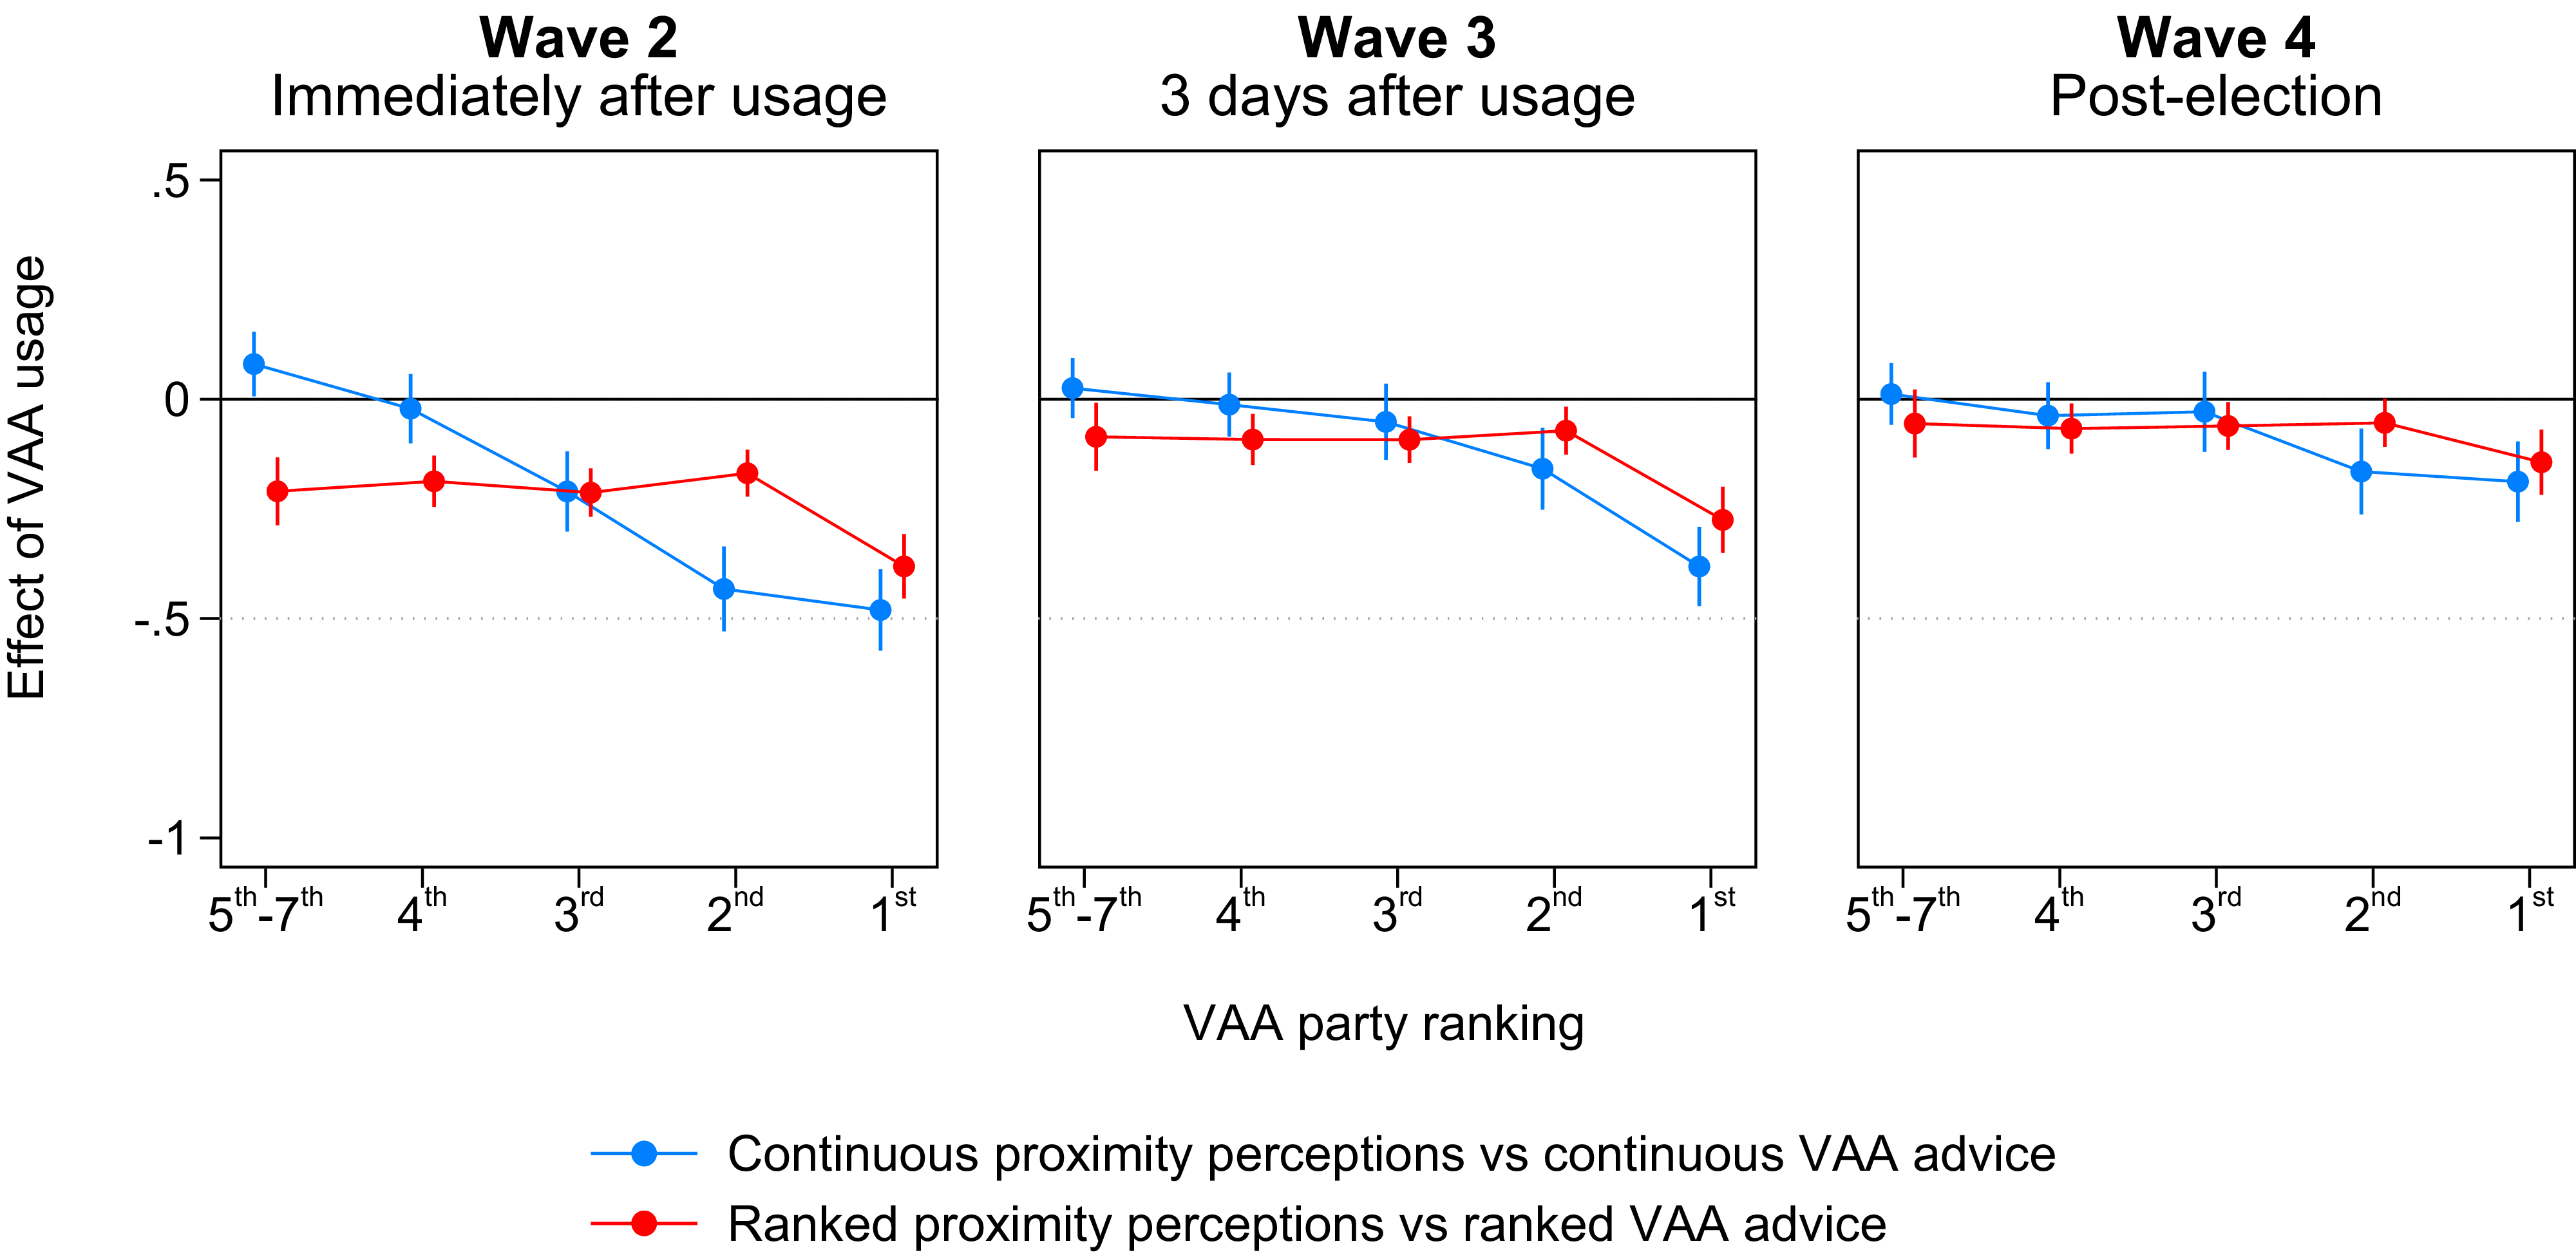
Do the changes in proximity perceptions mean that VAA users’ perceptions became more accurate? As noted above, this depends in part on the extent to which VAA users avoid overcorrections and actually move closer to the VAA advice. Reassuringly, Figure 4 shows that the absolute distance between perceived policy proximity and objective policy proximity (as measured by the VAA) indeed decreased after VAA usage. This conclusion applies irrespectively of how we measure this distance: (1) in terms of the implied ranking of parties (see the estimates in red) or (2) in terms of the underlying continuous proximity and VAA advice scores (see the estimates in blue).Footnote 7 The effect sizes are substantial: the distance between perceived and objective proximity decreases by up to 36% (ranked measure) and 29% (continuous measure) of a standard deviation. Again, the largest effects emerge for the top-ranked party. Overall, this exploratory analysis indicates that voters do not only update their proximity perceptions after VAA usage; they move closer to the VAA advice. Assuming that VAA advice is accurate, VAA usage therefore improves voters’ understanding of their relative position in the policy space.
Effects of VAA usage on the difference between perceived proximity to parties and objective proximity to parties (as measured by the VAA).
Note: All effects are conditional on the rank of a party in the VAA. Only the treatment group was actually exposed to this ranking. The spikes represent 95% confidence intervals. The underlying regression results are shown in Online Appendix  ${\rm{\S}}$2.9.2.

Next, we consider whether VAA usage led participants to also update their party preferences. As the red estimates in Figure 3 show, this was indeed the case: VAA users expressed a higher propensity to vote for a party if they were told that they were close to that party on policy issues and a lower propensity to vote for a party if they were told that this party was far away. As before, these effects decrease over time but remain visible after the election. However, what is notable is that the effects of VAA usage on party preferences are smaller compared to the effects on perceived proximity. For example, a VAA user’s propensity to vote for the top-ranked party increased by about half as much when compared to proximity beliefs: +0.6 points (or +16% of a standard deviation) immediately after usage ( $p{\rm{ }} \lt 0.001$), +0.4 points (or +11% of a standard deviation) after three days (
 $p{\rm{ }} \lt 0.001$), and +0.2 (or +6% of a standard deviation) after the election (
 $p{\rm{ }} \lt 0.01$). A possible explanation is that voters do not care solely about policy proximity but also about other factors, such as a party’s performance in government, leadership, or chances of winning.
The propensity to vote questions allow us to establish the overall effect of VAA usage on party preferences. However, as in most other electoral settings, voters ultimately cast a vote for a single party in British general elections. Next, we therefore consider whether VAA usage affected the intended and actual vote choices of participants. We find that VAA usage boosted the intention to vote for the top-ranked party (and only the top-ranked party) by 3.7 percentage points immediately after usage ( $p{\rm{ }} \lt 0.001$) (see Figure 5). This effect remains similarly sized (+3 percentage points;
 $p{\rm{ }} \lt 0.001$) three days after usage; however, it decreases to +1.6 percentage points and is no longer statistically significant after the election (
 $p = 0.14$). That said, there are two important qualifications to the latter result.
Effects of VAA usage on vote intention, actual vote choice, and hypothetically preferred vote choice.
Note: All effects are conditional on the rank of a party in the VAA. Only the treatment group was actually exposed to this ranking. The spikes represent 95% confidence intervals. The underlying regression results are shown in Online Appendix  ${\rm{\S}}$2.9.3.

First, while VAA usage had no statistically significant average effect on actual vote choice, subgroup analyses suggest it may affect the vote choices of an important subset of voters: undecided voters. In Online Appendix  ${\rm{\S}}$2.10, we investigate several pre-registered hypotheses about treatment effect heterogeneity. One of our key findings is that VAA usage tends to have stronger effects on the party preferences of undecided voters. The bottom-left panel in Figure 5 shows a key implication: while VAA usage had practically zero effect on the vote choices of voters who already had a clear vote intention before VAA usage, it increased the probability of undecided voters casting a vote for the top-ranked party by 6.7 percentage points (
 $p{\rm{ }} \lt 0.05$).Footnote 8
Second, the UK constitutes a comparatively hard case when it comes to VAAs affecting vote choice. Voters in a first-past-the-post electoral system need to consider that smaller parties may not stand a realistic chance of winning in their constituencies. In an electoral context such as the UK’s, changes in party preferences may therefore often not translate into changes in vote choice due to tactical considerations. In contrast, similar tactical considerations are less pronounced in countries with proportional electoral systems, which could lead to stronger effects on vote choice.
Our single-country experiment does not allow us to directly test the hypothesis that VAA effects on vote choice depend on the electoral context. However, our data does allow us to get a basic sense of how VAA usage affects vote choice in the absence of tactical constraints. In panel wave 4, we asked participants why they voted for the party they did. If participants said they had voted tactically, we subsequently asked them which party they would have actually preferred. This allows us to establish tactical voters’ hypothetically preferred vote choices. In the bottom-center panel in Figure 5, we show that the average effect of VAA usage on voting for the top-ranked party almost doubles in size, from +1.6 to +3 percentage points, when we replace the actual choices of tactical voters (about 14% of our sample) with their hypothetically preferred choices ( $p{\rm{ }} \lt 0.05$). Though necessarily speculative, this exploratory analysis suggests that VAAs may affect vote choice more strongly in countries with proportional electoral systems, where voters are freer to express their preferences at the ballot box.
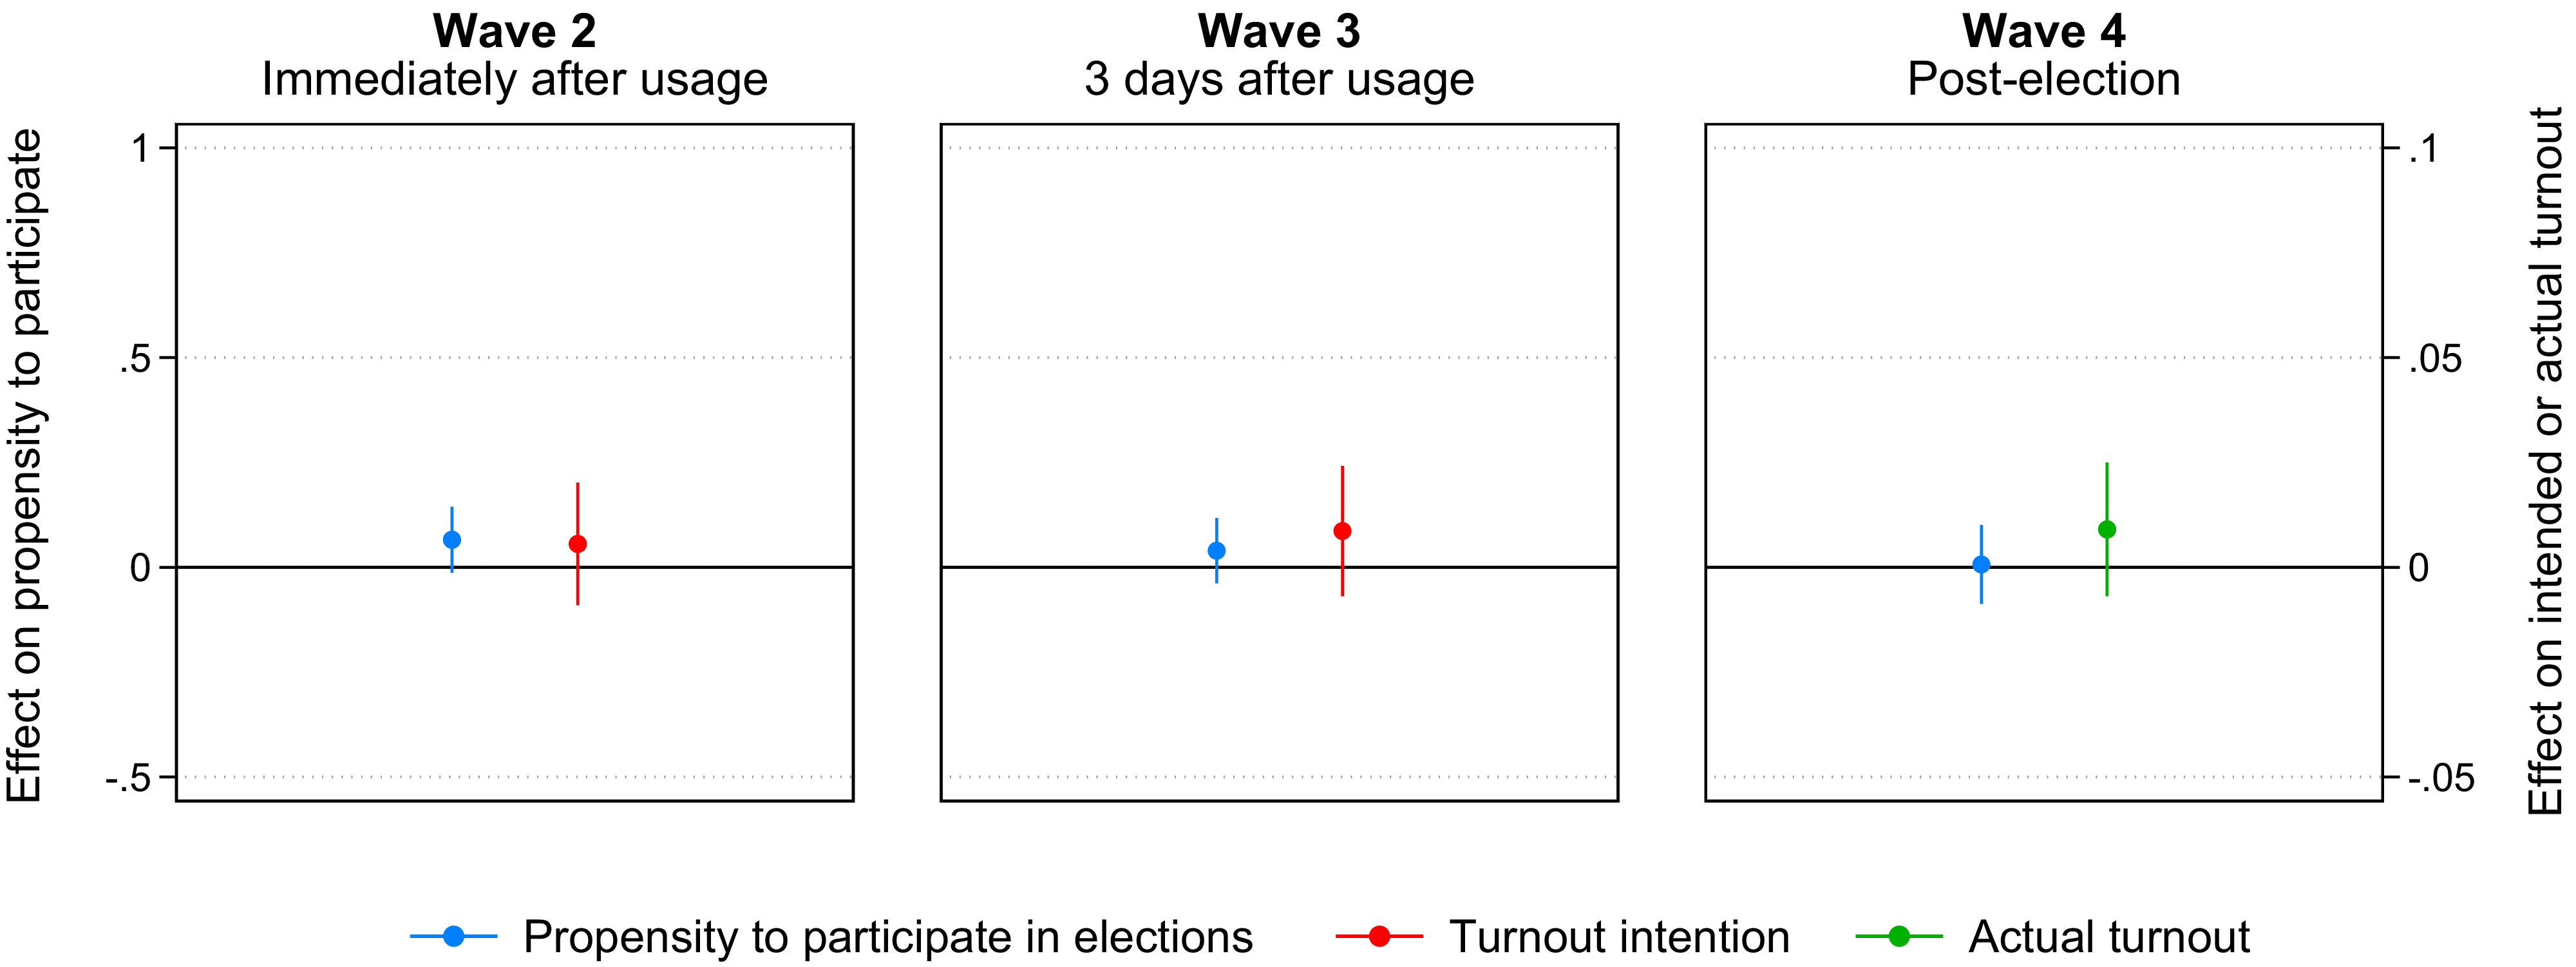
Finally, Figure 6 shows the average effects of VAA usage on the general propensity to participate in elections as well as intended and actual turnout in the 2024 UK General Election. Contrary to theoretical expectations, we find no evidence for a VAA effect on electoral participation. While the point estimates are consistently positive, they never reach statistical significance. This conclusion applies irrespectively of how we measure electoral participation, and it applies in all panel waves. We also do not find an effect on electoral participation in any of the subgroups we consider. The only partial exception is political interest: VAA users who expressed low political interest reported a higher intention to participate in the election immediately after VAA usage. However, this effect vanishes shortly afterwards (see Online Appendix  ${\rm{\S}}$2.10).
Effects of VAA usage on electoral participation.
Note: The spikes represent 95% confidence intervals. The underlying regression results are shown in Online Appendix  ${\rm{\S}}$2.9.4.

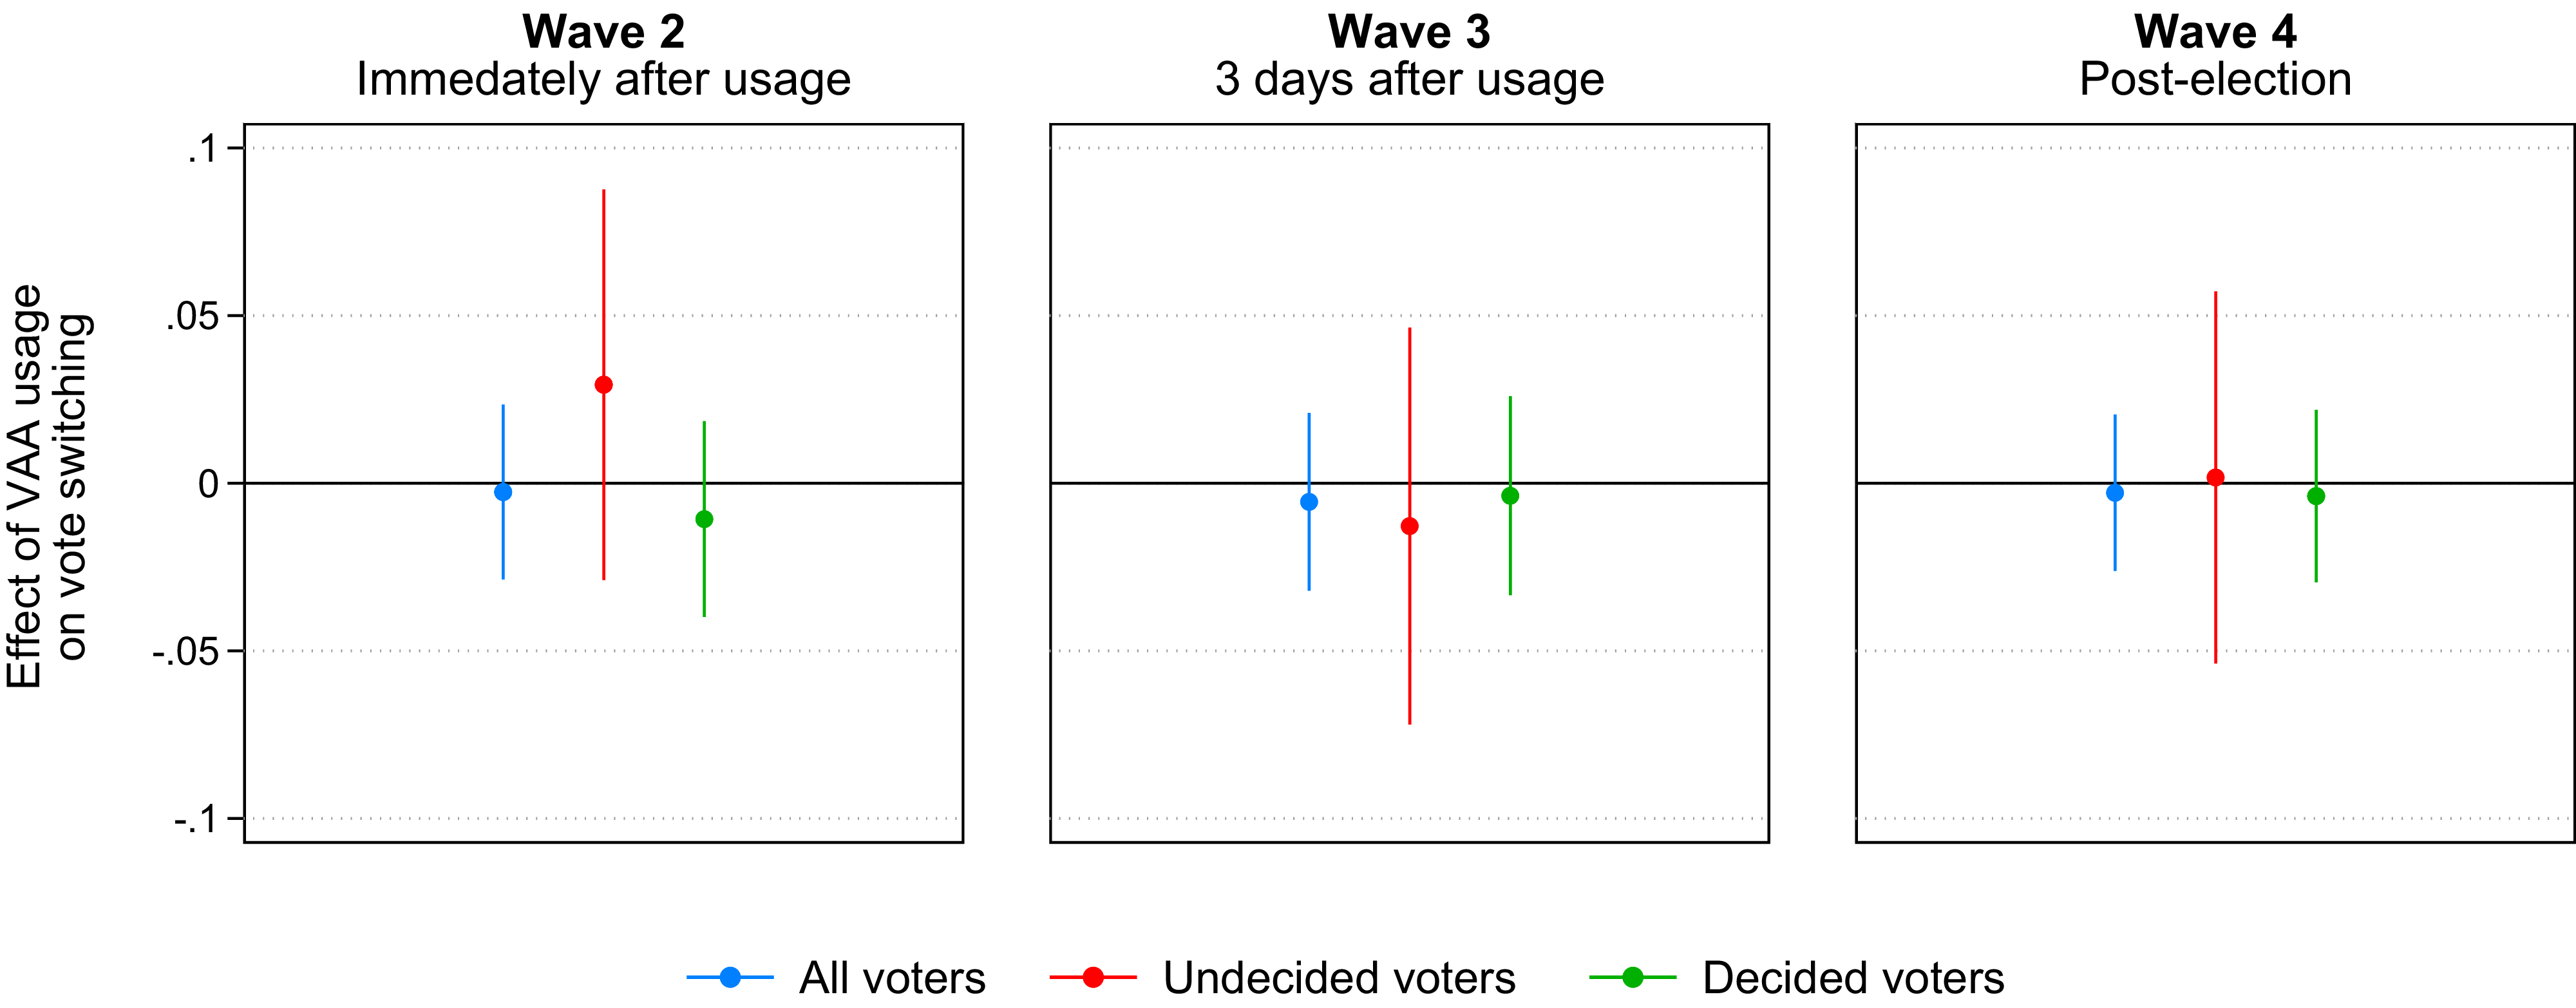
Overall, the results of study 1 diverge from the findings of most previous experimental studies – or, to be more precise, previous experimental studies that have used the encouragement design. Similar to the latter, we find no evidence for a VAA effect on electoral participation. Contrary to encouragement studies, however, we find clear evidence that VAA usage has durable effects on voters’ party evaluations. To investigate the reasons for this discrepancy, we replicate the kind of analysis that encouragement studies tended to report: the average effect of VAA usage on vote switching over the course of the campaign. As Figure 7 shows, we find no evidence for an effect on vote switching in any of the panel waves, even among undecided voters. This underlines the importance of having access to the VAA advice participants actually received if they were treated or potentially could have received if untreated. Despite the higher compliance rates and increased statistical power of our study, we too would have concluded that VAA usage does not affect party evaluations without access to data on participants’ actual or potential VAA advice.
Effects of VAA usage on vote switching.
Note: We treat participants as vote switchers if their vote intention (waves 2 and 3) or actual vote choice (wave 4) differed from their vote intention in wave 1. The results are based on linear regressions including the same set of socio-demographics and political attitudes. The spikes represent 95% confidence intervals. The underlying regression results are shown in Online Appendix  ${\rm{\S}}$2.9.5.

Robustness checks
A potential concern with the intention-to-treat effects we report is that VAAs (including but not limited to WhoGetsMyVote) were publicly available during the election campaign. Hence, it is possible that control participants were also exposed to VAA advice. Fortunately, the UK is not a country where VAAs are very popular, which limits contamination in the control group. Still, about 17% of control participants reported that they used a VAA over the course of the campaign,Footnote 9 which could lead to downward bias. In Online Appendix  ${\rm{\S}}$2.11, we re-estimate all models using two-stage least squares regressions, where the first stage predicts actual VAA usage using treatment assignment as an instrument, and the second stage estimates the effects of VAA usage on our various outcome variables. The estimated effects of VAA usage become somewhat larger, but the differences are marginal. Notably, we still find no evidence for an effect on electoral participation.
We report several other robustness checks in Online Appendix  ${\rm{\S}}$2.11. First, we re-estimate all models while not including any covariates or fixed effects. Second, we dropped speeders who rushed through the second panel wave when treatment was applied. Third, we re-estimate all models with binary outcome variables using logistic regression. Fourth, we restrict the sample to participants who participated in all four panel waves. Finally, we show the effects of VAA usage on perceived policy proximity and party preferences when we do not interact treatment status with the ordinal ranking of parties in the VAA from closest to most distant on policy issues, but with the underlying continuous (−100 to +100) proximity scores. The results are always similar.
Study 2
In study 1, we effectively forced voters to complete a VAA, including voters who would not otherwise have used a VAA. While this allows us to achieve near-universal compliance in the treatment group, a potential concern is that effects may not directly generalize to real-world VAA users, who may differ in motivation, attention, and socio-demographic profile. In study 2, we draw on data from a concurrent field experiment using the timing design to compare the effects of VAA usage in the real world with the effects we measured in study 1.
Experimental design
Study 2 leverages the circumstance that the VAA we administered in study 1 was simultaneously released to the general public. The public version of WhoGetsMyVote was made freely available online 17 days before the 2024 UK General Election and promoted via print, broadcast, online, and social media, including paid advertisements on Facebook, Instagram, and X/Twitter. It was used around 125,000 times to generate a voting recommendation. After data cleaning (e.g., removal of repeated entries from the same individuals), we are left with a dataset comprising approximately 100,000 British voters (see Online Appendix  ${\rm{\S}}$3.1 for details). However, for reasons we explain below, we only analyze a subset of approximately 29,000 users. Our VAA sample, including our smaller analysis sample, significantly over-represents highly educated voters and, to a lesser extent, younger voters (see Online Appendix
 ${\rm{\S}}$3.2). Such biases are relatively typical of VAA user samples (Marschall and Schmidt Reference Marschall, Schmidt, Farrell and Schmitt-Beck2008; Vassil Reference Vassil2011). While our study 2 sample is therefore clearly not representative of the British adult population, it broadly mirrors the population of VAA users.
The public release of WhoGetsMyVote and the version completed by study 1 participants coexisted as broadly identical websites on different domains. Relevant differences between the two versions included, first, that the public release contained several additional questions to gather information on users’ socio-demographic profile. We leverage this information for the measurement of covariates (see Online Appendix  ${\rm{\S}}$3.3). Second, the public release did not include the pop-up message with the survey completion code, but instead included an experimental manipulation that was built directly into the VAA. Specifically, following Garry, Tilley, Matthews et al. (Reference Garry, Tilley, Matthews, Mendez and Wheatley2019) and Germann, Mendez, and Gemenis (Reference Germann, Mendez and Gemenis2023), we randomized the time when VAA users were asked about their party preferences and turnout propensity. One experimental group was asked about their party preferences before exposure to the VAA advice and their turnout propensity after exposure to the VAA advice. This order was reversed for the second experimental group (see Figure 8).
Overview of study 2.

Randomizing whether outcome questions are asked before or after exposure to VAA advice allows us to estimate the immediate causal effects of exposure to VAA advice. Analogously to study 1, we measure party preferences by asking users how likely it is that they will ever vote for different parties on a scale from 0 to 10.Footnote 10 Also similar to study 1, we measure electoral participation by asking VAA users to rate the likelihood with which they will participate in the 2024 UK General Election on a scale from 0 to 10. Since this version of the VAA was released to the general public, we kept the platform user-friendly and limited the number of questions. Hence, we did not also ask users about their binary vote or turnout intention. For the same reason, we did not include a question on proximity perceptions. While we are therefore unable to replicate the full set of study 1 results, we can contrast the immediate effects of artificially induced and real-world VAA usage on two important outcomes: the propensity to participate in elections and the propensity to vote for different parties. Online Appendix  ${\rm{\S}}$3.4 contains the exact wordings of both outcome questions as well as summary statistics.
Following previous timing studies, outcome questions asked before exposure to VAA advice were integrated in the normal VAA flow while outcome questions asked after exposure to VAA advice were asked as part of an opt-in survey. More specifically, 30 seconds after exposure to the VAA advice, a pop-up message appeared asking users whether they would be willing to answer an additional question to help our research. If they said yes (‘opted in’), they were then queried about their party preferences or turnout propensity, depending on the experimental group. Similar to previous timing studies, this set-up led to differential attrition: while more than 90% of users answered outcome questions asked before exposure to the VAA advice, only around 30% of users answered the outcome questions asked after exposure to the VAA advice because they either declined to take part in the opt-in survey or had already left the page and never saw the opt-in prompt. Following Garry, Tilley, Matthews et al. (Reference Garry, Tilley, Matthews, Mendez and Wheatley2019) and Germann, Mendez, and Gemenis (Reference Germann, Mendez and Gemenis2023), we therefore restrict all our statistical analyses to users who participated in the opt-in survey (i.e., we compare groups A and C in Figure 8).
Restricting the analysis to users who participated in the opt-in survey protects the internal validity of our causal estimates. Groups A and C had the exact same experience, except that one was asked about party preferences before exposure to the VAA advice and the other about turnout propensity. Both agreed to take part in the opt-in survey, with about the same probability (28% vs. 30%); accordingly, there are also no differences between groups A and C in terms of their socio-demographic profile and the VAA advice they received (see Online Appendix  ${\rm{\S}}$3.5). By restricting the analysis to groups A and C, we therefore ensure that we are comparing like with like. However, it is important to note that our approach involves a potential trade-off with external validity. Users who participated in the opt-in survey were older (32% of opt-in users were 55 years or older compared to 18% among the rest), more likely to have university education (72% vs. 68%), and more likely to express high political interest (46% vs. 31%). Study 2 estimates may therefore best be interpreted as referring to somewhat older, more highly educated, and more politically engaged VAA users.
Results
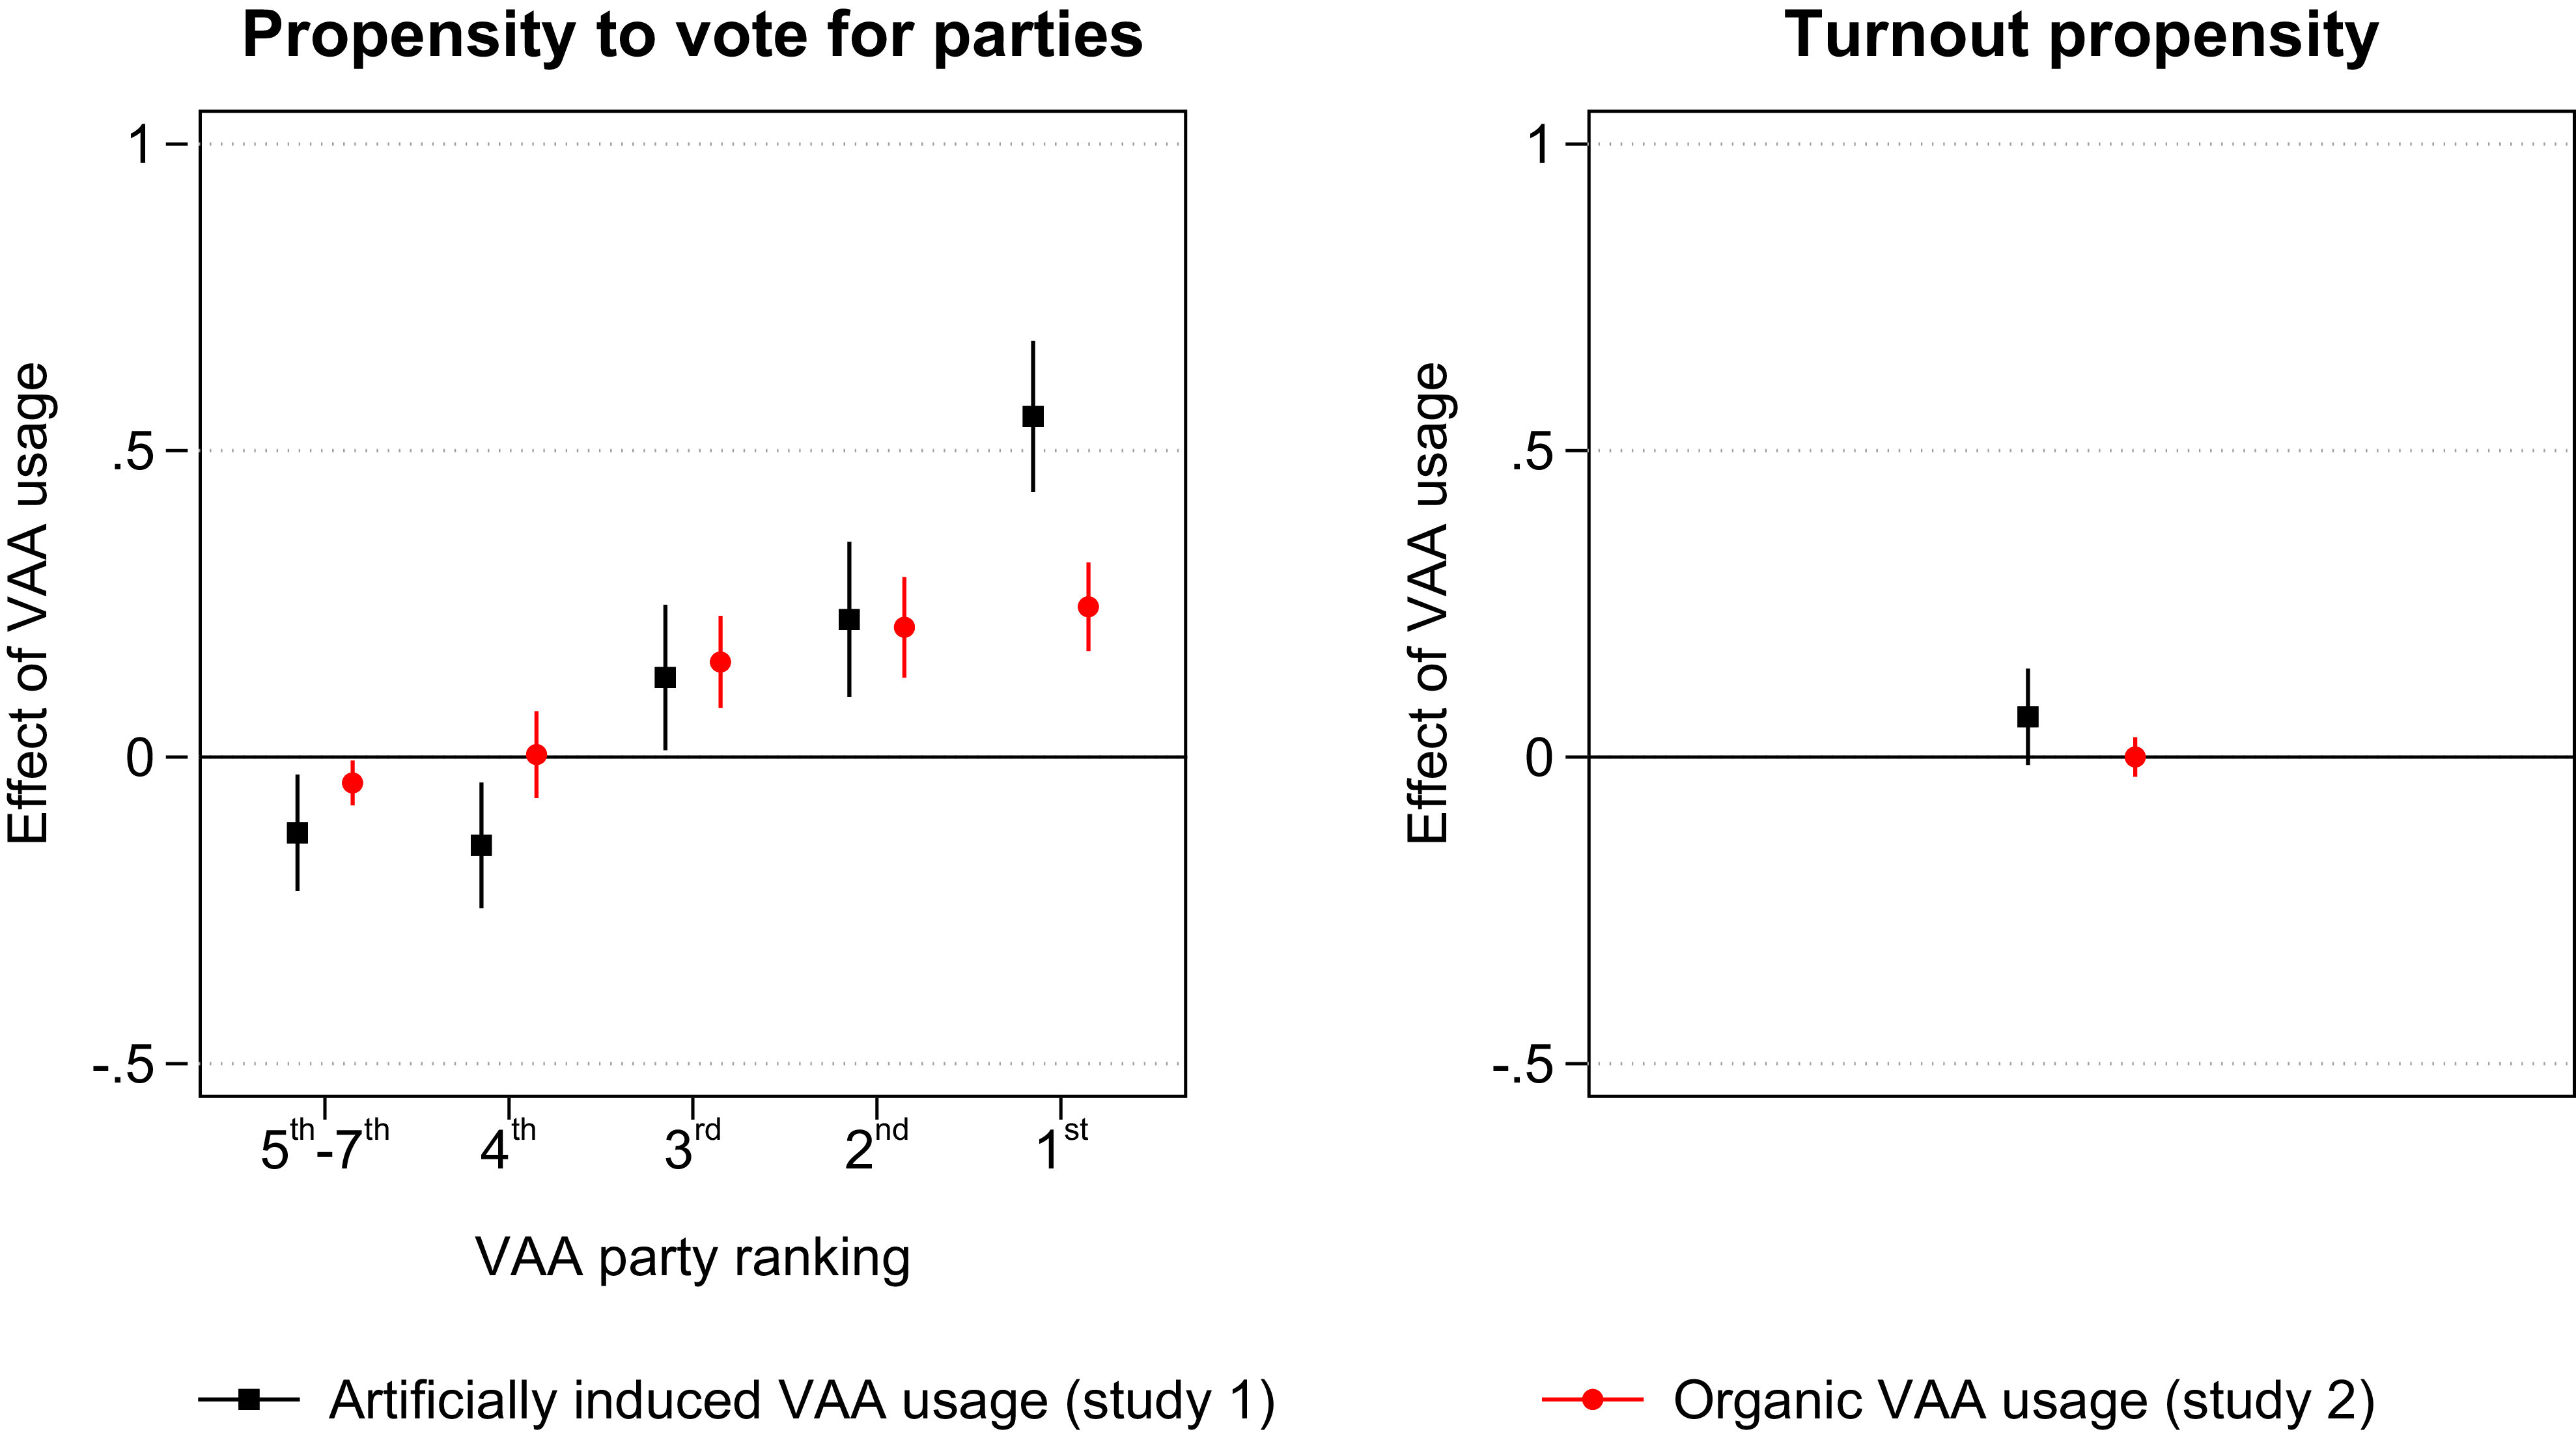
We estimate the effects of exposure to VAA advice analogously to study 1, except that the treatment is now exposure to VAA advice in the real world and not experimentally induced VAA usage. The results suggest that VAA effects are not limited to artificially induced VAA usage (see Figure 9). Similar to study 1, we find that VAA users adjusted their party preferences in line with the VAA advice. Once again, we find that the positive effects for the top-ranked parties are larger than the negative effects for the bottom-ranked parties. Also similar to study 1, we find no effect on turnout intention.
Comparing the effects of artificially induced VAA usage with concurrent real-world effects.
Note: The spikes represent 95% confidence intervals. The underlying regression results are shown in Online Appendix  ${\rm{\S}}$3.6.

That said, there is one notable difference between study 1 and study 2: exposure to VAA advice had significantly bigger effects on party preferences when VAA usage was artificially induced (i.e., in study 1). A possible explanation for the different effect sizes is differences in sample composition: real-world VAA users tend to have above-average education and political interest (Marschall and Schmidt Reference Marschall, Schmidt, Farrell and Schmitt-Beck2008), a tendency that is further strengthened in our analysis sample (see above). This could lead to smaller effects on party preferences since voters who are better informed about politics may be less in need of personalized information on policy congruence, and their party preferences may already be better aligned with parties’ issue positions. In Online Appendix  ${\rm{\S}}$3.7, we report evidence suggesting that differences in sample composition indeed at least partially account for the different effect sizes. However, we also find suggestive evidence that effect sizes differ because of the precise nature of treatment: in study 2, the treatment had a more compound nature due to the availability of an additional graphical display in the public version of WhoGetsMyVote, which seems to have depressed effect sizes. Finally, it is also possible that study 1 participants had higher attention levels and paid more attention to the VAA advice, at least in part because they received a financial reward.
In sum, we find meaningfully sized effects on party preferences in both studies and no effects on turnout intention. This improves confidence that the effects we have documented in study 1 are not limited to the artificial experimental setting. However, VAA effects may be somewhat smaller in the real world, likely for a mix of reasons, including differences in sample composition, differences in the precise nature of treatment, and differences in attention levels.
Conclusion
The results of study 1 show that VAAs fulfill their primary aims. First, voters updated their perceptions of how close they are to parties on policy issues after VAA usage. Second, voters took the VAA advice they received seriously enough to revise their party preferences. Both of these effects decreased over time, but they remained visible throughout the campaign and after the election. Notably, VAA usage also affected voters’ choices at the ballot box, at least among undecided voters.
These results diverge from most earlier experimental literature, which tended to find limited or no causal effects of VAA usage. We argue that this divergence is likely to reflect differences in study design. Study 1 leveraged a new experimental design that improves compliance with treatment assignment and makes it possible to evaluate longer-term VAA effects conditional on the VAA advice. In contrast, most previous experimental studies lacked access to the VAA advice and therefore estimated effects of VAA usage on vote switching, which is likely to obscure VAA effects. As we showed, VAA usage has clear and durable effects on party evaluations once the advice received is taken into account. That said, we found no evidence that VAA usage increases turnout. Hopes that VAAs could help reverse increasing electoral disengagement may thus be overstated.
To assess the ecological validity of our findings, we conducted a simultaneous field experiment using the public version of the same VAA. The effects observed in the field were broadly consistent: VAA usage affected party preferences but not turnout immediately after exposure to VAA advice. This suggests that VAA effects are not limited to artificial settings but likely extend to real-world usage. However, our evidence also suggested that the effects of VAA usage may be somewhat smaller in the real world, at least in part because real-world VAA users tend to have comparatively high political interest and knowledge.
Taken together, our two studies point to the value of VAAs. Many voters have limited knowledge of parties’ policy stances and biased views of their proximity to parties. Our results suggest that VAAs can help rectify this. Critically, compared to many other interventions aimed at increasing political knowledge, VAAs are relatively inexpensive to produce and, given their online nature, are easily scalable (Germann and Gemenis Reference Germann and Gemenis2019). In a number of countries, VAAs are already used by hundreds of thousands or even millions of voters. Wider promotion of VAAs by researchers, governments, the media, or civil society organizations could help spread their benefits even further. By helping voters to develop a better understanding of their policy proximity to parties or candidates, VAAs can support more informed electoral decision-making.
There are several promising avenues for future research. First, the evidence we presented pertains to a single country: the United Kingdom. We argued that the UK represents an advantageous case since VAAs are currently not as popular in the UK, thus reducing contamination in the control group. However, future studies should extend the focus to different countries and consider how VAA effects are shaped by the electoral context. The UK’s majoritarian electoral system imposes significant constraints on voters, which could limit the size of VAA effects. By contrast, voters are freer to express their party preferences in countries with proportional elections, which could lead to larger effects. Furthermore, VAA effects could be shaped by how well-established VAAs are in a country, although it is difficult to predict the direction of this effect. On the one hand, VAA effects may increase where VAAs have gained some authority and credibility over the years. On the other hand, VAA effects could decrease as a result of repeated exposure to similar VAA advice over time or because multiple VAAs are available that offer conflicting advice.
Second, we showed that VAA effects endure, at least partially, over the course of an election campaign. However, our study cannot answer the question whether VAAs also have even more long-term effects. Future studies could explore whether VAAs continue to affect how voters think about politics in the next election and beyond. If they do, this could make VAAs a particularly valuable tool for school settings (Waldvogel, Oberle, and Leunig Reference Waldvogel, Oberle and Leunig2023).
Finally, our findings underline the importance of VAA advice being accurate. Previous literature suggests that the quality of VAA advice depends on the selection and wording of policy questions (Gemenis Reference Gemenis2013; Walgrave, Nuytemans, and Pepermans Reference Walgrave, Nuytemans and Pepermans2009), the coding of party (or candidate) positions (Gemenis and van Ham Reference Gemenis, van Ham, Diego and Stefan2014), and how user and party (or candidate) preferences are aggregated and compared (Germann, Mendez, Wheatley et al. Reference Germann, Mendez, Wheatley and Serdült2015; Mendez Reference Mendez2012). If VAAs shape voters’ understandings of where they stand in the policy space and which parties or candidates are closest to them, then this creates a strong ethical obligation for VAA developers to follow best practices in VAA design.
Supplementary material
The supplementary material for this article can be found at https://doi.org/10.1017/S1475676526101753.
Data availability statement
All data and statistical code necessary for replicating the analyses reported in this paper can be accessed in the Harvard Dataverse at https://doi.org/10.7910/DVN/L8TTA9.
Acknowledgements
We would like to thank Jonathan Wheatley, Matthew Wall, Susan Banducci, Ailsa Henderson, Fraser McMillan, Roula Nezi, Ed Poole, Vasiliki Triga, and Richard Wyn Jones for their help with the development of WhoGetsMyVote. For excellent research assistance, we would like to thank Helen Bramah, Louis Bromfield, Keiron Burgess, Lucija Cepo, Sean Garrett, Tom Gibson, Danielle Joyce, Ellen Kear, Bella Longdon, Megan Salter, Ryan Whitehead, and Eva Whyte. Earlier versions of this paper were presented at the 2025 ECPR General Conference and research seminars and workshops at the University of Bath, the University of Southampton, and the University of Zurich.
Funding statement
This research was supported by the Economic and Social Research Council (grant numbers: ESRCIAA-FF018 and ES/W000598/1).
Competing interests
We do not have any conflict of interest.
Ethical standards
Study 1 was approved by the University of Bath’s Data & Digital Science Research Ethics Committee (reference number: 4749-4847). Study 2 was approved by Oxford Brookes University’s Research Ethics Committee (reference number: L19183).
Use of AI
We did not use generative AI in the preparation of this research.

 §
 §

 §
 §
 §

 §


 Open access

